

Abstract
Complex visual scenes require that a target for an impending saccadic eye movement be selected from a larger number of possible targets. We investigated whether changing the probability that a visual stimulus would be selected as the target for a saccade altered activity of monkey superior colliculus (SC) neurons in two experiments. First, we changed the number of possible targets on each trial. Second, we kept the visual display constant and presented a single saccade target repeatedly so that target probability was established over time. Buildup neurons in the SC, those with delay period activity, showed a consistent reduction in activity as the probability of the saccade decreased, independent of the visual stimulus configuration. Other SC neurons, fixation and burst, were largely unaffected by the changes in saccade target probability. Because we had monkeys making saccades to many locations within the visual field, we could examine activity associated with saccades outside of the movement field of neurons. We found the activity of buildup neurons to be similar across the SC, before the target was identified, and reduced when the number of possible targets increased. The results of our experiments are consistent with a role for this activity in establishing a motor set. We found, consistent with this interpretation, that the activity of these neurons was predictive of the latency of a saccadic eye movement and not other saccade parameters such as end point or peak velocity.
Keywords: monkey, saccade, motor set, target selection, decision, buildup neurons
Saccadic eye movements rapidly shift the line of sight from one region of the visual field to another, typically to direct the fovea toward objects of interest. Experiments probing the neurophysiology of visually guided saccades traditionally involved brief presentations of visual stimuli cueing when and where a saccade should be made. Combining these tasks with single neuron recordings identified many areas with neuronal activity linked to the visual stimulus presentation as well as to saccade generation. More recently, tasks in which delays are imposed between the visual stimulus and the saccade reveal that neurons in many areas of the brain related to saccades also have activity in the delay period (for summaries, seeHikosaka and Wurtz, 1989; Andersen et al., 1997; Schall, 1997). In cortical skeletal motor areas, the delay period activity is frequently interpreted as reflecting aspects of motor set, a behavioral state related to the preparedness to make a particular movement (Evarts et al., 1984). Motor set may in turn consist of events including attention, target and response selection, and movement preparation (Wise, 1985).
Delay period activity is prominent in many superior colliculus (SC) neurons, a critical structure relaying cortical signals to the brainstem. Previous experiments identified at least three aspects of motor set reflected by the delay activity of SC intermediate layer neurons that discharge before saccades. First, Glimcher and Sparks (1992) recorded from neurons they referred to as prelude burst neurons and concluded that the long lead activity represented the selection of a saccade, required information about the metrics of the impending saccade, but was not involved in the initiation of the saccade per se (see also Glimcher and Sparks, 1993). Second, Kustov and Robinson (1996) showed that buildup neurons, which also have a long lead activity, also increased their activity after the target was identified, and they suggested this increase was related to attention (see also Kojima et al., 1996). Third, Munoz and Wurtz (1995) found that the buildup neurons changed their long lead activity before one of two targets was identified and suggested that the activity reflected saccade preparation. Most recently, Basso and Wurtz (1997) demonstrated that the activity before a saccade target was identified was greatly reduced if multiple possible saccade targets were presented. Specifically, if the monkeys could be certain about which saccade was to be made, the delay activity was high; if not, the activity was much reduced.
Our recent findings are consistent with interpreting the delay period activity of SC buildup neurons as related to motor set, but a number of key questions remain that we address in the present report. We reported previously only changes in activity for saccades to targets in the movement field of the neurons, but because saccades were made to targets located adjacent and opposite the movement field in our task, we could compare the magnitude of activity associated with saccades throughout the visual field. We found that the delay period activity was similar across the SC until the saccade target was identified and that this activity was then systematically reduced as the number of possible targets increased. Examination of the activity of other SC neuronal elements, the fixation and burst neurons, showed that their activity was relatively unaffected by changes in target probability. Finally, because we hypothesized that the change in neuronal activity was related to a change in motor set, we predicted that a change in neuronal activity should be accompanied by a concomitant change in saccade latency. Thus, we compared changes in saccade latency with the activity of buildup neurons and found that significantly shorter saccadic latencies occurred during periods in which there was significantly higher buildup neuron activity.
MATERIALS AND METHODS
Physiological procedures. Two monkeys were prepared for chronic electrophysiological recording of single neurons and eye movements. Anesthesia was induced initially with an intramuscular injection of Ketamine (10.0 mg/kg), valium (1.0 mg/kg), and glycopyrrolate (0.01 mg/kg). Monkeys were intubated and maintained at a general anesthetic level with isofluorane. A subconjunctival eye coil was implanted (Judge et al., 1980). A plastic head holder for restraint and a chamber for microelectrode recording were secured to the top of the exposed skull with titanium screws and dental acrylic. This hardware allowed subsequent magnetic resonance images to be obtained. The 20 mm trephine hole and overlying recording chamber were placed stereotaxically on the midline and angled 38° back so that the electrode penetrations were directed caudorostral, toward the SC. At the end of surgery and 1 d after surgery, animals were given Banamine at 2.0 mg/kg for analgesia. An antibiotic (polyflex) was given 1 d before surgery and every other day for 14 d after surgery. Monkeys recovered for 1 week before behavioral and physiological recording commenced. All protocols were approved by the Institute Animal Care and Use Committee and complied with the Public Health Service policy on the humane care and use of laboratory animals.
Single neurons were recorded with tungsten microelectrodes (Frederick Haer) with impedances between 0.7 and 1.5 MΩ measured at 1 kHz. Electrodes were aimed toward the SC through stainless steel guide tubes held in place by a delrin grid that was secured to the recording chamber (Crist et al., 1988). Action potential waveforms from individual neurons were identified with a window discriminator that returned a pulse for each waveform that met both time and amplitude criteria. The time of occurrence of each action potential was stored with 1 msec resolution.
Behavioral procedures. All behavioral paradigms and the storage of data were presented and acquired on a 486 personal computer running a QNX-based real time experimentation data acquisition system (REX) (Hays et al., 1982). During experiments, monkeys were seated in an adjustable primate chair facing a tangent screen with their head restrained for the duration of the experiment (3–5 hr). The visual display on the screen was rear projected by a television (TV) projector onto a tangent screen that was located 57 cm in front of the monkeys. An additional light-emitting diode used for a centrally located fixation point was controlled by a computer that drovex–y mirror galvanometers (General Scanning). Eye movements were recorded using the magnetic search coil technique (Fuchs and Robinson, 1966), and horizontal and vertical eye position signals were sampled at 1 kHz. An interactive computer program was used to calculate saccade metrics, dynamics, and latencies. Saccades were detected using velocity (10–25°/sec) and acceleration (500–800°/sec2) criteria.
Two TV projectors were used, an Electrohome ECP 4000 that used three cathode ray tubes to project the image and a Sharp 850 that projected an image using a liquid crystal display. Both were running at 60 Hz frame rates. The projector was synchronized to our computer by the vertical retrace signal; however, in the liquid crystal display projector, there was a phase lag in the onset of the projected image that varied between 0 and 16 msec. There was also a fixed delay of 4 msec. The sum of the mean phase lag and the fixed delay resulted in a mean stimulus onset delay of 12 msec. Because we were not measuring or reporting visual latencies, and because the time periods over which we counted neuronal activity were at least 150 msec long and started in relation to the earliest time of image onset, this variability did not affect our quantification. We confirmed this by recomputing some intervals (see Fig. 4) using the burst onset times determined by a Poisson algorithm (Hanes et al., 1995). Saccadic latencies were measured from the offset of the fixation point (light-emitting diode) and so were unaffected by delays in the TV display.
Fig. 4.

The average firing rate for the 40 neurons in each of the four target probability conditions during the visual interval is plotted. The visual interval was divided into two intervals, an initial 50 msec (black bars) and a later 100 msec (gray bars). The initial 50 msec interval was measured with respect to the onset of the burst for each individual neuron using a Poisson burst detection algorithm (Hanes et al., 1995). Both components of the initial response time locked to the onset of the visual stimulus showed a decrement in activity with increased target probability.
Neurons were initially studied while monkeys performed a memory-guided saccade task (Hikosaka and Wurtz, 1983). In this task, a centrally located fixation point appeared, and the monkeys were required to maintain fixation of this spot within an electronic window of 2°. A peripherally located spot was presented for 200 msec while the monkeys maintained fixation. After a delay of 200–800 msec, the fixation point was removed, and the monkeys made a saccade to the location of the previously flashed target spot. We determined the general characteristics of the neuronal activity and an estimate of the center of the movement field by requiring monkeys to make saccades to different locations in the visual field. During all experiments, monkeys were rewarded with a drop of fruit juice or water. Monkeys worked daily until satiated and were given supplemental fluid as required. The monkeys’ weight was monitored daily, and they remained under the supervision of the institute veterinarian.
Target probability tasks. Two tasks were used to determine the effect of target probability on the activity of SC neuronal activity, a multi-target task and a blocked-mixed task.
In the multi-target task (Fig.1A), our goal was to separate the sequence of events leading up to saccade generation, while varying the probability that a given stimulus would become a saccade target. First, a centrally located fixation point (light-emitting diode) came on, and the monkeys were required to look at it for 1 sec to initiate the trial. Second, one, two, four, or eight spots of light came on (TV projector) for a randomized time ranging from 800–1200 msec, and these trial types were randomly interleaved. This was the period of pre-selection because which of the spots would become the target was unknown to the monkeys. One of these possible targets was always located at the position in the visual field that yielded the maximal saccade-related activity of the neuron. All other possible targets were placed equally eccentric but in different directions (in the four cardinal and four oblique directions). The eccentricities ranged from 3 to 25°, with most being ∼10°. Third, one of the possible targets dimmed for 800–1200 msec. This was the period of selection because the dimming indicated which of the spots was the target for the saccade. The final period of saccade initiation began when the fixation point went off (go signal), which required the monkeys to make a saccade within 500 msec to the dimmed target. Monkeys were required to maintain their eye position at the target for 300–500 msec to obtain liquid reward. The task had a clear target change so that it was essentially a pop-out task (Bravo and Nakayama, 1992), requiring only target detection and not discrimination (Treisman and Gelade, 1980).
Fig. 1.

A, Multi-target task. Along the top, the bars labeled “fixation,” “array on,” and “target dim” depict the temporal sequence of the multi-target task. The line below labeled “Eye” is a schematic of a representative eye position trace in this task. The lower portion of the figure depicts the spatial arrangement of the trial types. The large boxes are a schematic of the tangent screen. Thecross represents the fixation point, and the surroundingbox represents the criterion window for the monkeys to maintain eye position for correct task performance. Each of these trial types was randomly interleaved. As the number of possible targets (filled circles) increased, the probability that any one of them would be identified as the saccade target decreased. The fixation period began with the onset of a fixation point, followed by the pre-selection period when the array of possible stimuli came on. The selection period was the time when the target dimmed, and the initiation period was the time when the monkeys were given a cue to initiate the saccade, in this case, when the fixation point was removed. The temporal separation of events allowed the neuronal activity associated with each event to be dissociated.B, The blocked-mixed task. Along the top, the labeled bars indicate the temporal sequence of events in the task. Mixed target trials were those in which the saccade target was selected randomly on each trial from the eight stimuli. The blocked target trials were those in which the saccade target was always the one located in the movement field of the recorded neuron. Note that the time the target dimmed and the time the fixation point was removed occurred simultaneously, allowing the saccade to be initiated as soon as the target was selected.
In the first 32 neurons studied, we used a version of the task that had periods randomized among 200 and 400 msec rather than the longer 800–1200 msec periods and included only two, four, or eight possible targets. For most of these neurons, the single-target condition was performed separately in blocks. Qualitatively, there were no differences between the behavior of the neurons in the versions of the task with the short or long periods, but because of the different times, we analyzed the data separately.
The multi-target task provided an overt change in target probability by varying the number of possible targets, but the change in number also changed the visual stimulus to which a neuron was exposed. Therefore, we designed a second task, the blocked-mixed task, to change the target probability while keeping the visual display constant. In this task, we recorded 32 additional neurons, and for 19 of these, we also recorded them in the multi-target task.
In the blocked-mixed task (Fig. 1B), the acquisition of the fixation point initiated a trial, and then the same array of eight visual stimuli appeared. In separate sets of trials, either the same stimulus repeatedly dimmed to indicate that it was the target on every trial (blocked target trials, maximum probability), or any one of the eight possible targets dimmed, indicating it was the saccade target (mixed target trials, minimum probability). This task had an advantage over the multi-target task because the visual display was identical in both the mixed and blocked conditions. The only variable that changed was the probability that the movement field stimulus would serve as the saccade target. Moreover, the change in probability was based on experience with the preceding trials. We modified the timing of this task slightly from the multi-target task in that the go signal and the identification of the target occurred simultaneously. In this way, we could measure the latency of the saccade as soon as monkeys selected the target and initiated the saccade.
Neuronal classification. To compare the effect of the multi-target task across neurons with similar responses, we classified them as buildup, burst, or fixation neurons. Buildup neurons had a significant delay period activity between the stimulus onset and the saccade initiation. We classified a neuron as buildup if there was a significant difference in activity between a baseline interval (100–200 msec before the target appeared) and the interval before the signal to make the saccade [100–200 msec before the fixation point was removed (see Dorris et al., 1997)]. A significant difference (Wilcoxon signed-rank test, p < 0.05) was required in either the single target condition of our task (visually guided saccade) or in the task we used to determine neuronal characteristics (memory-guided saccade task). We also required that neurons discharge at least 30 spikes/sec in the 100 msec interval before the saccade (Munoz and Wurtz, 1995). Neurons that failed to reach these two criteria were classified as burst neurons. For all but three neurons, the significance criterion alone was sufficient. Neurons that paused for saccades of at least 10° amplitude were classified as fixation neurons (Munoz and Wurtz, 1993).
Data analysis. In addition to standard descriptive statistics, we used two nonparametric statistical procedures. When we compared more than two levels of a variable, we used ANOVA. When we compared only two levels of a variable, we used the Wilcoxon signed-rank test. For multiple group comparisons, such as those in the multi-target task, we used the Friedman one-way, repeated-measures ANOVA with Dunnett’s method for post hoc pairwise comparisons. We compared the mean level of discharge for the neurons in the one, two, four, and eight possible target conditions. We did this separately for successive time intervals in the task. For example, to analyze the visual response of neurons in the task, we performed a one-way ANOVA with four levels, namely, one possible target condition, two possible target condition, four possible target condition, and eight possible target condition. When a main effect was obtained, we performed the pairwise comparisons using Dunnett’s method to determine which pair contributed to the significant difference. For those analyses consisting of only two groups, such as those in the blocked-mixed task, we performed the Wilcoxon signed-rank test. For example, using the visual response data from the blocked- and mixed-target conditions, the Wilcoxon signed-rank test compared the difference in the activity in these two conditions.
RESULTS
We recorded from 141 SC neurons and classified each as a buildup, burst, or fixation neuron (see Materials and Methods). After classification using the memory-guided saccade task and the single-target saccade task, we estimated the center of the movement field by on-line identification of the saccade direction and amplitude that yielded maximal activity from each neuron. We tested a subset of the neurons on the multi-target task and a subset on the blocked-mixed task.
Multi-target task: buildup neurons
Movement field target
Buildup neurons (n = 72) had a significant delay period activity and frequently a burst of action potentials associated with the preferred saccade. When presented with a single possible saccadic target in the movement field contralateral to the SC in which the neuron was recorded, buildup neurons frequently had an initial phasic response (Fig.2A, pre-selection). This was followed by delay period activity that was maintained through the time when the stimulus dimmed (Fig. 2A, selection) and until the fixation point was removed indicating that the saccade should be made. Then, a burst of action potentials preceded the saccade into the movement field (Fig. 2A, right column).
Fig. 2.

Decreased target probability reduced buildup neuron activity. The events of the task are indicated by the labeled periods across the top, and the spatial arrangement is indicated by the schematic of the tangent screen as drawn in Figure 1. The eye position trace is a schematic. This example is from trials when the stimulus that fell in the movement field of the neuron was identified as the target. The left columnshows rasters and the average spike density function for five trials during the pre-selection period when one (A), two (B), four (C), or eight (D) possible targets were presented. Thearrowheads and the vertical dashed linesindicate the alignment of the traces. The left column is aligned on the onset of the possible targets, and themiddle column is aligned on the beginning of the selection period, when one of the stimuli dimmed. Both the initial visual and the delay period responses decreased as the number of stimuli increased. Activity increased after the stimulus in the movement field dimmed, indicating it was the target (dashed vertical line in the middle column). Theright column is aligned on the onset of the saccade, the initiation period. This neuron had a burst of action potentials associated with the onset of the saccade that did not differ between the probability conditions.
When the number of targets increased, and hence the target probability decreased, the level of activity in the buildup neuron decreased (Fig.2B–D). For example, in the four possible target case, both the initial phasic response and the delay period activity in the pre-selection period decreased compared with that in the one target case (Fig. 2A,C, pre-selection). After the stimulus in the movement field dimmed, indicating it was the target, this neuron had an increase in activity (Fig. 2, selection) that continued until the go signal was presented. This maintained level of activity after the target dimmed varied little as the number of stimuli increased. The saccade-related burst also did not differ in amplitude between the one, two, four, or eight possible target conditions (Fig. 2, right column).
The pattern of activity correlating with increasing the number of possible targets was a decrease in the visual response and the delay activity in the pre-selection period and no change in the selection and saccade initiation periods. We saw this pattern of activity to varying degrees in all 72 buildup neurons recorded even when the amount of buildup activity varied. To demonstrate the consistency for the sample of 40 buildup neurons recorded in the task with the long time periods (800–1200 msec; see Materials and Methods), we averaged the 40 individual neuronal spike density functions in the successive task periods (Fig. 3). A clear decline in the visual response and the delay activity is evident as the number of stimuli increased from one to eight. The sample also reflects the lack of difference in activity after the target dimmed and at the time of the saccade, as the number of stimuli increased. Note, however, that the curves do not overlap until nearly 100 msec after the target is identified (Fig. 3, vertical line), perhaps reflecting the change related to the time needed for target selection.
Fig. 3.

The activity across the sample of buildup neurons showed a reduction of activity with decreased target probability. Thetraces show the mean spike density function of the 40 neurons for each target probability condition when the target was in the center of the movement field of each neuron. The alignments are identical to that in Figure 2. Black bars indicate a statistically significant difference between the conditions for the measurement intervals. Gray bars indicate no significant difference. The visual interval was the first 150 msec after the minimal visual latency of SC neurons of 50 msec (Goldberg and Wurtz, 1972a). The early pre-selection interval was 150 msec after the visual interval. The late pre-selection interval was the 200 msec before the target dimmed, and the early pre-selection interval was the 200 msec after the target dimmed. The late selection interval was the 100 msec before the fixation point was extinguished. The initiation interval was the 100 msec before the saccade began.
To compare the activity of the sample of 40 buildup neurons further, we divided the three periods of the task into six intervals: visual, early and late pre-selection, early and late selection, and initiation (see Fig. 3 legend). The ANOVA comparing the neural activity in the different intervals for the different target conditions across the sample of 40 neurons revealed significant differences in activity, with decreases in probability from one possible target to eight possible targets. We found this for the visual response (p < 0.001), the early pre-selection activity (p < 0.005), and the late pre-selection activity (p < 0.001). Changes in the number of possible targets did not alter the activity in the early selection (p = 0.98), the late selection (p = 0.90), or the initiation (p = 0.98) intervals. When we compared the activity between the two and eight possible target conditions for the 32 neurons recorded in the version of the task with the short periods (see Materials and Methods), the result was significant and mirrored the result of the analysis of the data collected in the version of the task with the long periods (visual, p < 0.001; pre-selection, p < 0.001; selection, p= 0.06; and initiation, p = 0.52).
To determine whether individual stimulus conditions differed from one another, we performed post hoc pairwise comparisons of the data for the 40 neurons. In the pre-selection period, all target probability conditions, one versus eight, two versus eight, and four versus eight, differed significantly (p < 0.05). The same trend was found for the 32 neurons; two versus eight and four versus eight differed significantly (p< 0.05). Because the single target condition was performed in separate blocks for most of the neurons, those data were not included in the analysis. We will concentrate further quantification on the data collected in the version of the task with the long periods.
In sum, reduced levels of target probability reduced the activity of buildup neurons only during the period of pre-selection, before the availability of information about the target for selection by the saccadic system. Neither the activity after the identification of the target nor the activity associated with the initiation of the saccade was affected by the change in the number of possible targets.
Pre-selection period activity
In some visual responses, such as those in Figure 2, there were two phases. It is possible that these two phases of activity are different kinds of responses and our relatively long 150 msec interval obscured them. Also, they may be affected differently by the target probability conditions. We tested to see whether these two phases were different from each other and whether they had a differential dependence on the number of possible targets. Because there was some variability in the onset of the visual response across neurons, we identified the burst onset using the Poisson spike train analysis method developed by Hanes et al. (1995) for each individual neuron. We divided the subsequent 150 msec visual interval into two intervals, a first 50 msec after the burst onset that always included the initial peak and a second 100 msec. We did this for each target condition. The mean firing rate in the first 50 msec and the subsequent 100 msec both decreased as the number of targets increased (Fig.4). Both intervals were significantly different in all of the target probability conditions (p < 0.01). The first 50 msec after the onset of the burst was also consistently larger than the subsequent 100 msec interval of activity, and an ANOVA revealed that the two components were significantly different from one another in all of the target probability conditions (Fig. 4; p < 0.01). Thus, although there seemed to be two phases of the initial visual response, both were affected similarly by the changes in the number of possible targets.
Another issue is the cause of the mean decrease of activity in the pre-selection period with increasing numbers of possible targets. There are two possibilities. The first is that the neurons had a decreased level of activity on every trial as the number of possible targets increased, yielding a reduced mean level of activity. The consistent reduction in activity as the number of possible targets increased (Fig.2) is consistent with this alternative, as is our qualitative evaluation of the response of other neurons. A second possibility, however, is that with the increasing number of possible targets, the monkeys shifted resources from one target on one trial to another target on another trial. The mean would decrease because the amount of activity on any given trial was less as the number of possible targets increased.
These two possibilities can be quantitatively distinguished for the sample of neurons by comparing the measures of dispersion in the different target conditions. For example, in the eight possible target condition if the activity is fluctuating between one and the other seven trials and in the one possible target condition it is not, the SDs should be very different. To examine this, we first calculated the SDs for each possible target condition one to eight. To compare across conditions, we normalized the SDs to zscores. Using ANOVAs, we compared the z scores for the different target probability conditions and all measurement intervals. Confirming our qualitative impression, no significant differences were obtained across the target probability conditions in any interval (visual, p = 1.0; early pre-selection,p = 0.99; late pre-selection, p = 0.72; early selection, p = 0.58; late selection,p = 0.98; and initiation, p = 0.89). Thus, the mean reduction in activity of buildup neurons with decreased target probability results from decreases across all trials and not from a sporadic trial-to-trial reduction.
Eight possible target condition
Up to this point we have described buildup neuron activity on trials when the stimulus that became the target on that trial was in the movement field of the neuron. For stimulus configurations with two, four, or eight stimuli, monkeys also made saccades to all of the other stimuli on trials in which they were the target. To examine the activity of buildup neurons when saccade targets were located outside of the movement field of the recorded neuron, we focused on the eight possible target condition (Fig. 5). The phasic visual response that occurred during the pre-selection period was identical regardless of which stimulus would later be randomly identified as the target for the saccade (Fig. 5, leftmost plot in each of the eight sets of plots). Similarly, the buildup activity was the same during the rest of the pre-selection period (Fig. 5, first one-half of middle plots). It was not until the target was identified that the activity dramatically increased when the target was in the movement field (Fig. 5,second one-half of the middle plot, 0° target location) and frequently did not change when the target was outside the movement field (Fig. 5, second one-half of middle plots). And finally, the burst of activity before a saccade depended on the selection of the saccade target in the movement field of the neuron (Fig. 5, rightmost plots, around the 0° location).
Fig. 5.

Activity of a buildup neuron during the presentation of all eight targets. Each trace in each of the eight sets of three plots is aligned on the same events described in the Figure 2 legend. The leftmost plots are aligned on stimulus onset, the middle plots are aligned on target dimming, and the rightmost plots are aligned on saccade onset. Each set of threeplots is in the location where the target appeared on the screen. The movement field is rotated so that the center is in the 0° location.
For our sample of 40 neurons, we compared the selectivity of three different intervals of activity. The three intervals we quantified included the visual response, the activity around the time the target dimmed, and the activity before the saccade for the different target directions (Fig. 6). We computed a simple index for each interval. We calculated a visual index by taking the difference between the visual response and the baseline and dividing it by the sum of the two (Fig. 6A). Activity during the visual interval differed neither for the two individual neurons shown nor across the sample for any of the target locations.
Fig. 6.
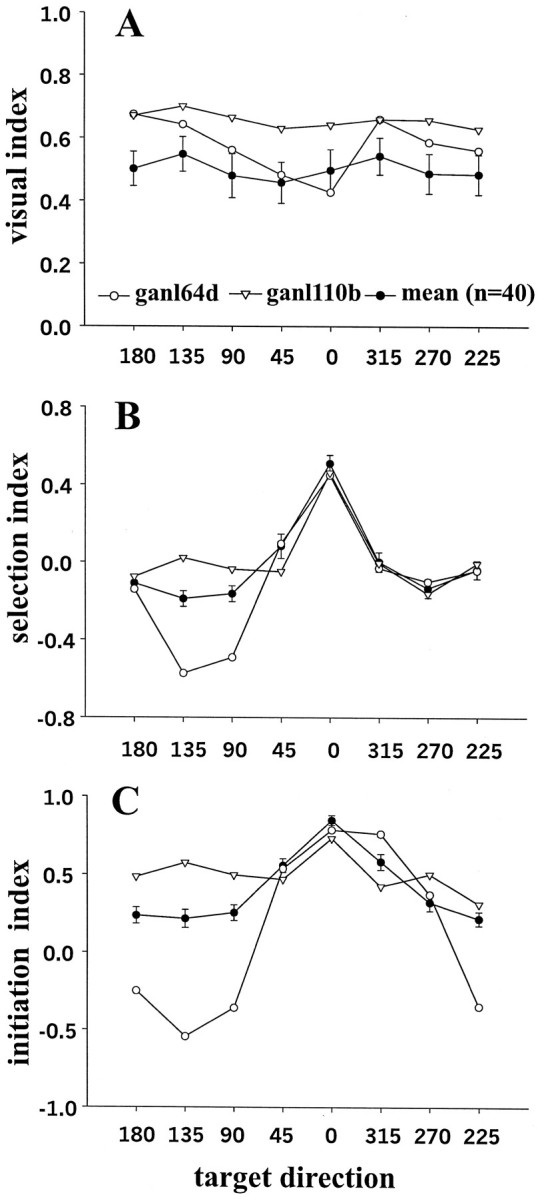
Selectivity indices for the sample of 40 buildup neurons. Neural activity is plotted as a function of target direction. The center of the movement field is normalized to the 0° location for all the neurons. A, The visual index shows the neural activity during the visual interval (150 msec after a visual latency of 50 msec) minus 200 msec of baseline neural activity (during the fixation interval before the stimuli appeared) divided by the sum of the two activities. B, The selection index is the neural activity 400 msec after the target dimmed minus the neural activity 400 msec before the target dimmed divided by the sum of both activities.C, The initiation index is the neural activity 100 msec before the onset of the saccade (initiation interval) minus the 200 msec of baseline activity divided by the sum of the two activities. Shown are the results from two example neurons (▿ and ○) as well as the result for the mean (•). The neuron indicated by the (○) shows an inhibition of activity for adjacent targets after the target dimmed as well as just before the saccade.
We calculated a selectivity index around the time of presumed target selection by taking the difference between the activity after the target dimmed and the activity before the target dimmed and dividing it by the sum of the two (Fig. 6B). Some neurons showed a dramatic decrease in activity when a target adjacent to the one centered on the movement field was identified for selection (Fig.6B, ○); others did not (Fig. 6B, ▿). Across the sample (Fig. 6B, •), there was very little decline in activity for nontarget locations but rather an increase at the target location.
We calculated a presaccadic neuronal activity index by taking the difference between the baseline activity and the activity before the saccade onset and dividing it by the sum of the two (Fig.6C). Some neurons were tuned only for the target located at the 0° location (Fig. 6C, ▿). Others had broader tuning with activity before saccades made 45° in either direction from the center of the movement field (Fig. 6C, ○). Moreover, the activity of this neuron with broad tuning was inhibited by targets located opposite the movement field. The activity of this neuron is reminiscent of the flanking inhibition reported for the presaccadic activity of frontal eye field neurons (Schall and Hanes, 1993; Schall et al., 1995). Neurons with this broad tuning were the most common as revealed by the mean directional tuning of the sample of 40 neurons (Fig. 6C, •).
Thus, when we looked at the buildup activity related to all possible targets, we saw a consistent pattern related to the demands of the task. With eight possible targets, buildup neuron activity was present but low, consistent with the reduced probability of a saccade into the movement field. When the probability became high, when the target dimmed, the activity increased. Although some neurons decreased activity for targets outside of their movement fields, across the sample, buildup neuron activity typically was maintained when targets outside the movement field were indicated.
Contralateral and ipsilateral targets
Among the eight target positions used in each experiment, two are particularly interesting. One is the target falling in the contralateral visual field (in the movement field of the neuron). The second is the target in the ipsilateral field that is symmetrical, across the vertical meridian, to that in the movement field. Activity associated with saccades made to the symmetrically located target can be used to infer what SC activity there is on the other side of the brain. This inference is valid if we assume that the activity of buildup neurons on the two sides of the SC is the same; that is, both SCs are activated with saccades to their contralateral field (their preferred direction) but not with saccades to their ipsilateral field (their null direction). Thus, when a saccade is made in the preferred direction of a neuron being recorded, the neurons in the other SC are discharging with that same saccade in their null direction. We therefore used the activity of neurons for trials in which the saccades were away from the movement field as indicative of activity in the SC we were not recording. This assumption is similar to that of “anti-neurons” in other analyses, (eg., Britten et al., 1992;Thompson et al., 1996). We compared this with the activity of the same neuron before saccades made toward the movement field as the measure of activity in the SC from which we were recording. We made these comparisons for the two and eight target conditions. Doing so allowed us to estimate the activity in the SC on both sides of the brain but was limited to the two symmetrical locations.
Our comparison was made by plotting the mean and SE of the firing rate across our sample of 40 neurons for all the trials either toward the movement field or away from the movement field when two stimuli were presented on each trial (Fig.7A). During the pre-selection period, the neuronal activity was the same regardless of which stimulus would later become the target (Fig. 7A, pre-selection). This indicated that the activity in the SC on both sides of the brain was relatively high. At the time the target dimmed, the mean neuronal activity increased for the SC neurons with the target in the movement field. The mean activity remained largely unchanged for the neuron in the other SC. Some individual neurons, however, did change after the target dimmed (data not shown). A few (5/40) reduced activity immediately when the stimulus opposite the movement field became the target. Others (9/40) did not decline at all until after the saccade ended. Most neurons (25/40) behaved somewhere in between the extremes, not declining immediately after the identification of the target but, rather, declining perisaccadically as indicated by the mean response. Thus, the activity inferred to occur in the two sides of the SC was a high level of activity throughout both SCs before target identification and an increase at the time of target identification in the movement field.
Fig. 7.

Comparison of neuronal activity related to a target in the movement field and in the opposite visual field. Theplot shows the mean (black lines) and the unidirectional SE (gray shading) of the neuronal activity for the sample of 40 neurons. The arrangement and alignments are the same as in Figure 3. A, Thetraces from the two possible target condition trials in which the stimulus in the movement field was identified as the saccade target and in which the stimulus in the ipsilateral visual field was the saccade target are superimposed. B, The same conditions described in A apply except the trials are from the eight possible target condition. The black barsunder the plots indicate statistically significant differences in the intervals of activity between the movement field and opposite target trials. The gray bars indicate a lack of statistical significance. The horizontal dotted reference line in A and B indicates the mean activity in the late pre-selection interval in the two possible target condition (27 sp/sec). The reference line shows that the activity after the target dimmed in the movement field was virtually identical in the two and eight possible target conditions and that the neurons did not reduce their activity after the opposite target was identified for selection.
We saw the same sequence of changes when one of eight possible stimuli became the saccade target, but with two prominent differences (Fig.7B). First, in the pre-selection period, the activity was lower in both sides of the SC than when only two targets were present. Second, after the target dimmed, the increase in activity was greater for the neuron in whose movement field the target fell than was the case with two targets. This was not because the peak activity after the target dimmed was higher but, rather, because the activity before the selection was lower (Fig. 7).
For the two possible target condition, the difference between the activity when the target was in the movement field and that when the target was opposite the movement field was not statistically significant in the visual (p = 0.75), early pre-selection (p = 0.22), or late pre-selection (p = 0.49) intervals (Fig. 7, gray bars). The visual (p = 0.11), early pre-selection (p = 0.23), and late pre-selection (p = 0.88) intervals in the eight possible target condition also failed to reach significance. Differences between the neuronal activity for trials in the two possible target condition were found for the early selection (p < 0.001), late selection (p < 0.001), and initiation (p < 0.001) intervals (Fig. 7, black bars). Similarly, in the eight possible target condition, the intervals early selection (p < 0.001), late selection (p < 0.001), and initiation (p < 0.001) were significantly different.
In sum, this analysis revealed differences in the two SCs that were a result of the probability of a given stimulus becoming the target for the next saccade. Before the identification of the saccade target, activity was lower in both SCs when there were many stimuli rather than just a few. As a consequence of this difference, the change in activity after the target was identified in the movement field was greater in the SC when the target was identified from among many stimuli rather than from among only a few.
Burst and fixation neurons
In contrast to buildup neurons, burst neurons had no significant activity during the delay period of the memory or visually guided saccade tasks but had a robust and discrete burst of action potentials associated with the onset of the preferred saccade. We recorded from 12 burst neurons in the task with the long-time periods. We plotted the mean spike density function for the sample of burst neurons in the different target probability conditions and superimposed them (Fig.8). To the extent that burst neurons had some activity other than the presaccadic burst, that activity was modulated by the change in target probability. For example, frequently there was a phasic visual response to the stimulus onset that decreased in the low probability condition (Fig. 8, pre-selection). Likewise, there was a phasic response of some burst neurons after the target dimmed that was reduced in the eight possible target condition (Fig. 8, selection). There were no differences in the presaccadic burst across probability conditions (Fig. 8, right column). Thus, if burst neurons had activity in the pre-selection period, it was decreased with decreased probability.
Fig. 8.

Burst neurons and saccade target probability.A, The arrangement and alignment of this figure are the same as in Figure 3. The mean spike density function of the 12 burst neurons in each target condition is plotted. Black bars indicate a statistically significant difference between the conditions for the different intervals. Gray barsindicate no significant difference. The quantification intervals are the same as in Figure 3.
We quantified the activity of the burst neurons in the intervals of the task. The visual interval activity was significantly different between the target conditions (p < 0.001), as were all the pairwise comparisons of one versus eight (p< 0.05), two versus eight (p < 0.05), and four versus eight (p < 0.05) target conditions. There was a statistically significant difference in the activity during the late pre-selection interval (p < 0.001) and for the early selection interval (p < 0.03). Differences in activity in the other intervals failed to reach significance (early pre-selection, p = 0.25; late selection, p = 0.95). Like the saccade-related burst of buildup neurons, the saccade-related burst of burst neurons did not differ between the different possible target conditions (p = 0.67). Because burst neurons only had activity for saccades made to their preferred location in the visual field, the response (or lack thereof) when targets presented in the opposite hemifield is not shown.
Fixation neurons in the rostral pole of the SC (n = 25) showed discharge during fixation and paused for saccades of 10° amplitude. In the 25 fixation neurons from which we recorded, there were no statistically significant differences between the one and eight possible target conditions in any of the intervals (visual,p = 0.67; early pre-selection, p = 0.16; late pre-selection, p = 0.65; early selection,p = 0.06; late selection, p = 0.63; and initiation, p = 0.65; data not shown). This was true for the trials in which either the target ipsilateral or contralateral to the recording SC was identified as the target for the upcoming saccade.
In 9 of the 25 fixation neurons, we tested whether they increased their activity in a trial type that required the suppression of a saccadic eye movement or maintenance of fixation. To do so, we modified our task to include interleaved catch trials in the two, four, or eight possible target conditions. In these trials, the fixation point rather than one of the peripheral targets dimmed. This signal required the monkeys to maintain fixation rather than prepare a saccade, and we reasoned that this signal might be accompanied by an increase in fixation cell activity. We found no significant differences between the activity measured during the late pre-selection interval and the early selection interval (two possible targets, p = 0.06; four possible targets, p = 0.21; and eight possible targets,p = 0.11), consistent with a lack of selectivity for the dimmed fixation point. We did not test the fixation neurons with targets very close to the fixation point, which subsequent experiments (Krauzlis et al., 1997) have shown modulates the activity of these neurons.
Blocked-mixed target task: buildup neurons
We have described changes in the activity of SC neurons that resulted from changing target probability overtly, by altering the number of possible targets from which saccade selection occurred. However, this design also changed the visual stimulus configuration, which may have contributed to the change in neuronal activity. Therefore, we tested the effect of target probability by manipulating it covertly. We did not change the visual stimulus configuration but rather changed the monkeys’ trial-by-trial experience with the identified target. In one condition of this experiment, there were still eight possible targets, but only one of them dimmed on every trial (blocked target trials). The probability that one stimulus would be the target was 100%. In the other condition, we presented the identical eight stimulus array, but any one of them could be the target, yielding a probability of 12.5% (mixed target trials).
We recorded the activity of 32 buildup neurons in the blocked-mixed task. As the monkey performed the mixed target trials in which any one of the eight possible targets could be identified for selection, the activity was low, consistent with the decreased probability (Fig.9A, first row). When the monkey performed the blocked target trials, in which one of the eight possible targets was repeatedly the target in many trials, the neuronal activity increased (Fig. 9A, second row). As the number of trials with the same saccade target increased, the activity of the neurons increased further. The increase in activity is indicated by comparing the first and last 20 trials in a series of 100 trials of the blocked target condition (Fig.9A, third row). Similar activity changes have been reported in premotor cortex neurons (di Pellegrino and Wise, 1993).
Fig. 9.

Comparison of the activity of buildup neurons in the blocked-mixed task (A) and the multi-target task (B). A, Comparison of the neuronal activity in the mixed- (first row) and blocked- (second two rows) target trials. The blocked target trials are divided into the first and last set of 20 trials in a series of 100 blocked trials. The spatial arrangement of this task is depicted to the left of the rasters and spike density functions. The effect of the changing target probability was evident in the pre-selection period in both the multi-target task (B) and the blocked-mixed task (A). Because in both tasks for the recording of these neurons the target dim and the fixation point offset occurred simultaneously, monkeys could initiate the saccade as soon as the target dimmed. Therefore, after the target identification, there remained some difference in activity between the blocked and mixed conditions. The activity in the late pre-selection period between the first 20/100 and the last 20/100 trials in the blocked condition suggests a reflection of the learning of the saccade goal by the monkeys. B, The neuronal activity in the multi-target task with one possible target presented, shown by the first row of rasters and spike density functions. The figure is arranged the same as Figure 3. Note that for the experiments comparing the multi-target and the blocked-mixed tasks, we modified the timing of the multi-target task so that the fixation point offset and the target dim occurred simultaneously, as they did in the blocked-mixed task. Thetraces are aligned on the array onset (first column), target dim and fixation point offset (middle column), and the saccade onset (last column). The vertical dashed linesand the arrowheads at the bottom of the figure indicate the alignment.
For 19 of our 32 neurons, we were able to maintain isolation long enough to also record the neurons while the monkeys performed the multi-target task. In these cases, the target dim and the fixation point removal also occurred simultaneously similar to that in the blocked-mixed task, so we could make direct comparisons between the activity in the two tasks. In the single target case, the neurons were very active, consistent with the high probability (Fig. 9B,first row). In the eight target case, buildup neurons decreased their activity relative to the single target case (Fig.9B, second row).
For the sample of 32 neurons, we compared the activity in the blocked and mixed trial conditions for the same intervals that we used previously and again plotted the mean spike density function and superimposed the means from the two conditions (Fig.10). Because of the clear differences between the first series and the last series of blocked target trials, we plotted and analyzed the data only for the last five blocked target trials and compared these with the mixed target trials (Fig.10A). The average firing rate of the sample of buildup neurons was greater in the last five blocked target trials than in the mixed target trials. Using the same measurement intervals used previously in the multi-target task, we quantified the difference in the two conditions. The differences between the last five blocked target trials and the mixed target trials were statistically significant for all pre-selection intervals (visual, p< 0.001; early pre-selection, p < 0.001; and late preselection, p < 0.001). The early selection interval was also significantly different (early selection, p < 0.001), in contrast to the result in this interval of the multi-target task. We think the significance in the early selection interval results from the temporal overlap of the selection and initiation periods in the blocked-mixed task, making the trials in this task shorter than those in the multi-target task. The initiation interval failed to reach statistical significance (initiation, p = 0.54).
Fig. 10.

Comparison of the activity of the buildup neurons in the blocked-mixed task conditions. A, The mean spike density function for each of the 32 neurons is plotted in each condition for the mixed target trials (dotted line) and the last five blocked target trials (solid line).B, The mean spike density function for each of the 32 neurons is plotted for the first five trials (dotted line) and the last five trials (solid line) in the blocked condition. Consistent with the change in the saccade latency, the activity of neurons was greater as the monkeys repeated the same saccade on every trial.
We also compared the differences between the first and last five blocked target trials in our sample of 32 neurons (Fig.10B). Again, the activity of the sample of neurons was higher later in the series of blocked target trials compared with that in the initial series of blocked target trials. There were no statistically significant differences between the first and last five blocked target trials in the visual interval (p= 0.97) or the early pre-selection interval (p = 0.55). However, during the late pre-selection interval, there was a statistically significant difference in activity between the first and last five trials of the blocked trial condition (p < 0.01), as was the early selection response (p < 0.01) consistent with the increase in saccade target probability. Interestingly, for the initiation interval, the neuronal activity was larger in the first five blocked target trials (median, 127.0 sp/sec) than in the last five blocked target trials (median, 110.0 sp/sec). The difference was statistically significant (p < 0.01) and is evident in the slightly higher rise of the saccade-related burst for the first five trials (Fig. 10B, dotted line). Changes in the saccade-related activity have been reported previously for visuomotor neurons in the SC when monkeys repeatedly made the same saccade (Ottes et al., 1987).
Thus, buildup neurons showed a decreased level of activity as the probability of a particular stimulus becoming a saccade target decreased. The change in activity was present whether the saccade target probability was manipulated overtly with changes in the number of possible stimuli or covertly by changing the past experience of the monkeys with a particular saccade target.
Saccade latency and metrics
In the blocked-mixed task, it is only an inference that the monkeys are actually using the probability information in the task. A simple way to assess the validity of this inference is to measure saccade latency. The prediction generated by a motor set hypothesis is that when the saccade target is highly probable, saccadic latency is shorter. Recall that the multi-target task was a simple reaction time task in that at the time the stimulus dimmed identifying the saccade target, the monkeys remained fixating until the central fixation point went off. We imposed this delay to dissociate the neuronal activity during the selection period from the activity in the initiation period. In the blocked-mixed task, however, we changed the timing so that the target was identified and the go signal occurred simultaneously, making this a choice reaction time task. Because of this, we could measure the latency of saccades as soon as the monkey selected the target and initiated the saccade. The differences in activity between the early and late trials in the blocked target trials prompted us to use the saccade latency in the last five blocked target trials for the comparisons.
In the mixed target trials, the mean latency was 266.21 msec (12.38 msec SE), and in the last five blocked target trials, the mean latency was 245.00 msec (9.18 msec SE). These differences were statistically significant (p < 0.01). Moreover, comparing the saccade latency in the first five blocked trials (mean = 271.73 msec; SE = 14.62 msec) with that in the last five target trials (mean = 245.00 msec; SE = 9.18 msec) yielded statistically significant differences across the sample (p < 0.01). Thus, consistent with the alterations in neuronal activity with changes in saccade target probability, changes in saccade latency were found concomitant with changes in the saccade target probability. Higher saccade target probability resulted in decreased saccade latency.
It is important to point out that although the changes in saccade latency occurred concomitant with changes in neuronal activity, no significant changes were measured in the metrics of the saccadic eye movements. For example, the end points of saccades made in the one possible target and the eight possible target conditions were not significantly different (p = 0.70). The saccade end points in the mixed target trials and in the last five blocked target trials were also not significantly different (p = 0.98). Likewise, no significant differences were observed for saccade end points in the first five blocked target trials and in the last five blocked target trials (p = 0.88). We compared peak velocities of the saccades made in the different conditions. The mean peak velocity in the single target condition was 455.17°/sec (SE = 28.77°/sec), whereas that in the eight possible target condition was 441.02°/sec (SE = 29.13°/sec). This difference failed to reach significance (p = 0.66). The mean peak velocity in the mixed condition was 524.95°/sec (SE = 30.06°/sec), whereas that in the last five blocked trials was 514.48°/sec (SE = 33.43°/sec). This difference also failed to reach significance (p = 0.70). Finally the mean peak velocity of the first five trials of the blocked condition was 510.80°/sec (SE = 35.01°/sec), and the mean in the last five trials was 514.48°/sec (SE = 33.43°/sec). This difference also was not statistically significant (p = 0.99).
Thus, we found that the higher probability of a stimulus becoming a saccadic target, the shorter the latency of a saccadic eye movement. This result is consistent with the higher activity we recorded in the buildup neurons. In contrast, the target probability did not result in other saccade changes such as peak velocity or variation in end point.
Effect of visual stimulus configuration
Comparison of the neuronal activity in the blocked target trials and the mixed target trials demonstrated that the effect of target probability could not have resulted from changes in the visual stimulus configuration alone. However, this result does not exclude the possibility that the visual stimulus configuration can contribute to the activity of buildup neurons. We recorded 19 of the 32 neurons in both the blocked-mixed task and the multi-target task and therefore could assess the contribution of the visual stimulus configuration to changes in the activity of buildup neurons. To do this, we compared the activity of the buildup neurons in the one target condition of the multi-target task, in which the probability of the target being identified was 100%, to that in the blocked condition of the blocked-mixed task, in which the target probability was also 100% (Fig. 11). If we assumed that the monkeys used the information accumulated on previous trials in the blocked condition, the only difference between these trial types was the visual stimulus configuration (one stimulus or eight stimuli).
Fig. 11.

Comparison of one and eight stimulus conditions when target probability was the same. The data from the 19 neurons recorded in both the multi-target task and the blocked-mixed task are plotted to compare activity in the single stimulus, single target condition with that in the eight stimuli, single target condition (see Results). A, The mean firing rate during the visual interval in the single target case is plotted against the mean firing rate in the blocked target. B, The same activity is plotted for the pre-selection interval data. C, The same is plotted for the initiation interval. In the visual interval, many neurons fell above the line, showing greater activity when only a single stimulus was present and indicating an effect of the stimulus display. Most neurons fell around the unity line in both the pre-selection and the initiation intervals.
We plotted the mean firing rate of the 19 neurons in the single target condition against the mean firing rate in the blocked target condition for three intervals: visual, pre-selection, and initiation (Fig. 11). Points that fell along the unity line in these plots indicated that there was no difference in the two conditions. Points that fell above the lines in the plots indicated that neuronal activity in the single target condition was greater than the activity in the blocked target condition. During the visual interval, most neurons had activity that was greater in the single target case than in the blocked target case (Fig. 11A; p < 0.01). During the pre-selection interval as well as the initiation interval, fewer neurons showed this trend (Fig.11B,C; p = 0.92 andp = 0.89). Thus, the initial visual response of buildup neurons was affected by the presence of other stimuli in the visual field, whereas the later delay period activity was unaffected. The interaction was one of suppression because the single visual target always produced a larger response in buildup neurons than did the same stimulus embedded in the pattern of eight stimuli.
DISCUSSION
We investigated whether the activity of the SC buildup neurons had the characteristics we would expect of neurons related to motor set by using behavioral paradigms that varied the probability that a given stimulus in an array would become the target for a saccade. We found that a decrease in the probability that a stimulus would be the target for a saccade resulted in a decrease in the activity of SC buildup neurons. The change in activity was evident from the initial visual response after the stimulus onset until the target was specified. The changes in neuronal activity did not result simply from changing the visual stimulus display, because altering the probability that a particular target would be selected without changing the configuration of the visual stimuli resulted in similar decreased activity with decreased target probability. In contrast to the change in the delay activity, the presaccadic burst of activity of buildup neurons, as well as that of burst neurons, was largely unmodulated by the level of saccade target probability. Thus, although the burst of activity related to the direction and amplitude of the impending saccade remains relatively fixed for any given buildup neuron, the earlier delay period activity varies with the conditions under which saccades are made.
We think the changes in the delay activity of buildup neurons reflect the changes in the motor set of the monkeys. We will first discuss the relation of our observations with respect to motor set and then consider what our observations indicate about the change of activity across the SC movement map.
Relation of observations to motor set
Visual response
Changing the number of stimuli changed the number of possible saccades monkeys could make and, thus, changed the motor set. The initial visual response was correlated with changes in the number of possible saccade targets. Moreover, the initial visual response was greater in the blocked target trials compared with the mixed target trials, indicating that change in buildup neuron activity reflected more than the stimulus configuration. Buildup neuron visual response changes are reminiscent of changes in the response of neurons in the superficial layers of the SC referred to as visual enhancement (Goldberg and Wurtz, 1972b; Wurtz and Mohler, 1976). When the visual target falling in the receptive field of the neuron became the target for a saccade, the visual response was larger. Thus, in both the superficial layer neurons and the intermediate layer SC neurons, the response to a stimulus is greater when that stimulus is a likely saccade target. Visual responses of intermediate layer neurons have been shown to facilitate the production of saccades (Edelman and Keller, 1996), which is also consistent with our interpretation of this activity as being related to motor set.
Delay activity
The delay period activity in our experiment, the activity after the stimulus presentation but before identification of the target, is similar to the delay period activity described for buildup neurons (Munoz and Wurtz, 1995). In their task, monkeys were presented with only two stimuli, either one of which could be the target for a saccade on any given trial. During the delay period of a gap saccade task (in which the fixation point disappeared but the monkey was required to continue to fixate), the activity continued until one of the two stimuli was specified as the target of the impending saccade. The present experiments show that although the decrease in delay activity is relatively slight moving from one to two possible targets, the activity declines sharply for four or eight possible targets (Fig. 3). As in the experiments of Munoz and Wurtz (1995), with only two targets possible, the activity of the buildup neurons increased before the target was identified.
This is in contrast to the observations of Glimcher and Sparks (1992)that the activity increased after specification of the target in the two target case. This led them to conclude that the increased activity was dependent on the specification of the metrics of the saccade; that is clearly not the case in our experiments because the increase occurred before the metrics could be specified. One possible explanation for this difference is that the prelude burst neurons do not overlap the neurons we classified as buildup, although from their example they appear to overlap. Another possibility is that the temporal intervals of the tasks account for the differences. For example, behavioral experiments indicate that the efficacy of maintaining a high level of motor preparedness is limited in time (for review, see Requin et al., 1991). Our pre-selection period was only 1.2 sec, in which case the monkeys may try to predict the upcoming saccade.Glimcher and Sparks (1992), in contrast, used delays of 7 sec that might have minimized the monkeys’ attempts to predict the upcoming saccade.
Changing the conditions of the task from presenting a different target out of eight possible saccade targets on every trial to blocking a single target repeatedly on every trial influenced motor set. We confirmed this by determining that the saccade latency was shorter in the blocked target trial condition than in the mixed target trial condition. If the delay period activity reflects motor set, a simple hypothesis is that the delay period activity should predict the latency of the saccadic eye movement. Indeed, the neuronal activity was higher in blocked target trials, and saccade latency was shorter. Thus, an independent, behavioral measure of the change in motor set supports the interpretation of buildup activity as reflecting motor set, or saccade preparation (Munoz and Wurtz, 1995; Dorris et al., 1997).
Recently, the delay period activity of neurons in the rostral SC has been shown to be active during pursuit eye movements as well as saccades (Krauzlis et al., 1997). Also, neurons further caudal in the SC, including those containing delay period activity, have activity related to gaze changes that include movement of the head as well as the eye (Freedman and Sparks, 1997). Thus, this activity is perhaps best thought of as a general motor preparatory or readiness signal, whereas in our experiments we manipulated only the level of saccade preparation.
Target selection activity
After dimming the target, we always saw an increase in activity of the buildup neurons. This increase is entirely consistent with that seen by Glimcher and Sparks (1992) for prelude burst neurons using two possible targets and with the increased activity of buildup neurons seen by Kustov and Robinson (1996) after a cue indicated one of two possible targets. What we found was that this increase was substantially larger when the probability of any one target being selected was less (Figs. 2, 3, 7), not because the selection activity was greater but because the pre-selection activity was reduced.
The present experiments also show that although some of the neurons showed a decline in activity as soon as the stimulus falling in the movement field of the neuron was not identified as the target [as shown by Munoz and Wurtz (1995) with two targets], other neurons did not show such a decline (Fig. 6B). What this indicates is that some neurons convey little information about which saccade target is not identified but rather convey information only about which target is identified. In other words, the saccadic decision process at this level in the system involves increased activity of SC neurons voting for their location on the map (Robinson, 1972) and not necessarily a suppression of activity at distracter locations. Slight SC neuronal activity for targets located outside of the movement field was also observed by Glimcher and Sparks (1992) in their task. The lack of suppression of SC neuronal activity for these distractor stimuli (Fig. 6C) contrasts with the flanking-inhibition mechanism proposed for saccade target selection at the level of the frontal eye field (Schall et al., 1995).
Saccade initiation
In the buildup neurons we saw little change in the activity in any burst preceding the saccade, nor did we see any such change in presaccadic activity in the burst neurons. Neither result is surprising because by the time of the saccade, the target had been identified and all the trials were the same. We did see some alteration in the slight earlier activity that we could identify in the burst neurons (Fig. 8), but because this activity was so small to begin with, a reduction with decreased target probability was minimal.
What is important for the differences in these two classes of neurons is that the experimental conditions greatly affect the identification of buildup neurons but not of burst neurons. We could convert what we classified as a buildup neuron in a conventional visually guided saccade task into a burst neuron simply by decreasing target probability. However, we could never convert a burst neuron into a buildup neuron. The identification of buildup neurons, therefore, depends on the conditions under which the neuron is studied. We would predict that any condition with low probability that a given saccade would be made on any given trial would lead to a reduction in the amount of delay period activity and would reduce the frequency of identification of buildup neurons.
Behaviorally mediated changes over the SC map
The specification of saccades over time has been clearly demonstrated at the behavioral level (Becker and Jürgens, 1979) where the accuracy of saccades evolves in the time between target presentation and saccade initiation. Thus, one would expect that the activity in the SC would also evolve over time (Sparks et al., 1987). This was demonstrated by Glimcher and Sparks (1993), who showed that low-frequency electrical stimulation in one part of the SC, which itself did not elicit saccades, increased the frequency of saccades related to the part of the field served by the stimulated SC. The temporal increase in the activity of buildup neurons (Munoz and Wurtz, 1995) is further evidence of the evolution of the saccade, so that evidence from both neuronal activity and electrical stimulation is consistent with a role for the SC in the specification of saccades over time.
The present experiments demonstrate that the specification also develops over space on the SC map. Saccade-related neurons in the intermediate layers of the SC are organized on a movement map (for review, see Sparks and Hartwich-Young, 1989), and within this map, different regions become active before the onset of saccades of different amplitudes and directions. We altered the development of the spatial specification within the SC as revealed in two aspects of the activity changes. First, when there was a high probability that a particular saccade would be made, the activity of buildup neurons was relatively high but confined to a restricted locus (Fig. 7). When there was a low probability that a particular saccade would be made, the activity of buildup neurons was much lower over the map. Second, when the probability became 100% after the target dimmed, the activity converged to a restricted locus; the activity increased at that point but did not decrease throughout the SC. Thus, unlike the saccadic movement map created by the burst neurons that is completely quiescent until the saccade, the buildup neuron map is slightly active for all target locations. Any saccadic decision process that may be imposed on the SC is accompanied by a focusing and an enhancement of the low-level activity present throughout the map of SC buildup neurons into one area. This focus occurs over the spatial map within the SC as the time of the saccade approaches.
Footnotes
We would like to thank our colleagues at the Laboratory of Sensorimotor Research, the two anonymous reviewers, and Dr. Lee Stone for critical comments on previous versions of this manuscript. We are also thankful to Dr. Rich Krauzlis for data analysis software and the Laboratory of Diagnostic Radiology for providing magnetic resonance images.
Correspondence should be addressed to Dr. Michele A. Basso, Laboratory of Sensorimotor Research, National Eye Institute, Building 49, Room 2A50, Bethesda, MD 20892.
REFERENCES
- 1.Andersen RA, Snyder LH, Bradley DC, Xing J. Multimodal representation of space in the posterior parietal cortex and its use in planning movements. Annu Rev Neurosci. 1997;20:303–330. doi: 10.1146/annurev.neuro.20.1.303. [DOI] [PubMed] [Google Scholar]
- 2.Basso MA, Wurtz RH. Modulation of neuronal activity by target uncertainty. Nature. 1997;389:66–69. doi: 10.1038/37975. [DOI] [PubMed] [Google Scholar]
- 3.Becker W, Jürgens R. An analysis of the saccadic system by means of double step stimuli. Vision Res. 1979;19:967–983. doi: 10.1016/0042-6989(79)90222-0. [DOI] [PubMed] [Google Scholar]
- 4.Bravo MJ, Nakayama K. The role of attention in different visual-search tasks. Percept Psychophys. 1992;51:465–472. doi: 10.3758/bf03211642. [DOI] [PubMed] [Google Scholar]
- 5.Britten KH, Shadlen MN, Newsome WT, Movshon JA. The analysis of visual motion: a comparison of neuronal and psychophysical performance. J Neurosci. 1992;12:4745–4765. doi: 10.1523/JNEUROSCI.12-12-04745.1992. [DOI] [PMC free article] [PubMed] [Google Scholar]
- 6.Crist CF, Yamasaki DSG, Komatsu H, Wurtz RH. A grid system and a microsyringe for single cell recording. J Neurosci Methods. 1988;26:117–122. doi: 10.1016/0165-0270(88)90160-4. [DOI] [PubMed] [Google Scholar]
- 7.di Pellegrino G, Wise SP. Visuospatial versus visuomotor activity in the premotor and prefrontal cortex of a primate. J Neurosci. 1993;13:1227–1243. doi: 10.1523/JNEUROSCI.13-03-01227.1993. [DOI] [PMC free article] [PubMed] [Google Scholar]
- 8.Dorris MC, Paré M, Munoz DP. Neuronal activity in monkey superior colliculus related to the initiation of saccadic eye movements. J Neurosci. 1997;17:8566–8579. doi: 10.1523/JNEUROSCI.17-21-08566.1997. [DOI] [PMC free article] [PubMed] [Google Scholar]
- 9.Edelman JA, Keller EL. Activity of visuomotor burst neurons in the superior colliculus accompanying express saccades. J Neurophysiol. 1996;76:908–926. doi: 10.1152/jn.1996.76.2.908. [DOI] [PubMed] [Google Scholar]
- 10.Evarts EV, Shinoda Y, Wise SP. Neurophysiological approaches to higher brain functions. Wiley; New York: 1984. [Google Scholar]
- 11.Freedman EG, Sparks DL. Eye-head coordination during head-unrestrained gaze shifts in rhesus monkeys. J Neurophysiol. 1997;77:2328–2348. doi: 10.1152/jn.1997.77.5.2328. [DOI] [PubMed] [Google Scholar]
- 12.Fuchs AF, Robinson DA. A method for measuring horizontal and vertical eye movement chronically in the monkey. J Appl Physiol. 1966;21:1068–1070. doi: 10.1152/jappl.1966.21.3.1068. [DOI] [PubMed] [Google Scholar]
- 13.Glimcher PW, Sparks DL. Movement selection in advance of action in the superior colliculus. Nature. 1992;355:542–545. doi: 10.1038/355542a0. [DOI] [PubMed] [Google Scholar]
- 14.Glimcher PW, Sparks DL. Effects of low-frequency stimulation of the superior colliculus on spontaneous and visually guided saccades. J Neurophysiol. 1993;69:953–964. doi: 10.1152/jn.1993.69.3.953. [DOI] [PubMed] [Google Scholar]
- 15.Goldberg ME, Wurtz RH. Activity of superior colliculus in behaving monkey. I. Visual receptive fields of single neurons. J Neurophysiol. 1972a;35:542–559. doi: 10.1152/jn.1972.35.4.542. [DOI] [PubMed] [Google Scholar]
- 16.Goldberg ME, Wurtz RH. Activity of superior colliculus in behaving monkeys. II. Effect of attention on neuronal responses. J Neurophysiol. 1972b;35:560–574. doi: 10.1152/jn.1972.35.4.560. [DOI] [PubMed] [Google Scholar]
- 17.Hanes DP, Thompson KG, Schall JD. Relationship of presaccadic activity in frontal eye field and supplementary eye field to saccade initiation in macaque: Poisson spike train analysis. Exp Brain Res. 1995;103:85–96. doi: 10.1007/BF00241967. [DOI] [PubMed] [Google Scholar]
- 18.Hays AV, Richmond BJ, Optican LM. A UNIX-based multiple process system for real-time data acquisition and control. WESCON Conf Proc. 1982;2:1–10. [Google Scholar]
- 19.Hikosaka O, Wurtz RH. Visual and oculomotor functions of monkey substantia nigra pars reticulata. I. Relation of visual and auditory responses to saccades. J Neurophysiol. 1983;49:1230–1253. doi: 10.1152/jn.1983.49.5.1230. [DOI] [PubMed] [Google Scholar]
- 20.Hikosaka O, Wurtz RH. The basal ganglia. In: Wurtz RH, Goldberg ME, editors. The neurobiology of saccadic eye movements, reviews of oculomotor research, Vol III. Elsevier; Amsterdam: 1989. pp. 257–284. [PubMed] [Google Scholar]
- 21.Judge SJ, Richmond BJ, Chu FC. Implantation of magnetic search coils for measurement of eye position: an improved method. Vision Res. 1980;20:535–538. doi: 10.1016/0042-6989(80)90128-5. [DOI] [PubMed] [Google Scholar]
- 22.Kojima J, Matsumura M, Togawa M, Hikosaka O. Tonic activity during visuo-oculomotor behavior in the monkey superior colliculus. Neurosci Res. 1996;26:17–28. doi: 10.1016/0168-0102(96)01067-x. [DOI] [PubMed] [Google Scholar]
- 23.Krauzlis RJ, Basso MA, Wurtz RH. Shared motor error for multiple eye movements. Science. 1997;276:1693–1695. doi: 10.1126/science.276.5319.1693. [DOI] [PubMed] [Google Scholar]
- 24.Kustov AA, Robinson DL. Shared neural control of attentional shifts and eye movements. Nature. 1996;384:74–77. doi: 10.1038/384074a0. [DOI] [PubMed] [Google Scholar]
- 25.Munoz DP, Wurtz RH. Fixation cells in monkey superior colliculus. I. Characteristics of cell discharge. J Neurophysiol. 1993;70:559–575. doi: 10.1152/jn.1993.70.2.559. [DOI] [PubMed] [Google Scholar]
- 26.Munoz DP, Wurtz RH. Saccade-related activity in monkey superior colliculus. I. Characteristics of burst and buildup cells. J Neurophysiol. 1995;73:2313–2333. doi: 10.1152/jn.1995.73.6.2313. [DOI] [PubMed] [Google Scholar]
- 27.Ottes FP, Van Gisbergen JAM, Eggermont JJ. Collicular involvement in a saccadic colour discrimination task. Exp Brain Res. 1987;66:465–478. doi: 10.1007/BF00270679. [DOI] [PubMed] [Google Scholar]
- 28.Requin J, Brener J, Ring C. Preparation for action. In: Jennings JR, Coles GH, editors. Handbook of cognitive psychophysiology. Wiley; New York: 1991. pp. 357–448. [Google Scholar]
- 29.Robinson DA. Eye movements evoked by collicular stimulation in the alert monkey. Vision Res. 1972;12:1795–1808. doi: 10.1016/0042-6989(72)90070-3. [DOI] [PubMed] [Google Scholar]
- 30.Schall JD. Visuomotor areas of the frontal lobe. In: Rockland K, Kaas J, Peters A, editors. Cerebral cortex. Plenum; New York: 1997. pp. 527–638. [Google Scholar]
- 31.Schall JD, Hanes DP. Neural basis of saccade target selection in frontal eye field during visual search. Nature. 1993;366:467–469. doi: 10.1038/366467a0. [DOI] [PubMed] [Google Scholar]
- 32.Schall JD, Hanes DP, Thompson KG, King DJ. Saccade target selection in frontal eye field of macaque. I. Visual and premovement activation. J Neurosci. 1995;15:6905–6918. doi: 10.1523/JNEUROSCI.15-10-06905.1995. [DOI] [PMC free article] [PubMed] [Google Scholar]
- 33.Sparks DL, Hartwich-Young R. The deep layers of the superior colliculus. In: Wurtz RH, Goldberg ME, editors. The neurobiology of saccadic eye movements, reviews of oculomotor research, Vol III. Elsevier; Amsterdam: 1989. pp. 213–256. [PubMed] [Google Scholar]
- 34.Sparks DL, Mays LE, Porter JD. Eye movements induced by pontine stimulation: interaction with visually triggered saccades. J Neurophysiol. 1987;53:300–318. doi: 10.1152/jn.1987.58.2.300. [DOI] [PubMed] [Google Scholar]
- 35.Thompson KG, Hanes DP, Bichot NP, Schall JD. Perceptual and motor processing stages identified in the activity of macaque frontal eye field neurons during visual search. J Neurophysiol. 1996;76:4040–4055. doi: 10.1152/jn.1996.76.6.4040. [DOI] [PubMed] [Google Scholar]
- 36.Treisman AM, Gelade G. A feature-integration theory of attention. Cognit Psychol. 1980;12:97–136. doi: 10.1016/0010-0285(80)90005-5. [DOI] [PubMed] [Google Scholar]
- 37.Wise SP. The primate premotor cortex: past, present and preparatory. Annu Rev Neurosci. 1985;8:1–19. doi: 10.1146/annurev.ne.08.030185.000245. [DOI] [PubMed] [Google Scholar]
- 38.Wurtz RH, Mohler CW. Organization of monkey superior colliculus: enhanced visual response of superficial layer cells. J Neurophysiol. 1976;39:745–765. doi: 10.1152/jn.1976.39.4.745. [DOI] [PubMed] [Google Scholar]