

Abstract
The dorsal cochlear nucleus (DCN) is one of three nuclei at the terminal zone of the auditory nerve. Axons of its projection neurons course via the dorsal acoustic stria (DAS) to the inferior colliculus (IC), where their signals are integrated with inputs from various other sources. The DCN presumably conveys sensitivity to spectral features, and it has been hypothesized that it plays a role in sound localization based on pinna cues. To account for its remarkable spectral properties, a DCN circuit scheme was developed in which three inputs converge onto projection neurons: auditory nerve fibers, inhibitory interneurons, and wide-band inhibitors, which possibly consist of Onset-chopper (Oc) cells. We studied temporal and binaural properties in DCN and DAS and examined whether the temporal properties are consistent with the model circuit.
Interneurons (type II) and projection (types III and IV) neurons differed from Oc cells by their longer latencies and temporally nonlinear responses to amplitude-modulated tones. They also showed evidence of early inhibition to clicks. All projection neurons examined were inhibited by stimulation of the contralateral ear, particularly by broadband noise, and this inhibition also had short latency. Because Oc cells had short-latency responses and were well driven by broadband stimuli, we propose that they provide short-latency inhibition to DCN for both ipsilateral and contralateral stimuli. These results indicate more complex temporal behavior in DCN than has previously been emphasized, but they are consistent with the recently described nonlinear behavior to spectral manipulations and with the connectivity scheme deduced from such manipulations.
Keywords: audition, dorsal cochlear nucleus, dorsal acoustic stria, amplitude modulation, temporal, binaural, cat
The dorsal cochlear nucleus (DCN) is one of three nuclei at the terminal zone of the auditory nerve. Axons of its projection cells leave the nucleus via the dorsal acoustic stria (DAS) and project to the inferior colliculus (IC) (Osen, 1972; Adams and Warr, 1976; Oliver, 1984). The DCN is the most complex subdivision of the cochlear nucleus, and its function remains unknown.Young and colleagues (1992) proposed that the DCN serves a role in the detection of spatial elevation of a sound source by virtue of its sensitivity to spectral features such as those resulting from the directionally dependent filtering properties of the pinna.
One strategy for obtaining clues to the function of the DCN is to examine the effect of its very nonlinear spectral properties (Nelken et al., 1997) on the IC (Semple and Aitkin, 1980). For example, inputs from the DCN partly converge with inputs from the lateral superior olive (LSO) (Oliver et al., 1997). Cells in the LSO are sensitive to interaural level differences (ILDs) (Boudreau and Tsuchitani, 1968) and interaural time differences of amplitude-modulated (AM) tones (Joris and Yin, 1995), which are cues to the azimuthal position of a sound source. Cells in the IC with spatially restricted receptive fields have been described (Moore et al., 1984), and an appealing hypothesis is that such receptive fields would be assembled from DCN and LSO inputs. We therefore wished to compare DCN with LSO responses in two respects. First, the cochlear nucleus (CN) is usually thought of as a monaural nucleus, but there have been reports of excitatory and inhibitory binaural interactions, particularly in the DCN (Mast, 1970, 1973;Hochfeld, 1973; Young and Brownell, 1976). These need further characterization if effects of the DCN on the IC are to be studied because here binaural and monaural pathways converge. Second, like the LSO (Tsuchitani and Boudreau, 1966; Guinan et al., 1972), the DCN has a high-frequency bias (Spirou et al., 1993), and was traditionally viewed as a structure with little sensitivity in the temporal domain, as evident in responses to pure tones (Goldberg and Brownell, 1973). However, recent studies of the DCN with AM stimuli have challenged that view (Rhode and Greenberg, 1994). We studied responses of DCN neurons to AM stimuli that were also used in previous LSO studies.
A final reason to further characterize both binaural and temporal sensitivities in the DCN is preliminary anatomical evidence from intra-axonal labeling experiments [Joris et al. (1992) and our unpublished results] that one class of inhibitory neurons, Oc cells in the posteroventral cochlear nucleus (PVCN) and deep DCN, may have a role in both kinds of sensitivity, because they project to both ipsilateral and contralateral DCN. A spectral role for these cells was first suggested by Nelken and Young (1994). These authors surmised that convergence of three inputs is needed to explain the spectral properties of DCN output neurons: auditory nerve fibers, inhibitory (type II) interneurons, and a wide-band inhibitory source, which they hypothesized to be Oc cells. Here, we examine whether these proposed interactions hold up when examined in the time domain.
MATERIALS AND METHODS
Data for the present report were derived from 13 DCN–DAS experiments that also contributed data for a previous publication (Joris, 1998), in which methodological details can be found.
Animal preparation. Young adult cats were induced with an intramuscular injection of a mixture of ketamine (20 mg/kg) and acepromazine (0.4 ml) and received a subcutaneous injection of atropine. Anesthesia was maintained with periodic intravenous injections of 60 mg α-chloralose dissolved in a warm 1:3 mixture of propylene glycol and saline that were repeated when withdrawal reflexes to toe pinches returned and sometimes supplemented with diazepam to obtain more complete flaccidity of the limbs. Body temperature was maintained at 37°C. A tracheotomy was performed and both ear canals were exposed. DCN and/or DAS were visualized via a dorsal approach and cerebellar aspiration. The electrode was held by a microdrive fixed to the skull with a lucite holder and controlled from outside the sound-shielded room. It was aimed at the free surface of the DCN or at the DAS where it crosses the dorsal surface of the inferior cerebellar peduncle to descend along the surface of the fourth ventricle.
Data collection and analysis. Stimuli were timed and generated with a 16-bit digital stimulus system (Olson et al., 1985) driving dynamic phones that were part of a closed acoustic assembly (Chan et al., 1993). This assembly, also containing a calibration probe tube, was connected to tight-fitting hollow ear pieces inserted into the cut ear canals on both sides. Single units were recorded with glass-insulated tungsten electrodes of ∼3–4 MΩ (MicroProbe) or glass micropipettes (∼20 MΩ). The neural signal was amplified, filtered, displayed, and discriminated with conventional methods. Standard pulses were sent to the computer, which provided on-line visualization of poststimulus time histograms (PSTHs) and various response curves based on average firing rate or response synchronization.
For each well isolated unit characteristic frequency (CF: frequency with lowest excitatory threshold), response to broadband noise and presence of inhibitory sidebands (if spontaneous activity was present) were assessed with a computer-controlled search program. Spontaneous rate (SR) and CF were then quantitatively determined with a response area program, which presented tone bursts (duration/repetition intervals were typically 50/200 or 100/500 msec) at many frequency/sound pressure level (SPL) combinations, or a tuning curve program that tracked the excitatory threshold (duration/repetition intervals were 50/100msec). Rate-level functions were obtained to (1) short tone bursts at CF (25/100 msec, ≥ 200 repetitions, rise/fall times 1.6 msec), (2) long-duration tone bursts at CF (100/500 msec or 200/1000 msec, rise/fall 3.9 or 4 msec, usually 40 repetitions in 5 or 10 dB increments), and (3) broadband noise bursts (40 kHz wide, other parameters as in (2). Stimulus levels for tones are specified in decibel SPL (sound pressure level re 20 μPa). Sound levels for noise are attenuator settings (decibel, arbitrary reference), which are close (maximum difference of 11 dB) to noise levels re 20 μPa computed by integrating the stimulus energy, corrected for acoustic calibration, over a one-third octave band centered on CF.
Responses to these initial tests allowed classification of cells, based on a modification of the schemes of Evans and Nelson (1973) and Young and Brownell (1976), as described previously (Joris, 1998). Briefly, four major categories were defined. Type IV responses showed spontaneous activity that was mostly inhibited by pure tones at the CF, so that rate-level functions obtained at CF were nonmonotonic, whereas broadband noise was usually excitatory at all stimulus levels. Type III responses resembled type IV responses but their response to CF tones was not strongly nonmonotonic. For reasons outlined earlier (Joris, 1998), we refer to type III and IV classes as one inclusive “III+IV” group. Type II responses had no spontaneous activity and were well driven by CF tones but not by broadband noise. Finally, responses were classed as Oc based on the PSTH to short CF tone bursts, the expansive tonal rate-level function, and the strong response to noise.
Data on Oc cells in previous studies were obtained mainly in the PVCN. A small number of these cells occur in the DCN (Godfrey et al., 1975b; Joris et al., 1992), but the main reason for including the Oc response type in the current analysis is the strong projection of these cells to DCN (Smith and Rhode, 1989; Joris et al., 1992). Thirteen of the 14 Oc cells reported here were recorded in the stria, and one was recorded in the DCN. As they cross the inferior cerebellar peduncle and course centrally, the axons of Oc cells form a bundle that is separate from the axons of fusiform and giant cells [Osen et al. (1990), and our unpublished results], and it is a matter of definition whether one considers these axons to be part of the DAS or the intermediate acoustic stria or a separate bundle altogether. For convenience we refer to our recordings in the stria as “DAS recordings” (see Joris, 1998).
Temporal behavior was studied with 20 μsec rarefaction clicks (repetition interval 100 msec, ≥200 repetitions) and AM stimuli (600/1000 msec, 20 or 40 repetitions). A tonal carrier of frequencyfc (= CF) was digitally multiplied with a low-frequency sinusoidal modulator of frequencyfm according to the equations(t) = [1 + m sin (2πfmt)] sin (2πfct), with modulation depthm = 1. Magnitude (Rm) and phase (φm) of synchronization of the response to the envelope frequency of the AM stimulus were quantified with vector averaging (Goldberg and Brown, 1969). Rm (also called vector strength or synchronization index) is 1 when all spikes occur at one particular envelope phase; for randomly timed spikesRm is 0. In the calculation ofRm the initial 10 msec of the response were discarded to remove the effect of the stimulus onset transient. Synchronization level functions (Rm and φm as a function of SPL) were obtained with fixedfm (usually 100 Hz) by increasing the stimulus level in 5 dB steps from below threshold to ∼80 dB. From this function an SPL was found at which the response was strong both in terms of average firing rate and in terms of synchronization tofm. Modulation transfer functions were then obtained by keeping SPL fixed at that level and varyingfm in linear steps between ∼10 and 2000 Hz.
Examination of binaural sensitivity in the DCN is complicated by the combination of weak contralateral influences and complex ipsilateral responses, which often include nonmonotonic and mixed excitatory/inhibitory components. We report only binaural effects that could not be interpreted as a result of ipsilateral stimulation through acoustic cross talk: this biased our sample toward type III+IV cells, which usually have spontaneous activity and low ipsilateral thresholds (see Results). Precautions were taken to minimize acoustic cross talk through the stimulus system (Gibson, 1982), and control experiments in the auditory nerve confirmed the high level of acoustic isolation, also helped by the high-frequency bias of DCN. Comparison of rate-level functions with ipsilateral and contralateral noise bursts (same parameters as in DCN–DAS experiments; e.g., see Fig. 9C), obtained for nerve fibers with CFs between 2.5 and 21 kHz, showed that interaural attenuation was ≥60 dB.
Fig. 9.

Effects of contralaterally presented broadband stimuli on spontaneous and ipsilaterally evoked activity.A–C, Responses to monaural and binaural (equal level) stimuli. A, DAS type IV cell, CF = 8.8 kHz.B, DAS type III cell, CF = 5.7 kHz.C, Auditory nerve fiber, CF = 11.8 kHz.D, Noise interaural level difference (ILD) functions for the same cell as B. The level of the ipsilateral noise burst was held constant at the level indicated in the caption, whereas the contralateral level was varied. In all cases binaural stimuli were gated simultaneously, and differences in phone maximum output levels were <10 dB, as measured in a one-third octave band around the CF. Duration was 25 msec for CF tones (A, B: +) and 50 or 100 msec for noise bursts. The upward inflections of the rate-level functions at the highest contralateral levels (A, 90 dB; B, D, 80 dB) were interpreted as the threshold of acoustic cross talk.
Control experiments. We contrast the responses obtained in DCN and DAS with responses in the auditory nerve and anteroventral cochlear nucleus (AVCN). Responses to AM stimuli are compared with published auditory nerve data (see Figs. 2C, 6, 8) (Joris and Yin, 1992). Responses to contralateral noise bursts and ipsilateral CF tones, clicks, and noise bursts (see Figs. 2A,B,9C, 13) were obtained from two auditory nerve experiments and one AVCN experiment (this was not the main focus of these experiments). The experimental and analytical procedures were almost identical to the DCN–DAS experiments, the main difference being that pentobarbital anesthesia was used (Joris and Yin, 1992, 1998). Again, effects of contralateral stimulation were primarily looked for as an inhibition of SR, and these experiments were therefore biased toward cells with high SR.
Fig. 2.
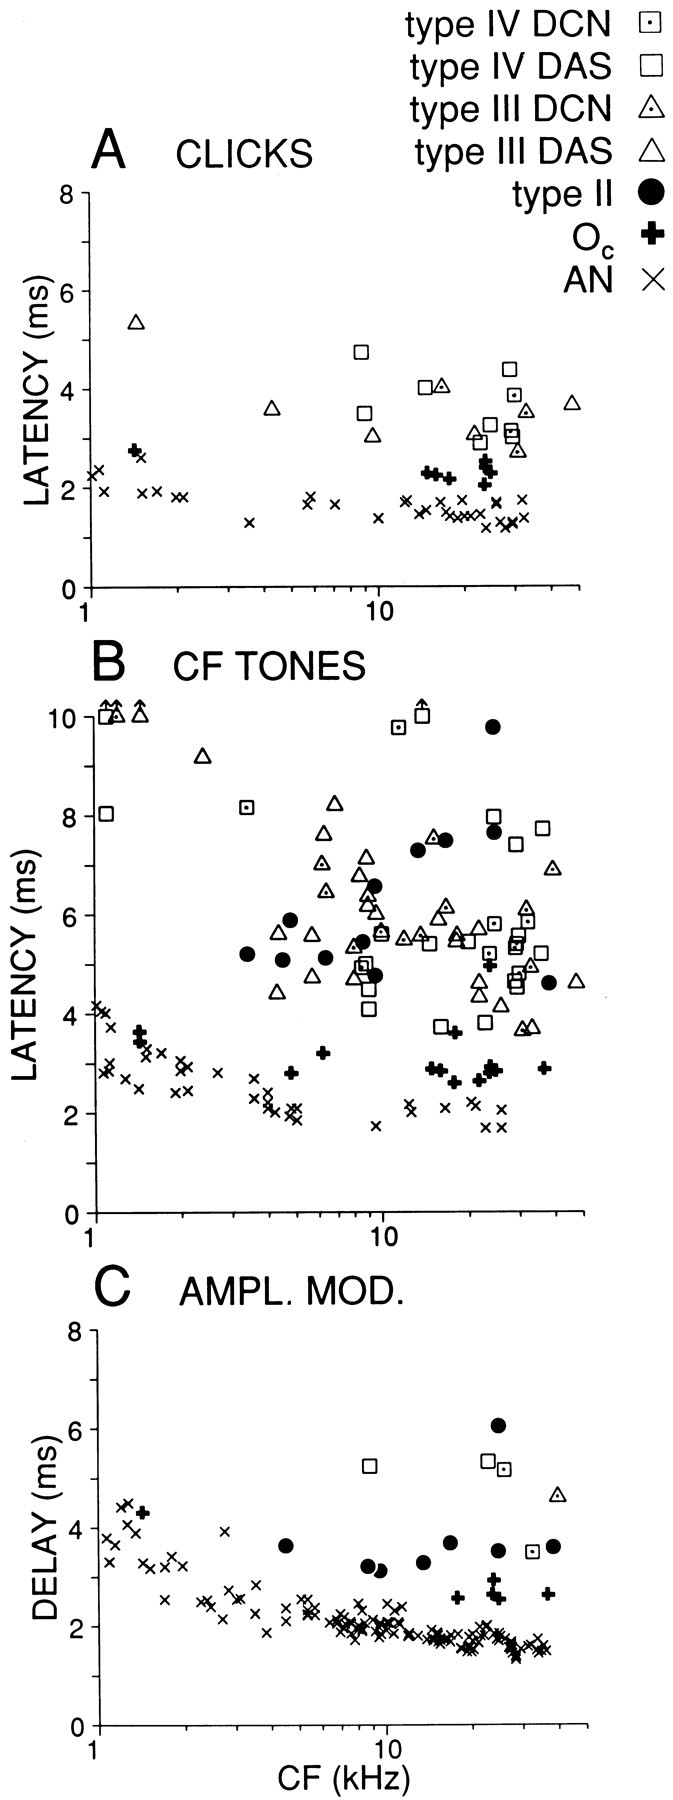
Comparison of latencies in DCN, DAS, and auditory nerve, measured for three types of stimuli. A, Minimum click latency. Type II cells were unresponsive to clicks and are thus not represented. B, Minimum latency to 25 msec tone bursts at CF. Symbols carrying upward arrows indicate responses for which shortest latency was >10 msec. C, Group delay measured from the slope of the phase-frequency function derived from responses to amplitude modulation. Datapoint for one type II cell (CF = 9.5 kHz) was shifted to lower CF to avoid overlap. Auditory nerve data in A and B are from a single experiment, whereas those in C are from the study by Joris and Yin (1992). Measures in C are corrected for acoustic delay, which was ∼0.28 msec (∼0.40 msec for auditory nerve experiments in C) as measured from the phase-frequency slope of the acoustic calibration curve.
Fig. 6.

Maximum synchronization values tofm, for DCN responses classes and a population of auditory nerve fibers [auditory nerve data are fromJoris and Yin (1992)].
Fig. 8.

Comparison of cutoff-frequencies of modulation transfer functions in auditory nerve [AN; data fromJoris and Yin (1992)] and the DCN, as a function of characteristic frequency. Some of the type IV and Oc units were recorded in the DAS. The type II cell with notched MTF in Figure7A is not included.
Fig. 13.
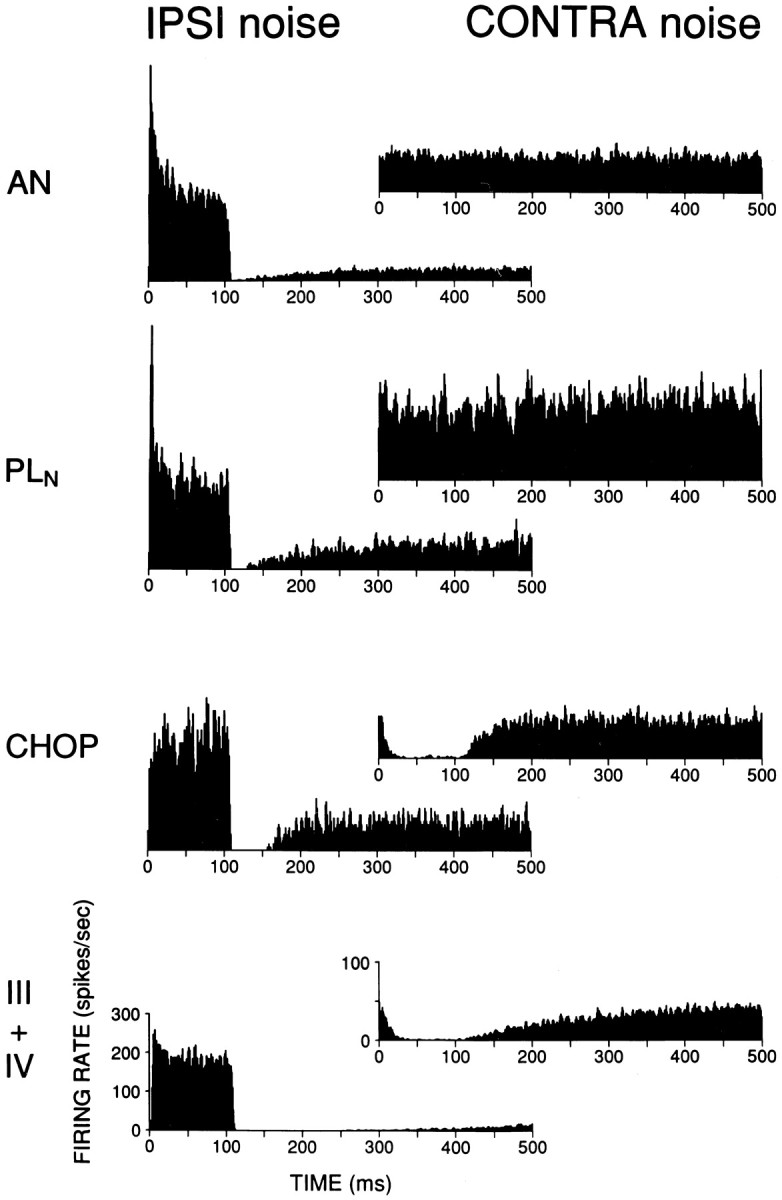
Population responses to ipsilateral and contralateral noise in auditory nerve and cochlear nucleus.PLN, Primary-like-with-notch;CHOP, chopper. PSTHs are responses averaged across cells to an identical stimulus (broadband noise at 70 dB, rise/fall time of 4 msec, starting at 0 and 100 msec in duration) at either the ipsilateral (left column) or contralateral (right column) ear. The same cells were used in construction of left and right histograms (number of cells: AN, 11;PLN, 3; III+IV, 20), except for the chopper class (n = 2 for IPSI,n = 6 for CONTRA). Binwidth is 1 msec. Scales for histograms on bottom apply to all histograms in a column; note the difference in scale for left and right column.
RESULTS
Data were obtained for several hundred cells from DCN (four animals), DAS (six animals), or combined DCN–DAS (three animals) recordings. Cells were classified according to the response map and PSTH scheme, as described in Joris (1998). Only cells in the main response classes (types II, III, and IV, or Oc), for which temporal or binaural measures were available and which were driven by the ipsilateral ear, are retained for the present report (n = 114). In terms of the binaural and temporal response measures discussed here, the data did not suggest notable differences, within the type III+IV group, between the DCN and DAS recordings. We therefore pool the data from DCN and DAS recordings in most population figures. Based on these and other (Joris, 1998) similarities, and on independent anatomical evidence derived from intra-axonal labeling (our unpublished observations), it is unlikely that the DAS data reported here are contaminated by recordings from descending fibers.
Response latencies
Various kinds of broadband and filtered noises have been used in the physiological dissection of the DCN, but with the exception of the early study of Godfrey et al. (1975b), responses to transients have not been studied systematically. Figure 1shows representative click responses of type III+IV (A–E) and Oc (F, G) units to 20 μsec rarefaction clicks over a range of SPLs. Oc units responded with one or more modes of increased firing probability that were very well timed and had short latency. Type III+IV cells also responded with several modes but with longer latency and poorer timing. Moreover, the response of the latter cells sometimes had unusual features such as a latency increase with increasing SPL (Fig.1A,B, compare left and right histograms), and a first excitatory mode that was preceded by inhibition of spontaneous activity.
Fig. 1.
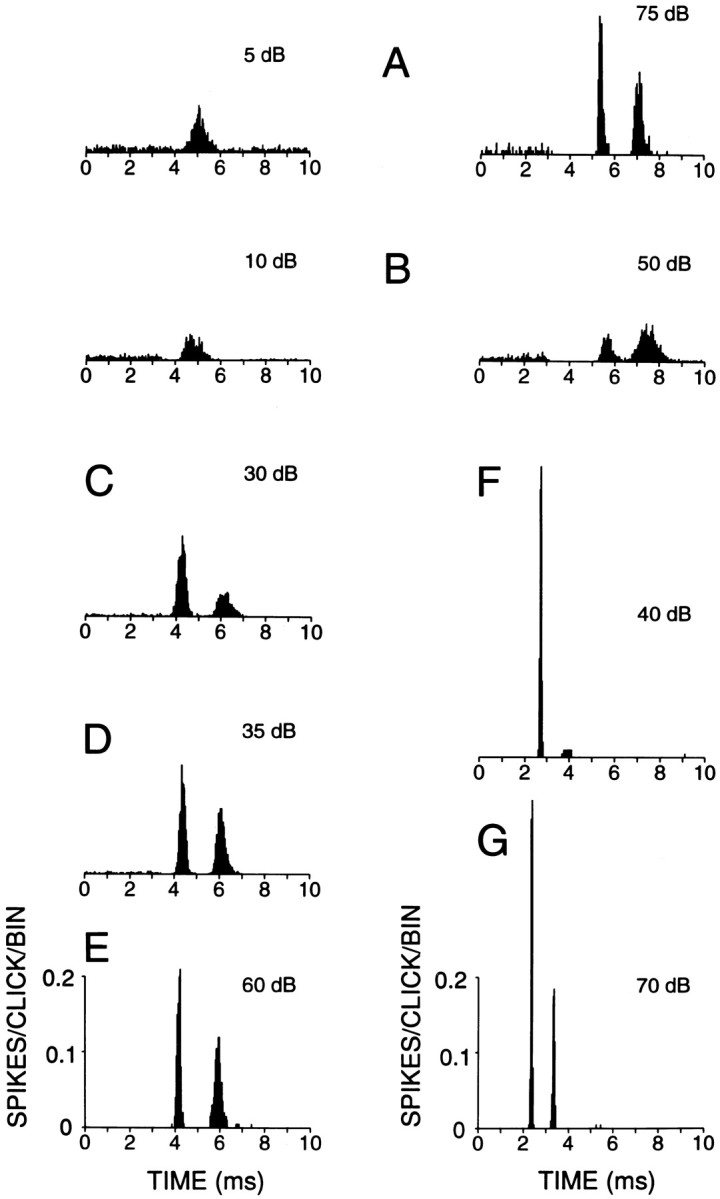
Responses of fibers in the DAS to 20 μsec rarefaction clicks. A–C, E, Type IV; D, type III; F, G, type Oc. Suprathreshold levels (dB) are indicated above each PSTH histogram. For cells inA and B, responses at two levels are shown. Note that the latency of the excitatory response at low suprathreshold levels (left) is shorter than at high levels (right). Number of bins = 250. Number of repetitions: A, 500; B–D, 1000;E–G, 200. Responses B–G were obtained from the same animal. Ordinate scales on bottom apply to all histograms. A response of one spike/click, exactly timed in one 40 μsec bin, would give a response of one spike/stimulus per bin.
Click response latency at each SPL was determined for type III+IV and Oc cells from 3-point smoothed PSTHs (40 μsec binwidth) as the poststimulus time at which discharge rate reached 20% of the maximum driven rate (= absolute rate − SR) at the peak of the first response mode. Comparison (Fig.2A) of minimum click latencies in 17 type III+IV units with eight Oc units shows systematically shorter values [Mann–Whitney U(MW-U), p < 10−4] for the latter type. Latencies were only ∼1 msec longer for Oc cells than for auditory nerve fibers of similar CF.
The click latencies measured here correspond well with the ranges quoted by Godfrey et al. (1975a,b) if compared as follows: their Pauser, Buildup, and Chopper categories with our III+IV class and their OL class with our Oc class. Godfrey et al. (1975b) also described DCN cells with “on-type S” responses, many of which did not respond to clicks. The response to a sustained noise stimulus was not tested in that study, but the PSTH, shape of the tonal rate-level function, and absence of spontaneous activity of the cells reported by Godfrey et al. (1995b) are consistent with the current type II definition (Young and Voigt, 1982). To verify the finding of Godfrey et al. (1975b), we presented clicks to type II cells. In 10 cells, isolation of the spike was good enough to avoid contamination with the click-evoked field potential. Only one cell showed a significant response (one spike on ∼50% of trials) but only at the highest output level attainable. A few other cells showed an occasional spike (maximum was 12 spikes in 200 repetitions), but most cells did not respond at any level. The absence of click responses is intriguing because it requires a very short latency inhibition that precedes the excitatory effect of auditory nerve input to type II cells, but that itself is also driven by the auditory nerve. Parsimony suggests that the same source of inhibition prevents firing of type II cells to broadband noise (Young and Voigt, 1982) and to transient broadband stimuli.
To enable a latency comparison for a larger sample of cells that includes type II cells, we measured latencies to short CF tone bursts. Onset latency was calculated for a wide range of SPLs, with the same method as that used for click responses, and for each cell we noted the shortest value, which generally occurred at the highest SPL presented. As shown in Figure 2B, there is a wide range and considerable overlap in the latencies of type II, III, and IV cells (n = 12, 36, 27, respectively; MW-U between these classes was not significant), but Oc latencies (n = 14) were again consistently short and differed significantly from the other DCN classes taken together (MW-U, p < 10−6).
Various pieces of evidence suggest that Oc cells are inhibitory and may provide a strong input to both type II cells and weaker input to type IV cells (see Discussion). The short latency of Oc responses to clicks and tones (and also to AM; see below and Fig. 2C) corroborates this proposal; it may explain both the absence of click responses in type II cells and the early inhibition of SR in some type IV cells.
Response to amplitude modulation
Impulsive or step changes in intensity as in clicks and tone onsets do not afford the study of ongoing temporal properties of high-CF neurons to sustained stimuli, and often present recording difficulties because of a field potential associated with stimulus onset. AM stimuli are complementary and convenient in both these regards. Examples of responses to AM with increasing SPL are shown in Figure 3 for an Oc(left column), type II (middle column), and type IV (right column) cell. The rate-level functions to CF tones and broadband noise (bottom panels) show the defining characteristics of these response classes. The tonal rate-level function is expansive for the Oc cell, excitatory but with negative slope at mid and high SPLs for the type II cell, and mostly inhibitory for the type IV cell. The response to noise is very large in the Oc cell, absent in the type II cell, and intermediate in the type IV cell. The rate-level functions of Oc and type II cells to AM tones are similar to those for the short tone responses, albeit with reduced driven rate, as observed previously with unmodulated long tone bursts (Joris, 1998). The average rate of the type IV cell was inhibited by CF tones but exceeded SR in response to AM. These differences in average firing rate to tones versus AM were generally observed and are interesting in themselves, because it is unlikely that they are based on a spectral difference. For example, rate-level functions of type IV cells to noise bands of the same bandwidth as the AM stimuli used here (200 Hz) are similar to rate-level functions in response to CF tone bursts (Nelken and Young, 1994, 1997). However, we did not obtain responses to long unmodulated tone bursts and are therefore unsure to what extent the rate changes as in Figure 3 are caused by the stimulus envelope rather than the longer duration and/or repetition interval of the AM stimulus.
Fig. 3.

Responses to AM tones for an Oc (left column), type II (middle column), and type IV unit (right column).Bottom panels show rate-level functions to unmodulated CF tone bursts (+; duration 25 msec for A, B, 100 msec for C), to AM tones (×), and to broadband noise (▪). Middle panels (D, E, F) show the synchronization-level (Rm, ○) and phase-level (φm, ⋄) function calculated from the same AM response. Synchronization magnitude is quantified with the vector strength Rm, a dimensionless quantity varying between 0 and 1. Phase φmis given in cycles and is not shown if Rm is not statistically significant (indicated with •). Histograms (top) are cycle histograms at three selected SPLs, indicated with arrows in the middle panels. Modulation depth of AM tones was 100%, carrier frequency was at CF, and modulation frequency (fm) was 100 Hz. The Oc and type IV unit were recorded from the stria; the type II was recorded from the DCN. CFs were 24.8, 9.5, and 8.8 kHz, respectively.
Temporal measures derived from the AM responses are shown in Figure 3(middle panels). The magnitude of synchronization (Rm; ○) to the modulation frequency of 100 Hz is shown for a range of SPLs. Open circles indicate significant synchronization, as measured with the Rayleigh test (p < 0.001); for those SPLs the phase of synchronization (φm; ⋄) is also shown. Period histograms (firing rate as a function of modulation phase) are shown in the top row for selected SPLs, indicated by arrows in the middle panels. Oc cells invariably showed precise phase-locking tofm over the entire range of SPLs tested. As illustrated by the example (Fig. 3, left column), period histograms grew more asymmetrical with increasing SPL and developed a small phase lead, but overall these responses were remarkably stable in magnitude and phase over a wide range of SPLs. In contrast, synchronization of type II and type III+IV cells to the AM envelope was highly variable both within and across cells. The type II (middle column) and type IV (right column) responses in Figure3 are well synchronized to the envelope at low SPLs, with phase similar to that of the Oc cell. As SPL was increased, however, synchronization magnitude in both response types showed nonmonotonic behavior accompanied by large changes in phase (Fig.3E,F). At low suprathreshold levels, both cells discharged maximally in the second half of the period histogram (0.5–1 cycles), whereas at high SPLs there was a trough at these phases. Moreover, as is obvious from the period histograms at intermediate levels (illustrated in Fig. 3 at 55 dB for type II and at 25 dB for type IV), the response can be so nonlinear that synchronization at the envelope frequency does not adequately describe the response at these levels. For example, over the range of SPLs where the synchronization to the first harmonic (=fm) fell to a minimum and showed the large shift in phase, both cells showed a large second harmonic (data not shown) that exceeded the first harmonic in amplitude.
Nonmonotonic changes in synchronization magnitude and phase were seen in most type II (7/10) and type III+IV (6/8) cells; in the remaining cells, envelope synchronization was monotonic or was not studied over a wide enough range. Although the examples of Figure 3 are representative, the exact form of the synchronization and phase nonmonotonicities in type II and III+IV cells was idiosyncratic. A more consistent picture, especially for type II cells, is obtained by inspection of period histograms, shown in Figure4 for six examples from each class. At low (≤45 dB) SPLs (Fig. 4A–C, left columns), all cycle histograms are unimodal with similar phase (although the phase is consistently lowest for Occells and highest for type IV cells). The similarity in phase at low SPLs in these three cell types is expected; the cells shown have CFs of >4.5 kHz (one exception; see legend to Fig. 4) and thus undergo small differences in cochlear delay (Joris and Yin, 1992); moreover, phase shifts caused by delay differences are small because of the low modulation frequency used (100 Hz: each one-tenth of a cycle in the period histograms thus corresponds to 1 msec).
Fig. 4.

Examples of period histograms, binned at the modulation frequency fm, for six cells of each response type. For each cell, two histograms are shown: at a low SPL (left, ≤45 dB) and a high SPL (right, ≥65 dB). fm was 100 Hz except for one low-CF Oc cell (top row, CF = 1.4 kHz) for which 50 Hz was used. C, Histograms on the first and second row were from type III cells; others were from type IV cells.
At high (≥65 dB) SPL (Fig. 4A–C, right columns) the histograms are very diverse and can be dominated by higher harmonics, but certain commonalties within each response class are apparent. For Oc cells, the basic period histogram shape and average phase are similar to those at low SPLs, except for an increased asymmetry and superimposed chopping in some cells. In type II cells, the dominant mode at low SPLs is replaced by a trough flanked by one or two modes at high SPLs, and in type IV cells there is a general increase in complexity, sometimes revealing multiple modes. For all cells, at all SPLs, we examined spike timing, relative to envelope phase, over the entire stimulus duration. There was sometimes a slight increase in phase lag of the response modes with increasing poststimulus time, but the basic shape of the period histogram was present throughout the duration of the response.
The AM synchronization behavior of these three response types deviates strongly from that of auditory nerve fibers: for Oc cells in terms of the high gains achieved, and for type II and III+IV cells in terms of the strongly nonlinear response at mid and high SPLs. Auditory nerve fibers sometimes show an increase in envelope synchronization at very high SPLs, but this occurs only in fibers with low CF and is not accompanied by a shift in φm (Joris and Yin, 1992). Intrinsic properties can affect temporal behavior (Manis, 1990; Zhang and Oertel, 1993; Feng et al., 1994) and may contribute to the change in shape of the cycle histogram with SPL, e.g., as seen in the Oc cells, but undoubtedly the complex period histograms are also shaped through interaction of excitatory and inhibitory inputs that have phase-locked responses with different harmonic content. Period histograms of type II cells at high SPLs are consistent with a tightly phase-locked inhibitory input, e.g., from Oc cells, at roughly the same phase as an excitatory input that is temporally more dispersed. Comparison at low and high SPLs (40 and 80 dB, or nearest available values) shows (Fig. 5) that the response phase of Oc cells is restricted in distribution and changes little over a 40 dB range: the points are close to the diagonal of equality. This is not the case for type II cells, which show a restricted phase distribution at low SPLs but a more dispersed distribution at high SPLs. Note that at these high SPLs, at which Oc cells show their highest discharge rates (compare Fig. 3A), significant synchronization of type II cells occurs mostly at phases outside the phase range of Occells. The even greater complexity in the type IV histograms likely reflects phase-dependent interactions of multiple excitatory and inhibitory sources, including the type II cells, which are inhibitory to type IV cells, and parallels the previously described complexity of responses to manipulations in the frequency domain, which are also linear at low SPLs and increasingly nonlinear at mid and high SPLs (Nelken and Young, 1997). The lowest SPLs at which multimodal period histograms started to appear are also in line with this interpretation. For type II cells this was at a median SPL of 25 dB, which is 5 dB higher than the median rate threshold of the Oc cells in this sample, and in type III+IV cells multimodal period histograms started to appear at a median SPL of 20 dB, which is 5 dB higher than the median rate threshold of type II cells in this sample.
Fig. 5.

Comparison of phase tofm, for type II and Occells, at low (abscissa) and high (ordinate) sound level. Each datapoint shows response phase for one cell at 40 and 80 dB SPL, or at the nearest SPL that gave significant synchronization (low SPL was taken at 45 dB in 1 cell; high SPL was taken at 70 dB in 3 cells). Distribution of phases of Oc cells was within a narrow range at both low and high SPL (range = 0.26 and 0.23 cycles, respectively; median phase = 0.51 and 0.45 cycles). The distribution of type II cells was within a narrow range at low SPL (0.37 cycles; median phase = 0.72). At high SPL it was more dispersed and showed an absence of values over the range at which most Oc cells responded, consistent with an inhibitory input of Oc to type II cells.
The nonmonotonic and nonlinear behavior just described was not emphasized in previous studies of AM responses in the DCN. For example,Rhode and Greenberg (1994) found Pauser/Buildup units “to be exceptionally capable of encoding AM signals as long as thefm was relatively low (i.e., < 600 Hz).” The scant data that exist on AM responses in type II cells also show good envelope phase-locking (Kim et al., 1990; Zhao and Liang, 1995). It is important, therefore, to rule out differences in experimental variables (e.g., anesthesia, our inclusion of recordings in DAS) as a cause of discrepancies. In the following three figures, we proceed with a linear analysis of phase-locking and find that within the limits of that analysis, our results are consistent with previous reports.
For each cell we measured the maximal Rm value, defined as the maximum in the synchronization level function obtained with fm of 100 Hz. Oc cells had uniformly high gain when compared with auditory nerve fibers (Fig.6). High maximum values were also found in some type II and III+IV cells, but the values for these cells were more varied. Median values were 0.93 for Oc(n = 12), 0.79 for type II (n = 10), and 0.75 for type III+IV (n = 7).
A limited number of cells were held long enough to obtain complete modulation transfer functions (MTFs), which characterize the dependence of envelope synchronization on modulation frequency. AM stimuli of increasing fm were presented at low suprathreshold SPLs, where single-mode cycle histograms were obtained (Fig. 3D–F), and also at higher SPLs if time allowed. From the 45 MTFs obtained we selected one function for each cell, shown in Figure 7. When multiple MTFs were available we selected the function with the highest maximalRm value. In one type II and one type IV cell there was a sharp notch in envelope synchronization over a narrowfm range, but for the remaining cells the MTF could be described as low-pass or bandpass. Type III+IV cells showed maximal synchronization near 100–200 Hz and generally had lower synchronization values than Oc or type II cells. The most striking difference between response classes was in the width of the MTFs; widest in Oc, narrowest in type III+IV, and intermediate in type II cells. The upper cutoff frequencies, taken at 3 dB down from the maximum (Joris and Yin, 1992), are compared with identical measurements from a population of nerve fibers in Figure8. For CFs >10 kHz, the cutoff frequencies of Oc cells were within the range of auditory nerve fibers, whereas the cutoff frequencies of type II and III+IV cells were well below the lowest cutoff frequencies in nerve fibers of similar CFs. Thus, Oc cells stand out by a consistently high synchronization gain to the envelope frequency (Fig. 6), over a wide range of SPLs and fm values.
Fig. 7.
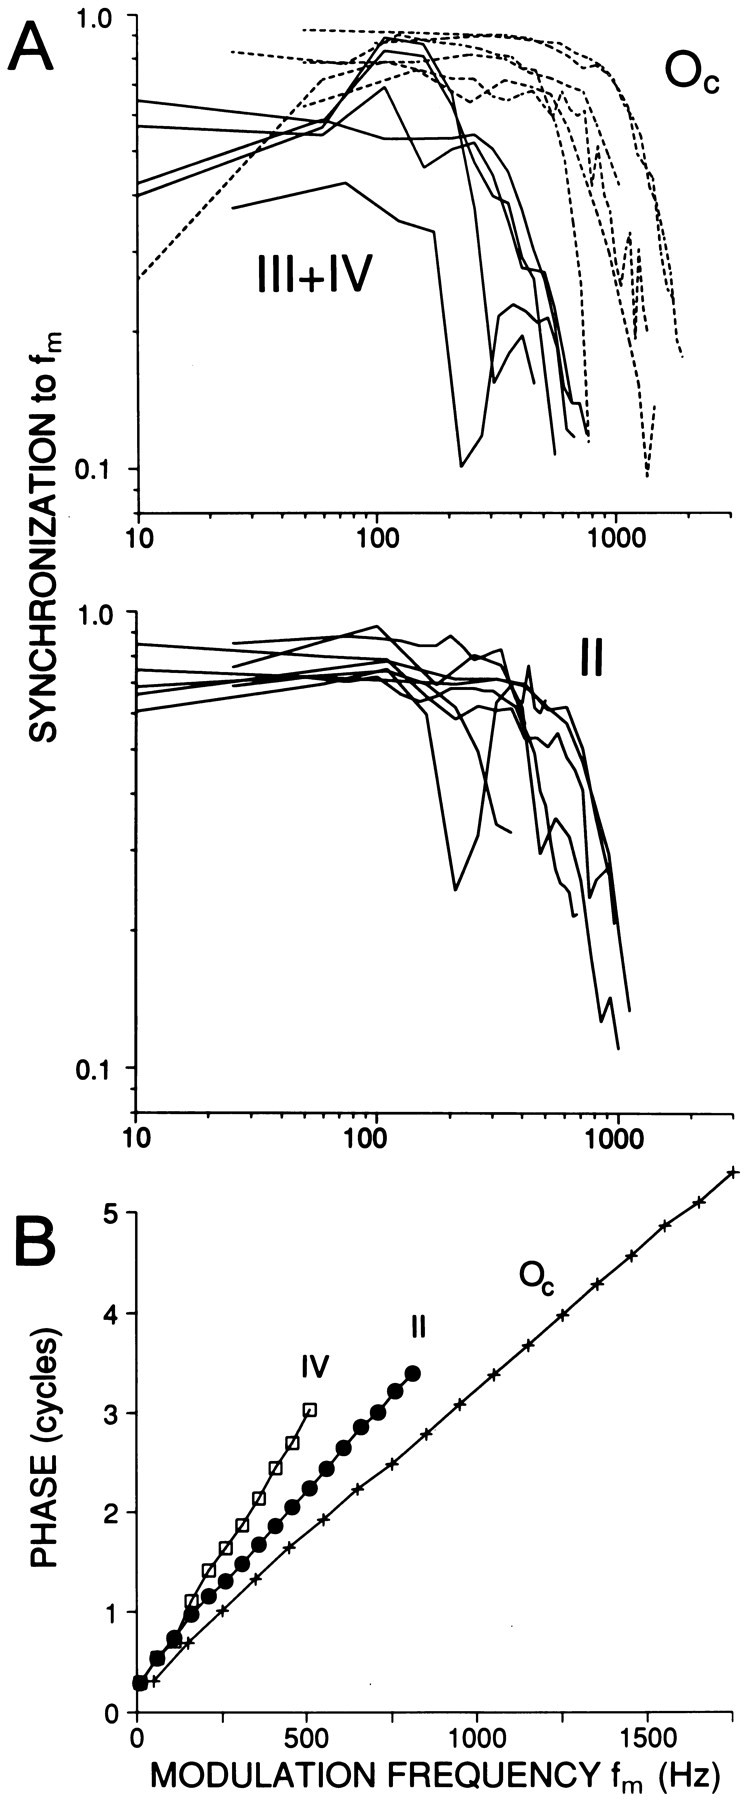
A, Modulation transfer functions for different response classes in DCN. Oc,Dashed lines; type III+IV, solid lines. Only one cell in the III+IV group was type III. Range of SPLs was 20–55 dB for type II (n = 8), 10–50 dB for type III+IV (n = 5), and 30–70 dB for Oc(n = 6). B, Examples of cumulated phase-frequency functions for cells of similar CF of each response type. CFs were 25.9 (type IV), 24.7 (type II), and 23.6 (Oc); SPL was 30 dB.
Figure 7B shows three examples of phase-frequency functions, obtained by accumulating response phase as a function of modulation frequency, for cells with a similar CF. Phase values are only graphed over the range of significant response modulation. The three functions converge to a y-intercept near 0.25 cycles, consistent with the sine starting phase of the stimulus envelope (see equation in Materials and Methods), and clearly differ in slope. This slope reflects the total delay accrued between acoustic stimulus and cell discharge and was measured by fitting a linear regression through the phase-frequency functions as described in previous publications (e.g., Joris and Yin, 1992). The regressions all had r2 values >0.987. Figure 2C shows the slopes of the linear regressions as a function of CF. Again, Oc cells show the smallest values, which differed significantly (MW-U,p < 0.01) from other DCN cells.
Response to contralateral stimulation
Mast (1970) showed that many DCN cells in chinchilla were inhibited by contralaterally presented tones, at thresholds close to the ipsilateral excitatory threshold (median difference 7 dB) and with similar latency. Hochfeld (1973) presented similar findings for the cat, although with greater threshold (mean of 31 dB) and latency differences (mostly 10–20 msec). Judged on location, presence of spontaneous activity, and PSTH shape, most of these cells were likely type III+IV cells. Young and Brownell (1976) also found predominantly inhibitory contralateral effects in DCN of the decerebrate cat and reported that effects were weaker and more variable for contralateral tones than for broadband noise. Indeed, they reported that the response to binaural noise was intermediate between the ipsilateral (excitatory) response and the contralateral (inhibitory) response, which suggested a functional relevance for these binaural interactions in natural listening conditions.
We studied effects of contralateral or binaural stimulation in 20 DCN and 50 DAS units. The easiest way to detect an effect was by examining SR while stimulating the contralateral ear with broadband noise. Examples are shown in Figure 9 for a type IV (A) and a type III (B) cell. In both cells contralateral noise (○) suppressed SR to levels near zero. A summary for all cells tested is shown in Figure10: circles indicate SR, and the “T” and inverted-T symbols indicate maximum firing rate to ipsilateral and minimum firing rate to contralateral noise, respectively, obtained from rate level functions as in Figure9A,B. In all units tested (n = 52), we consistently found inhibition of SR by contralaterally presented broadband noise. The inhibition was not a spurious effect caused by acoustic cross talk, because the dominant effect of contralaterally presented noise was opposite to that of ipsilaterally presented noise, i.e., inhibition rather than excitation, and because the threshold for contralateral inhibition was usually close to that of ipsilateral excitation (on average 8 dB higher than ipsilateral excitatory threshold; range −20 to + 30 dB). Effects on SR were hard to detect with contralateral tones, delivered as a search stimulus over a range of frequencies and SPLs. Of eight units tested quantitatively with monaural contralateral tones, at a frequency equal to the ipsilateral CF, only half showed an inhibitory effect at high SPLs (see below and Figs. 11, 12).
Fig. 10.

Summary of spontaneous rate, maximal rate to ipsilaterally and binaurally presented noise, and minimal rate to contralateral noise (DAS recordings, ○; DCN recordings, ⊙). The first seven cells were tested only with monaural contralateral noise. The effect of binaural noise was tested in the last 14 cells (cells 39–52). Within groups, cells are ranked according to increasing response to ipsilateral noise (increasing spontaneous rate for cells 1–7). Inhibition to binaural noise was observed in only one cell (cell 39). Some cells were not classified because of short recording time (n = 16; almost all in DAS). All other cells were type III+IV.
Fig. 11.

The excitatory response of a type III cell to an ipsilateral CF tone of increasing SPL is inhibited by a contralaterally presented broadband noise (left column) or tone (right column). The ipsilateral CF tone (10 kHz) was identical for both columns: it started at 0 msec and was 200 msec in duration, and its SPL was increased in 10 dB steps, as indicated on theright. The contralateral stimulus was delayed by 100 msec relative to the ipsilateral stimulus, its duration was 50 msec (brackets on top), and it was at a constant level (left, 59 dB, measured over one-third octave centered at CF; right, 80 dB SPL). These responses are from the cell with the largest inhibition to contralateral tones in our sample.
Fig. 12.

Time course of contralateral inhibition in three cells. Each row shows responses for one cell. The ipsilateral ear was stimulated with a CF tone at a low SPL (A–F, 25, 20, 25, 10, 10, and 35 dB), which started at 0 msec and was 600 msec in duration (300 msec in C). The contralateral ear was stimulated after a delay of 100 or 200 msec (onset and offset indicated by markers). A–C, Stimulation of the contralateral ear with a broadband noise (A, B) or tone (C, same frequency as ipsilateral ear) caused inhibition. This inhibition was rapid in onset and was sustained over the duration of the stimulus (100 msec). Contralateral levels were 85, 62, and 80 dB SPL. D–F, These same cells showed inhibition to a 500 msec contralateral tone that was amplitude-modulated at 50 Hz, but only for the cell shown inF did the inhibition entrain to the stimulus envelope. Contralateral levels were 80, 60, and 80 dB SPL. Response type, recording site, and CF: top row, type IV in DAS, 14.7 kHz; middle row, type III in DAS, 4.3 kHz; bottom row, type III in DCN, 10 kHz. Binwidth is 10 msec in A, B; 5 msec in C; 4 msec inD–F.
Because of the pervasiveness of inhibition by contralateral noise, a control experiment with identical stimuli was performed in the auditory nerve. Ten high-SR and two medium-SR auditory nerve fibers were tested (CF range, 2.5–21.0 kHz) with monaural ipsilateral and contralateral noise over a wide range of SPLs. In none of these was there was a detectable suppression of SR by contralateral stimulation, as illustrated for a high-SR fiber in Figure 9C.
The inhibition of spontaneous activity by contralateral noise was not only consistently present and low in threshold; it was also profound, diminishing firing rates to low values in most cells (Fig. 10: median decrease in firing rate = 29 spikes/sec, median spontaneous rate = 35 spikes/sec). This was not generally the case for inhibitory effects on the response evoked by ipsilateral stimuli. In 14 cells (all type III+IV), we presented noise binaurally at an equal level over a range of SPLs. Two examples are shown in Figure 9(A,B, diamonds). The response to binaural stimulation was lower than that to monaural ipsilateral stimulation, but in relative terms the effect was small, despite the clear inhibition of spontaneous activity by monaural contralateral stimuli. The × symbols in Figure 10 indicate the maximum rate to binaural stimulation for all cells. The inhibitory effect, measured as the difference between the maximum ipsilateral response and maximum binaural response, did not scale with ipsilateral response magnitude. The median decrease in firing rate was 22 spikes/sec. In only one cell (Fig. 10; cell ranked number 39) was the binaural response inhibited below spontaneous rate.
Before concluding that the inhibitory effect of the contralateral ear was weak, we further tested type III+IV cells with more natural interaural differences. To free-field sources, head and pinnae of the cat generate interaural level differences (ILDs), which can be ∼20–30 dB at high frequencies (Irvine, 1987; Musicant et al., 1990;Rice et al., 1992). We obtained ILD functions by holding the level at the ipsilateral ear constant while varying the level at the contralateral ear. In all cases examined (n = 14), firing rate decreased with increasing contralateral level, but the decrease was much smaller than that obtained in well characterized binaural cells, e.g., in the LSO, where inhibition is virtually complete at 0 ILD (Boudreau and Tsuchitani, 1968). The largest effect was seen in the cell of Figure 9B, and a series of ILD functions for this cell is shown in Figure 9D, with ipsilateral level as the parameter. For each function the level of the ipsilateral ear was held constant at the value indicated, whereas the level of the contralateral ear was increased from positive ILDs (defined as contralateral level > ipsilateral level) to negative ILDs. Even for positive ILDs near the upper limit of the physiological range, the cell was not completely inhibited. Moreover, unlike LSO cells, the largest inhibitory effect was a nearly equal number of spikes/second across functions, independent of ipsilateral level. This was particularly evident when the functions in Figure 9Dwere graphed (data not shown) as a function of contralateral SPL, which was varied over the same range for all functions. The largest inhibitory effect, measured as the difference in firing rate between maximum and minimum of the ILD function, on average was 62.3 spikes/sec (range, 48.3–76.0) for Figure 9D (average for five other cells was 32.5 spikes/sec; range, 19.3–52.5).
The rather weak binaural effects described so far do not preclude that contralateral ear stimulation is significant in a full-cue, natural sound field, where different azimuthal sound source positions generate ILDs with reciprocal level changes in the two ears as well as spectral differences (Musicant et al., 1990). Limited data (not shown) to “virtual space” stimuli, obtained to binaural noise filtered by head-related transfer functions (technique as described in Delgutte et al., 1995), suggest indeed that inhibition of type III+IV cells by contralateral ear stimulation can be profound within the physiological range of cues, if the full complement of cues is present in their natural combination.
Various descending projections to the CN exist (Conlee and Kane, 1982; Brown et al., 1988; Weedman and Ryugo, 1996; Ostapoff et al., 1997), and an estimate of the latency and time course of the contralateral inhibition may narrow down the possible sources involved. We presented a contralateral stimulus during the sustained portion of the response to long ipsilateral CF tones in 10 type III+IV cells. A range of ipsilateral and contralateral settings was explored, and in most cases a setting could be found resulting in a sustained reduction of driven rate with a fast time course of onset. Figure 11 shows a level series of responses of one cell to a 200 msec CF tone, while a broadband noise burst (left column) or tone of the same frequency (right column) was delivered to the contralateral ear at a constant level but with a 100 msec delay. The inhibition is stronger for contralateral noise than tones and is only profound for spontaneous activity or at low ipsilateral SPLs, but its onset is fast. Three more examples are shown in Figure12A,B (contralateral noise) and C (contralateral tone). Inhibition reached its full strength within ∼20–30 msec of contralateral stimulus onset, but not enough stimulus repetitions were available to derive a more precise estimate of the onset of inhibition. We attempted to estimate this onset with two additional procedures. First, we tried a technique used earlier on cells in the LSO (Joris, 1996) that are also excited by one ear and inhibited by the other. A sustained CF tone was presented to the excitatory ear and an AM tone or AM noise to the inhibitory ear, and the average phase of the response was calculated. Measurement of cumulated phase as a function of modulation frequency then gives an estimate of the contralateral inhibitory group delay (compare Fig. 7B). Unfortunately, the contralateral inhibitory effect appeared sluggish and did not follow the envelope of contralateral AM tones or AM noise (Fig. 12D,E). Only in one cell—strongly inhibited by contralateral tones (Fig.12C)—was significant envelope phase-locking up to 250 Hz obtained after extensive exploration of binaural parameters (Fig.12F). The group delay relative to the onset of the contralateral stimulus was 5.7 msec. Comparison of monaural and binaural responses (e.g., response phase to ipsilateral and contralateral AM) indicated that the phase-locked response was not caused by acoustic cross talk. Second, we selected 20 type III+IV cells that showed inhibition of spontaneous activity with a well defined time course and averaged their individual PSTHs to an identical stimulus (100 msec contralateral broadband noise burst at 70 dB; this was the highest level at which none of the cells showed evidence of acoustic cross talk). This population PSTH was then compared with a population PSTH for the same stimulus presented ipsilaterally (Fig.13, bottom). The latency for a 20% reduction in SR to contralateral stimulation was 6.6 msec, whereas the latency for a 20% increase in firing rate to ipsilateral stimulation was 3.8 msec. Figure 13 also shows population PSTH histograms for auditory nerve fibers and cells in AVCN with primary-like-with-notch (PLN) or chopper responses. Inhibition of SR by contralateral noise was clearly present in choppers, with a latency of 5.7 msec, but was not seen in auditory nerve and PLN cells. Interestingly, a prolonged offset inhibition was present in the type III+IV neurons for both ipsilateral and contralateral stimulation, but not in the chopper cells.
The time course of contralateral inhibition in choppers and type III+IV cells, and the absence of inhibition in the auditory nerve, exclude the possibility that this inhibition is caused by olivocochlear suppression of type I auditory nerve fibers. Such suppression has a time course that is about an order of magnitude slower, and its effect on SR is slight (Warren and Liberman, 1989a,b). It is questionable whether descending inputs from midbrain or even superior olivary complex could provide contralateral inhibition with sufficiently short onset latency, but these sources may contribute to the later, sustained part of the inhibition. Particularly in the cat, minimum latencies of olivocochlear fibers are longer than the onset of contralateral inhibition in the CN observed here (Liberman and Brown, 1986; Gummer et al., 1988; Brown, 1989), and the same applies to cells in the IC (Irvine and Jackson, 1983; Kuwada et al., 1984). The contralateral inhibition of cells in the LSO, which occurs via fast conducting axons and powerful synapses, has a minimum latency of ∼4.3 msec [Joris and Yin (1998); group delay + acoustic delay], and estimates based on first spike latency using tones with 2.5 msec rise time are longer, at values >6 msec (Tsuchitani, 1997). Considering (1) the extra distance to the DCN, (2) the longer rise time used here (4 msec), (3) the lack of evidence for any known fast-conducting inhibitory pathway from the superior olivary complex to the CN, and (4) the extensive projections from periolivary cell groups to the CN (Ostapoff et al., 1997) and the generally longer latencies that are recorded in periolivary regions (Tsuchitani, 1977), it is unlikely that the short-latency contralateral inhibition of DCN would be derived through a link in this complex.
DISCUSSION
Temporal properties
Physiological dissection of DCN circuitry has made use mainly of spectral stimulus manipulations (for review, see Young, 1998). We provide evidence that in the time domain, responses are consistent with the circuitry proposed from these earlier experiments. Responses of interneurons (type II) and projection neurons (type III+IV) to clicks indicate a source of short-latency inhibition. The inhibition is particularly strong in type II cells, most of which were completely unresponsive to clicks, but was more variable and transient in type III+IV cells, which showed an excitatory response sometimes preceded by inhibition. Because type II cells were not responsive to clicks, they cannot be the source of the early inhibition to type III+IV cells. To all stimuli tested, Oc cells had the shortest latency. These cells are probably glycinergic and project to the DCN (Smith and Rhode, 1989), and therefore they are a likely source of the short-latency inhibition to type II and III+IV cells. A common source of inhibition that is strong to type II and weaker to III+IV cells was suggested earlier (Nelken and Young, 1994), and is consistent with results from electrical stimulation of the auditory nerve (Shofner and Young, 1985; O’Leary et al., 1994) and with numerous previous studies (Smith and Rhode, 1985; Caspary et al., 1987; Snyder and Leake, 1988;Oertel et al., 1990; Saint Marie et al., 1991; Evans and Zhao, 1993;Zhang and Oertel, 1993, 1994).
Early studies found that the timing properties of the DCN were inferior to those of the ventral CN (Lavine, 1971; Goldberg and Brownell, 1973;Godfrey et al., 1975b; van Gisbergen et al., 1975a,b; Rhode and Smith, 1986b), but later studies emphasized good envelope phase-locking and even proposed specific roles for the DCN in processing temporal information (Kim et al., 1990; Frisina et al., 1994; Rhode and Greenberg, 1994; Langner and Schreiner, 1996). If synchronization to the envelope frequency of the AM stimulus is considered, our data on type II and III+IV cells agree with previous studies in terms of high maximal Rm values (Fig. 6) and low upper-cutoff frequencies (Fig. 8) (Kim et al., 1990; Rhode and Greenberg, 1994; Zhao and Liang, 1995). However, the most striking feature of these cells was the increasingly nonlinear response to AM stimuli of increasing SPLs (Figs. 3, 4). At low SPLs, period histograms showed a unimodal response peak. With increasing SPLs, this peak was replaced in type II cells by an inhibitory trough flanked by one or two excitatory modes, as would be expected from increasing recruitment of Oc cells, which showed high synchronization values at all SPLs with little change in phase. In type III+IV cells the period histograms were even more complex, presumably reflecting an interaction of multiple sources of inhibition and excitation—whose amplitude, time course, and phase relationships changed with SPLs—with intrinsic membrane properties. The temporally nonlinear response of type II and III+IV cells differs drastically from that of LSO cells, whose response to binaural AM stimuli conforms well to a linear summation of ipsilateral excitatory and contralateral inhibitory inputs (Joris, 1996).
Nonmonotonicities are present in some examples of the linear analysis by Rhode and Greenberg (1994), but the coarse sampling as a function of SPL and the absence of phase data make them less apparent. Complex behavior in some DCN units was also reported by Zhao and Liang (1995)and Schreiner and Snyder (1987). Our findings largely agree with these studies in terms of the high gain often found to AM stimuli, but the nonlinearity of the responses calls into question the functional use of this envelope information. The complexities in envelope phase-locking of type II and III+IV cells make these cells ill-suited as straightforward “envelope encoders” (Langner and Schreiner, 1996). Of course, it remains possible that envelope information at this level is not encoded as “following” of the stimulus envelope waveform, but rather in a more subtle form of temporal patterns within or across cells.
Binaural properties
Stimulation of the contralateral ear had weak but consistent inhibitory effects. Contralateral noise bursts inhibited spontaneous activity of all type III+IV cells tested, in both DCN and DAS, but had generally only weak effects on ipsilaterally evoked activity. Interaction of binaural stimuli was very different from that observed in the LSO (Boudreau and Tsuchitani, 1968): the maximal effect of contralateral ear stimulation was a roughly constant decrease in firing rate, independent of the ipsilateral SPL, as observed previously byMast (1970). Moreover, the contralateral effects appeared temporally much more sluggish than those in the LSO (Joris and Yin, 1998).
Our results are consistent with those of Young and Brownell (1976), but they differ in one respect. These authors reported that responses of type IV cells to binaural noise differed significantly from ipsilateral responses, which suggested a functional relevance for these binaural interactions in natural listening conditions. However, we found that responses to equal level binaural noise bursts were generally close in firing rate to the monaural ipsilateral response (Figs.9A,B, 10). We tested a small sample of type III+IV cells with additional binaural paradigms. The results suggest that binaural effects may nonetheless be significant in a natural setting, where ILDs are combined with spectral cues, but more work is needed to substantiate this finding.
The inhibition through the contralateral ear had short latency but was temporally sluggish, as was apparent in the difficulty to obtain inhibition phase-locked to amplitude-modulated noise or tones (Fig.12D–F). The weakness and sluggishness of inhibition made a precise latency measurement difficult, but in agreement with Mast (1970), Hochfeld (1973), and Evans and Zhao (1993), the latency was not much longer than that to ipsilateral excitation: the onset of inhibition was <7 msec, and the effect was fully developed within 20–30 msec. The short onset latency leaves little room in terms of number of synapses and conduction speeds involved. In the final section we argue that the Oc cells play a key role in the contralateral inhibition, as they do in the ipsilateral inhibition.
The pivotal role of Oc cells
Oc response patterns were first described by Godfrey et al. (1975a,b) (“on-type L” category), and were later tied to a specific morphological class (Rhode and Smith, 1986a; Smith and Rhode, 1989). These and other studies drew attention to the remarkable properties of these cells, including a wide dynamic range, broad frequency tuning, excellent phase-locking to envelopes and low-frequency tones, and their likely inhibitory nature. The response of these cells to broadband noise is higher than that to tones (Winter and Palmer, 1995; Joris, 1998), presumably because of a requirement of coincident input activity across a range of CFs (Winter and Palmer, 1995; Palmer et al., 1996). Oc cells have been proposed to be the “wide-band inhibitor” needed to explain the spectral nonlinear behavior of type IV cells (Nelken and Young, 1994; Winter and Palmer, 1995).
We found that Oc cells show excellent envelope phase-locking over a wide range of SPLs and fmvalues, in agreement with Rhode and Greenberg (1994). As already mentioned, the temporal properties of these cells are consistent with their hypothesized inhibitory influence on type II and III+IV cells. Moreover, the binaural effects in type III+IV cells, in combination with previous tracing, immunocytochemical, and pharmacological observations (Pirsig et al., 1968; Cant and Gaston, 1982; Wenthold, 1987; Osen et al., 1990; Kolston et al., 1992; Evans and Zhao, 1993;Schofield and Cant, 1996), are consistent with the hypothesis that Oc cells also provide glycinergic contralateralinhibition of type III+IV cells. This inhibition is weak to tones and strong to broadband noise, and has a short latency—properties also found in Oc cells. In addition, we have preliminary direct evidence (our unpublished results) from intra-axonal labeling studies that Oc cells constitute the commissure between the cochlear nuclei.
One puzzling observation, if indeed the Oc cells directly supply the contralateral inhibition, is the near-absence of envelope phase-locking. Possibly this reflects distal placement of the inhibitory input on the dendritic tree of fusiform cells (Smith and Rhode, 1985), as also supported by the observation that the inhibition is not able to overcome ipsilateral excitation (Fig.9D) (Vu and Krasne, 1992). Other factors that may be important are the variable axonal thickness, divergent pattern, and diffuse course of the commissural projection.
Somewhat paradoxically, Oc cells have received a lot of attention precisely because of their exquisite temporal behavior (Kim et al., 1990; Rhode and Greenberg, 1994; Rhode and Smith, 1986a), yet we find that temporal behavior in their suspected postsynaptic targets is complex (in ipsilateral DCN) or weak (in contralateral DCN). The temporal properties of Oc cells may prove important through their participation in other circuits (Benson and Brown, 1990; Young et al., 1995) or may acquire new meaning as the nonlinear temporal responses of DCN cells are further explored. The present results, however, suggest that it is the spectral rather than the temporal properties of these cells that fit with general notions of DCN function.
Footnotes
This work was supported by National Institute on Deafness and Other Communication Disorders Grant DC-00116 and National Science Foundation Grant BNS-8901993. The Fund for Scientific Research–Flanders (Belgium) provided travel support. We thank Eli Nelken for his incisive comments, Ravi Kochhar and Jane Sekulski for software development, G. Meulemans for photography, and Tom C. T. Yin for support and encouragement.
Correspondence should be addressed to Philip X. Joris, Division of Neurophysiology, K.U. Leuven, Campus Gasthuisberg, B-3000 Leuven, Belgium.
REFERENCES
- 1.Adams JC, Warr WB. Origins of axons in the cat’s acoustic striae determined by injection of horseradish peroxidase into severed tracts. J Comp Neurol. 1976;170:107–122. doi: 10.1002/cne.901700108. [DOI] [PubMed] [Google Scholar]
- 2.Benson TE, Brown MC. Synapses formed by olivocochlear axon branches in the mouse cochlear nucleus. J Comp Neurol. 1990;295:52–70. doi: 10.1002/cne.902950106. [DOI] [PubMed] [Google Scholar]
- 3.Boudreau JC, Tsuchitani C. Binaural interaction in the cat superior olive S segment. J Neurophysiol. 1968;31:442–454. doi: 10.1152/jn.1968.31.3.442. [DOI] [PubMed] [Google Scholar]
- 4.Brown MC. Morphology and response properties of single olivocochlear fibers in the guinea pig. Hear Res. 1989;40:93–110. doi: 10.1016/0378-5955(89)90103-2. [DOI] [PubMed] [Google Scholar]
- 5.Brown MC, Liberman MC, Benson TE, Ryugo DK. Brainstem branches from olivocochlear axons in cats and rodents. J Comp Neurol. 1988;278:591–603. doi: 10.1002/cne.902780410. [DOI] [PubMed] [Google Scholar]
- 6.Cant NB, Gaston KC. Pathways connecting the right and left cochlear nuclei. J Comp Neurol. 1982;212:313–326. doi: 10.1002/cne.902120308. [DOI] [PubMed] [Google Scholar]
- 7.Caspary DM, Pazara KE, Kossl M, Faingold CL. Strychnine alters the fusiform cell output from the dorsal cochlear nucleus. Brain Res. 1987;417:273–282. doi: 10.1016/0006-8993(87)90452-5. [DOI] [PubMed] [Google Scholar]
- 8.Chan JCK, Musicant A, Hind JE. An insert earphone system for delivery of spectrally-shaped signals for physiological studies. J Acoust Soc Am. 1993;93:1496–1501. doi: 10.1121/1.406807. [DOI] [PubMed] [Google Scholar]
- 9.Conlee JW, Kane ES. Descending projections from the inferior colliculus to the dorsal cochlear nucleus in the cat: an autoradiographic study. Neuroscience. 1982;7:161–178. doi: 10.1016/0306-4522(82)90158-0. [DOI] [PubMed] [Google Scholar]
- 10.Delgutte B, Joris PX, Litovsky RY, Yin TCT. Relative importance of different acoustic cues to the directional sensitivity of inferior colliculus neurons. In: Manley GA, Klump GM, Köppl C, Fastl H, Oeckinghaus H, editors. Advances in hearing research. World Scientific; Singapore: 1995. pp. 288–299. [Google Scholar]
- 11.Evans EF, Nelson PG. The responses of single neurones in the cochlear nucleus of the cat as a function of their location and the anaesthetic state. Exp Brain Res. 1973;17:402–427. doi: 10.1007/BF00234103. [DOI] [PubMed] [Google Scholar]
- 12.Evans EF, Zhao W. Varieties of inhibition in the processing and control of processing in the mammalian cochlear nucleus. Prog Brain Res. 1993;97:117–126. doi: 10.1016/s0079-6123(08)62269-4. [DOI] [PubMed] [Google Scholar]
- 13.Feng JJ, Kuwada S, Ostapoff E-M, Batra R, Morest DK. A physiological and structural study of neuron types in the cochlear nucleus. I. Intracellular responses to acoustic stimulation and current injection. J Comp Neurol. 1994;346:1–18. doi: 10.1002/cne.903460102. [DOI] [PubMed] [Google Scholar]
- 14.Frisina RD, Walton JP, Karcich KJ. Dorsal cochlear nucleus single neurons can enhance temporal processing capabilities in background noise. Exp Brain Res. 1994;102:160–164. doi: 10.1007/BF00232448. [DOI] [PubMed] [Google Scholar]
- 15.Gibson DJ. Interaural crosstalk in the cat. Hear Res. 1982;7:325–333. doi: 10.1016/0378-5955(82)90043-0. [DOI] [PubMed] [Google Scholar]
- 16.Godfrey DA, Kiang NYS, Norris BE. Single unit activity in the posteroventral cochlear nucleus of the cat. J Comp Neurol. 1975a;162:247–268. doi: 10.1002/cne.901620206. [DOI] [PubMed] [Google Scholar]
- 17.Godfrey DA, Kiang NYS, Norris BE. Single unit activity in the dorsal cochlear nucleus of the cat. J Comp Neurol. 1975b;162:269–284. doi: 10.1002/cne.901620207. [DOI] [PubMed] [Google Scholar]
- 18.Goldberg JM, Brown PB. Response of binaural neurons of dog superior olivary complex to dichotic tonal stimuli: some physiological mechanisms of sound localization. J Neurophysiol. 1969;22:613–636. doi: 10.1152/jn.1969.32.4.613. [DOI] [PubMed] [Google Scholar]
- 19.Goldberg JM, Brownell WE. Discharge characteristics of neurons in anteroventral and dorsal cochlear nucleus of cat. Brain Res. 1973;64:35–54. doi: 10.1016/0006-8993(73)90169-8. [DOI] [PubMed] [Google Scholar]
- 20.Guinan JJ, Norris BE, Guinan SS. Single auditory units in the superior olivary complex. II: Locations of unit categories and tonotopic organization. Int J Neurosci. 1972;4:147–166. [Google Scholar]
- 21.Gummer M, Yates GK, Johnstone BM. Modulation transfer function of efferent neurones in the guinea pig cochlea. Hear Res. 1988;36:41–52. doi: 10.1016/0378-5955(88)90136-0. [DOI] [PubMed] [Google Scholar]
- 22.Hochfeld PR. Binaural interactions in the cat’s cochlear nucleus. BS and MS thesis. MIT; 1973. [Google Scholar]
- 23.Irvine DRF. Interaural intensity differences in the cat: changes in sound pressure level at the two ears associated with azimuthal displacements in the frontal horizontal plane. Hear Res. 1987;26:267–286. doi: 10.1016/0378-5955(87)90063-3. [DOI] [PubMed] [Google Scholar]
- 24.Irvine DRF, Jackson GD. Auditory input to neurons in mesencephalic and rostral pontine reticular formation: an electrophysiological and horseradish peroxidase study in the cat. J Neurophysiol. 1983;49:1319–1333. doi: 10.1152/jn.1983.49.6.1319. [DOI] [PubMed] [Google Scholar]
- 25.Joris PX. Envelope coding in the lateral superior olive. II. Characteristic delays and comparison with responses in the medial superior olive. J Neurophysiol. 1996;76:2137–2156. doi: 10.1152/jn.1996.76.4.2137. [DOI] [PubMed] [Google Scholar]
- 26.Joris PX. Response classes in the dorsal cochlear nucleus and its output tract in the chloralose-anesthetized cat. J Neurosci. 1998;18:3955–3966. doi: 10.1523/JNEUROSCI.18-10-03955.1998. [DOI] [PMC free article] [PubMed] [Google Scholar]
- 27.Joris PX, Yin TCT. Responses to amplitude-modulated tones in the auditory nerve of the cat. J Acoust Soc Am. 1992;91:215–232. doi: 10.1121/1.402757. [DOI] [PubMed] [Google Scholar]
- 28.Joris PX, Yin TCT. Envelope coding in the lateral superior olive. I. Sensitivity to interaural time differences. J Neurophysiol. 1995;73:1043–1062. doi: 10.1152/jn.1995.73.3.1043. [DOI] [PubMed] [Google Scholar]
- 29.Joris PX, Yin TCT. Envelope coding in the lateral superior olive. III. Comparison with afferent pathways. J Neurophysiol. 1998;79:253–269. doi: 10.1152/jn.1998.79.1.253. [DOI] [PubMed] [Google Scholar]
- 30.Joris PX, Smith PH, Yin TCT. Responses and projections of dorsal and intermediate stria axons, labeled with HRP or neurobiotin. Assoc Res Otolaryngol Abstr. 1992;15:58. [Google Scholar]
- 31.Kim DO, Sirianni JG, Chang SO. Responses of DCN-PVCN neurons and auditory nerve fibers in unanesthetized decerebrate cats to AM and pure tones: analysis with autocorrelation/power-spectrum. Hear Res. 1990;45:95–113. doi: 10.1016/0378-5955(90)90186-s. [DOI] [PubMed] [Google Scholar]
- 32.Kolston J, Osen KK, Hackney CM, Ottersen OP, Storm-Mathisen J. An atlas of glycine- and GABA-like immunoreactivity and colocalization in the cochlear nuclear complex of the guinea pig. Anat Embryol. 1992;186:443–465. doi: 10.1007/BF00185459. [DOI] [PubMed] [Google Scholar]
- 33.Kuwada S, Yin TCT, Syka J, Buunen TJF, Wickesberg RE. Binaural interaction in low-frequency neurons in inferior colliculus of the cat. IV. Comparison of monaural and binaural response properties. J Neurophysiol. 1984;51:1306–1325. doi: 10.1152/jn.1984.51.6.1306. [DOI] [PubMed] [Google Scholar]
- 34.Langner G, Schreiner CE. Advances in speech, hearing and language processing, Vol 3B, pp 447–461. JAI Press; Greenwich, CT: 1996. Contributions of the auditory brainstem to periodicity pitch coding. [Google Scholar]
- 35.Lavine RA. Phase-locking in response of single neurons in cochlear nuclear complex of the cat to low-frequency tonal stimuli. J Neurophysiol. 1971;24:467–483. doi: 10.1152/jn.1971.34.3.467. [DOI] [PubMed] [Google Scholar]
- 36.Liberman MC, Brown MC. Physiology and anatomy of single olivocochlear neurons in the cat. Hear Res. 1986;24:17–36. doi: 10.1016/0378-5955(86)90003-1. [DOI] [PubMed] [Google Scholar]
- 37.Manis PB. Membrane properties and discharge characteristics of guinea pig dorsal cochlear nucleus neurons studied in vitro. J Neurosci. 1990;10:2338–2351. doi: 10.1523/JNEUROSCI.10-07-02338.1990. [DOI] [PMC free article] [PubMed] [Google Scholar]
- 38.Mast TE. Binaural interaction and contralateral inhibition in dorsal cochlear nucleus of the chinchilla. J Neurophysiol. 1970;33:108–115. doi: 10.1152/jn.1970.33.1.108. [DOI] [PubMed] [Google Scholar]
- 39.Mast TE. Dorsal cochlear nucleus of the chinchilla: excitation by contralateral sound. Brain Res. 1973;62:61–70. doi: 10.1016/0006-8993(73)90619-7. [DOI] [PubMed] [Google Scholar]
- 40.Moore DR, Hutchings ME, Semple MN, Addison PD, Aitkin LM. Properties of spatial receptive fields in the central nucleus of the inferior colliculus. II. Stimulus intensity effects. Hear Res. 1984;13:175–188. doi: 10.1016/0378-5955(84)90107-2. [DOI] [PubMed] [Google Scholar]
- 41.Musicant AD, Chan JCK, Hind JE. Direction-dependent spectral properties of cat external ear: new data and cross-species comparisons. J Acoust Soc Am. 1990;87:757–781. doi: 10.1121/1.399545. [DOI] [PubMed] [Google Scholar]
- 42.Nelken I, Young ED. Two separate inhibitory mechanisms shape the responses of dorsal cochlear nucleus type IV units to narrowband and wideband stimuli. J Neurophysiol. 1994;71:2446–2462. doi: 10.1152/jn.1994.71.6.2446. [DOI] [PubMed] [Google Scholar]
- 43.Nelken I, Young ED. Linear and nonlinear spectral integration in type IV neurons of the dorsal cochlear nucleus. I. Regions of linear interaction. J Neurophysiol. 1997;78:790–799. doi: 10.1152/jn.1997.78.2.790. [DOI] [PubMed] [Google Scholar]
- 44.Nelken I, Kim PJ, Young ED. Linear and nonlinear spectral integration in type IV neurons of the dorsal cochlear nucleus. II. Predicting responses with the use of nonlinear models. J Neurophysiol. 1997;78:800–811. doi: 10.1152/jn.1997.78.2.800. [DOI] [PubMed] [Google Scholar]
- 45.Oertel D, Wu SH, Garb MW, Dizack C. Morphology and physiology of cells in slice preparations of the posteroventral cochlear nucleus of mice. J Comp Neurol. 1990;295:136–154. doi: 10.1002/cne.902950112. [DOI] [PubMed] [Google Scholar]
- 46.O’Leary SJ, Tong YC, Clark GM. Neural processes in the dorsal cochlear nucleus of the anaesthetized cat investigated from unit responses to electrical stimulation of the auditory nerve. Hear Res. 1994;74:181–196. doi: 10.1016/0378-5955(94)90186-4. [DOI] [PubMed] [Google Scholar]
- 47.Oliver DL. Dorsal cochlear nucleus projections to the inferior colliculus in the cat: a light and electron microscopic study. J Comp Neurol. 1984;224:155–172. doi: 10.1002/cne.902240202. [DOI] [PubMed] [Google Scholar]
- 48.Oliver DL, Beckius GE, Bishop DC, Kuwada S. Simultaneous anterograde labeling of axonal layers from lateral superior olive and dorsal cochlear nucleus in the inferior colliculus of cat. J Comp Neurol. 1997;382:215–229. doi: 10.1002/(sici)1096-9861(19970602)382:2<215::aid-cne6>3.0.co;2-6. [DOI] [PubMed] [Google Scholar]
- 49.Olson RE, Yee D, Rhode WS. Digital system—version II. Medical Electronics Laboratory and Department of Neurophysiology. University of Wisconsin; Madison, Wisconsin: 1985. [Google Scholar]
- 50.Osen KK. Projection of the cochlear nuclei on the inferior colliculus in the cat. J Comp Neurol. 1972;144:355–372. doi: 10.1002/cne.901440307. [DOI] [PubMed] [Google Scholar]
- 51.Osen KK, Ottersen OP, Storm-Mathisen J. Colocalization of glycine-like and GABA-like immunoreactivities: a semiquantitative study of individual neurons in the dorsal cochlear nucleus of the cat. In: Ottersen OP, Storm-Mathisen J, editors. Glycine neurotransmission. Wiley; Chichester, UK: 1990. pp. 417–451. [Google Scholar]
- 52.Ostapoff E-M, Benson CG, Saint Marie RL. GABA- and glycine-immunoreactive projections from the superior olivary complex to the cochlear nucleus in guinea pig. J Comp Neurol. 1997;381:500–512. doi: 10.1002/(sici)1096-9861(19970519)381:4<500::aid-cne9>3.0.co;2-6. [DOI] [PubMed] [Google Scholar]
- 53.Palmer AR, Jiang D, Marshall DH. Responses of ventral cochlear nucleus onset and chopper units as a function of signal bandwidth. J Neurophysiol. 1996;75:780–794. doi: 10.1152/jn.1996.75.2.780. [DOI] [PubMed] [Google Scholar]
- 54.Pirsig W, Pfalz R, Sadanaga M. Postsynaptic auditory crossed efferent inhibition in the ventral cochlear nucleus and its blocking by strychnine nitrate (guinea pig). Kumamoto Med J. 1968;21:75–82. [PubMed] [Google Scholar]
- 55.Rhode WS, Greenberg S. Encoding of amplitude modulation in the cochlear nucleus of the cat. J Neurophysiol. 1994;71:1979–1825. doi: 10.1152/jn.1994.71.5.1797. [DOI] [PubMed] [Google Scholar]
- 56.Rhode WS, Smith PH. Encoding timing and intensity in the ventral cochlear nucleus of the cat. J Neurophysiol. 1986a;56:261–286. doi: 10.1152/jn.1986.56.2.261. [DOI] [PubMed] [Google Scholar]
- 57.Rhode WS, Smith PH. Physiological studies on neurons in the dorsal cochlear nucleus of cat. J Neurophysiol. 1986b;56:287–307. doi: 10.1152/jn.1986.56.2.287. [DOI] [PubMed] [Google Scholar]
- 58.Rice JJ, May BJ, Spirou GA, Young ED. Pinna-based spectral cues for sound localization in the cat. Hear Res. 1992;58:132–152. doi: 10.1016/0378-5955(92)90123-5. [DOI] [PubMed] [Google Scholar]
- 59.Saint Marie RL, Benson CG, Ostapoff EM, Morest DK. Glycine immunoreactive projections from the dorsal to the anteroventral cochlear nucleus. Hear Res. 1991;51:11–28. doi: 10.1016/0378-5955(91)90003-r. [DOI] [PubMed] [Google Scholar]
- 60.Schofield BR, Cant NB. Origins and targets of commissural connections between the cochlear nuclei in guinea pigs. J Comp Neurol. 1996;375:128–146. doi: 10.1002/(SICI)1096-9861(19961104)375:1<128::AID-CNE8>3.0.CO;2-5. [DOI] [PubMed] [Google Scholar]
- 61.Schreiner CE, Snyder R. Modulation transfer characteristics of neurons in the dorsal cochlear nucleus of the cat. Soc Neurosci Abstr. 1987;13:1258. [Google Scholar]
- 62.Semple MN, Aitkin LM. Physiology of pathway from dorsal cochlear nucleus to inferior colliculus revealed by electrical and auditory stimulation. Exp Brain Res. 1980;41:19–28. doi: 10.1007/BF00236675. [DOI] [PubMed] [Google Scholar]
- 63.Shofner WP, Young ED. Excitatory/inhibitory response types in the cochlear nucleus: relationships to discharge patterns and responses to electrical stimulation of the auditory nerve. J Neurophysiol. 1985;54:917–939. doi: 10.1152/jn.1985.54.4.917. [DOI] [PubMed] [Google Scholar]
- 64.Smith PH, Rhode WS. Electron microscopic features of physiologically characterized, HRP-labeled fusiform cells in the cat dorsal cochlear nucleus. J Comp Neurol. 1985;237:127–143. doi: 10.1002/cne.902370110. [DOI] [PubMed] [Google Scholar]
- 65.Smith PH, Rhode WS. Structural and functional properties distinguishing two types of multipolar cells in the cat ventral cochlear nucleus. J Comp Neurol. 1989;282:595–616. doi: 10.1002/cne.902820410. [DOI] [PubMed] [Google Scholar]
- 66.Snyder RL, Leake PA. Intrinsic connections within and between cochlear nucleus subdivisions in cat. J Comp Neurol. 1988;278:209–225. doi: 10.1002/cne.902780205. [DOI] [PubMed] [Google Scholar]
- 67.Spirou GA, May BJ, Wright DD, Ryugo DK. Frequency organization of the dorsal cochlear nucleus in cats. J Comp Neurol. 1993;329:36–52. doi: 10.1002/cne.903290104. [DOI] [PubMed] [Google Scholar]
- 68.Tsuchitani C. Functional organization of lateral cell groups of cat superior olivary complex. J Neurophysiol. 1977;40:296–318. doi: 10.1152/jn.1977.40.2.296. [DOI] [PubMed] [Google Scholar]
- 69.Tsuchitani C. Input from the medial nucleus of trapezoid body to an interaural level detector. Hear Res. 1997;105:211–224. doi: 10.1016/s0378-5955(96)00212-2. [DOI] [PubMed] [Google Scholar]
- 70.Tsuchitani C, Boudreau JC. Single unit analysis of cat superior olive S-segment with tonal stimuli. J Neurophysiol. 1966;29:684–697. doi: 10.1152/jn.1966.29.4.684. [DOI] [PubMed] [Google Scholar]
- 71.van Gisbergen JAM, Grashuis JL, Johannesma PIM, Vendrik AJH. Neurons in the cochlear nucleus investigated with tone and noise stimuli. Exp Brain Res. 1975a;23:387–406. doi: 10.1007/BF00238022. [DOI] [PubMed] [Google Scholar]
- 72.van Gisbergen JAM, Grashuis JL, Johannesma PIM, Vendrik AJH. Statistical analysis and interpretation of the initial response of cochlear nucleus neurons to tone bursts. Exp Brain Res. 1975b;23:407–423. doi: 10.1007/BF00238023. [DOI] [PubMed] [Google Scholar]
- 73.Vu ET, Krasne FB. Evidence for a computational distinction between proximal and distal neuronal inhibition. Science. 1992;255:1710–1712. doi: 10.1126/science.1553559. [DOI] [PubMed] [Google Scholar]
- 74.Warren EH, Liberman MC. Effects of contralateral sound on auditory-nerve responses. I. Contributions of cochlear efferents. Hear Res. 1989a;37:89–104. doi: 10.1016/0378-5955(89)90032-4. [DOI] [PubMed] [Google Scholar]
- 75.Warren EH, Liberman MC. Effects of contralateral sound on auditory-nerve responses. II. Dependence on stimulus variables. Hear Res. 1989b;37:105–122. doi: 10.1016/0378-5955(89)90033-6. [DOI] [PubMed] [Google Scholar]
- 76.Weedman DL, Ryugo DK. Projections from auditory cortex to the cochlear nucleus in rats: synapses on granule cell dendrites. J Comp Neurol. 1996;371:311–324. doi: 10.1002/(SICI)1096-9861(19960722)371:2<311::AID-CNE10>3.0.CO;2-V. [DOI] [PubMed] [Google Scholar]
- 77.Wenthold RJ. Evidence for a glycinergic pathway connecting the two cochlear nuclei: an immunocytochemical and retrograde transport study. Brain Res. 1987;415:183–187. doi: 10.1016/0006-8993(87)90285-x. [DOI] [PubMed] [Google Scholar]
- 78.Winter IM, Palmer AR. Level dependence of cochlear nucleus onset unit responses and facilitation by second tones or broadband noise. J Neurophysiol. 1995;73:141–159. doi: 10.1152/jn.1995.73.1.141. [DOI] [PubMed] [Google Scholar]
- 79.Young ED. Cochlear nucleus. In: Shepherd GM, editor. The synaptic organization of the brain. Oxford Press; New York: 1998. pp. 121–158. [Google Scholar]
- 80.Young ED, Brownell WE. Responses to tones and noise of single cells in dorsal cochlear nucleus of unanesthetized cats. J Neurophysiol. 1976;39:282–300. doi: 10.1152/jn.1976.39.2.282. [DOI] [PubMed] [Google Scholar]
- 81.Young ED, Voigt HF. Response properties of type II and type III units in dorsal cochlear nucleus. Hear Res. 1982;6:153–169. doi: 10.1016/0378-5955(82)90051-x. [DOI] [PubMed] [Google Scholar]
- 82.Young ED, Spirou GA, Rice JJ, Voigt HF. Neural organization and responses to complex stimuli in the dorsal cochlear nucleus. Philos Trans R Soc Lond B Biol Sci. 1992;336:407–413. doi: 10.1098/rstb.1992.0076. [DOI] [PubMed] [Google Scholar]
- 83.Young ED, Nelken I, Conley RA. Somatosensory effects on neurons in dorsal cochlear nucleus. J Neurophysiol. 1995;73:743–765. doi: 10.1152/jn.1995.73.2.743. [DOI] [PubMed] [Google Scholar]
- 84.Zhang S, Oertel D. Tuberculoventral cells of the dorsal cochlear nucleus of mice: intracellular recordings in slices. J Neurophysiol. 1993;93:1409–1421. doi: 10.1152/jn.1993.69.5.1409. [DOI] [PubMed] [Google Scholar]
- 85.Zhang S, Oertel D. Neuronal circuits associated with the output of the dorsal cochlear nucleus through fusiform cells. J Neurophysiol. 1994;94:914–930. doi: 10.1152/jn.1994.71.3.914. [DOI] [PubMed] [Google Scholar]
- 86.Zhao HB, Liang ZA. Processing of modulation frequency in the dorsal cochlear nucleus of the guinea pig: amplitude modulated tones. Hear Res. 1995;82:244–256. doi: 10.1016/0378-5955(94)00181-o. [DOI] [PubMed] [Google Scholar]