

Abstract
Odor information is first represented in the brain by patterns of input activity across the glomeruli of the olfactory bulb (OB). To examine how odorants are represented at this stage of olfactory processing, we labeled anterogradely the axons of olfactory receptor neurons with the voltage-sensitive dye Di8-ANEPPQ in zebrafish. The activity induced by diverse natural odorants in afferent axons and across the array of glomeruli was then recorded optically. The results show that certain subregions of the OB are preferentially activated by defined chemical odorant classes. Within these subregions, “ordinary” odorants (amino acids, bile acids, and nucleotides) induce overlapping activity patterns involving multiple glomeruli, indicating that they are represented by combinatorial activity patterns. In contrast, two putative pheromone components (prostaglandin F2α and 17α,20β-dihydroxy-4-pregnene-3-one-20-sulfate) each induce a single focus of activity, at least one of which comes from a single, highly specific and sensitive glomerulus. These results indicate that the OB is organized into functional subregions processing classes of odorants. Furthermore, they suggest that individual odorants can be represented by “combinatorial” or “noncombinatorial” (focal) activity patterns and that the latter may serve to process odorants triggering distinct responses such as that of pheromones.
Keywords: olfactory coding, optical recording, axon tracing, activity pattern, zebrafish, pheromone, olfactory glomerulus, voltage-sensitive dye
The olfactory system discriminates between a vast number of chemical compounds that define a high-dimensional chemical stimulus space. Thus, complex neural representations of chemical compounds must exist that can be analyzed by the brain to ultimately control decisive behaviors and generate distinct perceptions.
Odorants are first encoded in the brain by patterns of afferent activity across the glomeruli in the olfactory bulb (OB), which constitute functional units in olfactory information processing (Shepherd, 1994). Histologically, glomeruli are distinct units that are not restricted to vertebrates but have evolved also in the olfactory systems of other phylogenetic groups such as molluscs and arthropods (Hildebrand and Shepherd, 1997). In rodents, glomeruli receive input from one (or a few) populations of olfactory receptor neurons (ORNs), each expressing one (or a few) odorant receptors (ORs) (Ressler et al., 1994; Vassar et al., 1994; Mombaerts et al., 1996; Wang et al., 1998). ORs are encoded by a large gene family that may contain as many as 100 members in fishes (Ngai et al., 1993; Barth et al., 1996; Weth et al., 1996) and 1000 members in rodents (Buck and Axel, 1991; Levy et al., 1991). Two other gene families have recently been found in rodents, each comprising ∼100 genes, that are expressed in the vomeronasal epithelium and seem to encode pheromone receptors (Dulac and Axel, 1995; Herrada and Dulac, 1997; Matsunami and Buck, 1997; Ryba and Tirindelli, 1997). Homologs of one of these gene families have also been found in fish (Naito et al., 1998).
With respect to the representation of odorant molecules, two extreme organizations of glomerular activity patterns may be envisaged, depending on the tuning specificity of the afferents to individual glomeruli. First, afferents to a glomerulus may respond to only one odorant molecule such that the entire information about that odorant would be encoded by the input to a single glomerulus in a “noncombinatorial” (focal) manner. Highly specific inputs to single glomeruli have been demonstrated for a pheromone detection system in some male insects (e.g., Hansson et al., 1992) but are usually thought not to occur in the OB of vertebrates (Kauer, 1991; Hildebrand and Shepherd, 1997) or in other invertebrate systems (Joerges et al., 1997). Alternatively, afferents to glomeruli may be more broadly tuned, such that an odorant would activate a distributed pattern of glomeruli. Evidence of such a “combinatorial” representation of odorants comes from experiments showing that glomeruli can respond to multiple odorants (Leveteau and MacLeod, 1966) and that single species of odorant molecules induce distributed activity (Adrian, 1953; Moulton, 1967; Stewart et al., 1979; Kauer et al., 1987; Kauer, 1991; Guthrie et al., 1993; Cinelli et al., 1995; Mori and Yoshihara, 1995;Duchamp-Viret and Duchamp, 1997; Friedrich and Korsching, 1997; Joerges et al., 1997; Johnson et al., 1998). However, important aspects of combinatorial codes, such as a possible chemotopic organization of a glomerular activity map, are still unresolved.
We addressed these questions using the zebrafish as a model system. In zebrafish, the glomeruli form an invariant morphological pattern, and several classes of natural odorants are known, including putative pheromones. The organization of the zebrafish olfactory system is typical for teleosts (Baier and Korsching, 1994; Byrd and Brunjes, 1995) and comparable with that of all other vertebrates (Andres, 1970). We optically recorded activity in afferent axons and glomeruli within the OB after anterograde labeling of ORN axons with the voltage-sensitive dye Di8-ANEPPQ (Tsau et al., 1996). The results obtained indicate that the OB is organized into functional subcompartments processing particular chemical classes of odorants and that “ordinary” odorants and pheromones are represented by combinatorial and noncombinatorial afferent activity patterns, respectively.
MATERIALS AND METHODS
Preparation and labeling. Adult wild-type zebrafish (Danio rerio) from our institute stock (Ab/TÜ) were anesthetized with MS-222, wrapped in a wet paper towel, and kept under anesthesia by superfusion of the gills with 3-aminobenzoic acid ethyl ester, methane sulfonate salt (MS-222) through the mouth as described (Friedrich and Korsching, 1997). A stock solution (30 mm) of Di8-ANEPPQ (provided by Drs. J. P. Wuskell and L. M. Loew) in DMSO and Pluronic F-127 (3:1) was diluted 1:300–1000 into water containing 1–3 mm NaCl, and 0.5–1 μl aliquots were applied into the nares as described (Baier and Korsching, 1994). Applications were repeated every 3–5 min to prevent drying of nasal epithelia. After 10–30 min, the fish were placed again into tanks, where they quickly recovered from anesthesia and were kept singly until used for experiments. In a few experiments, a stock solution of Di8-ANEPPQ in ethanol (13 mm) was used that gave the same general results, but labeling was less intense. DiI labeling was performed following a similar protocol (Baier and Korsching, 1994).
Physiological experiments were performed after a tracing period of 2–5 d in vivo following procedures similar to those described byFriedrich and Korsching (1997). All dissections and experiments were performed in teleost artificial CSF (ACSF) containing (in mm): 131 NaCl, 20 NaHCO3, 2 KCl, 1.25 KH2PO4, 2 MgSO4, and 2.5 CaCl2, pH 7.35, bubbled continuously with 95% O2/5% CO2 (Mathieson and Maler, 1988). For electrical stimulation, an explant comprising the olfactory nerve, OB, and telencephalon was used in which the olfactory nerve was stimulated with a suction electrode (200 μsec, 0.5–2 mA pulses). For odorant stimulation, an explant of the olfactory system and the forebrain was used in which the structures surrounding the brain dorsally and laterally were intact (Friedrich and Korsching, 1997). The OB was viewed ventrally with an inverted fluorescence microscope (Axiovert 100; Zeiss, Oberkochen, Germany), whereas odorants were applied dorsally to the nose through a carrier stream of ACSF (1–2 or 3–5 ml/min; constant throughout a given experiment) directed at one inflow naris. Odorants were dissolved in ACSF and switched into the carrier stream with a computer-controlled, electrically operated injection valve (Knauer, Berlin, Germany). Successive applications were separated by ≥2.5 min to exclude adaptation. The time course of the stimulus was approximated by monitoring the outflow of a solution of fluorescent rhodamine–dextran before and/or after the experiment (see Fig. 2B). The time course was constant throughout a given experiment and varied only slightly between experiments. All odorants were from Sigma (Deisenhofen, Germany), except for amino acids (Serva Feinbiochemica, Heidelberg, Germany) and 17α,20β-dihydroxy-4-pregnene-3-one-20-sulfate (17,20P-S; synthesized and provided by Dr. A. P. Scott). Amino acid and bile acid solutions were prepared at least every 12 d. Other odorant solutions were prepared immediately before the experiment, either directly [nucleotides, saponin extract (Sap), and trimethylamine oxide (TMO)] or from 10 mm stocks in water (steroid glucuronides) or DMSO (steroids and prostaglandins). Amino acid and bile acid solutions were stored at 4°C; other stocks were stored at −20°C. Solvent controls showed no effect (see, e.g., Fig.5A). Preparations were initially tested with odorant stimuli that usually elicit large fluorescence changes in the OB (100 μm Met or Ala). If responses to these odorants were weak, preparations were usually discarded. At the end of an experiment, a z-series of images was taken at 5 μm intervals that facilitated the reconstruction of the outlines of the glomeruli in the field of view.
Fig. 2.
Bottom. Optical signals in the OB induced by amino acids. A, Fluorescence signals induced by olfactory stimulation with three different amino acids (Ile, Lys, and Met; each at 100 μm). For Lys, the signals obtained with two repeated sets of applications are shown. Theblack-and-white image (top left) shows the pattern of anterograde labeling with Di8-ANEPPQ. Color scale, −0.125 to 0.5%. Scale bar, 200 μm. B, Time course of the signal induced byMet in the region indicated by the box inA. The blue line shows the average response; the yellow and green lines show the responses to the first and last (12th) stimulus application, respectively. The horizontal bar indicates the stimulus period; the red line shows the time course of efflux of fluorescent rhodamine–dextran solution from the stimulus delivery tube, which was applied at the end of the experiment to approximate the stimulus time course. Frame rate, 31 Hz.
Fig. 5.
Bottom. High sensitivity and specificity of the glomeruli in the ventral group. A, Labeling pattern (top left) and fluorescence changes induced by various odorants in the ventral group of glomeruli. Concentrations were 100 μm (GCA andATP) or 1 μm (PGF,PGE, 17,20P-S, andPRO). DMSO is a control showing that the solvent alone (DMSO; diluted 1:10000) had no effect. The only response detected was that of vmG toPGF. Sap was not tested in this preparation. B, Labeling pattern (top left) and fluorescence changes in the ventral group of glomeruli showing that vmG responds to PGF at 1 μm and 10 nm but not to PGE at 1 μm, indicating high sensitivity and specificity of vmG.Red dots indicate the outline of vmG. Large dots depict the outline of the glomerulus; small dots depict the afferent axon fascicle. Color scale, −0.035 to 0.14% for A andB; the black line indicates ΔF/F = 0. Scale bars, 50 μm. See Table 1 for abbreviations used.
CD-222 (Molecular Probes, Eugene, OR) was prepared as a stock solution (30 mm) in DMSO and diluted into an aliquot of ACSF. After mounting of the suction electrode, the perfusion was stopped, and the aliquot was added to the bath, yielding a final dilution of the CD-222 stock of ∼1:300. After incubation for 5–15 min, two to six trains of pulses were delivered. Control experiments with Di8-ANEPPQ showed that interruption of the perfusion for 15 min had no effect on electrically induced signals.
Optical recording and image analysis. Image acquisition and analysis were done using IPLab Spectrum software (Signal Analytics, Vienna, VA) running on a Power Macintosh. Images (80 × 120 to 170 × 170 pixels) were acquired with a cooled 12 bit CCD camera (PXL; Photometrics, Tucson, AZ) at 20–40 Hz in the frame transfer mode and were corrected for dark current. For each image, the fractional change in fluorescence (ΔF/F) relative to the first image was calculated pixelwise, yielding a series of ΔF/F images. Each ΔF/Fseries was then corrected for bleaching by subtraction of a ΔF/F series obtained without stimulus. For each stimulus, 6–14 corrected ΔF/F series were averaged and then convoluted with a mild low-pass spatial filter kernel. False-color images show the relative changes in fluorescence (ΔF/F) in each pixel and are averages over 20–50 frames after stimulus onset from which an average over the 20–40 frames before stimulus onset was subtracted. The period over which the frames after stimulus onset were averaged comprises the rise, peak, and part of the falling phase of the signal time course. For evaluation of signal time courses, corrected ΔF/F series were sometimes temporally filtered by a sliding average over nine successive frames. Some traces (see Figs. 1, 2) are unfiltered; others (see Figs. 3, 4) are filtered. Because the frame rate was much faster than the time course of the stimulus and that of the induced fluorescence signal, temporal filtering reduced high-frequency background noise without significantly distorting the stimulus-induced signal.
Fig. 1.

Top. Optical signals in the OB induced by electrical stimulation. A, Electrical stimulation (el. stim.) of the olfactory nerve with 32 Hz for 1 sec. Left, A fluorescence image of the OB, showing ORN axons and glomeruli labeled with Di8-ANEPPQ. At the upper margin, a portion of the contralateral bulb is visible, which was not stimulated. The false color image shows the stimulus-induced relative change in fluorescence (ΔF/F) in the same view. Positive changes in fluorescence occur throughout the stimulated OB and were strongest anteriorly. Color scale, −0.25 to 1%; theblack line indicates ΔF/F = 0. Signals exceeding the scale are shown in white. In this and all subsequent figures, anterior is to the left, and lateral is to the bottom. B,Left, Anterograde labeling pattern.Right, Spatial distribution of voltage signals induced by electrical stimulation (4 Hz for 7 sec). Bottom, Time course of fluorescence signals. The stimulus period started att = 0 and is indicated by the horizontal bar(bottom); the rate of image acquisition was 20 Hz. The locations of three regions in which the signal time course was evaluated are indicated by the boxes (left,right). The colors of the box outlines correspond to the colors of thecurves. Arrows (bottom) depict examples of fast positive signals occurring in frames in which compound action potentials were elicited. Note that the slow component of the signal time course is much more pronounced anteriorly than posteriorly, leading to stronger integrated signals in the anterior OB. Color scale, described in A. C, Changes in extracellular K+ induced by electrical stimulation of the olfactory nerve (32 Hz for 2 sec). ORN axons and glomeruli were anterogradely labeled with DiI; CD-222 was bath-applied. Left, CD-222 fluorescence.Middle, DiI fluorescence in the same view.Right, Changes in CD-222 fluorescence induced by the electrical stimulus. Note that K+ signals are confined to the anterior OB. Color scale, −0.5 to 2%; theblack line indicates ΔF/F = 0. Scale bars in all figures, 200 μm.
Fig. 3.

Activity induced by different classes of ordinary odorants. Black-and-white images show labeled axons and glomeruli in the OB; color-coded images show the stimulus-induced relative change in fluorescence (ΔF/F) in the same view.Color scale, −0.035 to 0.14%; the black line indicates ΔF/F = 0. See Table 1 for abbreviations used. A–C, Activity patterns induced by various odorants (Sap, 40 mg/l; others, 100 μm) in three different animals. InA, the white arrowhead depicts an example of an isolated glomerulus that responded to multiple odorants. Theblack arrowhead depicts a ventral glomerulus that responds only to Sap (out of focus; see also Fig. 4). Note that the signal induced by ATP in the posterior–lateral OB in C is unusually weak, providing an example of occasionally occurring variability between animals. The differences in the labeling patterns are attributable to interindividual variability, along with slight differences in the orientation of preparations and the focal plane. Scale bars, 200 μm. D, Activity patterns induced by two bile acids in the anterior–medial OB at higher magnification. Glomeruli and innervating axon fascicles in the focal plane are outlined bydashed lines. Note that the activity patterns are clearly distinct and that the majority of activity comes from axons and regions out of focus, indicative of differential activation of glomeruli deep in the preparation. Scale bar, 50 μm.E, Time course of fluorescence change induced byTDCA in A and TTP inC. For each stimulus a region in which a signal was detected (region 1) and one in which no signal was detected (region 2) were evaluated. The locations of these regions are shown as boxes in theinsets. The frame rates were 40 Hz; stimulus onset was between 0.5 and 1 sec.
Fig. 4.
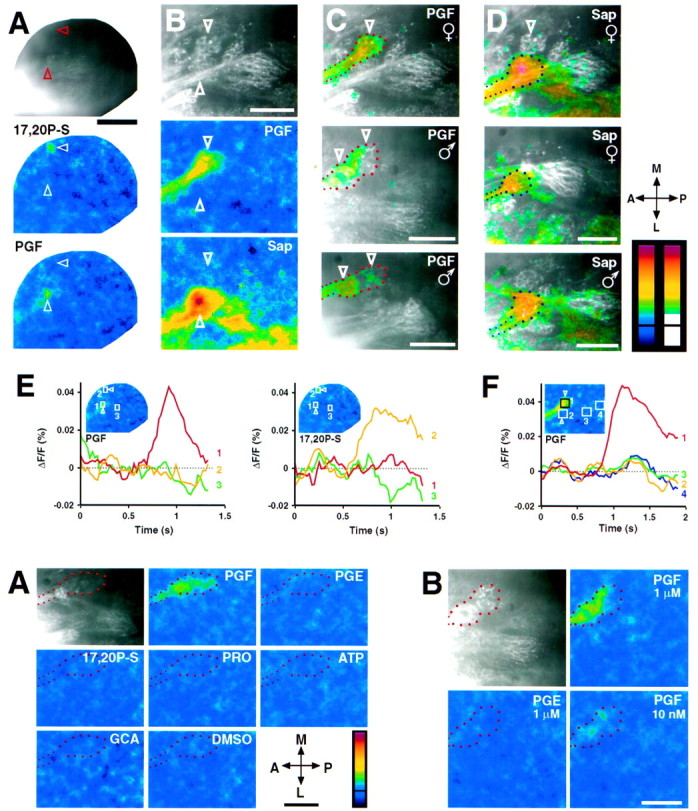
Top. Specific responses of glomeruli to pheromones and Sap. A, Voltage signals induced by two putative zebrafish pheromones, PGF and17,20P-S (each at 1 μm), in a view of the whole OB. Each putative pheromone induced a single focus of activity (arrowheads). Scale bar, 200 μm. B, Fluorescence image of the ventral group of glomeruli labeled by Di8-ANEPPQ and activity induced by PGF (1 μm) and Sap (40 mg/l) in the same view.PGF and Sap each activated a single glomerulus (vmG and vtG2, respectively) within the ventral group. Note that activity is also visible in the innervating axon fascicles. In the lateral OB, part of which is visible at thebottom of the images, activity was elicited bySap (see also Fig. 3) but not by PGF.C, D, Responses of ventral glomeruli toPGF and Sap in different animals. The correlation between the anatomy of glomeruli and the distribution of signal is indicated by the false color images that are overlaid onto the fluorescence images of labeled glomeruli.False color images were thresholded at 0.0175% (resulting in the scale on the far right), made partially transparent, and merged with the anatomical images. Thetop images are overlays of the images shown in B. The outlines of vmG and vtG2 are indicated byred and blue dots, respectively.Large dots depict the outline of the glomeruli themselves; small dots depict the afferent axon fascicles. Downward arrowheads depict subcompartments of vmG (in the top image in C, only the anterior subcompartment was in focus). Color scales, −0.035% to 0.14%; the black lines indicate ΔF/F = 0. Scale bars:A–D, 50 μm. E, Time courses of fluorescence signals induced by PGF and17,20P-S in A. Frame rate, 40 Hz.Region 1 covers the focal response toPGF, region 2 is the response to17,20P-S, and region 3 is a control region in which no signal was detected. The locations of these regions are shown as boxes in the insets.F, Time course of the response to PGF inB. Frame rate, 33 Hz. Region 1 covers vmG, which responds to PGF; regions 2–4cover other glomeruli of the ventral group, which did not respond toPGF. Stimulus onset was between 0.5 and 1 sec. See Table1 for abbreviations used.
The light source consisted of a preselected 75 W xenon arc lamp with a stabilized power supply. For Di8-ANEPPQ, a standard RITC filter set was used (510–560/FT580/LP590; Zeiss); for CD-222, a modified 4,6-diamidino-2-phenylindole (DAPI) filter set was used (G365/FT400/LP420; Zeiss). The whole OB was viewed with a 10× objective [numerical aperture (NA), 0.3; Zeiss]; subregions of the OB were examined with 20× (NA, 0.5; Zeiss) or 40× (NA, 0.75; Zeiss) objectives. Most experiments were performed on the left OB. Images obtained from the right OB were mirrored to facilitate comparison. No obvious differences between the left and the right OB were observed.
RESULTS
Optical recording of activity in ORN axons by the use of a voltage-sensitive tracer
To visualize the morphology of primary afferents and glomeruli in the OB and to enable optical recording of activity specifically from these structures, we anterogradely labeled ORN axons with the dye Di8-ANEPPQ. This dye permanently integrates into membranes in a manner similar to that of lipophilic tracers such as DiI and can also act as a voltage probe (Tsau et al., 1996; Wenner et al., 1996). Two days after application of the dye into the nasal epithelium, the primary afferents to the OB were labeled. Labeling of olfactory glomeruli was complete and highly reproducible from animal to animal. To confirm this we compared the staining pattern in the OB obtained with Di8-ANEPPQ with that obtained with DiI in the contralateral OB of the same animals (n = 7) (Baier and Korsching, 1994). No difference was observed by conventional fluorescence microscopy or confocal microscopy, except that Di8-ANEPPQ labeling was much brighter.
Electrical stimulation of the olfactory nerve with a suction electrode in an explant preparation elicited fluorescence signals in all labeled structures of the OB (Fig.1A,B). The fluorescence changes were positive for depolarization, which is consistent with previous observations and suggests that the dye accumulates in the inner leaflet of the membrane over the long tracing periods used (2–5 d) because of its two positive charges (Tsau et al., 1996; Wenner et al., 1996). No difference in the signals elicited by either electrical or odorant (see below) stimulation was observed as a function of tracing time (2–5 d), except that the signals became slightly larger with longer tracing periods. This most likely reflects more complete accumulation of the dye in the inner membrane leaflet.
2-Amino-5-phosphonovaleric acid (100 μm) and 6-cyano-7-nitroquinoxaline-2,3-dione (20 μm), antagonists of the putative ORN neurotransmitter glutamate (Berkowicz et al., 1994), did not attenuate the fluorescence signals. Removal of Ca2+ from the medium had no effect in most preparations. In some cases, however, it caused a slight decrease in the signals observed, which may be attributed to a destabilization of the preparation under Ca2+-free conditions. Tetrodotoxin (0.5–2 μm) completely abolished fluorescence signals in the OB (n = 4). No fluorescence signals were detected in unlabeled preparations or in preparations labeled with DiI. These results show that anterograde labeling with Di8-ANEPPQ permits optical recording of electrical activity specifically from ORN axons and their terminals in glomeruli of the OB and that Di8-ANEPPQ remains functional even after 5 d in vivo.
The time course of electrically induced signals consisted of a fast increase in fluorescence at the stimulus onset, a continuing increase during the stimulus train, and a slow return of the fluorescence intensity to baseline lasting several seconds after termination of the stimulus. To examine this time course in more detail, we stimulated the olfactory nerve at 4 Hz, while frames were acquired at 20 Hz. Small upward deflections occurring in those frames in which a stimulus pulse was given were superimposed on a much slower signal (Fig.1B). The fluorescence signal therefore consists of a fast component that appears to reflect electrically induced compound action potentials and a slower component.
What is the origin of the slow component? The slow component and, consequently, the integrated fluorescence signals were more pronounced in the anterior than in the posterior OB (Fig.1A,B). This is the region over which the olfactory nerve layer extends as a continuous sheet of axons; glomeruli in the posterior half are innervated by isolated axon fascicles. Electrical stimulation is known to cause a long-lasting increase in extracellular K+ concentration ([K+]e) in the olfactory nerve layer (e.g., Jahr and Nicoll, 1981). The resulting tonic depolarization, although smaller than that expected during action potentials, may cause large fluorescence signals because the detector used (CCD camera) integrates the fluorescence over time. We have therefore used the extracellular potassium-sensitive dye CD-222 (Crossley et al., 1994) to test whether an increase in extracellular K+ also occurs in the zebrafish olfactory nerve layer and may account for the prominent slow component in the anterior OB. Electrical stimulation induced a pronounced increase in [K+]e in the anterior OB but not in the posterior OB (Fig. 1C; n = 3). The time course of the increase in [K+]e was similar to that of the slow component. The pronounced voltage signals observed with Di8-ANEPPQ in the anterior OB are therefore most likely attributable to a depolarization caused by an activity-dependent release of K+ during action potentials in the nerve layer.
Optical recording of odorant-induced activity patterns
Activity induced by odorants in the afferent axons and glomeruli was studied in an explant preparation of the forebrain, in which medium flows naturally through the nose while the OB is viewed ventrally. Previously we found by Ca2+ imaging that one class of odorants, amino acids, exclusively activates the lateral OB. Within this subregion, each amino acid induced a unique pattern of activity (Friedrich and Korsching, 1997). Amino acids were therefore used to test whether the distribution of sensory-evoked activity in preparations labeled with Di8-ANEPPQ is consistent with that observed with Ca2+-sensitive dyes. In the glomerular layer, amino acid-induced voltage signals were confined to the same anterior–lateral subregion, and each amino acid induced a unique activity pattern (Fig.2A). The patterns of activity were consistent with those observed by Ca2+imaging (Friedrich and Korsching, 1997). For example, as shown in Figure 2A, Lys consistently induced strong activity anteriorly, Ile induced weaker activity posteriorly, and Met induced the most widespread activity pattern, including the regions activated by Lys and Ile. The differences between activity patterns obtained with different stimuli were significant because they were clearly more pronounced than were those between activity patterns obtained with the same stimulus after repeated application (Fig. 2A,Lys). Fluorescence signals were also recorded from the olfactory nerve and the nerve layer, visualizing the trajectories of the responsive axons (Fig. 2A). Signals were stable for up to 8 hr, with no signs of phototoxicity after total illumination times of up to 30 min.
The time course of activity induced by odorants was transient and similar to the stimulus time course, which was approximated by application of fluorescent rhodamine–dextran (Fig.2B). A sequence of positive- and negative-going phases indicating de- and hyperpolarization, as in optical recordings of the salamander OB (Cinelli et al., 1995), was not observed, presumably because these phases reflect activity of mitral and granule cells that were not labeled in the present study. Negative signals indicating inhibition were not observed.
The fluorescence signals induced by amino acids were larger than those induced by most other odorants (see Figs. 2-5; see below). The same effect has been observed and was even more pronounced in Ca2+-imaging experiments (Friedrich and Korsching, 1997; R. W. Friedrich, unpublished observations). The reason(s) underlying this difference is not known but may be attributable to factors such as activity-dependent increases in [K+]e (see Fig. 1), modulation of ORN firing rates, recurrent inhibition (Keller et al., 1998), or different relative potencies of odorants at the concentrations used here. Nevertheless, the integrated images and the signal time courses show that the signal-to-noise ratio was high enough to detect even small changes in activity also with odorants other than amino acids (see Figs. 3-5). This conclusion is supported by the fact that fluorescence signals can be reliably detected throughout the entire OB when the olfactory nerve is stimulated at low frequency (Fig.1B) and that odorants elicit detectable signals even when they are applied at concentrations close to their physiological thresholds (data not shown).
Odorant representation by afferent activity patterns
The results obtained with amino acids suggest that odorant identity is encoded by a complex pattern of active glomeruli. The amino acid-sensitive subregion of the OB contains numerous neuropil units that have characteristics of glomeruli but are considerably smaller and less distinctly delineated than are glomeruli in other regions of the OB (Friedrich and Korsching, 1997). It is therefore not certain that the findings obtained with amino acids can be generalized to other portions of the OB. Furthermore, the restriction of amino acid-induced activity to the anterior–lateral OB raises the possibility that distinct subregions of the OB are functionally specialized to process particular subsets of odorants. To address these issues, we examined the activity patterns induced by different odorant classes, including bile acids and nucleotides. These compounds are ubiquitous in aquatic environments and likely to be natural olfactory stimuli (Carr, 1988;Hara, 1994). An overview of the odorant stimuli, their abbreviations, their potential biological functions, and the numbers of experiments performed with each stimulus is given in Table1. Distinguishing between combinatorial and noncombinatorial activity patterns requires determination of the specificity of glomeruli. Odorants were therefore used at concentrations in the high physiological range (Table 1) to evaluate the maximum response range of glomeruli.
Table 1.
Overview of odorant stimuli, abbreviations used, possible biological function, and the number of experiments from which data were obtained
| Chemical name | Abbreviation | Possible biological function | N OB | N ven | N o.s. | N tot |
|---|---|---|---|---|---|---|
| l-Amino acids | Ordinary odorants1-b; feeding stimulants1-b; interspecific recognition?1-c | 32 | 12 | 11 | 55 | |
| Methionine | Met | 9 | 10 | 2 | 21 | |
| Alanine | 5 | 2 | 2 | 9 | ||
| Lysine | Lys | 3 | 2 | 5 | ||
| Aspartate | 4 | 2 | 6 | |||
| Others (5) | 11 | 3 | 14 | |||
| Bile acids | Ordinary odorantsc,d; homing cues in lampreys1-e | 36 | 8 | 4 | 48 | |
| Glycocholic acid | GCA | 12 | 6 | 2 | 20 | |
| Taurocholic acid | 6 | 6 | ||||
| Taurodeoxycholic acid | TDCA | 11 | 2 | 2 | 15 | |
| Others (2) | 7 | 7 | ||||
| Nucleotides | Ordinary odorants1-b; feeding stimulants1-b | 23 | 8 | 0 | 31 | |
| Adenosine 5′-triphosphate | ATP | 7 | 5 | 12 | ||
| Adenosine 5′-monophosphate | 6 | 6 | ||||
| Inosine 5′-monophosphate | IMP | 5 | 5 | |||
| Thymidine 5′-triphosphate | TTP | 5 | 3 | 8 | ||
| Prostaglandins | 8 | 19 | 27 | |||
| Prostaglandin F2α | PGF | Reproductive pheromone1-f | 7 | 11 | 18 | |
| Prostaglandin E2α | PGE | 1 | 8 | 9 | ||
| Steroids | 26 | 13 | 2 | 41 | ||
| 17α,20β-Dihydroxy-4-pregnene-3- one-20-sulphate | 17,20P-S | Reproductive pheromone1-g | 5 | 5 | 10 | |
| Progesterone | PRO | 1 | 4 | 5 | ||
| Androstenedione | AD | 5 | 2 | 2 | 9 | |
| 17β-Estradiol 3-(β-d-glucuronide) | 2 | 2 | ||||
| β-Estradiol 17-(β-d-glucuronide) | E17G | Reproductive pheromone1-h | 6 | 1 | 7 | |
| Testosterone β-d-glucuronide | TG | Reproductive pheromone1-h | 5 | 1 | 6 | |
| Testosterone | 2 | 2 | ||||
| Others | ||||||
| Saponin extract1-a | Sap | Alarm substance in nonvertebrates1-b | 6 | 17 | 23 | |
| Trimethylamine oxide | TMO | Ordinary odorant1-b | 5 | 1 | 6 |
The number of experiments in which each of the odorants was applied is specified for the regions of the OB that were examined [N OB, entire OB (10× lens); N ven, ventral glomeruli (20 or 40× lens); N o.s., other subregions (20× lens); and N tot, total number of experiments]. Data were obtained from experiments on a total of 40 fish. Ordinary odorants refer to substances that are recognized by various fish species and do not elicit stereotyped behavioral and/or endocrine responses as do pheromones. In most experiments, concentrations used were 100 μm for ordinary odorants and 1 μm for prostaglandins and steroids. These concentrations are in the high physiological range, as concluded from environmental concentrations (Carr, 1988) and physiological experiments (Sorensen and Goetz, 1993; Hara, 1994; Michel and Lubomudrov, 1995;Friedrich and Korsching, 1997). Relatively high concentrations were chosen to evaluate the maximum response ranges of glomeruli.
Extract from Quillaja bark that is enriched for saponins but contains a remainder of ∼10% sapogenin and <20% sulfated ashes (lot number 76H2512; Sigma). The concentration usually used was 40 mg/l, giving a saponin concentration of ∼100 μm.
(Carr, 1988) and references therein.
(Hara, 1994).
PGF and some of its metabolites are well known pheromones in goldfish involved in mating behavior (for review, seeSorensen and Goetz, 1993; Hara, 1994) and are likely to be pheromones also in other fish species, especially cyprinids (Kitamura et al., 1994; Stacey and Cardwell, 1995; Hara and Zhang, 1998). In zebrafish, PGF has recently been identified as a putative pheromone in a comparative study based on the results from the goldfish (Stacey and Cardwell, 1995; Stacey, personal communication).
17,20P-S is a putative priming pheromone in goldfish and some other species (Hara, 1994; Stacey and Cardwell, 1995). It has been identified as a putative pheromone also in zebrafish in a comparative study based on the results from other fish species (Stacey and Cardwell, 1995; Stacey, personal communication).
Steroid glucuronides are probably released by zebrafish females into the water and attract males. This activity is mimicked by E17G and TG and lost after ablation of the olfactory epithelium (van den Hurk and Lambert, 1983).
Bile acids elicited activity mainly in an anterior–medial part of the OB, along with weaker activity in a posterior–lateral subregion (Fig.3A,B). The activity patterns induced by different bile acids exhibited a similar overall distribution of activity but were clearly distinct. An examination of the medial subregion at higher magnification showed that most of the bile acid-induced activity originated not from glomeruli but from axons and regions deep in the preparation that could not be resolved (Fig. 3D). The majority of glomeruli actually activated by bile acids therefore lies in a part of the OB that cannot be imaged ventrally; presumably they are located in the dorsal half of the OB and belong to the medial group (Baier and Korsching, 1994). These activity distributions are consistent with field potential recordings in salmonid species showing that bile acids induce activity mainly in the dorsal and medial OB, whereas amino acids induce activity mainly in the lateral OB (Døving et al., 1980; Hara and Zhang, 1998).
All nucleotides tested activated a lateral portion of the OB that overlaps with the posterior portion of the amino acid-sensitive subregion. Weaker activity was also observed medially (Fig.3A,C). Similar to results obtained with amino and bile acids, the activity patterns induced by different nucleotides showed a similar overall distribution of activity but were not identical.
In addition to the compounds described above and the pheromone candidates described below, we tested some substances whose relevance as odorants is not as clearly established. Among these, an interesting activity pattern was observed with an extract of saponins (Sap; Table1). Sap activated most of the lateral OB with little effect medially (Fig. 3A). In addition, a single focus of activity occurred in a ventral subregion (Fig. 3A, black arrowhead; see also below). Because the stimulus presumably contains different saponins, along with a remainder of unidentified substances, the active components underlying this activity pattern are not known.
Between individuals, activity patterns induced by the same stimulus were similar but not identical (compare Fig. 3A–C). A part of this variability can be attributed to differences in the orientation of preparations, but these factors cannot account for the entire variability observed. A particularly clear example of interindividual variability in odorant-induced activity patterns is shown in Figure 3for responses to ATP. In one preparation (Fig. 3C), the posterior–lateral subregion of the OB that is usually strongly activated by nucleotides showed the usual strong response to TTP but a much weaker response to the other nucleotide ATP. In all other preparations, the response amplitudes were approximately equal for all nucleotides tested (e.g., Fig. 3A). Moreover, the medial responses to ATP and TTP in Figure 3C were similar.
Because optical signals originate from both afferent axons and glomeruli, it is sometimes difficult to relate the fluorescence signals to individual glomeruli, especially when low magnifications are used to view the whole OB. However, the spatial extent of the activity patterns indicate that ordinary odorants stimulate multiple glomeruli, and the differential distributions of activity show that different stimuli activate stimulus-specific subsets of glomeruli. Moreover, for glomeruli in an isolated position, odorant responses can be recorded unambiguously. In these cases, glomeruli (except those of the ventral group; see below) were always seen to respond to multiple but not to all odorants. For example, the glomerulus marked in Figure3A by the white arrowhead responds to glycocholic acid (GCA) and Sap but not or only weakly to the other stimuli.
It can be concluded that various natural odorant molecules are represented by overlapping patterns of activity in a combinatorial manner, involving glomeruli that respond to multiple odorants. Moreover, distinct subregions of the OB were identified that respond predominantly to particular classes of odorants, indicating that the OB may be functionally compartmentalized.
A sensitive and specific pheromone glomerulus
In contrast to the ordinary odorants used above, pheromones are chemical signals with a specific biological meaning that elicit distinct behavioral and/or endocrine responses. To investigate how pheromones are represented, we examined the activity in the afferents to the OB induced by four putative zebrafish pheromones and five closely related substances (prostaglandins and steroids; see Table 1). In most experiments the concentration used was 1 μm to evaluate the maximum response spectrum of glomeruli responding to pheromones. A concentration of 1 μm is presumably in the high physiological range, as concluded from environmental concentrations (Carr, 1988) and the dose– response curves of electroolfactogram responses. For example, the dose–response curve for prostaglandin F2α (PGF) in goldfish starts saturating at 1 μm (Sorensen and Goetz, 1993).
Detectable signals in the OB were elicited by only two compounds, PGF and 17,20P-S, which are two of the four putative zebrafish pheromones tested. No activity was seen with the other two pheromone candidates [β-estradiol 17-(β-d-glucuronide) (E17G) and testosterone β-d-glucuronide (TG)] or with any other steroids or prostaglandins (see Table 1), which is in agreement with electroolfactogram recordings (Stacey and Cardwell, 1995; N. E. Stacey, personal communication). In contrast to the widespread activity patterns observed with ordinary odorants, PGF and 17,20P-S each induced only a single focus of activity. This is consistent with the finding in goldfish that these compounds induce a spatial distribution of field potential effects that is more restricted than that induced by ordinary odorants (Hanson et al., 1998). The activity focus induced by 17,20P-S is located medially. In this region, several thin glomeruli are located deep in the preparation and are closely associated with the olfactory nerve layer (Baier and Korsching, 1994), which makes it impossible to identify them unequivocally in the whole-mount preparation. The activity focus induced by PGF, however, is located within a ventral group of prominent glomeruli that are stereotyped and identifiable between animals (Baier and Korsching, 1994). We have therefore examined the responses of these glomeruli at higher magnification.
The activity focus elicited by PGF comes from a single large glomerulus (and the innervating axon fascicle) that was previously named the ventromedial glomerulus (vmG) (Baier and Korsching, 1994) (Fig.4B). The vmG shows little or no response to the closely related prostaglandin E2α (PGE) or to any other compound tested (Fig.5; Table 1). PGF still elicits a response at low concentrations such as 10 nm (Fig. 5B), which is below the thresholds for ordinary odorants such as amino acids and bile acids (Michel and Lubomudrov, 1995; Friedrich and Korsching, 1997) and below the threshold for PGF in some other fish species (Kitamura et al., 1994), as measured by physiological techniques. Hence, vmG is highly specific for and sensitive to PGF. The response of vmG is constant between animals and is not sexually dimorphic (Fig.4C). This is consistent with electroolfactogram recordings in goldfish showing that PGF is detected by both sexes, although a behavioral response is apparent only in males (Sorensen and Goetz, 1993). Morphologically, vmG exhibits a complex structure, containing at least two distinguishable subcompartments. In some recordings the activity induced by PGF was not evenly distributed across the glomerulus. However, the distribution of signal intensity was not spatially correlated with the subcompartments (e.g., Fig.4C, lower panels).
Another glomerulus within the ventral group, the “glomerulus of the ventral triplet 2” [vtG2; (Baier and Korsching, 1994)], responded to Sap (Fig. 4B; see also black arrowhead in Fig. 3A). Unlike PGF, Sap activated additional glomeruli that also responded to other odorants (Fig. 3A). Nevertheless, vtG2 was relatively more specific for Sap because it was not activated by any other compound tested (Fig. 5A; Table 1). The response of vtG2 is constant across individuals and is not sexually dimorphic (Fig. 4D). Because Sap is a mixture containing unidentified compounds, the actual stimulus activating vtG2 is not known. No stimuli were found that activated the other glomeruli in the ventral group (Fig. 5A; Table 1), suggesting that these may also be specifically tuned to particular, so far unidentified, odorants.
DISCUSSION
We have analyzed general strategies for the representation of a wide variety of natural odorants and pheromones by patterns of afferent activity in the zebrafish olfactory bulb. This was made possible by anterograde labeling of ORN axons with a voltage-sensitive dye and subsequent optical recording from the labeled structures. The results indicate that the OB is organized into functional subregions responding preferentially to distinct chemical classes of odorants. Moreover, they show that ordinary odorants are represented by combinatorial activity patterns, whereas two pheromones may be represented by noncombinatorial (focal) patterns.
Axon tracing and optical recording with a voltage-sensitive dye
Optical-recording studies are often confounded by the problem that the origin of fluorescence signals is uncertain because indicator dyes are bath-applied, thus reporting bulk activity. Here we have circumvented this problem by anterograde labeling of a specific population of cells. Central to this approach was the voltage-sensitive dye Di8-ANEPPQ, which has been shown previously to be a good axonal tracer (Tsau et al., 1996; Wenner et al., 1996). Consistent with these data we found that Di8-ANEPPQ even exceeds DiI in brightness and remains functional and specific for ORN axons over at least 5 din vivo. The signal-to-noise ratio of optical recordings was high enough to identify single compound action potentials in frames integrated over 50 msec and to detect clearly activity induced by low-frequency stimulation.
Selective labeling of neuronal subpopulations has been achieved previously with Ca2+-sensitive dyes (e.g., Regehr and Tank, 1991; O’Donovan et al., 1993; O’Malley et al., 1996;Friedrich and Korsching, 1997). However, Ca2+indicators are only indirect reporters of neuronal activity and need to be introduced into the cytoplasm by complicated techniques. For example, in a previous study we loaded ORNs with the Ca2+ indicator calcium green-dextran by ablation and subsequent regeneration of olfactory cilia (Friedrich and Korsching, 1997). No such complicated loading procedures are required for voltage-sensitive dyes because they readily integrate into membranes because of their lipophilic properties, thus limiting potential concerns about neuronal damage.
Optical signals recorded with Di8-ANEPPQ originated from both ORN axons and their terminals in the glomeruli. This situation often renders it difficult to distinguish between signals from axons and glomeruli but also offers some advantages. For example, the activity induced by bile acids in the medial OB was predominantly found in axons, indicating that bile acids activate glomeruli too deep to be imaged directly. This information would not have been obtained with a glomerulus-specific activity indicator, such as a Ca2+-sensitive dye (Friedrich and Korsching, 1997). Moreover, the axonal signal can visualize the trajectories of active axons. Voltage- and Ca2+-sensitive dyes therefore each offer selective advantages, depending on the questions to be addressed.
Potassium accumulation in the olfactory nerve layer
Using the novel K+-sensitive dye CD-222 (Crossley et al., 1994), we found that electrical stimulation of the olfactory nerve causes an increase in [K+]e in the OB that appears to be confined to the olfactory nerve layer. This spatial pattern of [K+]e increase may be a result of the high density of unmyelinated axons, giving a high ratio of axonal surface (which should be proportional to the amount of K+ released) to extracellular volume. It is an open question whether the activity-induced increase in [K+]e is simply an epiphenomenon or whether it may have a physiological function. In the rat optic nerve, activity-induced increases in extracellular K+ are dramatic after birth but become less pronounced with development, giving rise to the speculation that extracellular K+accumulation may be related to a developmental process (Connors et al., 1982). This is intriguing because ORN axons undergo continuous regeneration throughout life. In other systems, changes in [K+]e can cause failure of action potential propagation (e.g., Grossman et al., 1979) that could lead to decreasing glomerular activity (Freeman, 1974).
Functional subregions of the OB
Testing a variety of natural odorants revealed subregions in the OB that respond preferentially to particular chemical classes of odorants. An anterior–lateral subregion responds preferentially to amino acids, a posterior–lateral subregion responds to nucleotides and some amino acids, and a medial subregion responds to bile acids. In addition, a group of ventral glomeruli did not respond to any odorants except for a putative pheromone and an as yet unidentified component of an odor mix (Sap). These subregions appear to correspond to groups of glomeruli formerly established on the basis of their morphology (Baier and Korsching, 1994).
Between individuals, the activity patterns induced by the same stimulus showed a high degree of similarity but were not identical. The variability observed could be caused by individual experience-dependent plasticity in the olfactory system, natural variability in the arrangement of ORN axons among individual animals, or genetic variability in the only partially inbred population of animals used, such as the presence of multiple OR alleles, including nonfunctional ones. In rare cases (such as the response to ATP in Fig.3C), response variations were substantial in one or a few glomeruli but not in others. Considerable variability between animals is also observed in electroolfactogram responses (Michel and Lubomudrov, 1995) and in the number of ORNs expressing a given OR (Barth et al., 1996; Weth et al., 1996).
The finding of subregions in the OB exhibiting specificity for classes of odorants is consistent with regional variations in odorant-induced field potentials (Døving et al., 1980; Hara and Zhang, 1998) and with the morphological organization of the OB (Riddle and Oakley, 1992) in other fish species. In the mammalian OB, some subregions may also be preferentially activated by odorants sharing particular features (Mori and Yoshihara, 1995; Bozza and Kauer, 1998; Johnson et al., 1998). Glomeruli are not only sites of convergence for particular types of ORNs (Ressler et al., 1994; Vassar et al., 1994; Mombaerts et al., 1996; Wang et al., 1998), but their spatial arrangement is organized according to odorant selectivity. This implies that the developmental mechanisms determining the positions of individual glomeruli are coordinately regulated and somehow integrate the information about odorant selectivity in the formation of the glomerular map of OR expression. One process important in this respect could be the transcriptional restriction of expression of ORs with particular odorant selectivities to zones of the olfactory epithelium (Weth et al., 1996; Scott et al., 1997; Qasba and Reed, 1998) and the subsequent zonal projection to the OB (Mori and Yoshihara, 1995; Buck, 1996; Bozza and Kauer, 1998; Wang et al., 1998).
Combinatorial and noncombinatorial activity patterns
Ordinary odorants induced overlapping but stimulus-specific activity patterns. These results are consistent with experiments using bath-applied voltage-sensitive dyes (Kauer et al., 1987; Cinelli et al., 1995), although identification of glomeruli was not possible in those studies. In experiments in which isolated glomeruli could be imaged, these glomeruli were seen to respond to multiple, but not all, ordinary odorants (e.g., Fig. 3A, white arrowhead). Hence, it can be concluded that these odorants are represented by combinatorial activity patterns that are sufficiently complex to discriminate even between very similar molecules. This result was obtained with three classes of natural odorants. For amino acids it was shown that combinatorial activity patterns represent odorant identity over a wide concentration range, including concentrations close to threshold (Friedrich and Korsching, 1997). Combinatorial activation of glomeruli may therefore be a general strategy for odor coding.
Combinatorial representation refers here specifically to the representation of entire stimulus molecules at the level of glomerular inputs. At present it is not known how the tuning characteristics of the glomeruli involved are brought about at the level of OR–ligand interaction. A glomerulus may be activated by multiple odorants because the underlying OR(s) recognizes multiple submolecular determinants; alternatively, the receptor(s) connected to a given glomerulus may recognize a particular submolecular determinant that is shared by the odorants activating this glomerulus.
With two putative pheromones (PGF and 17,20P-S), only single foci of activity were detected, at least one of which comes from a single glomerulus. We cannot rule out that these glomeruli could also be activated by substances not examined in this study. However, our panel of stimuli included substances closely related to PGF and 17,20P-S at relatively high concentrations. The absence of responses to these stimuli indicates that the glomeruli responding to PGF and 17,20P-S are substantially more selective than are those responding to ordinary odorants (see also Friedrich and Korsching, 1997). These results suggest that PGF and 17,20P-S are represented by noncombinatorial activity patterns.
It cannot be excluded that PGF and/or 17,20P-S activate additional glomeruli in the dorsal half of the OB that is not accessible to imaging. However, the evidence from the ventral OB shows that particular glomeruli responding to pheromones can have a narrow response range. This raises the question as to whether the narrow tuning of the inputs to vmG and vtG2 is retained in the responses of mitral cells connected to these glomeruli or whether these mitral cells are more broadly tuned as a result of connections within the OB. It would therefore be interesting to investigate how the patterns of input activity measured here are transformed into output activity.
Noncombinatorial patterns of input activity would, in theory, not require further steps of information processing for odorant recognition downstream of the glomerulus, whereas complex combinatorial activity patterns presumably require interpretation by higher brain centers. Noncombinatorial patterns are therefore simpler, but the coding capacity is severely limited by the number of glomeruli. Moreover, combinatorial patterns might provide a greater potential for experience-dependent plasticity.
The tuning of inputs to individual glomeruli should be determined by the OR(s) expressed on the afferents. Individual ORs are assumed to have only moderate ligand specificity, which would be consistent with the response profiles of afferents to glomeruli involved in combinatorial patterns (Hildebrand and Shepherd, 1997). The high specificity of responses in noncombinatorial activity patterns now implies the existence of ORs that are specifically tuned to only one or a few compounds. Thus, there may be separate classes of ORs with different specificities. Candidates for highly specific ORs may be homologs of the vomeronasal receptors (Dulac and Axel, 1995; Herrada and Dulac, 1997; Matsunami and Buck, 1997; Ryba and Tirindelli, 1997;Naito et al., 1998).
A hierarchical organization of odorant-induced activity patterns
Our results from this and a previous study (Friedrich and Korsching, 1997) suggest at least three levels of spatial patterning in the odorant-induced distribution of activity. (1) Subregions of the OB respond preferentially to particular chemical classes of odorants; consequently, the gross distribution of activity across the OB contains information about general odorant properties. (2) A coarse chemotopy exists at least within the amino acid-sensitive subregion, such that the distribution of glomerular activity in this region contains information about “elementary” properties of amino acid side chains. (3) The fine-grained activity patterns at the level of single glomerular units contain the information about the precise identity of an odorant. Activity patterns are therefore organized “hierarchically,” such that the acuity of stimulus recognition increases with the resolution at which activity patterns are analyzed.
A chemotopic organization of glomerular activity patterns would not be required a priori for the implementation of combinatorial or noncombinatorial codes, thus suggesting that it bears a functional meaning. One function may be to minimize the distances for lateral inhibitory circuits, which are likely to sharpen the response profiles of mitral cells (Yokoi et al., 1995; Duchamp-Viret and Duchamp, 1997). Another possibility would be that subregions process information that is relevant in different behavioral contexts (Døving and Selset, 1980). Principally, the organization of the OB into odorant class-specific subregions is reminiscent of the segregation of parallel pathways for the extraction of stimulus features in the mammalian visual system (for review, see Van Essen and Gallant, 1994), although the OB represents a much earlier stage of sensory processing.
Representation of pheromones
Whereas ordinary odorants are represented combinatorially, our data suggest that the two putative pheromones PGF and 17,20P-S are represented by noncombinatorial glomerular activity patterns. The glomerulus activated by PGF is located in a ventral subregion comprising the largest and most prominent glomeruli in the OB. Of these, only one other glomerulus responded to any of the stimuli tested. This response was also highly specific (for Sap), although the active compound underlying this response is unknown. These observations may suggest that the ventral group consists of glomeruli whose afferents are specifically tuned to particular odorants, similar to the macroglomerular complex in insects (Hansson et al., 1992; Hildebrand and Shepherd, 1997).
In noncombinatorial activity patterns the entire stimulus information is encoded in the activity of the afferents to a single glomerulus. Thus, the glomerular output could, in theory, be directly relayed to brain structures controlling stereotyped behaviors and/or endocrine states. In fact, direct projections exist from the OB to diencephalic targets, including preoptic areas, the hypothalamus, and possibly also the pituitary (e.g., Levine and Dethier, 1985; Satou, 1992; Dulka, 1993). Such “labeled lines” would seem well suited for the processing of stimuli such as pheromones that have a fixed biological meaning and trigger distinct responses.
The mammalian main OB contains a subset of glomeruli that differ from others by their morphology and/or molecular markers (Greer et al., 1982; Shinoda et al., 1993; Juilfs et al., 1997; Ring et al., 1997). At least one of these glomeruli is activated during suckling in rat pups (Greer et al., 1982), a behavior known to be mediated by pheromones. Noncombinatorial activity patterns might therefore occur also in the mammalian main olfactory system and possibly in the accessory olfactory system.
In terrestrial vertebrates, pheromonal actions are mediated mostly by the accessory rather than by the main olfactory system (Wysocki and Meredith, 1987). In fishes, however, in which a separate accessory olfactory system is absent, pheromones must be processed by the “main” olfactory system or by other chemosensory systems, a candidate being the terminal nerve (Demski and Northcutt, 1983; Wysocki and Meredith, 1987). Our data support previous evidence (Fujita et al., 1991) that at least some pheromones are processed in the olfactory system (see also Dulka, 1993).
Footnotes
R.W.F. was supported by a fellowship from the Boehringer Ingelheim Fonds. We thank Drs. J. P. Wuskell and L. M. Loew for providing Di8-ANEPPQ, Dr. A. P. Scott for the kind gift of 17,20P-S, and Drs. N. E. Stacey and P. W. Sorensen for insights into unpublished results on zebrafish pheromones. Thanks also to F. Bonhoeffer for his continuous interest and support, to F. Weth, H. Baier, C.-B. Chien, A. Borst, T. Nicolson, A. Ribera, and N. E. Stacey for helpful discussions and/or comments on this manuscript, and to C. Nüsslein-Volhard and colleagues for providing animals and zebrafish facilities.
Correspondence should be addressed to Dr. Sigrun I. Korsching, Universität Köln, Institut für Genetik, Zülpicherstr. 47, D-50674 Köln, Germany.
Dr. Friedrich’s present address and the address for reprint requests: California Institute of Technology, Division of Biology, 1200 East California Boulevard, Pasadena, CA 91125.
REFERENCES
- 1.Adrian ED. Sensory messages and sensation. Acta Physiol Scand. 1953;29:5–14. doi: 10.1111/j.1748-1716.1953.tb00990.x. [DOI] [PubMed] [Google Scholar]
- 2.Andres KH. Anatomy and ultrastructure of the olfactory bulb in fish, amphibia, reptiles, birds and mammals. In: Wolstenholme GEW, Knight J, editors. Ciba foundation symposium on taste and smell in vertebrates. Churchill; London: 1970. pp. 177–196. [Google Scholar]
- 3.Baier H, Korsching S. Olfactory glomeruli in the zebrafish olfactory system form an invariant pattern and are identifiable across animals. J Neurosci. 1994;14:219–230. doi: 10.1523/JNEUROSCI.14-01-00219.1994. [DOI] [PMC free article] [PubMed] [Google Scholar]
- 4.Barth AL, Justice NJ, Ngai J. Asynchronous onset of odorant receptor expression in the developing zebrafish olfactory system. Neuron. 1996;16:23–34. doi: 10.1016/s0896-6273(00)80020-3. [DOI] [PubMed] [Google Scholar]
- 5.Berkowicz DA, Trombley PQ, Shepherd GM. Evidence for glutamate as the olfactory receptor cell neurotransmitter. J Neurophysiol. 1994;71:2557–2561. doi: 10.1152/jn.1994.71.6.2557. [DOI] [PubMed] [Google Scholar]
- 6.Bozza TC, Kauer JS. Odorant response properties of convergent olfactory receptor neurons. J Neurosci. 1998;18:4560–4569. doi: 10.1523/JNEUROSCI.18-12-04560.1998. [DOI] [PMC free article] [PubMed] [Google Scholar]
- 7.Buck L, Axel R. A novel multigene family may encode odorant receptors: a molecular basis for odor recognition. Cell. 1991;65:175–187. doi: 10.1016/0092-8674(91)90418-x. [DOI] [PubMed] [Google Scholar]
- 8.Buck LB. Information coding in the vertebrate olfactory system. Annu Rev Neurosci. 1996;19:517–544. doi: 10.1146/annurev.ne.19.030196.002505. [DOI] [PubMed] [Google Scholar]
- 9.Byrd CA, Brunjes PC. Organization of the olfactory system in the adult zebrafish: histological, immunohistochemical, and quantitative analysis. J Comp Neurol. 1995;358:247–259. doi: 10.1002/cne.903580207. [DOI] [PubMed] [Google Scholar]
- 10.Carr WES. The molecular nature of chemical stimuli in the aquatic environment. In: Atema J, Fay RR, Popper AN, Tavolga WN, editors. Sensory biology of aquatic animals. Springer; New York: 1988. pp. 3–27. [Google Scholar]
- 11.Cinelli AR, Hamilton KA, Kauer JS. Salamander olfactory bulb neuronal activity observed by video rate, voltage-sensitive dye imaging. III. Spatial and temporal properties of responses evoked by odorant stimulation. J Neurophysiol. 1995;73:2053–2071. doi: 10.1152/jn.1995.73.5.2053. [DOI] [PubMed] [Google Scholar]
- 12.Connors BW, Ransom BR, Kunis BR, Gutnik MJ. Activity-dependent K+ accumulation in the developing rat optic nerve. Science. 1982;216:1341–1343. doi: 10.1126/science.7079771. [DOI] [PubMed] [Google Scholar]
- 13.Crossley R, Goolamali Z, Sammes PG. Synthesis and properties of a potential extracellular fluorescent probe for potassium. J Chem Soc Perkin Trans II. 1994;2:1615–1623. [Google Scholar]
- 14.Demski LS, Northcutt RG. The terminal nerve: a new chemosensory system in vertebrates? Science. 1983;202:435–437. doi: 10.1126/science.6836287. [DOI] [PubMed] [Google Scholar]
- 15.Døving KB, Selset R. Behaviour patterns in cod released by electrical stimulation of olfactory tract bundlets. Science. 1980;207:559–560. doi: 10.1126/science.7352272. [DOI] [PubMed] [Google Scholar]
- 16.Døving KB, Selset R, Thommesen G. Olfactory sensitivity to bile acids in salmonid fishes. Acta Physiol Scand. 1980;108:123–131. doi: 10.1111/j.1748-1716.1980.tb06509.x. [DOI] [PubMed] [Google Scholar]
- 17.Duchamp-Viret P, Duchamp A. Odor processing in the frog olfactory system. Prog Neurobiol. 1997;53:561–602. doi: 10.1016/s0301-0082(97)00049-x. [DOI] [PubMed] [Google Scholar]
- 18.Dulac C, Axel R. A novel family of genes encoding putative pheromone receptors in mammals. Cell. 1995;83:195–206. doi: 10.1016/0092-8674(95)90161-2. [DOI] [PubMed] [Google Scholar]
- 19.Dulka JG. Sex pheromone systems in goldfish: comparisons to vomeronasal systems in tetrapods. Brain Behav Evol. 1993;42:265–280. doi: 10.1159/000114166. [DOI] [PubMed] [Google Scholar]
- 20.Freeman WJ. Relation of glomerular neuronal activity to glomerular transmission attenuation. Brain Res. 1974;65:91–107. doi: 10.1016/0006-8993(74)90338-2. [DOI] [PubMed] [Google Scholar]
- 21.Friedrich RW, Korsching SI. Combinatorial and chemotopic odorant coding in the zebrafish olfactory bulb visualized by optical imaging. Neuron. 1997;18:737–752. doi: 10.1016/s0896-6273(00)80314-1. [DOI] [PubMed] [Google Scholar]
- 22.Fujita I, Sorensen PW, Stacey NE, Hara TJ. The olfactory system, not the terminal nerve, functions as the primary chemosensory pathway mediating responses to sex pheromones in male goldfish. Brain Behav Evol. 1991;38:313–321. doi: 10.1159/000114397. [DOI] [PubMed] [Google Scholar]
- 23.Greer CA, Stewart WB, Teicher MH, Shepherd GM. Functional development of the olfactory bulb and a unique glomerular complex in the neonatal rat. J Neurosci. 1982;2:1744–1759. doi: 10.1523/JNEUROSCI.02-12-01744.1982. [DOI] [PMC free article] [PubMed] [Google Scholar]
- 24.Grossman Y, Parnas I, Spira ME. Ionic mechanisms involved in differential conduction of action potentials at high frequency in a branching axon. J Physiol (Lond) 1979;295:307–322. doi: 10.1113/jphysiol.1979.sp012970. [DOI] [PMC free article] [PubMed] [Google Scholar]
- 25.Guthrie KM, Anderson AJ, Leon M, Gall C. Odor-induced increases in c-fos mRNA expression reveal an anatomical “unit” for odor processing in olfactory bulb. Proc Natl Acad Sci USA. 1993;90:3329–3333. doi: 10.1073/pnas.90.8.3329. [DOI] [PMC free article] [PubMed] [Google Scholar]
- 26. Hanson LR, Sorensen PW, Cohen Y. Sex pheromones and amino acids evoke distinctly different spatial patterns of electrical activity in the goldfish olfactory bulb. Olfaction and taste, Vol XII Murphy C. 1998. NY Acad Sci; New York, in press. [DOI] [PubMed] [Google Scholar]
- 27.Hansson BS, Ljungberg H, Hallberg E, Lofstedt C. Functional specialization of olfactory glomeruli in a moth. Science. 1992;256:1313–1315. doi: 10.1126/science.1598574. [DOI] [PubMed] [Google Scholar]
- 28.Hara TJ. The diversity of chemical stimulation in fish olfaction and gustation. Rev Fish Biol Fish. 1994;4:1–35. [Google Scholar]
- 29.Hara TJ, Zhang C. Topographic bulbar projections and dual neural pathways of the primary olfactory neurons in salmonid fishes. Neuroscience. 1998;82:301–313. doi: 10.1016/s0306-4522(97)00279-0. [DOI] [PubMed] [Google Scholar]
- 30.Herrada G, Dulac C. A novel family of putative pheromone receptors in mammals with a topographically organized and sexually dimorphic distribution. Cell. 1997;90:763–773. doi: 10.1016/s0092-8674(00)80536-x. [DOI] [PubMed] [Google Scholar]
- 31.Hildebrand JG, Shepherd GM. Mechanisms of olfactory discrimination: converging evidence for common principles across phyla. Annu Rev Neurosci. 1997;20:595–631. doi: 10.1146/annurev.neuro.20.1.595. [DOI] [PubMed] [Google Scholar]
- 32.Jahr CE, Nicoll RA. Primary afferent depolarization in the in vitro frog olfactory bulb. J Physiol (Lond) 1981;318:375–384. doi: 10.1113/jphysiol.1981.sp013871. [DOI] [PMC free article] [PubMed] [Google Scholar]
- 33.Joerges J, Küttner A, Galizia CG, Menzel R. Representations of odours and odour mixtures visualized in the honeybee brain. Nature. 1997;387:285–288. [Google Scholar]
- 34.Johnson BA, Woo CC, Leon M. Spatial coding of odorant features in the glomerular layer of the rat olfactory bulb. J Comp Neurol. 1998;393:457–471. doi: 10.1002/(sici)1096-9861(19980420)393:4<457::aid-cne5>3.0.co;2-#. [DOI] [PubMed] [Google Scholar]
- 35.Juilfs DM, Fülle H-J, Zhao AZ, Houslay MD, Garbers DL, Beavo JA. A subset of olfactory neurons that selectively express cGMP-stimulated phosphodiesterase (PDE2) and guanylyl cyclase-D define a unique olfactory signal transduction pathway. Proc Natl Acad Sci USA. 1997;94:3388–3395. doi: 10.1073/pnas.94.7.3388. [DOI] [PMC free article] [PubMed] [Google Scholar]
- 36.Kauer JS. Contributions of topography and parallel processing to odor coding in the vertebrate olfactory pathway. Trends Neurosci. 1991;14:79–85. doi: 10.1016/0166-2236(91)90025-p. [DOI] [PubMed] [Google Scholar]
- 37.Kauer JS, Senseman DM, Cohen LB. Odor-elicited activity monitored simultaneously from 124 regions of the salamander olfactory bulb using a voltage-sensitive dye. Brain Res. 1987;418:255–261. doi: 10.1016/0006-8993(87)90093-x. [DOI] [PubMed] [Google Scholar]
- 38.Keller A, Yagodin S, Aroniadou-Anderjaska V, Zimmer LA, Ennis M, Sheppard NF, Jr, Shipley MT. Functional organization of rat olfactory bulb glomeruli revealed by optical imaging. J Neurosci. 1998;18:2602–2612. doi: 10.1523/JNEUROSCI.18-07-02602.1998. [DOI] [PMC free article] [PubMed] [Google Scholar]
- 39.Kitamura S, Ogata H, Takashima F. Olfactory responses of several species of teleost to F-prostaglandins. Comp Biochem Physiol. 1994;107A:463–467. [PubMed] [Google Scholar]
- 40.Leveteau J, MacLeod P. Olfactory discrimination in the rabbit olfactory glomerulus. Science. 1966;153:175–176. doi: 10.1126/science.153.3732.175. [DOI] [PubMed] [Google Scholar]
- 41.Levine RL, Dethier S. The connections between the olfactory bulb and the brain in the goldfish. J Comp Neurol. 1985;237:427–444. doi: 10.1002/cne.902370402. [DOI] [PubMed] [Google Scholar]
- 42.Levy NS, Bakalyar HA, Reed RR. Signal transduction in olfactory neurons. J Steroid Biochem Mol Biol. 1991;39:633–637. doi: 10.1016/0960-0760(91)90262-4. [DOI] [PubMed] [Google Scholar]
- 43.Li W, Sorensen PW. Highly independent olfactory receptor sites for naturally occurring bile acids in the sea lamprey, Petromyzon marinus. J Comp Physiol [A] 1997;180:429–438. [Google Scholar]
- 44.Mathieson WB, Maler L. Morphological and electrophysiological properties of a novel in vitro preparation: the electrosensory lateral line lobe brain slice. J Comp Physiol [A] 1988;163:489–506. doi: 10.1007/BF00604903. [DOI] [PubMed] [Google Scholar]
- 45.Matsunami H, Buck LB. A multigene family encoding a diverse array of putative pheromone receptors in mammals. Cell. 1997;90:775–784. doi: 10.1016/s0092-8674(00)80537-1. [DOI] [PubMed] [Google Scholar]
- 46.Michel WC, Lubomudrov LM. Specificity and sensitivity of the olfactory organ of the zebrafish, Danio rerio. J Comp Physiol [A] 1995;177:191–199. doi: 10.1007/BF00225098. [DOI] [PubMed] [Google Scholar]
- 47.Mombaerts P, Wang F, Dulac C, Chao SK, Nemes A, Mendelsohn M, Edmondson J, Axel R. Visualizing an olfactory sensory map. Cell. 1996;87:675–686. doi: 10.1016/s0092-8674(00)81387-2. [DOI] [PubMed] [Google Scholar]
- 48.Mori K, Yoshihara Y. Molecular recognition and olfactory processing in the mammalian olfactory system. Prog Neurobiol. 1995;45:585–619. doi: 10.1016/0301-0082(94)00058-p. [DOI] [PubMed] [Google Scholar]
- 49.Moulton DG. Spatio-temporal patterning of response in the olfactory system. In: Hayashi T, editor. Olfaction and Taste, Vol II. Pergamon; Oxford: 1967. pp. 109–116. [Google Scholar]
- 50.Naito T, Saito Y, Yamamoto J, Nozaki Y, Tomura K, Hazama M, Nakanishi S, Brenner S. Putative pheromone receptors related to the Ca2+-sensing receptor in Fugu. Proc Natl Acad Sci USA. 1998;95:5178–5181. doi: 10.1073/pnas.95.9.5178. [DOI] [PMC free article] [PubMed] [Google Scholar]
- 51.Ngai J, Dowling MM, Buck L, Axel R, Chess A. The family of genes encoding odorant receptors in the channel catfish. Cell. 1993;72:657–666. doi: 10.1016/0092-8674(93)90395-7. [DOI] [PubMed] [Google Scholar]
- 52.O’Donovan MJ, Ho S, Sholomenko G, Yee W. Real-time imaging of neurons retrogradely labelled with calcium-sensitive dyes. J Neurosci Methods. 1993;46:91–106. doi: 10.1016/0165-0270(93)90145-h. [DOI] [PubMed] [Google Scholar]
- 53.O’Malley D, Kao Y, Fetcho J. Imaging the functional organization of zebrafish hindbrain segments during escape behaviour. Neuron. 1996;17:1145–1155. doi: 10.1016/s0896-6273(00)80246-9. [DOI] [PubMed] [Google Scholar]
- 54.Qasba P, Reed RR. Tissue and zonal-specific expression of an olfactory receptor transgene. J Neurosci. 1998;18:227–236. doi: 10.1523/JNEUROSCI.18-01-00227.1998. [DOI] [PMC free article] [PubMed] [Google Scholar]
- 55.Regehr WG, Tank DW. Selective fura-2 loading of presynaptic terminals and nerve cell processes by local perfusion in mammalian brain slice. J Neurosci Methods. 1991;37:111–119. doi: 10.1016/0165-0270(91)90121-f. [DOI] [PubMed] [Google Scholar]
- 56.Ressler KJ, Sullivan SL, Buck LB. Information coding in the olfactory system: evidence for a stereotyped and highly organized epitope map in the olfactory bulb. Cell. 1994;79:1245–1255. doi: 10.1016/0092-8674(94)90015-9. [DOI] [PubMed] [Google Scholar]
- 57.Riddle DR, Oakley B. Immunocytochemical identification of primary olfactory afferents in rainbow trout. J Comp Neurol. 1992;324:575–589. doi: 10.1002/cne.903240410. [DOI] [PubMed] [Google Scholar]
- 58.Ring G, Mezza RC, Schwob JE. Immunohistochemical identification of discrete subsets of rat olfactory neurons and the glomeruli that they innervate. J Comp Neurol. 1997;388:415–434. [PubMed] [Google Scholar]
- 59.Ryba NJP, Tirindelli R. A new multigene family of pheromone receptors. Neuron. 1997;19:371–379. doi: 10.1016/s0896-6273(00)80946-0. [DOI] [PubMed] [Google Scholar]
- 60.Satou M. Synaptic organization of the olfactory bulb and its central projections. In: Hara TJ, editor. Fish chemoreception. Chapman and Hall; London: 1992. pp. 40–59. [Google Scholar]
- 61.Scott JW, Shannon DE, Charpentier J, Davis LM, Kaplan C. Spatially organized response zones in rat olfactory epithelium. J Neurophysiol. 1997;77:1950–1962. doi: 10.1152/jn.1997.77.4.1950. [DOI] [PubMed] [Google Scholar]
- 62.Shepherd GM. Discrimination of molecular signals by the olfactory receptor neuron. Neuron. 1994;13:771–790. doi: 10.1016/0896-6273(94)90245-3. [DOI] [PubMed] [Google Scholar]
- 63.Shinoda K, Ohtsuki T, Nagano M, Okumura T. A possible functional necklace formed by placental antigen X-P2-immunoreactive and intensely acetylcholinesterase-reactive (PAX/IAE) glomerular complexes in the rat olfactory bulb. Brain Res. 1993;618:160–166. doi: 10.1016/0006-8993(93)90440-x. [DOI] [PubMed] [Google Scholar]
- 64.Sorensen PW, Goetz FW. Pheromonal and reproductive function of F prostaglandins and their metabolites in teleost fish. J Lipid Mediators. 1993;6:385–393. [PubMed] [Google Scholar]
- 65.Stacey NE, Cardwell JR (1995) Hormones as sex pheromones in fish: widespread distribution among freshwater species. In: Proceedings of the fifth international symposium on the reproductive physiology of fish (Goetz FW, Thomas P, eds), pp 244–248. Austin, TX: Fish Symposium 95.
- 66.Stewart WB, Kauer JS, Shepherd GM. Functional organization of rat olfactory bulb analysed by the 2-deoxyglucose method. J Comp Neurol. 1979;185:715–734. doi: 10.1002/cne.901850407. [DOI] [PubMed] [Google Scholar]
- 67.Tsau Y, Wenner P, O’Donovan MJ, Cohen LB, Loew LM, Wuskell JP. Dye screening and signal-to-noise ratio for retrogradely transported voltage-sensitive dyes. J Neurosci Methods. 1996;70:121–129. doi: 10.1016/s0165-0270(96)00109-4. [DOI] [PubMed] [Google Scholar]
- 68.van den Hurk R, Lambert JGD. Ovarian steroid glucuronides function as sex pheromones for male zebrafish, Brachydanio rerio. Can J Zool. 1983;61:2381–2387. [Google Scholar]
- 69.Van Essen DC, Gallant JL. Neural mechanisms of form and motion processing in the primate visual system. Neuron. 1994;13:1–10. doi: 10.1016/0896-6273(94)90455-3. [DOI] [PubMed] [Google Scholar]
- 70.Vassar R, Chao SK, Sitcheran R, Nunez JM, Vosshall LB, Axel R. Topographic organization of sensory projections to the olfactory bulb. Cell. 1994;79:981–991. doi: 10.1016/0092-8674(94)90029-9. [DOI] [PubMed] [Google Scholar]
- 71.Wang F, Nemes A, Mendelsohn M, Axel R. Odorant receptors govern the formation of a precise topographic map. Cell. 1998;93:47–60. doi: 10.1016/s0092-8674(00)81145-9. [DOI] [PubMed] [Google Scholar]
- 72.Wenner P, Tsau Y, Cohen LB, O’Donovan MJ, Dan Y. Voltage-sensitive dye recording using retrogradely transported dye in the chicken spinal cord: staining and signal characteristics. J Neurosci Methods. 1996;70:111–120. doi: 10.1016/s0165-0270(96)00108-2. [DOI] [PubMed] [Google Scholar]
- 73.Weth F, Nadler W, Korsching S. Nested expression domains for odorant receptors in zebrafish olfactory epithelium. Proc Natl Acad Sci USA. 1996;93:13321–13326. doi: 10.1073/pnas.93.23.13321. [DOI] [PMC free article] [PubMed] [Google Scholar]
- 74.Wysocki CS, Meredith M. The vomeronasal system. In: Finger TE, Silver WL, editors. Neurobiology of taste and smell. Wiley; New York: 1987. pp. 125–150. [Google Scholar]
- 75.Yokoi M, Mori K, Nakanishi S. Refinement of odor molecule tuning by dendrodendritic synaptic inhibition in the olfactory bulb. Proc Natl Acad Sci USA. 1995;92:3371–3375. doi: 10.1073/pnas.92.8.3371. [DOI] [PMC free article] [PubMed] [Google Scholar]