

Abstract
In the homozygous (but not the heterozygous) reelermutant, disruption of neuron migration leads to a major perturbation of the cortical environment that in turn could modify (1) the specification of neuronal fate and (2) the proliferation dynamics of cortical precursors. To investigate these issues, tritiated thymidine injections during cortical neurogenesis were coupled with postnatal injections of a retrograde tracer in the spinal cord to accurately measure the neurogenesis of corticospinal neurons in the heterozygous and homozygous mutant. The homozygous reeler shows (1) strict conservation of area-specific timetables of corticospinal neuron generation; (2) neurons with the appropriate birthdates show an enhanced probability of projecting to the spinal cord; (3) during early stages of corticogenesis, there is a reduced rate of neuron production followed at later stages by an increased rate of neuron production; and (4) these changes in the rate of neuron production were shown to be at least partially attributable to changes in the proportions of differentiative divisions. Taken together, our results show that in the developing cortex, the neurogenesis and specification of a given neuronal phenotype are partially controlled by the postmigratory compartment. On the other hand, neither areal identity nor the chronology of production of layer-specific neuronal phenotype seems to depend on the integrity of the cellular environment.
Keywords: corticogenesis, mouse, somatosensory cortex, development, proliferation, tritiated thymidine
Birthdating experiments coupled with manipulation of the cellular environment of the cortex show that early-generated neurons are fated for the lower cortical layers (Caviness and Sidman, 1973; Caviness and Yorke, 1976; Caviness, 1982;Jensen and Killackey, 1984; Yurkewicz et al., 1984; Crandall and Herrup, 1990; Fishell et al., 1990; Krushel et al., 1993; Kuan et al., 1997). Before their final division, cortical precursors are thought to be pluripotential and environmental signals specify their laminar fate (McConnell, 1988a,b; McConnell and Kaznowski, 1991; Bohner et al., 1997). The nature of the signals that specify early cortical precursor fate is still unknown, although cell–cell interactions are implicated (Bohner et al., 1997). Experimental evidence suggests that signals from differentiated cortical neurons influence laminar fate (Gillies and Price, 1993).
The reeler provides an appropriate model for investigating the control exerted by earlier differentiated cells on proliferation in the ventricular zone. In the homozygous (but not the heterozygous)reeler mutant, migration of neuroblasts is perturbed, and early-generated neurons take up superficial positions in the cortex (Caviness and Sidman, 1973; Caviness, 1982; Pinto Lord et al., 1982;Hoffart et al., 1995). Tracing experiments have shown that there is considerable radial intermixing of different classes of projection neurons, including corticospinal neurons (CSNs) (Terashima et al., 1983, 1985; Inoue et al., 1991; Hoffart et al., 1995). Because the expression of the reeler gene in the cortex starts at embryonic day 12 (E12) and is restricted to the Cajal-Retzius cells (D’Arcangelo et al., 1995; Hirotsune et al., 1995; Ogawa et al., 1995;Schiffmann et al., 1997), this mutant provides a model for investigations, including the present study, of the influence of the immature cortex on events in the ventricular zone.
We have investigated the correlation of a neuron’s birthdate with its connectivity. Single tritiated thymidine injections were made during corticogenesis coupled with a postnatal retrograde tracer injection in the spinal cord. By combining this procedure with a quantitative analysis of the incidence of double-labeling, it is possible to determine accurately the timetable of corticospinal neuron generation, which in normal development is area specific. In thereeler, we found that the normal onset and duration of corticospinal neuron generation in each area was strictly maintained.
Quantitative examination of the autoradiographic signal within both the corticospinal neuron population and in neurons in the full thickness of the cortex makes it possible to determine changes in the rate of neuron production as well as the proportion of differentiative divisions (Rakic and Sidman, 1968; Rakic, 1973; Schultze et al., 1974;Brückner et al., 1976; Miller, 1988; Polleux et al., 1997b). This analysis shows that early stages of corticogenesis in reelerare characterized by low rates of neuron production coupled with lower frequencies of differentiative divisions, whereas late stages of corticogenesis in reeler are characterized by increased rates of neuron production accompanied by higher frequencies of differentiative division.
These findings show in reeler that (1) the ventricular zone is competent to produce corticospinal neurons during the appropriate restricted time period, and (2) the dynamic control of neurogenesis is profoundly modified.
MATERIALS AND METHODS
Experimental animals. All animals were maintained under a constant photoperiod of 12 hr of light (8:00 A.M. to 8:00 P.M.) and 12 hr of dark (8:00 P.M. to 8:00 A.M.). The offspring of homozygous mutant males and heterozygous females of the BALB/C strain carrying the Orleans allele of the reeler gene (rlOr) were used and led to 50% homozygous (rlOr/rlOr) mutant pups and 50% heterozygous (+/rlOr) phenotypically normal pups. In this study, we used the heterozygous littermates (+/rlOr) as controls and refer to these animals as normals. Comparisons between heterozygous and homozygous animals were made within a given litter. Mating was performed overnight in six litters (injected on E13.5, E14.5, E15.5, E16.5, and E17.5) and between noon and 2:00 P.M. in two litters (E14 and E16). The morning of the vaginal plug was designated E1.
Injections of tritiated thymidine. Pregnant females received an intraperitoneal injection of [3H]methyl thymidine (Amersham, Buckinghamshire, UK) (5 mCi/gm body weight; specific activity 25 Ci/mmol) between noon and 2:00 P.M. on seven different dates of embryonic development. After birth they were housed with their mothers until retrograde tracer injection.
Retrograde fluorescent tracer injections. The spinal cord was exposed by section of ligaments and the tectorial membrane between the first and the second cervical vertebrae in adults (2- to 4-months-old) under ketamine/xylazine anesthesia (Ketalar 10 mg/kg, Rompun 4 mg/kg) and hypothermia at postnatal day 6 (P6) (day of birth is P1). The corticospinal tracts, visualized under the dissection microscope, received a large pressure injection of Fluorogold (2.5% in distilled sterile water; 0.4–0.8 μl in adult animals, 0.05–0.1 μl in newborn animals) through a glass micropipette aimed at the midline using a picopump. The wounds were sutured, and the animals were returned to their cages for a survival period of 5 d in the adults and 2 d in the young pups.
Perfusion and tissue processing. After the survival period, all animals received an overdose of sodium pentobarbital and were perfused intracardially with 0.9% NaCl solution including a vasodilator (procaine 1 gm/l) followed by a phosphate-buffered fixative solution (PB), pH 7.4 (0.1 m), of 4% paraformaldehyde. The brain and spinal cord were removed and post-fixed in the same solution for 1 week, rinsed in running tap water for 24 hr, dehydrated in ethanol, cleared with toluene, and embedded in paraffin. The brains were cut in the coronal plane (10 μm) and mounted on glass slides from an albumin–gelatin mixture. Sections were processed for autoradiography as described in Polleux et al. (1997a). The spinal cords were cryoprotected in a 30% phosphate-buffered sucrose solution, cut on a freezing microtome in the horizontal plane (40 μm), and mounted on glass slides.
The fluorescent labeling in both the frozen and paraffin sections was observed with the appropriate epifluorescence [D type filter (Leitz, Wetzlar, Germany); UV epifluorescence 325–455 nm]. After analysis of the fluorescent and autoradiographic labeling, selected sections were counterstained with cresyl violet (0.1%, 10 min), dehydrated, and coverslipped with Depex to observe with greater precision the autoradiographic labeling over individual cortical cells and to count and measure neuron profiles.
NADPH histochemistry. Frozen sections (40 μm thick) were obtained from three normal and three adult reeler mice brains and perfused according to the same protocol described above for the spinal cord. Sections were collected in PB supplemented with 0.9% NaCl, and NADPH diaphorase activity was revealed (Vincent and Kimura, 1992). Briefly, the free-floating sections were incubated at 37°C (45 min to 1 hr) in 0.1% Triton X-100 in PB (0.1 m), pH 7.4, containing 1 mg/ml β-NADPH (Sigma, St. Louis, MO) and 0.22 mg/ml Nitroblue tetrazolium (Sigma). The sections were washed in PB, mounted on gelatin-coated slides, air-dried, cleared in toluene, and coverslipped in Depex.
Neuronal profile counts. All soma measurements were made using an interactive plotting system (BIOCOM), which allows accurate recording of the position and size of individual retrogradely labeled and unlabeled neurons as well as of the number of autoradiographic silver grains per cell nucleus.
Measures of the soma size were made on images from a CCD COHU camera and projected on a BARCO CD233 screen. The average cell profile diameter (d) was corrected by the equation described bySchüz and Palm (1989):
| Equation 1 |
where denotes the average diameter measured on sections of thickness t. This relation is based on the assumption that neuronal cell bodies are spheres with a normal size distribution. To standardize our measurements for differently shaped neuronal profiles, individual diameters were estimated by calculating the equivalent diameter (dq) defined as the diameter of a circle of the same surface (S) as that of the profile examined:
| Equation 2 |
All the measurements of neuronal profile diameter presented in this study are values of equivalent diameter.
Concerning the autoradiographic labeling, the number of silver grains overlying individual nucleus profiles has been corrected for different nuclear profile diameters using the Appleton formula (Appleton et al., 1969) [also see Polleux et al. (1997b)]:
| Equation 3 |
where n is the corrected number of silver grains, N is the observed number of silver grains,dq is the equivalent diameter of the nuclear profile examined, and dq max is the equivalent diameter of the nucleus that presents the maximum number of silver grains. Autoradiographic background was estimated by counting the number of grains over neocortical tissue, which does not present any nuclear profiles. This method showed that background levels were inferior to 1 grain per 400 μm2, i.e., much less than 1 grain per mean nuclear surface (∼250 μm2).
Counts of neuron number per unit area of cortical surface were corrected for split cell error (Abercrombie, 1946; Clarke, 1992). Although minimal residual bias in the normal animal can be achieved by restricting comparisons to homogeneous layers (Beaulieu and Colonnier, 1983; Heumann and Leuba, 1983; Clarke, 1992; Beaulieu, 1993), such comparisons are impossible in the reeler neocortex given the absence of layering. To estimate the number of neurons per unit of cortical volume in both genotypes or phenotypes, we have allocated neurons to one of six categories of equivalent profile diameter. This approach minimizes error because of high ranges of profile diameters within each category (Clarke, 1992). Maximal error attributable to profile splitting ranged from 0.19% for profiles of 16–18 μm to 4.7% for profiles of 7–10 μm. Finally, glial and endothelial cell profiles were identified using the morphological criteria described byHeumann and Leuba (1983) and were excluded from the profile counts.
Parameters used to measure neurogenesis. Exhaustive analysis of the relationship between the intensity of tritiated thymidine labeling of cortical neurons and their radial height in the cortex shows that provided the critical corrections are applied, there is a halving principle of the radioactive signal with each round of mitosis (Polleux et al., 1997a,b). This means that after a single tritiated thymidine pulse, each generation of labeled neurons can be unambiguously identified. Neurons that show >50% of the maximum labeling have exited the cell cycle at the first mitosis after the tritiated thymidine pulse and are first generation (FG) neurons (neurons exhibiting >50% of the maximum number of silver grains) (Rakic, 1973; Polleux et al., 1997a,b). The timing of the tritiated thymidine pulse that generates a cohort of FG neurons defines the birthdate of the FG neurons. Neurons that complete two or more divisions after the pulse before quitting the cycle have <50% maximum labeling and are subsequent generation (SG) neurons (neurons exhibiting <50% of the maximum number of grains). The relative percentages of FG and SG neurons provide a powerful means of analyzing the cell-cycle kinetics of precursors of defined populations of neurons (Rakic, 1973;Schultze et al., 1974; Brückner et al., 1976; Miller, 1988;Polleux et al., 1997a,b).
The percentage of FG neurons within a given population of adult neurons defines a generation rate that quantifies the rate of neuron production of that population (Rakic, 1973; Carter-Dawson and LaVail, 1979;Mustari et al., 1979; Reznikov, 1990; Valverde et al., 1995a,b; Polleux et al., 1997b). The generation rate of the corticospinal neuron population is determined by the number of corticospinal neurons that are FG neurons [i.e., double-labeled neurons (DLNs); neurons that are retrogradely labeled by fluorogold injected in the spinal cord and exhibit >50% of the maximum number of silver grains], and this number is expressed as a percentage of the corticospinal neuron population. We have also examined developmental changes of the generation rate for the cortex as a whole by determining the percentage of FG neurons relative to the number of cortical neurons in the full width of the cortex. During normal development, the rate of cortical neuron production starts at minimal values at early stages of development, peaks at mid-corticogenesis, and then decreases to low levels at the end of corticogenesis (Rakic, 1976; Smart and Smart, 1982; Miller, 1988; Takahashi et al., 1996).
The probability that a neuron born on a specific date forms and maintains a projection to the spinal cord is estimated using the ratio DLN/FG neurons, which is defined as the fate index.
Differences in rates of neuron production either between regions of the ventricular zone generating individual areas or at successive time points in corticogenesis are caused by differences in (1) the density of precursors in the ventricular zone, (2) cell-cycle duration, and (3) proportion of differentiative divisions. It is this last parameter that we have examined in the present study. At initial stages, the majority of divisions are proliferative and lead to an increase in the precursor pool, but as corticogenesis proceeds there is a steady increase in the proportion of differentiative divisions leading to an increase in the leaving fraction [(number of silver grains in FG neurons)/(total number of silver grains in FG neurons + SG neurons)] (Rakic, 1977;Miller, 1988; Takahashi et al., 1994; Polleux et al., 1997b). When there are relatively few differentiative divisions (e.g., at the onset of corticogenesis), a smaller fraction of the autoradiographic signal is contained in the FG neurons, and the major part of the signal is found in neurons that underwent several divisions before quitting the cell cycle and correspond to the SG population. At this stage the leaving fraction has minimal values. As corticogenesis proceeds, the proportion of differentiative divisions increases, and as more precursors quit the cell cycle there is an increase in the proportion of the autographic signal contained in the FG population. This results in an increase in the leaving fraction. In this way, changes in the number of silver grains in the FG neuron population with respect to the total amount of tritiated thymidine signal in labeled neurons (i.e., number of silver grains in FG neurons + SG neurons) define changes in the leaving fraction (Polleux et al., 1997b).
Glossary of terms and definitions of experimental parameters. FG neurons, first generation neurons (neurons exhibiting >50% maximum number of silver grains); SG neurons, subsequent generation neurons (neurons exhibiting <50% maximum number of grains); CSN, corticospinal neurons; DLN, double-labeled neurons (i.e., neurons that are retrogradely labeled by fluorogold injected in the spinal cord and exhibit >50% maximum number of silver grains); T, number of neurons in a radial column of cortex; generation rate of corticopsinal neurons, (DLN)/(CSN); generation rate of cortical neurons, (FG neurons)/(T).
RESULTS
The theoretical significance of the parameters used to analyze neurogenesis is outlined in Material and Methods. We shall first provide a morphological description of the reelercortex showing the conservation of cortical cell number and areal boundaries as well as the radial intermingling of neurons. The major part of this section (Results) will describe the conservation of the timetable of corticospinal neurons and the marked differences between the cell-cycle kinetics underlying neuron production in normal andreeler. The final section will critically evaluate the possibility of developmental cell death and/or axon elimination influencing the parameters of cortical neurogenesis examined in the present study.
Conservation of cortical areal boundaries in thereeler neocortex
Elsewhere we have shown that there are important differences in the cell-cycle kinetics underlying the production of mouse cortical areas (Polleux et al., 1997b), so that in the present study we have taken care to distinguish areas 3 and 6. In the normal cortex, a dense NADPH diaphorase-positive neuropil is observed in layer IV of several cortical areas. In area 3, the primary somatosensory area, NADPH labeling delineates individual barrels (Fig.1). In the reeler, the medial limit of the barrel field is sharply defined with NADPH diaphorase, suggesting that boundaries between areas 3 and 6 are conserved in thereeler mutant (Caviness, 1976; Welt and Steindler, 1977;Caviness and Frost, 1983). This validates our distinction of areas 3 and 6 in the analysis of labeling in reeler cortex.
Fig. 1.

Microphotographs showing NADPH diaphorase labeling in the cortex of normal (A) andreeler mice (B) on a coronal section taken at the rostrocaudal level indicated in theinset (C). In normal mouse, NADPH diaphorase-rich neuropil delineates the primary somatosensory area 3, where individual barrels can be seen in the barrel field. In thereeler mouse neocortex, patches of high NADPH–diaphorase activity spanning the middle two-thirds of cortical thickness delineate the barrel field. The medial limit to area 3 is equally sharp in reeler and normal. Scale bar (shown inA for A, B): 500 μm.
Conservation of number of neurons under a unit of surface area in adult reeler
We have determined the number of neurons under a unit surface area in area 3, the primary somatosensory area (Fig.2). This was done by allocating neurons in a radial stripe to one of six categories according to soma size (Fig. 2C). This shows that in the reeler the small and medium-sized neurons (categories 2 to 4) are significantly less numerous than in the normal and that large-sized neurons in thereeler (categories 5 and 6) are significantly more numerous than in the normal cortex. By summing corrected numbers of neurons in each category (see Material and Methods), it is possible to estimate the total number of neurons under 1 mm2 of cortical surface (Clarke, 1992). This shows no statistically significant difference in the number of neurons in a radial column (T) in normal and reeler (Fig.2D). However, these results do indicate a change in the cortical neuron phenotype because there is a change in the ratio of small to large neurons in reeler. The crucial finding for the present study is the determination of the number of neurons in a radial column, which is used to calculate the generation rate of cortical neurons (FG neurons/T) (see below).
Fig. 2.
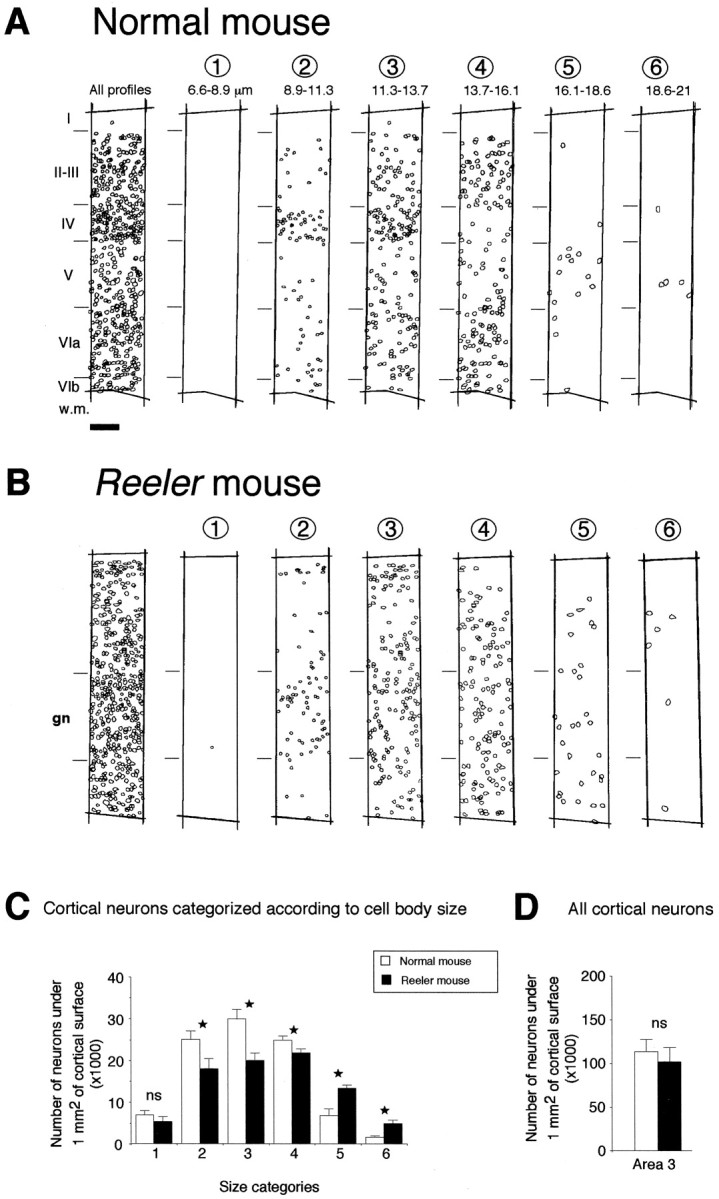
Cytoarchitectonic analysis of the normal andreeler mouse neocortex. Cell bodies were stained using cresyl violet, and all identifiable neuronal profiles encountered in a radial strip of primary somatosensory cortex were drawn.A, Normal mouse; B, reelermouse. All neuronal profiles are shown in the far left panel. The following six panels show the radial distribution of neurons showing different categories of diameters. C, Histograms representing the mean number of neurons for each category encountered under 1 mm2 of cortical surface in parietal area 3; D, total mean number of neurons encountered under 1 mm2 of cortical surface. Data were collected from seven normal and seven reeler mice. In all cases, error bars indicate 1 SD. Statistical analysis: *p < 0.05; ns, not statistically significant according to a Mann–Whitney U test.gn, Region where granular neurons are encountered in thereeler cortex. Scale bar (shown in A forA, B): 45 μm.
The reeler cortex is characterized by radial intermixing of morphologically identified categories of cortical neurons
In the normal cortex, spiny stellate neurons have the smallest diameter and are located in layer IV (Woolsey and van der Loos, 1970; Beaulieu, 1993; Skoglund et al., 1996). The radial distribution of different categories of neurons distinguished by soma size shows that in the normal cortex, neurons with the smallest diameter (categories 2 and 3) that largely correspond to the spiny stellates are concentrated in layer 4 (Fig. 2A). Larger neurons (category 4 but also 5 and 6) are significantly less numerous in layer 4 in normal cortex. In the reeler, small neurons (categories 1 and 2) are encountered in a relatively wide granular compartment (Fig. 2B). The reelercontrasts sharply with the normal, because in the mutant the categories of larger neurons show no tendency to avoid the granular layer. Hence in the reeler the categories 5 and 6, which are significantly more numerous than in the normal, are evenly distributed throughout the cortex and many neurons with the largest diameter are found in the granular layer compartment.
These results show that the reeler cortex is characterized by an intermingling of morphologically defined neurons. As will be confirmed by the analysis of the radial dispersion of corticospinal neurons and labeled tritiated thymidine neurons, the reeleris characterized by a pronounced radial intermixing of neuronal populations normally restricted to particular cortical layers rather than by a simple inversion of layering as previously suggested (Caviness and Sidman, 1973; Caviness, 1982).
Radial distribution of corticospinal neurons
Retrograde labeling gave strong backfilling of corticospinal somata (Fig. 3A,B). In the normal cortex, retrogradely labeled neurons were restricted to layer V, and the radial extent was larger in area 6 than in area 3 (Fig.3C,E). Although 93% of corticospinal neurons were concentrated in the top half of the cortex in area 3 of thereeler (Fig. 3H), in area 6 corticospinal neurons were more evenly distributed across the layers and only 64% were located in the top half of the cortex (Fig. 3G).
Fig. 3.
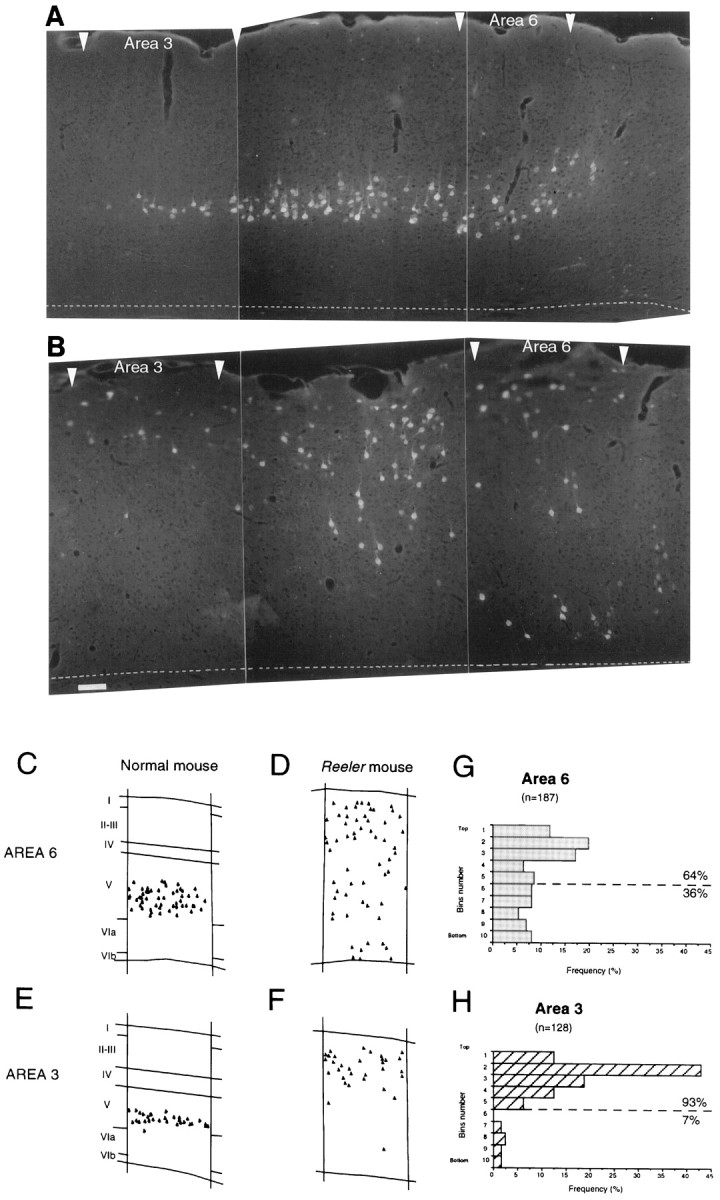
Low-power montage of microphotographs showing the distribution of corticospinal neurons in adult normal (A) and reeler(B) in cortical areas 3, 4, and 6. Area 4 is located between area 3 (to the left) and area 6 (to theright). Microphotographs from rostrocaudal level shown in Figure 1C. The plots shown in C–Fillustrate more closely the differences in radial distribution of corticospinal neurons in area 6 in normal (C) andreeler (D) and in area 3 in normal (E) and reeler(F). Histograms of the radial distribution of corticospinal neurons taken from four to five sections in two to three adult cortices are shown for reeler in area 6 (G) and area 3 (H). To construct these histograms the cortex has been divided into 10; bin 1 is superficial, bin 10 is deep. Scale bar (shown in Bfor A, B): 150 μm.
These results show that in the adult reeler there is a significant difference in the radial distribution of corticospinal neurons in areas 3 and 6. Area 3 displays a partially “inverted” pattern, whereas area 6 shows a much greater extent of radial intermixing.
Radial distribution of FG neurons
During normal development, FG neurons from injections of tritiated thymidine at successive developmental stages are distributed in an inside-first outside-last pattern of labeling in the cortex (Angevine and Sidman, 1961; Berry and Rogers, 1965; Rakic, 1976; Caviness, 1982;Smart and Smart, 1982; Luskin and Shatz, 1985; Bayer and Altman, 1991;Polleux et al., 1997a). Hence in the normal cortex and in both areas 3 and 6, injection of tritiated thymidine on E13.5 leads to FG neurons in infragranular layers and injection on E17.5 leads to FG neurons in supragranular layers (Fig. 4). In thereeler, only injections on days E13.5, E17.5, and to a lesser extent E16 showed some inversion of the histogenetic gradient. Injections on intermediate ages (E14.5–E15.5) during the generation of corticospinal neurons lead to considerable radial intermixing of FG neurons (Fig. 4). This is illustrated quantitatively by box plots comparing the distribution of neurons in area 3 in normal andreeler born on E15.5, E16, and E17.5 (Fig.4C,D).
Fig. 4.
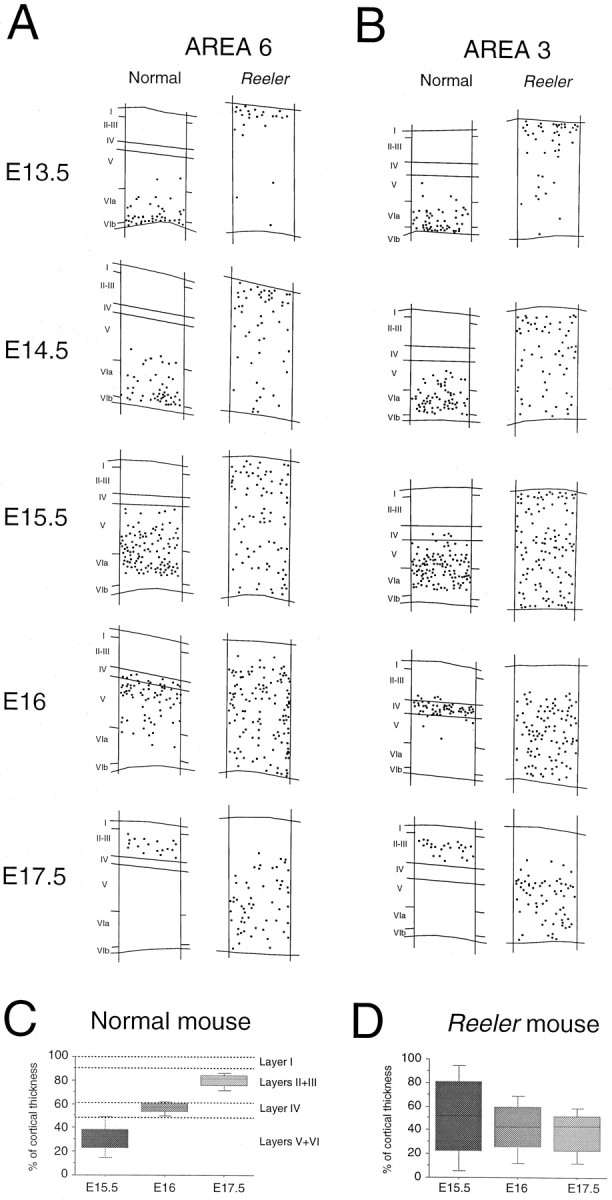
Low-power plots of FG neurons labeled by successive injections of tritiated thymidine spanning the period of cortical neurogenesis in area 6 (A) and area 3 (B) in normal and reeler mouse. The level of sections examined is indicated in the insetin Figure 1. Each 500-μm-large stripe represents the cumulation of two sections taken from two different animals from the same litter. Cortical layers are indicated with roman numerals.C, D, Box plot representation of the radial distribution of area 3 neurons born on E15.5, E16, and E17.5 in normal (C) and reeler cortex (D). Each box plot is formed from a gray box indicating the median and the 25th and 75th percentiles. Error bars indicate the 10th and 90th percentiles. This analysis illustrates the major features of the radial distribution of neurons born on different dates.
Altogether, these results show that the scrambling of radial location was more pronounced, at least for corticospinal neurons, in area 6 than in area 3. For this reason and because elsewhere we have shown important differences in the timetables of infragranular layer production in these areas (Polleux et al., 1997a), it is necessary to analyze separately the dynamics of corticospinal neuron production in areas 3 and 6.
Generation rates of the corticospinal neurons
To define the onset, duration, and tempo of corticospinal neuron generation, we computed the generation rate of corticospinal neurons (DLN/CSN) for injections at different embryonic ages.
In normal cortex, early injections of tritiated thymidine at E13.5 lead to FG neurons lying deep to the corticospinal neuron population (Fig.5A). Injections at progressively later stages lead to FG neurons being located more superficially, at E15.5 the populations of FG and corticospinal neurons show maximum overlap, and at E16 the FG neurons are more superficial than the corticospinal population. In the normal cortex, the corticospinal generation rate peaks when the population of FG neurons is centered on the population of corticospinal neurons at E15.5 (Fig. 5D). Injections at earlier and later embryonic ages lead to a decrease in the percentage of double-labeled neurons (Fig.5A,D).
Fig. 5.

Timing and tempo of generation of corticospinal neurons. A, Developmental changes of the radial position of FG neurons born on E13.5, E15.5, and E16 with respect to corticospinal neurons. Small ×: retrogradely labeled CSNs; red dots, FG neurons; red stars, DLNs (i.e., corticospinal–FG neurons). B, C, Cumulative representation of the generation rate (DLN/CSN) where the cumulated number of DLN produced during the period of corticospinal neurons production divided by the total number of corticospinal neurons is taken as 100%. This measure provides a temporal description of corticospinal neuron production in normal (B) and reeler(C). D, E, Comparison of percentages of DLN/CSN in reeler and normal in area 6 (D) and area 3 (E). Statistical analysis: *p < 0.05, **p < 0.01, according to a χ2analysis. PS, Pial surface; WM, white matter/gray matter limit. Scale bar, 500 μm.
By computing the percentage of double-labeled neurons over numerous sections it is possible to pinpoint the age of onset and exact duration of corticospinal neuron production. In normal cortex, expressing the increase in generation rate as a cumulated percentage (LaVail et al., 1991) reveals significantly different profiles in areas 6 and 3 (Fig. 5B). These cumulative curves show that production of corticospinal neurons in areas 3 and 6 starts just before E13.5 and is terminated in both areas by E16. However, generation starts much more intensely in area 3 than in area 6, so that by E14, 80% of corticospinal neurons are generated in area 3 compared with only 30% in area 6. It is important to note that in the normal animal all FG neurons up to and including E14.5 are dedicated to infragranular layers (Fig. 4A). Hence, before E14.5, areal differences in generation rate cannot be the consequence of compensatory recruitment to upper layers (Polleux et al., 1997a). Under these conditions, the differences in cumulative percentages before E14.5 in normal cortex indicate an increased output of corticospinal neurons from the ventricular zones generating area 3 compared with that generating area 6.
In the reeler, radial intermixing of both FG and corticospinal neurons results in injections over a wide developmental period, giving rise to a spatial coexistence of these two populations (Fig. 5A). However, the cumulative generation rate inreeler shows that the onset and duration of corticospinal neuron production is the same as in the normal cortex, beginning at approximately E13.5 and terminating at E16 (Fig. 5B,C). In the reeler as in the normal there is a significant areal difference in the cumulative generation rates at E14 and E14.5 (Fig.5B,C). These results suggest that the higher rates of corticospinal neuron production that characterize area 3 are partially conserved in reeler.
During the period of corticospinal neuron production, there is a developmental increase in the generation rates. In area 6, generation rate peaks at E15.5, where values in the normal animal are significantly higher than in the reeler (Fig.5D). In area 3, generation rates are also higher in the normal compared with the reeler, but the differences between the two sets of animals fail to be statistically significant (Fig.5E).
Globally, the analysis of the generation rate of corticospinal neurons (DLN/CSN) presented in Figure 5 shows that the area-specific timetable of their production is conserved in the reeler cortex.
Developmental changes in fate index (DLN/FG neurons)
The probability that neurons generated between E13.5 and E16 will project an axon to the spinal cord is defined by the fate index (the percentage of double-labeled neurons with respect to the population of FG neurons). The probability that a cortical neuron will project to the spinal cord is found to be strongly influenced by the timing of its final mitosis. Injections of tritiated thymidine on E13.5 return indices values of <2% (Fig.6A). At subsequent ages there is a significant and progressive increase in fate index, and peak values of 8% are returned at E15.5. At E16 there is an abrupt drop in the fate index of corticospinal neurons, indicating a very low or null probability for neurons born after this day to project to the spinal cord (Fig. 6A,B). In the reeler, the time course of increase in the fate index of corticospinal neurons was similar to that observed in the normal cortex (data not shown).
Fig. 6.

Developmental changes in the fate index (i.e., percentages of double-labeled neurons with respect to FG neurons) observed in adult (A) and neonates at P6 (B). In A and B, the DLN/FG neuron ratio has been calculated for neurons encountered in a 1-mm-large stripe of cortex comprising areas 6, 4, and 3.A, Comparing adjacent percentages, the χ2analysis reveals a significant and progressive increase in the DLN/FG neuron ratio between E13.5 and E15.5, which suggests that in the normal animal, the probability for a cortical neuron to project to the spinal cord depends largely on its date of birth. Above each bar, then value indicates the total number of FG neurons examined to calculate the ratio. B, The χ2analysis shows that a higher proportion of neurons born on E14.5 express this corticospinal neuron phenotype in thereeler than in the normal mouse. For each bar, thesmall symbols indicate the mean value of one animal from either one litter (E13.5, E16, or E17.5) or from two different litters (E14.5) (▾ and •). In B, the total number (n) of FG neurons examined is, respectively, E13.5, normal, n = 142, reeler n = 166; E14.5, normal, n = 432,reeler, n = 370. Statistical analysis: *p < 0.05; **p < 0.01, according to a χ2 square analysis. Error bars indicate 1 SE to the mean.
Fate indices obtained in the adult (Fig. 6A) are vulnerable to the elimination of connections that occurs during normal postnatal development. To minimize regressive phenomena influencing the fate indices of corticospinal neurons, we have made these measurements in neonates shortly after termination of neurogenesis and before the main phase of axon elimination (Fig.6B).
At the onset of the generation of corticospinal neurons (E13.5), the fate indices are similar in normal and reeler neonates. This means that neurons born at these early stages have equal probabilities in reeler and normal of forming a projection to the spinal cord. At E14.5 there is a significant increase in the fate index in both phenotypes (Fig. 6B). However, the rate of increase in the reeler was significantly larger than in the normal, so that neurons born at the period of peak production of corticospinal neurons show a significantly increased probability of projecting to the spinal cord.
Changes in the leaving fraction during the generation of corticospinal neurons
During production of corticospinal neurons, the generation rates of corticospinal neurons (DLN/CSN) in the normal cortex are higher than in the reeler, and this difference is statistically significant in area 6 (Fig. 5D). There are two major factors that theoretically could contribute to the higher generation rates found in the normal cortex: first, the proliferative behavior of precursors (i.e., the duration of the cell cycle and the leaving fraction) (Caviness et al., 1995; Polleux et al., 1997a,b) and second, a larger proportion of FG neurons being recruited into the corticospinal population (Miller, 1987a,b). The second factor can be discounted because the fate index for corticospinal neurons (DLN/FG neurons) is in fact higher in the reeler than in the normal (Fig. 6B). This is important because it implies that differences in the cell-cycle kinetics must make a major contribution to the differences in the generation rates found in normal andreeler. Accordingly, we have determined the distribution of autoradiographic signal among FG neurons and SG neurons within the corticospinal population. This analysis shows that the leaving fraction is significantly lower in areas 3 and 6 of the reelercompared with the normal (Fig.7A,B).
Fig. 7.

Areal differences in proliferative behavior of cortical neuron precursors in normal and reeler mouse. Developmental changes in leaving fraction index (proportion of silver grains contained in FG neurons related to the total number of silver grains contained in all labeled neurons) in area 6 (A) and area 3 (B). InA and B, each mean percentage is based on the examination of 256–880 autoradiographically labeled neurons observed in 6–10 sections in two to three different animals from the same litter. Developmental changes in numbers of FG neurons under 1 mm2 of cortical surface in area 6 (C) and area 3 (D) of normal and reeler mouse. In C andD, each mean has been determined by the examination of four nonadjacent sections from two to three different animals of the same litter. E, Developmental changes in the cortical generation rate (FG neurons/T) in area 3;F, differences in the leaving fraction index within the entire cortical neuron population for a pulse performed on E17.5 (normal, n = 241 labeled neurons, 6 sections;reeler, n = 445, 6 sections). Error bars indicate 1 SE to the mean. Statistical analysis (in A, B, E, and F): *p < 0.05; **p < 0.01 according to a χ2analysis; (in C, D): *p < 0.05; **p < 0.01 according to a Mann–WhitneyU test.
Cortical generation rates and changes in leaving fraction
The lower leaving fraction observed during production ofreeler corticospinal neurons means that precursors generating this population undergo a relatively larger proportion of proliferative divisions before quitting the cell cycle. As we will show below, these findings within the corticospinal population are consistent with global differences in the generation rates in normal and reeler cortex.
Counts of numbers of FG neurons below 1 mm2 of cortical surface in both areas 3 and 6 were lower in thereeler than in the normal cortex at earlier stages of corticogenesis (Fig. 7C,D). Between E15.5 and E16 there is an abrupt switch, and in both areas the numbers of FG neurons are higher in reeler than in normals during the final stages of corticogenesis (Fig. 7C,D).
The differences in numbers of FG neurons in normal andreeler suggest differences in rates of neuron production. However, these figures could be caused by differential cell death. To overcome this we have examined the cortical generation rate in area 3, which enables a comparison of rates of production in normal andreeler, because as we argue below it is not significantly influenced by cell death. The cortical generation rates in Figure7E confirms that at early stages of corticogenesis the rate of neuron production is significantly lower in the reelerthan in the normal and that at the end of corticogenesis there is a switch and the rate of neuron generation is higher in thereeler than in normal.
During the production of corticospinal neurons in thereeler, the generation rate is low, and our investigation of the leaving fraction within the corticospinal population shows that these early low rates of neuron production are the consequence of precursors failing to quit the cell cycle. This suggests that the leaving fraction might be the major factor that is controlling proliferation rates in the mutant. We have therefore investigated whether the abnormally high rates of neuron production that characterize the final stages of corticogenesis in thereeler are linked to abnormally high leaving fractions. It is possible to compare ratios of FG/SG neurons (i.e., the leaving fraction) either within the corticospinal population or at the end of corticogenesis (see below). When this calculation is made at the end of corticogenesis, it indeed shows that the global leaving fraction at E17.5 is significantly higher in reeler than in normal (Fig.7F).
Potential influence of cell death and axon elimination on parameters of neurogenesis used in this study
Regressive phenomena play a significant role in postnatal corticospinal development (O’Leary and Stanfield, 1985; Schreyer and Jones, 1988a,b; Oudega et al., 1994; Terashima, 1995). This makes it difficult to compare percentages of labeled neurons in the adult cortex because one has to be sure that developmental regressive phenomena have not modified the three sets of ratios used in the present study.
Ratios of double-labeled neurons
This is examined first in the corticospinal generation rate (DLN/CSN). Here cell death or axon elimination, or both, will equally affect both terms of the fraction so that this measurement is immune to developmental regressive phenomena and therefore can be estimated in the adult. In the case of the fate index (DLN/FG neurons), cell death and particularly axon elimination could have important consequences exclusively on the DLN population and therefore could profoundly influence this index. Hence this measurement had to be made in the young postnatal animal before the major phase of regressive phenomena affecting corticospinal neurons.
Ratios of labeling intensity—measured in the case of the leaving fraction (FGN/FGN + SGN)
Because SG neurons are largely located above FG neurons, cell death restricted to a single layer could differentially influence FG and SG populations. In the present study we have overcome this by estimating the leaving fraction in restricted populations (i.e., corticospinal neurons and at the end of corticogenesis, when populations of FG and SG neurons are both located within the same laminar compartment).
In the case of the generation index (FG neurons/T)
In reeler, FG neurons at all ages are distributed throughout a wide extent of cortex so that cell death will equally affect labeled and unlabeled neurons. In the normal cortex at E13.5, the FG neuron/T ratio is twice that in reelercortex. If this were the result of cell death it would require levels of cell death in the normal cortex to be more than twice that observed in the reeler so that the number of neurons in a radial column of normal cortex would be approximately half that in thereeler cortex. This is clearly not the case (Fig. 2).
Our results are compatible, however, with current data on cell death in the cortex because going from the FG neuron data in Figure7C to the FG neuron/T data in Figure7E shows a small decrease in the normal/reeler difference at early stages of corticogenesis and a small increase in the differences at late stages. This is predictable from the greater extent of cell death in the supragranular layers during normal development (Finlay and Slattery, 1983; Blaschke et al., 1996).
DISCUSSION
Cortical neurons of different layers and different phenotypes are generated according to a precise temporal sequence. This chronology of layer production could be the result of intrinsic properties of cortical precursors keeping track of the number of postmitotic neurons of a given phenotype already produced. Alternatively, the sequence of production could be dependent on a retrograde signal from the earlier-generated postmitotic neurons. The reeler phenotype allows one to test these hypotheses by determining whether cortical neurons are generated in appropriate numbers and according to the same timetable as in the normal cortex.
The present study shows that although the area-specific timetable of corticospinal neuron production is strictly conserved in thereeler, there are profound changes in the mode of division of the precursor pool generating this population. This, coupled with changes in the generation rates of the cortex, shows that neurogenesis is altered in the reeler. We will first relate the present description of the reeler cortical phenotype to previous work. Before discussing the significance of the present findings to theories of the regulation of cortical neurogenesis, we will briefly explain why these measurements have to be made in the postnatal cortex.
The reeler cortical phenotype
Early reports claimed that early-generated neurons inreeler are destined for superficial layers and late-generated neurons are destined for the deep part of the cortex (Caviness and Sidman, 1973; Caviness, 1982). These results contrasted with retrograde labeling experiments showing that corticospinal neurons exhibit considerable radial intermixing (Terashima et al., 1983; Inoue et al., 1991). Here we consolidate these two sets of results and show that the “inversion” of the normal histogenetic gradient is found to a limited extent in area 3 of the adult reeler mouse, whereas the radial intermixing of both sets of neurons is characteristic of area 6.
Necessity to investigate neurogenesis in the postnatal cortex
In the present study, we compare percentages of different categories of labeled and unlabeled neurons to deduce changes in cell-cycle kinetics of precursors. These comparisons performed in the adult make it possible to study differences in the cell-cycle kinetics in defined populations of neurons (Polleux et al., 1997b). This would not be the case if we were to examine S-phase labeling in the ventricular zone, because such studies examine the proliferative behavior of a heterogeneous population of precursors including precursors of radial glia, precursors generating precursors, and precursors generating neurons destined for up to three distinct cortical layers (Polleux et al., 1997b).
Environmental influences on specification of connectivity
Conclusions from early experiments in reeler were taken as proof that neuronal phenotype during normal development is specified before the onset of migration (Caviness and Sidman, 1973; Caviness, 1976; Caviness and Rakic, 1978). This conclusion was largely based on birthdating experiments in reeler that were thought to show an inverted histogenic gradient correlated with an inverted distribution of neurons showing layer-specific morphologies (Caviness and Sidman, 1973; Caviness, 1976; Caviness and Rakic, 1978). However, because of the intermixing in the radial distribution of cell types [Inoue et al. (1991); this study], these early results are compatible with a weak correlation of birthdate and phenotype. The present results show that this is not the case. In the reeler, corticospinal neurons are generated over the same 3 d period as in the normal and furthermore display similar area-specific differences in generation rates. The present results show that the environmental signal that triggers the recruitment of neuroblasts into the corticospinal neuron pool is extremely robust and is not perturbed in the reeler. This strengthens the conclusions of previous workers that cortical neuron phenotype is specified before the onset of migration (Jensen and Killackey, 1984; Yurkewicz et al., 1984; McConnell, 1988a,b, 1989;Barbe and Levitt, 1991; McConnell and Kaznowski, 1991; Parnavelas et al., 1991; Arimatsu et al., 1992; Cohen-Tannoudji et al., 1994).
Compared with the normal, the reeler shows a larger proportion of the neurons with appropriate birthdates forming and maintaining a projection to the spinal cord. This result raises the issue of what factors direct the axons of layer V neurons to their multiple subcortical targets after specification during the final mitosis (McConnell and Kaznowski, 1991).
The increased probability of FG neurons born on E14.5 projecting to the spinal cord in the reeler could reflect a modification of control of specification at several levels. It could result from an increase in the number of cortical neurons that are instructed during their final mitosis to project to the spinal cord. This would imply that in the reeler there is a disruption of a negative feedback signal. This cortical-derived signal could be relayed by descending corticofugal axons that are thought to gain access to the ventricular zone (Kim et al., 1991; Miller et al., 1993; McConnell et al., 1994; Meyer et al., 1998). Evidence that cortical-derived signals influence specification in the ventricular zone has been obtained with experiments using the antimitotic agent methylazoxymethanol acetate (MAM Ac) (Johnston et al., 1982; Yurkewicz et al., 1984; Ashwell, 1987;Gillies and Price, 1993). After early application of MAM Ac, late-generated neurons that are normally recruited to the supragranular layers acquire an infragranular layer fate (Gillies and Price, 1993). Evidence for a feedback control by earlier-generated neurons on the production of a particular phenotype has likewise been suggested in experiments in the retina (Reh and Tully, 1986) and cerebellum (Mariani et al., 1977; Williams and Herrup, 1988; Smeyne et al., 1995).
Alternatively, in reeler the increased probability that the neurons born between E13.5 and E15.5 will form projections to the spinal cord could be attributed to events occurring after migration to the cortical plate. It has been suggested that layer Vb neurons have a very general instruction to project subcortically and that their final choice of target is determined by an interaction of the axons with the target (Distel and Hollander, 1980; Bates and Killackey, 1984; O’Leary and Stanfield, 1985; O’Leary and Koester, 1993). Hence, the increase of the proportion of FG neurons that project to the spinal cord in the newborn reeler could be caused by a difference in thereeler environment in the vicinity of subcortical targets. This cannot be totally excluded because there is expression of reelin mRNA in the spinal cord and tectum, albeit at very low levels (Schiffmann et al., 1997).
Environmental influences on cell-cycle kinetics of cortical precursors
Because there is no reelin mRNA or protein in the ventricular zone (D’Arcangelo et al., 1995; Hirotsune et al., 1995; Ogawa et al., 1995;Schiffmann et al., 1997), all modifications of events in thereeler ventricular zone are likely to be the consequence of the interruption of a normally occurring developmental feedback control from the cortex. The present findings provide evidence that in thereeler, signals from the cortex are influencing events in the ventricular zone because the proliferative behavior of the pool of corticospinal neuron precursors is modified. At E15.5, during the period of peak corticospinal neuron production, generation rates inreeler are significantly lower than in normal, and we have shown that this cannot be the consequence of a reduced number of FG neurons being recruited into the corticospinal population. These findings, suggesting that the proliferative behavior of the precursor pool in the reeler differs from that in the normal, are born out by the demonstration of lower rates of differentiative division in the early stages of corticogenesis in the reeler followed by a rebound of increased rates of differentiative division at the final stages of corticogenesis.
Conclusion
Elsewhere we have shown that there is a dynamic regulation of cell-cycle kinetics among cortical precursors that plays a crucial role in the specification of cortical areas and layers (Dehay et al., 1993;Polleux et al., 1997a,b). The present finding shows that regional differences of cell-cycle kinetics in the ventricular zone corresponding to future cortical areas are maintained inreeler, at least in the early stages of corticogenesis during the production of corticospinal neurons. However, our results show that the proliferative behavior of cortical precursors is profoundly modified in the reeler. The early reduction of differentiative divisions in reeler could be the direct consequence of the modified cortical environment. The late increase in rates of differentiative divisions could either be the secondary result of a large increase in the number and density of precursors in the ventricular zone or a modification of a later control factor that is perturbed in the cortical environment of the reeler. In either case, the present results suggest that the regulation of neurogenesis in the neocortex comes under dynamic control of earlier-generated neurons, as has been suggested elsewhere in the CNS (Smeyne et al., 1995). The present findings show that genetic mutations that influence the organization of the cortex can be expected to induce changes in cortical neurogenesis.
Footnotes
This work was supported by BIOMED Grant BMH4 CT961604 and Region Rhône-Alpes Grant 97021216. We thank Dr. A. Ghosh for his comments on an earlier version of this manuscript and Dr. K. A. Koralek who participated in early stages of this study. We are grateful to Drs. P. Derer and A. Goffinet for providing reelermice.
Correspondence should be addressed to Dr. Henry Kennedy, Institut National de la Santé et de la Recherche Médicale U371-Cerveau et Vision, 18 avenue du Doyen Lepine, 69675 Bron Cedex France.
REFERENCES
- 1.Abercrombie M. Estimation of nuclear population from microtome sections. Anat Rec. 1946;94:239–247. doi: 10.1002/ar.1090940210. [DOI] [PubMed] [Google Scholar]
- 2.Angevine JB, Sidman RL. Autoradiographic study of cell migration during histogenesis of cerebral cortex in the mouse. Nature. 1961;192:766–768. doi: 10.1038/192766b0. [DOI] [PubMed] [Google Scholar]
- 3.Appleton TC, Pelc SR, Tarbit MH. Formation and loss of DNA in intestinal epithelium. J Cell Sci. 1969;5:45–55. doi: 10.1242/jcs.5.1.45. [DOI] [PubMed] [Google Scholar]
- 4.Arimatsu Y, Miyamoto M, Nihonmatsu I, Hirata K, Uratani Y, Hatanaka Y, Takiguchi-Hayashi K. Early regional specification for a molecular neuronal phenotype in the rat neocortex. Proc Natl Acad Sci USA. 1992;89:8879–8883. doi: 10.1073/pnas.89.19.8879. [DOI] [PMC free article] [PubMed] [Google Scholar]
- 5.Ashwell K. Direct and indirect effects on the lateral geniculate nucleus neurons of prenatal exposure to methylazoxymethanol. Dev Brain Res. 1987;35:199–214. doi: 10.1016/0165-3806(87)90045-9. [DOI] [PubMed] [Google Scholar]
- 6.Barbe MF, Levitt P. The early commitment of fetal neurons to the limbic cortex. J Neurosci. 1991;11:519–533. doi: 10.1523/JNEUROSCI.11-02-00519.1991. [DOI] [PMC free article] [PubMed] [Google Scholar]
- 7.Bates CA, Killackey HP. The emergence of a discretely distributed pattern of corticospinal projection neurons. Dev Brain Res. 1984;13:265–273. doi: 10.1016/0165-3806(84)90161-5. [DOI] [PubMed] [Google Scholar]
- 8.Bayer SA, Altman J. Neocortical development. Raven; New York: 1991. [Google Scholar]
- 9.Beaulieu C. Numerical data on neocortical neurons in adult rat, with special reference to the GABA population. Brain Res. 1993;609:284–292. doi: 10.1016/0006-8993(93)90884-p. [DOI] [PubMed] [Google Scholar]
- 10.Beaulieu C, Colonnier M. The number of neurons in the different laminae of the binocular and monocular regions of area 17 in the cat. J Comp Neurol. 1983;217:337–344. doi: 10.1002/cne.902170308. [DOI] [PubMed] [Google Scholar]
- 11.Berry M, Rogers AW. The migration of neuroblasts in the developing cerebral cortex. J Anat. 1965;99:691–709. [PMC free article] [PubMed] [Google Scholar]
- 12.Blaschke AJ, Staley K, Chun J. Widespread programmed cell death in proliferative and postmitotic regions of the fetal cerebral cortex. Development. 1996;122:1165–1174. doi: 10.1242/dev.122.4.1165. [DOI] [PubMed] [Google Scholar]
- 13.Bohner AP, Akers RM, McConnell SK. Induction of deep layer cortical neurons in vitro. Development. 1997;124:915–923. doi: 10.1242/dev.124.4.915. [DOI] [PubMed] [Google Scholar]
- 14.Brückner G, Mares V, Biesold D. Neurogenesis in the visual system of the rat: an autoradiographic investigation. J Comp Neurol. 1976;166:245–256. doi: 10.1002/cne.901660208. [DOI] [PubMed] [Google Scholar]
- 15.Carter-Dawson LD, LaVail MM. Rods and cones in the mouse retina. II. Autoradiographic analysis of cell generation using tritiated-thymidine. J Comp Neurol. 1979;188:263–272. doi: 10.1002/cne.901880205. [DOI] [PubMed] [Google Scholar]
- 16.Caviness VS. Patterns of cell and fiber distribution in the neocortex of the reeler mutant mouse. J Comp Neurol. 1976;170:435–448. doi: 10.1002/cne.901700404. [DOI] [PubMed] [Google Scholar]
- 17.Caviness VS. Neocortical histogenesis in the normal and reeler mice: a developmental study based upon [3H]-thymidine autoradiography. Dev Brain Res. 1982;4:293–302. doi: 10.1016/0165-3806(82)90141-9. [DOI] [PubMed] [Google Scholar]
- 18.Caviness VS, Frost DO. Thalamocortical projections in the reeler mutant mouse. J Comp Neurol. 1983;219:182–202. doi: 10.1002/cne.902190205. [DOI] [PubMed] [Google Scholar]
- 19.Caviness VS, Rakic P. Mechanisms of cortical development: a view from mutations in mice. Annu Rev Neurosci. 1978;1:297–326. doi: 10.1146/annurev.ne.01.030178.001501. [DOI] [PubMed] [Google Scholar]
- 20.Caviness VS, Sidman RL. Time of origin of corresponding cell classes in the cerebral cortex of normal and reeler mice: an autoradiographic analysis. J Comp Neurol. 1973;148:141–152. doi: 10.1002/cne.901480202. [DOI] [PubMed] [Google Scholar]
- 21.Caviness VS, Yorke CH. Interhemispheric neocortical connections of the corpus callosum in the reeler mutant mouse: a study based on anterograde and retrograde methods. J Comp Neurol. 1976;170:449–460. doi: 10.1002/cne.901700405. [DOI] [PubMed] [Google Scholar]
- 22.Caviness VS, Takahashi T, Nowakowski RS. Numbers, time and neocortical neuronogenesis: a general developmental and evolutionary model. Trends Neurosci. 1995;18:379–383. doi: 10.1016/0166-2236(95)93933-o. [DOI] [PubMed] [Google Scholar]
- 23.Clarke PGH. How inaccurate is the Abercrombie correction factor for cell counts? Trends Neurosci. 1992;15:211–212. doi: 10.1016/0166-2236(92)90036-8. [DOI] [PubMed] [Google Scholar]
- 24.Cohen-Tannoudji M, Babinet C, Wassef M. Early determination of a mouse somatosensory cortex marker. Nature. 1994;368:460–463. doi: 10.1038/368460a0. [DOI] [PubMed] [Google Scholar]
- 25.Crandall JE, Herrup K. Patterns of cell lineage in the cerebral cortex reveal evidence for developmental boundaries. Exp Neurol. 1990;109:131–139. doi: 10.1016/s0014-4886(05)80014-7. [DOI] [PubMed] [Google Scholar]
- 26.D’Arcangelo G, Miao GG, Chen S-C, Soares HD, Morgan JI, Curran T. A protein related to extracellular matrix proteins deleted in the mouse mutant reeler. Nature. 1995;374:719–723. doi: 10.1038/374719a0. [DOI] [PubMed] [Google Scholar]
- 27.Dehay C, Giroud P, Berland M, Smart I, Kennedy H. Modulation of the cell cycle contributes to the parcellation of the primate visual cortex. Nature. 1993;366:464–466. doi: 10.1038/366464a0. [DOI] [PubMed] [Google Scholar]
- 28.Distel H, Hollander H. Autoradiographic tracing of developing subcortical projections of the occipital region in fetal rabbits. J Comp Neurol. 1980;192:505–518. doi: 10.1002/cne.901920309. [DOI] [PubMed] [Google Scholar]
- 29.Finlay BL, Slattery M. Local differences in amount of early cell death in neocortex predict adult local specializations. Science. 1983;219:1349–1351. doi: 10.1126/science.6828866. [DOI] [PubMed] [Google Scholar]
- 30.Fishell G, Rossant J, van der Kooy D. Neuronal lineages in chimeric mouse forebrain are segregated between compartments and in the rostrocaudal and radial planes. Dev Biol. 1990;141:70–83. doi: 10.1016/0012-1606(90)90102-o. [DOI] [PubMed] [Google Scholar]
- 31.Gillies K, Price DJ. The fates of cells in the developing cerebral-cortex of normal and methylazoxymethanol acetate-lesioned mice. Eur J Neurosci. 1993;5:73–84. doi: 10.1111/j.1460-9568.1993.tb00207.x. [DOI] [PubMed] [Google Scholar]
- 32.Heumann D, Leuba G. Neuronal death in the development and aging of the cerebral cortex of the mouse. Neuropathol Appl Neurobiol. 1983;9:297–311. doi: 10.1111/j.1365-2990.1983.tb00116.x. [DOI] [PubMed] [Google Scholar]
- 33.Hirotsune S, Takahara T, Sasaki N, Hirose K, Yoshiki A, Ohashi T, Kusakabe M, Murakami Y, Muramatsu M, Watanabe S, Nakao K, Katsuki M, Hayashizaki Y. The reeler gene encodes a protein with an EGF-like motif expressed by pioneer neurons. Nat Genet. 1995;10:77–83. doi: 10.1038/ng0595-77. [DOI] [PubMed] [Google Scholar]
- 34.Hoffart RM, Johnston JG, Krushel LA, van der Kooy D. The mouse mutation reeler causes increased adhesion within a subpopulation of early postmitotic cortical neurons. J Neurosci. 1995;15:4838–4850. doi: 10.1523/JNEUROSCI.15-07-04838.1995. [DOI] [PMC free article] [PubMed] [Google Scholar]
- 35.Inoue K, Terashima T, Inoue I. The intracortical position of pyramidal tract neurons in the motor cortex of the reeler changes from postnatal day 10 to adulthood. Dev Brain Res. 1991;62:146–150. doi: 10.1016/0165-3806(91)90201-s. [DOI] [PubMed] [Google Scholar]
- 36.Jensen KF, Killackey HP. Subcortical projections from ectopic neocortical neurons. Proc Natl Acad Sci USA. 1984;81:964–968. doi: 10.1073/pnas.81.3.964. [DOI] [PMC free article] [PubMed] [Google Scholar]
- 37.Johnston MV, Haddad R, Carman-Young A, Coyle JT. Neurotransmitter chemistry of lissencephalic cortex induced in ferrets by fetal treatment with methylazoxymethanol acetate. Brain Res. 1982;256:285–291. doi: 10.1016/0165-3806(82)90140-7. [DOI] [PubMed] [Google Scholar]
- 38.Kim GJ, Shatz CJ, McConnell SK. Morphology of pioneer and follower growth cones in the developing cerebral cortex. J Neurobiol. 1991;22:629–642. doi: 10.1002/neu.480220608. [DOI] [PubMed] [Google Scholar]
- 39.Krushel LA, Johnston JG, Fishell G, Tibshirani R, van der Kooy D. Spatially localized neuronal cell lineages in the developing mammalian forebrain. Neuroscience. 1993;53:1035–1047. doi: 10.1016/0306-4522(93)90487-z. [DOI] [PubMed] [Google Scholar]
- 40.Kuan C-Y, Elliott EA, Flavell RA, Rakic P. Restrictive clonal allocation in the chimeric mouse brain. Proc Natl Acad Sci USA. 1997;94:3374–3379. doi: 10.1073/pnas.94.7.3374. [DOI] [PMC free article] [PubMed] [Google Scholar]
- 41.LaVail MM, Rapaport DH, Rakic P. Cytogenesis in the monkey retina. J Comp Neurol. 1991;309:86–114. doi: 10.1002/cne.903090107. [DOI] [PubMed] [Google Scholar]
- 42.Luskin MB, Shatz CJ. Neurogenesis of the cat’s primary visual cortex. J Comp Neurol. 1985;242:611–631. doi: 10.1002/cne.902420409. [DOI] [PubMed] [Google Scholar]
- 43.Mariani J, Crepel F, Mikoshiba K, Changeux JP, Sotelo C. Anatomical, physiological and biochemical studies of the cerebellum from reeler mutant mouse. Philos Trans R Soc Lond B Biol Sci. 1977;281:1–28. doi: 10.1098/rstb.1977.0121. [DOI] [PubMed] [Google Scholar]
- 44.McConnell SK. Development and decision-making in the mammalian cerebral cortex. Brain Res Rev. 1988a;13:1–23. doi: 10.1016/0165-0173(88)90002-1. [DOI] [PubMed] [Google Scholar]
- 45.McConnell SK. Fates of visual cortical neurons in the ferret after isochronic and heterochronic transplantation. J Neurosci. 1988b;8:945–974. doi: 10.1523/JNEUROSCI.08-03-00945.1988. [DOI] [PMC free article] [PubMed] [Google Scholar]
- 46.McConnell SK. The determination of neuronal fate in the cerebral cortex. Trends Neurosci. 1989;12:342–349. doi: 10.1016/0166-2236(89)90041-6. [DOI] [PubMed] [Google Scholar]
- 47.McConnell SK, Kaznowski CE. Cell-cycle dependence of laminar determination in developing neocortex. Science. 1991;254:282–285. doi: 10.1126/science.254.5029.282. [DOI] [PubMed] [Google Scholar]
- 48.McConnell SK, Ghosh A, Shatz CJ. Subplate pioneers and the formation of descending connections from cerebral cortex. J Neurosci. 1994;14:1892–1907. doi: 10.1523/JNEUROSCI.14-04-01892.1994. [DOI] [PMC free article] [PubMed] [Google Scholar]
- 49.Meyer G, Soria JM, Martínez-Galán JR, Martín-Clemente B, Fairén A. Different origins and developmental histories of transient neurons in the marginal zone of the fetal and neonatal rat cortex. J Comp Neurol. 1998;397:493–518. [PubMed] [Google Scholar]
- 50.Miller MW. Effect of prenatal exposure to alcohol on the distribution and time of origin of corticospinal neurons in the rat. J Comp Neurol. 1987a;257:372–382. doi: 10.1002/cne.902570306. [DOI] [PubMed] [Google Scholar]
- 51.Miller MW. The origin of corticospinal projection neurons in rat. Exp Brain Res. 1987b;67:339–351. doi: 10.1007/BF00248554. [DOI] [PubMed] [Google Scholar]
- 52.Miller MW. Effect of prenatal exposure to ethanol on the development of cerebral cortex: I. Neuronal generation. Alcohol Clin Exp Res. 1988;13:440–449. doi: 10.1111/j.1530-0277.1988.tb00223.x. [DOI] [PubMed] [Google Scholar]
- 53.Miller B, Chou L, Finlay BL. The early development of thalamocortical and corticothalamic projections. J Comp Neurol. 1993;335:16–41. doi: 10.1002/cne.903350103. [DOI] [PubMed] [Google Scholar]
- 54.Mustari MJ, Lund RD, Graubard K. Histogenesis of the superior colliculus of the albino rat: a tritiated thymidine study. Brain Res. 1979;164:39–52. doi: 10.1016/0006-8993(79)90004-0. [DOI] [PubMed] [Google Scholar]
- 55.Ogawa M, Miyata T, Nakajima K, Yagyu K, Seike M, Ikenaka K, Yamamoto H, Mikoshiba K. The reeler gene-associated antigen on Cajal-Retzius neurons is a crucial molecule for laminar organization of cortical neurons. Neuron. 1995;14:899–912. doi: 10.1016/0896-6273(95)90329-1. [DOI] [PubMed] [Google Scholar]
- 56.O’Leary DDM, Koester SE. Development of projection neuron types, axon pathways, and patterned connections of the mammalian cortex. Neuron. 1993;10:991–1006. doi: 10.1016/0896-6273(93)90049-w. [DOI] [PubMed] [Google Scholar]
- 57.O’Leary DDM, Stanfield BB. Occipital cortical neurons with transient pyramidal tract axons extend and maintain collaterals to subcortical but not intracortical targets. Brain Res. 1985;336:326–333. doi: 10.1016/0006-8993(85)90661-4. [DOI] [PubMed] [Google Scholar]
- 58.Oudega M, Varon S, Hagg T. Distribution of corticospinal motor neurons in the postnatal rat: quantitative evidence for massive collateral elimination and modest cell death. J Comp Neurol. 1994;347:115–126. doi: 10.1002/cne.903470109. [DOI] [PubMed] [Google Scholar]
- 59.Parnavelas JG, Barfield JA, Franke E, Luskin MB. Separate progenitor cells give rise to pyramidal and nonpyramidal neurons in the rat telencephalon. Cereb Cortex. 1991;1:463–468. doi: 10.1093/cercor/1.6.463. [DOI] [PubMed] [Google Scholar]
- 60.Pinto Lord MC, Evrard P, Caviness VS. Obstructed neuronal migration along radial glial fibers in the neocortex of the reeler mouse: a Golgi-EM analysis. Dev Brain Res. 1982;4:379–393. doi: 10.1016/0165-3806(82)90181-x. [DOI] [PubMed] [Google Scholar]
- 61.Polleux F, Dehay C, Kennedy H. The timetable of laminar neurogenesis contributes to the specification of cortical areas in mouse isocortex. J Comp Neurol. 1997a;385:95–116. [PubMed] [Google Scholar]
- 62.Polleux F, Dehay C, Kennedy H. Regulation of neuroblast cell-cycle kinetics plays a crucial role in the generation of unique features of neocortical areas. J Neurosci. 1997b;17:7763–7783. doi: 10.1523/JNEUROSCI.17-20-07763.1997. [DOI] [PMC free article] [PubMed] [Google Scholar]
- 63.Rakic P. Kinetics of proliferation and latency between final division and onset of differentiation of cerebellar stellate and basket neurons. J Comp Neurol. 1973;147:523–546. doi: 10.1002/cne.901470407. [DOI] [PubMed] [Google Scholar]
- 64.Rakic P. Differences in the time of origin and in eventual distribution of neurons in areas 17 and 18 of the visual cortex in rhesus monkey. Exp Brain Res [Suppl] 1976;1:244–248. [Google Scholar]
- 65.Rakic P. Genesis of the dorsal lateral geniculate nucleus in the rhesus monkey: site and time of origin, kinetics of proliferation, routes of migration and pattern of distribution of neurons. J Comp Neurol. 1977;176:23–52. doi: 10.1002/cne.901760103. [DOI] [PubMed] [Google Scholar]
- 66.Rakic P, Sidman RL. Subcommissural organ and adjacent ependyma: autoradiographic study of their origin in the mouse brain. Am J Anat. 1968;122:317–336. doi: 10.1002/aja.1001220210. [DOI] [PubMed] [Google Scholar]
- 67.Reh TA, Tully T. Regulation of tyrosine-hydroxylase-containing amacrine cell number in the larval frog retina. Dev Biol. 1986;114:463–469. doi: 10.1016/0012-1606(86)90210-1. [DOI] [PubMed] [Google Scholar]
- 68.Reznikov K. Cell proliferation and cytogenesis in the mouse hippocampus. Adv Anat Embryol Cell Biol. 1990;122:1–83. doi: 10.1007/978-3-642-76447-9. [DOI] [PubMed] [Google Scholar]
- 69.Schiffmann SN, Bernier B, Goffinet AM. Reelin mRNA expression during mouse brain development. Eur J Neurosci. 1997;9:1055–1071. doi: 10.1111/j.1460-9568.1997.tb01456.x. [DOI] [PubMed] [Google Scholar]
- 70.Schreyer DJ, Jones EG. Axon elimination in the developing corticospinal tract of the rat. Dev Brain Res. 1988a;38:103–119. doi: 10.1016/0165-3806(88)90089-2. [DOI] [PubMed] [Google Scholar]
- 71.Schreyer DJ, Jones EG. Topographic sequence of outgrowth of corticospinal axons in the rat: a study using retrograde axonal labeling with fast blue. Dev Brain Res. 1988b;38:89–101. doi: 10.1016/0165-3806(88)90088-0. [DOI] [PubMed] [Google Scholar]
- 72.Schultze B, Nowak B, Maurer W. Cycle times of the neural epithelial cells of various types of neuron in the rat. An autoradiographic study. J Comp Neurol. 1974;158:207–218. doi: 10.1002/cne.901580207. [DOI] [PubMed] [Google Scholar]
- 73.Schüz A, Palm G. Density of neurons and synapses in the cerebral cortex of the mouse. J Comp Neurol. 1989;286:442–455. doi: 10.1002/cne.902860404. [DOI] [PubMed] [Google Scholar]
- 74.Skoglund TS, Pasher R, Berthold CH. Heterogeneity in the columnar number of neurons in different neocortical areas in the rat. Neurosci Lett. 1996;208:97–100. doi: 10.1016/0304-3940(96)12569-6. [DOI] [PubMed] [Google Scholar]
- 75.Smart IHM, Smart M. Growth patterns in the lateral wall of the mouse telencephalon. I. Autoradiographic studies of the histogenesis of the isocortex and adjacent areas. J Anat. 1982;134:273–298. [PMC free article] [PubMed] [Google Scholar]
- 76.Smeyne RJ, Chu T, Lewin A, Bian F, Crisman SS, Kunsch C, Lira SA, Oberdick J. Local control of granule cell generation by cerebellar Purkinje cells. Mol Cell Neurosci. 1995;6:230–251. doi: 10.1006/mcne.1995.1019. [DOI] [PubMed] [Google Scholar]
- 77.Takahashi T, Nowakowski RS, Caviness VS. Mode of cell-proliferation in the developing mouse neocortex. Proc Natl Acad Sci USA. 1994;91:375–379. doi: 10.1073/pnas.91.1.375. [DOI] [PMC free article] [PubMed] [Google Scholar]
- 78.Takahashi T, Nowakowski RS, Caviness VS. The leaving or Q fraction of the murine cerebral proliferative epithelium: a general model of neocortical neurogenesis. J Neurosci. 1996;16:6183–6196. doi: 10.1523/JNEUROSCI.16-19-06183.1996. [DOI] [PMC free article] [PubMed] [Google Scholar]
- 79.Terashima T. Anatomy, development and lesion-induced plasticity of rodent corticospinal tract. Neurosci Res. 1995;22:139–161. doi: 10.1016/0168-0102(95)00895-9. [DOI] [PubMed] [Google Scholar]
- 80.Terashima T, Inoue K, Inoue Y, Mikoshiba K, Tsukuda Y. Distribution and morphology of corticospinal tract neurons in reeler mouse cortex by the retrograde HRP method. J Comp Neurol. 1983;218:314–326. doi: 10.1002/cne.902180307. [DOI] [PubMed] [Google Scholar]
- 81.Terashima T, Inoue K, Inoue Y, Mikoshiba K, Tsukuda Y. Distribution and morphology of callosal commissural neurons within the motor cortex of normal and reeler mice. J Comp Neurol. 1985;232:83–98. doi: 10.1002/cne.902320108. [DOI] [PubMed] [Google Scholar]
- 82.Valverde F, De Carlos JA, Lopez-Mascaraque L. Time of origin and early fate of preplate cells in the cerebral cortex of the rat. Cereb Cortex. 1995a;5:483–493. doi: 10.1093/cercor/5.6.483. [DOI] [PubMed] [Google Scholar]
- 83.Valverde F, Lopez-Mascaraque L, Santacana M, De Carlos JA. Persistence of early-generated neurons in the rodent subplate: assessment of cell death in neocortex during the early postnatal period. J Neurosci. 1995b;15:5014–5024. doi: 10.1523/JNEUROSCI.15-07-05014.1995. [DOI] [PMC free article] [PubMed] [Google Scholar]
- 84.Vincent SR, Kimura H. Histochemical mapping of nitric oxide synthase in the rat brain. Neuroscience. 1992;46:755–784. doi: 10.1016/0306-4522(92)90184-4. [DOI] [PubMed] [Google Scholar]
- 85.Welt C, Steindler DA. Somatosensory cortical barrels and thalamic barreloids in reeler mutant mice. Neuroscience. 1977;2:755–766. doi: 10.1016/0306-4522(77)90029-x. [DOI] [PubMed] [Google Scholar]
- 86.Williams RW, Herrup K. The control of neuron number. Annu Rev Neurosci. 1988;11:423–454. doi: 10.1146/annurev.ne.11.030188.002231. [DOI] [PubMed] [Google Scholar]
- 87.Woolsey TA, van der Loos H. The structural organization of layer IV in the somatosensory region (SI) of mouse cerebral cortex. Brain Res. 1970;17:205–242. doi: 10.1016/0006-8993(70)90079-x. [DOI] [PubMed] [Google Scholar]
- 88.Yurkewicz L, Valentino KL, Floeter MK, Fleshman JM, Jones EG. Effects of cytotoxic deletions of somatic sensory cortex in fetal rats. Somatosens Mot Res. 1984;1:303–327. doi: 10.3109/07367228409144553. [DOI] [PubMed] [Google Scholar]