Abstract
Working memory performance is influenced by dopamine activation of D1 family dopamine receptors in the prefrontal cortex; working memory performance is maximal at moderate stimulation of D1 family receptors and is reduced by either higher or lower levels of D1 stimulation. The neuronal mechanisms that underlie this complex relationship are not yet understood. Previous work from this laboratory has demonstrated that the D1 family receptors, D1 and D5, are located in different compartments of pyramidal cells. Here we use an antibody specific to the D1receptor and double-label immunohistochemistry at the light and electron microscopic level to demonstrate that D1-like immunoreactivity (D1-LIR) is also present in interneurons. D1 receptor is prevalent in parvalbumin-containing interneurons and is less common in calretinin-containing interneurons. At the ultrastructural level, D1-LIR is found associated with the Golgi apparatus and endoplasmic reticulum in the soma, with the membranes of vesicles in proximal dendrites, and with the plasma membrane on distal dendrites, where it is often located near asymmetric synapses. In addition, D1-LIR is also seen in presynaptic axon terminals, which give rise to symmetric synapses onto dendritic shafts and soma. These results raise the possibility that the circuit basis of working memory in the prefrontal cortex involves a D1-mediated inhibitory component.
Keywords: dopamine, receptor, D1, interneuron, GABA, parvalbumin, calbindin D-28k, calretinin, colocalization, immunofluorescence, electron microscopy, monkey, prefrontal cortex, working memory
Prefrontal cortex in the primate is critical for performance of cognitive tasks, especially those involving working memory (for review, see Goldman-Rakic, 1986), and a disorder of its function has been implicated in a variety of disease states, including schizophrenia (Weinberger et al., 1986, 1988; Baxter et al., 1989). Dopaminergic inputs to this brain region are important for its function; specific lesions of this mesocortical projection have been shown to impair performance on cognitive tasks as severely as ablation of the prefrontal cortex itself (Brozoski et al., 1979; Simon et al., 1980). The D1 family of dopamine receptors (D1 and D5) are an order of magnitude more abundant in the prefrontal cortex than D2 family receptors (D2, D3, and D4) (Farde et al., 1987;Goldman-Rakic et al., 1990; Lidow et al., 1991), and the actions of dopamine at D1 family dopamine receptors are essential to working memory function in both the human and nonhuman primate prefrontal cortex (Sawaguchi and Goldman-Rakic, 1991, 1994; Williams and Goldman-Rakic, 1995; Murphy et al., 1996; Müller et al., 1998).
Given the importance of D1 family receptors to the function of prefrontal cortex, the specific localization of these receptors in the circuitry of prefrontal cortex might shed light on which aspects of this circuitry are integral to cognitive function. Receptor binding studies have shown that ligands specific to D1 family dopamine receptors bind with higher density in superficial layers (layers I–IIIa) and deep layers (layers V and VI) than in middle cortical layers (layers IIIb–IV) (Lidow et al., 1991). Experiments examining the expression of mRNA coding for the D1 and D5receptors suggest that D1 is more prevalent than D5 in the cortex of human and nonhuman primates (Meador-Woodruff et al., 1996; Lidow et al., 1997), and this may be the predominant receptor subtype responsible for the cognitive effects of D1 family agonists and antagonists.
Recently, specific antibodies have been produced to individual dopamine receptors, allowing their location to be identified with both molecular specificity and excellent spatial resolution (Levey et al., 1993;Bergson et al., 1995). In monkey prefrontal cortex, ultrastructural studies have revealed that D1-like immunoreactivity (D1-LIR) is prevalent in dendritic spines (Smiley et al., 1994; Bergson et al., 1995), whereas the D5 receptor is predominately localized on the dendritic shafts of pyramidal cells (Bergson et al., 1995). These distributions contrast with those reported for the D2 and D4 receptors, which have been localized predominately in cortical interneurons (Mrzljak et al., 1996; Khan et al., 1998). However, immunohistochemical studies have shown that the D1 receptor is present in GABAergic neurons in the striatum (e.g., Hersch et al., 1995).
Here we report the results of double-label immunohistochemistry experiments at the light and electron microscopic level, which reveal that, in macaque, the D1 receptor is also present in cortical interneurons. We describe the distribution of the receptor in different interneuron subtypes and its subcellular localization and speculate on the relevance of these findings to the effects of D1 agonists and antagonists on working memory function.
MATERIALS AND METHODS
Tissue from four young adult monkeys (Macaca mulatta) was used in this study. The monkeys were perfused transcardially with 4% paraformaldehyde, (one monkey) or 4% paraformaldehyde, 0.2% glutaraldehyde, and 15% picric acid (three monkeys) in 0.1m phosphate buffer (PB, pH 7.4). The brain was post-fixed in 4% paraformaldehyde for 2 hr and blocked. In some cases the blocks were placed in an ascending series of sucrose solutions and then frozen and stored at −70°C. These blocks were later sectioned on a cryostat at 50 μm. In other cases, blocks were immediately cut on a vibratome at 50 μm. Vibratome sections were collected in PB, rinsed, and placed in small volumes of 15% sucrose in PB and then frozen in liquid nitrogen and stored at −70°C for later use.
Immunofluorescence experiments. Cryostat or vibratome sections from various cortical regions were rinsed in normal PBS (33 mm phosphate, pH 7.4) and placed in blocking serum (3% normal goat serum, 1% bovine serum albumin, 0.1% glycine, and 0.1% lysine in PBS) with 0.3% Triton X-100 for 1 hr. The sections were then placed in a mixture of primary immunoreagents in blocking serum for 36–60 hr at 4°C. The mixture consisted of rat anti-D1receptor and one of the following: guinea pig anti-GABA, mouse anti-calbindin D-28k (CB), mouse anti-parvalbumin (PV), or rabbit anti-calretinin (CR). The sources and dilutions of each immunoreagent are given in Table 1. The monoclonal antibody to D1 has been characterized previously by binding to fusion proteins, transfected cells, and rat brain membranes and shows no cross-reactivity to other dopamine receptors (Hersch et al., 1995). After incubation in the primary mixture, the sections were rinsed in PBS and placed in a mixture of secondary antisera (Table 1). After 4 hr at room temperature the sections were rinsed and mounted on gelatin-coated slides and allowed to air dry at 4°C. The sections were then coverslipped using a glycerol-based media (Vector Laboratories, Burlingame, CA) and nail polish to seal the coverslip. Control experiments were performed for each primary immunoreagent listed in Table 1, in which only one primary immunoreagent was used, and the secondary antisera used was directed at an appropriate alternative primary immunoreagent, e.g., mouse anti-PV followed by CY3-donkey anti-rat. In these controls, only light autofluorescence and no cross-reactive staining was observed. The penetration of the antibody to D1 was as good as, or better than, the penetration of the other immunoreagents. Accordingly, the quantification of the immunofluorescence experiments was conducted by identifying interneurons by labeling with GABA, CB, PV, or CR and then determining the number of these interneurons that contained D1-LIR. In this way, the difference in the penetration of the interneuron identifying immunoreagents, e.g., anti-GABA and anti-PV, affects the number of interneurons identified on each section, but the percentage that also contain D1-LIR is not affected.
Table 1.
Immunoreagents and antisera used
| Primary immunoreagents | Secondary antisera |
|---|---|
| Rt anti-D1 receptor (RBI, 1:500) | CY3-D anti-Rt (Jackson, 1:100) or B-Gt anti-Rt (Jackson, 1:200) |
| GP anti-GABA (Eugene Tech, 1:1000) | FITC-D anti-GP (Jackson, 1:100) or Au-Gt anti-GP (FAB, Nanoprobe, 1:200) |
| Ms anti-PV (Sigma, 1:10,000) | FITC-D anti-Ms (Jackson, 1:100) or Au-Gt anti-Ms (FAB, Nanoprobe, 1:200) |
| Rbt anti-CR (gift of Rogers, 1989, 1:30,000) | FITC-D anti-Rbt (Jackson, 1:100) |
| Ms anti-CB (Sigma, 1:10,000) | FITC-D anti-Ms (Jackson, 1:100) |
All antibodies are in the form of IgG, except the gold-conjugated antisera, which are in the form of FAB fragments. Secondary antisera with a CY3 or FITC prefix are conjugated to the fluorochromes indocarbocyanine or fluorescein isothiocyanate; those with a B prefix are biotinylated. Other abbreviations are as follows: Rt, Rat; GP, guinea pig; Ms, mouse; Rbt, rabbit; D, donkey; Gt, goat; PV, parvalbumin; CR, calretinin; CB, calbindin D-28k; RBI, Research Biochemicals.
Sections were examined and photographed using FITC and rhodamine filter cubes. To quantify the distribution of single- and double-labeled cells, plots were made using the Neurolucida plotting system (MicroBrightField, Colchester, VT). Samples of cortex extending from the pial surface to the white matter 500 μm wide were plotted from cortical areas 46, 9, and 24 (Walker, 1940) and, in the case of the GABA/D1 immunofluorescent experiments, area 17. These areas were chosen to represent an area where dopamine and the D1 receptor have been shown to have functional significance (area 46) (Williams and Goldman-Rakic, 1995) and areas of dense (areas 9 and 24) and sparse (area 17) dopamine input (Lewis et al., 1987; Van Eden et al., 1987; Williams and Goldman-Rakic, 1993) where the significance of D1 receptor action remains to be established. Individual labeled neurons were viewed, and their location was plotted at a magnification of 800×. The material was examined using an FITC filter cube, and once a labeled interneuron was identified, the filter was changed to the rhodamine filter cube to determine whether the cell was single- or double-labeled. For the GABA/D1 experiments, five plots each were made in areas 46, 9, and 24, representing 2265 GABA+ cells, and three plots were made in area 17, representing 473 GABA+ cells. In the CB/D1 and CR/D1 experiments, eight plots each were made for areas 46, 9, and 24, representing 1604 CB cells and 3325 CR cells, respectively. In the PV/D1 experiment, six plots were made for areas 46, 9, and 24, representing 2839 PV cells. The CB antibody weakly stains a group of pyramidal cells in layer III in addition to strongly labeling interneurons (Gabbott and Bacon, 1996). In some cases labeled neurons could be unequivocally identified as having pyramidal or nonpyramidal morphology, and examples of single- and double-labeled cells with both morphologies could be found. However, in many cases it was impossible to ascertain with certainty the type of cell that was labeled. Accordingly, we did not attempt to restrict our analysis to neurons of a particular type. Thus, pyramidal neurons may be included in our analysis of CB-containing neurons, but not of GABA-, PV-, or CR-containing neurons.
The number of single- and double-labeled neurons was obtained from each plot. The percentage of interneurons that contained D1-LIR was obtained for each plot, and means and SDs were calculated. After a section was plotted, the coverslip was removed, and the sections were stained for Nissl substance with thionin. The counterstained section was then used to determine the laminar borders for the plots that had been generated from that section. ANOVAs were applied to comparisons between different interneuron populations, different cortical areas, and different cortical laminae. Post hoc comparisons with the Tukey honestly significantly different (HSD) test were made if the ANOVA revealed a significant effect.
Electron microscopy experiments. Vibratome sections from the prefrontal cortex were thawed in excess cold PBS and then rinsed three times. The sections were then placed in blocking serum (as above with 0.5% fish gelatin added and without Triton X-100) for 1 hr. They were then placed in a primary mixture in the same diluent for 36–60 hr. The mixture consisted of rat anti-D1 and either guinea pig anti-GABA or mouse anti-PV (used at the same titers as above). After incubation in primary mixture, the sections were rinsed in PBS and incubated for 1 hr in a mixture of secondary antisera: biotinylated goat anti-rat and goat FAB fragment directed against either guinea pig or mouse IgG and conjugated to a 1.4 nm gold particle (see Table 1). The sections were then rinsed, and the immunogold signal was intensified with silver at room temperature in the dark (Nanoprobes, New York, NY). The length of time for the silver intensification was determined empirically, and optimal-sized silver particles were observed after a 2 min incubation in the reaction mixture. The sections were then rinsed, gold-toned (Arai et al., 1992), rinsed, and incubated in ABC reagent (Vector) for 1 hr. The presence of peroxidase was revealed with diaminobenzidine (DAB) using the glucose oxidase method (Itoh et al., 1979). The sections were then rinsed in 0.1 mcacodylate buffer, pH 7.4, osmicated in 1% OsO4 for 10 min, rinsed, dehydrated in alcohol and propylene oxide, and then flat-embedded in Durcupan resin.
Selected regions of area 9 were mounted onto Durcupan blocks. Ultrathin sections were cut and collected on Formvar-coated slot grids. The grids were examined on a JEOL 1010 electron microscope, and selected regions were photographed. Because the two labels differentially penetrate tissue, only sections from the surface of the block, where both DAB and gold particles were visible, were examined. To limit the possibility of false-positive double labeling, we performed the immunogold staining before the DAB staining, because silver from the silver intensification step is known to precipitate onto DAB (Smiley and Goldman-Rakic, 1993). Control experiments, in which the primary immunoreagents were omitted failed to reveal labeling with either DAB or immunogold. When only the antibody to D1 was omitted, no deposition of DAB around silver-intensified immunogold particles was observed.
RESULTS
D1/GABA immunofluorescence
Sections of cerebral cortex were stained for both the D1 receptor and GABA using the immunofluorescence method. Double-labeled cells could be identified not only on the basis of the two colors of the fluorochromes but also on the basis of the different staining pattern of D1 compared with GABA staining. The D1 antibody produced a reticulated staining pattern in the soma and proximal dendrites, whereas the GABA antisera produced an even staining of the soma, which rarely extended into the proximal dendrites (Fig. 1A,B). Most GABA neurons contained D1-LIR (Fig.2A), and there were no obvious distinguishing characteristics that differentiated GABA+/D1+ from GABA+/D1− cells. In single plots, the percentage of double labeled cells in areas 9, 46, 24, and 17 varied from 66.5 to 89.4%. Differences between the cortical areas were not significant (F(3,14) = 0.168;p > 0.9), and accordingly, the data were pooled, revealing that 78.2 ± 6.2% of GABAergic interneurons contained demonstrable D1-LIR.
Fig. 1.
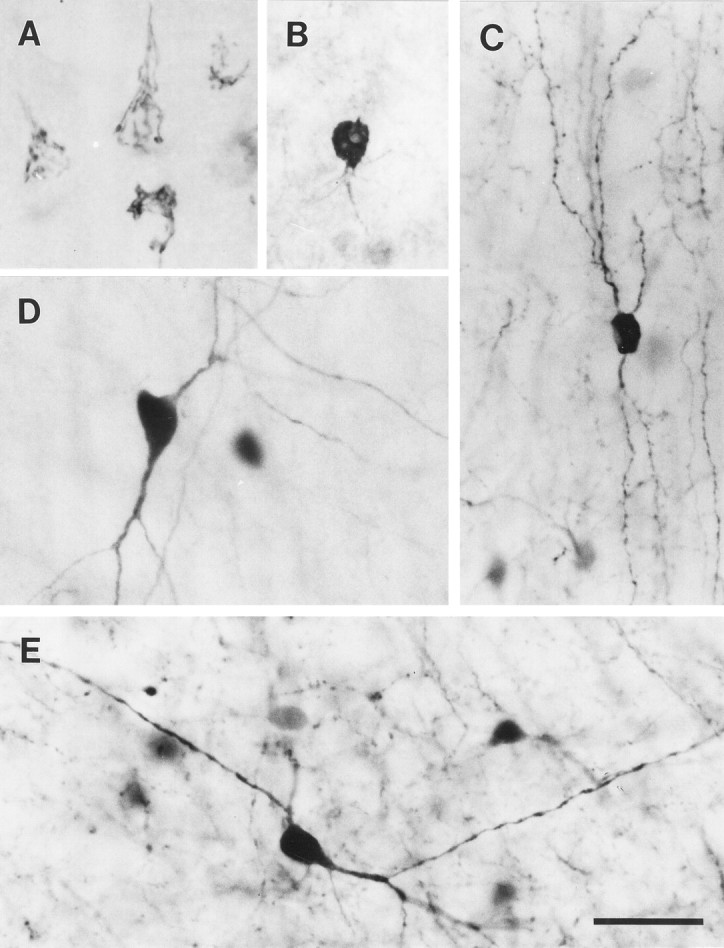
Photomicrographs of immunostained neurons, illustrating the patterns of label associated with each of the immunoreagents used in this study. The antibody to the D1receptor produces a reticulated pattern of label in the cell soma, which may extend into the proximal dendrites (A). This reticulated pattern of staining represents the endoplasmic reticulum and Golgi apparatus of the labeled neuron (see Fig. 5). Many of the labeled cells have a pyramidal morphology and a prominent apical dendrite. The antisera to GABA produces a relatively homogeneous staining of the cell soma and occasionally weakly labels the proximal dendrites (B). The antisera to calretinin (C) and the antibodies to calbindin D-28k (D) and parvalbumin (E) produce a Golgi-like staining pattern that labels the soma and proximal and distal neurites, some of which appear to be axons. Scale bar, 30 μm.
Fig. 2.
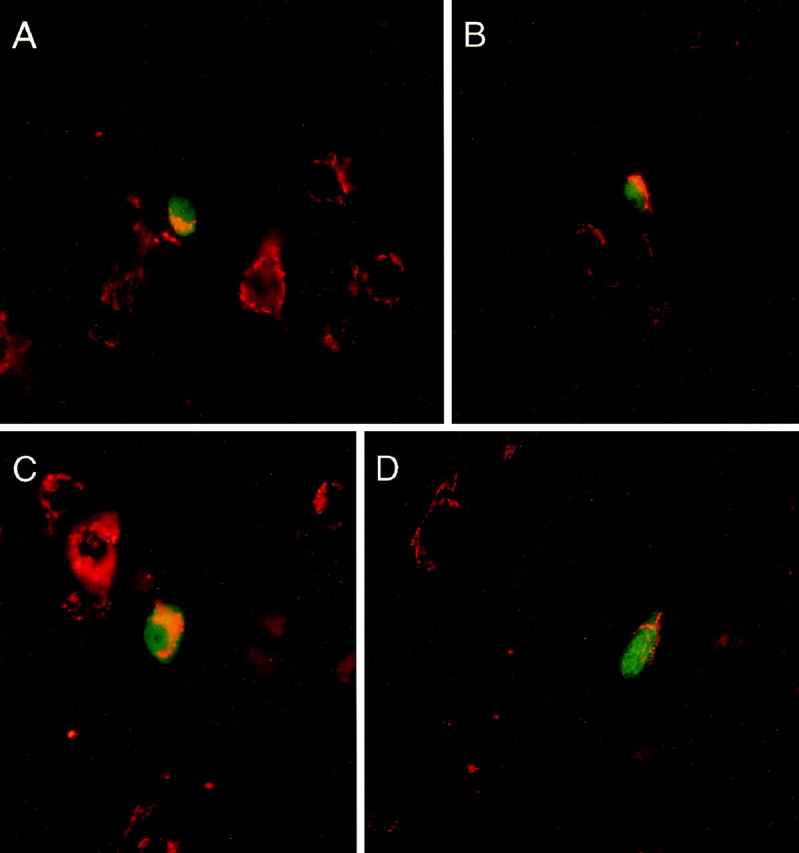
Photomicrographs of double-label immunofluorescent staining of cortical interneurons and the D1 receptor showing colocalization. In all cases, D1-LIR is demonstrated by CY3 (red), and the different interneuron types are demonstrated by FITC staining (green). Most D1+ neurons are single-labeled and have a pyramidal morphology (e.g., A,D). Examples of neurons labeled by staining for GABA (A), CB (B), PV (C), and CR (D), which also contain D1-LIR, are shown. Of the four classes of interneurons, double-labeled PV cells tended to have the largest amount of D1-LIR, whereas double-labeled CR cells tended to have the least.
Colocalization of D1 and calciumbinding proteins (CaBPs)
Double-label immunofluorescence experiments with antibodies to D1 and the CaBP (CB, PV, and CR) allowed us to determine whether D1-LIR was preferentially located on particular subtypes of GABAergic interneurons. The different CaBPs are found in largely nonoverlapping populations of GABAergic interneurons in mammalian neocortex (Hendry et al., 1989; Van Brederode et al., 1990;Rogers, 1992; Kubota et al., 1994). Once again, identification of double-labeled cells was facilitated by different staining patterns. In contrast to the reticulated staining observed with the D1antibody, the antibodies to the CaBP labeled neurons in a Golgi-like manner, diffusely staining their soma and usually their dendrites and axons (Fig. 1C–E). Examples of double-labeled neurons were observed for all three CaBPs (Fig. 2B–D). Of the D1+ population, D1 labeling was most dense in PV cells, least dense in CR cells, and intermediate in CB cells.
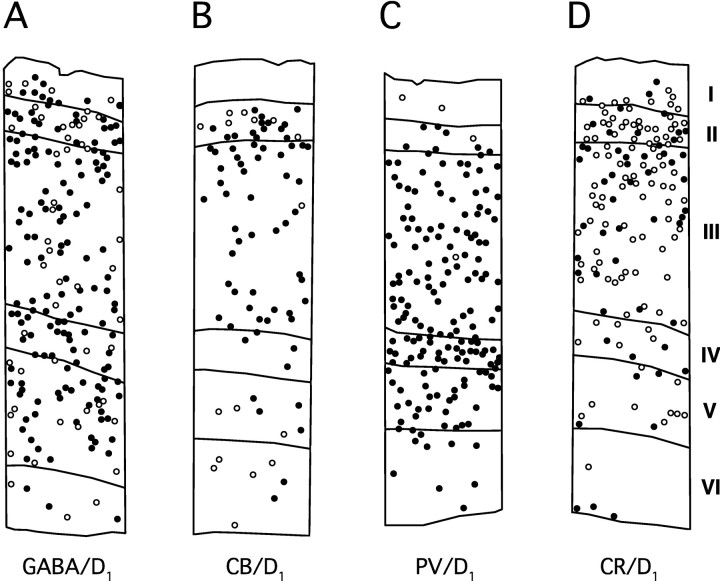
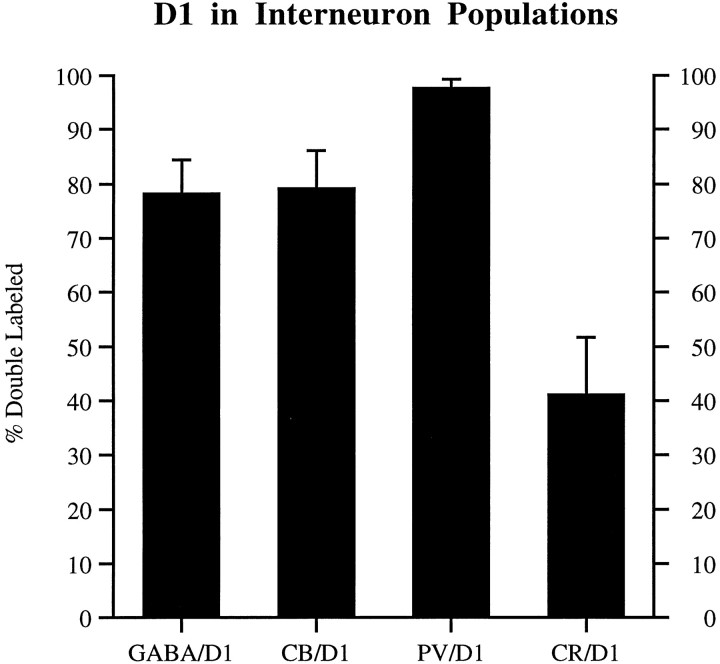
The different classes of interneurons varied significantly in their frequency of colocalization with the D1 receptor in areas 9, 46, and 24. A higher percentage of PV neurons showed colocalization with D1-LIR; CR showed the least colocalization with D1-LIR and GABA; and CB exhibited intermediate degrees of colocalization (F(3,69) = 206.117;p < 0.001). The degree of colocalization with the D1 receptor did not vary significantly with cortical area (F(2,69) = 0.197; p = 0.822). Examples of area 46 plots for the four double-label experiments are shown in Figure 3. The means and SDs, pooled for all three cortical areas, are as follows: 78.3 ± 6.8% of GABA+ cells, 79.1 ± 7.0% of CB+ cells, 97.6 ± 1.7% of PV+ cells, and 41.1 ± 10.5% of CR+ cells were D1+ (Fig. 4). Post hoc Tukey HSD tests revealed that with the exception of the GABA and CB pair, all pairwise comparisons were significant (GABA vs PV, p < 0.001; GABA vs CR, p < 0.001; PV vs CR,p < 0.001; PV vs CB, p < 0.001; CR vs CB, p < 0.001; GABA vs CB, p = 0.986). These results indicate that GABA+/D1+ neurons include essentially all PV cells, and that GABA+/D1− neurons include the bulk of CR neurons.
Fig. 3.
Examples of four plots of single- and double-labeled interneurons in area 46 showing the different degrees of colocalization and laminar patterns. Open circlesindicate single-labeled interneurons; filled circlesindicate double-labeled interneurons. Laminar borders are marked on each plot and indicated by the roman numerals to theright. Most interneurons stained for GABA (A) and CB (B) contain D1-LIR. Almost all PV-stained interneurons contain D1-LIR (C), whereas most CR-stained interneurons do not contain detectable D1-LIR (D). CB+/D1+ neurons are most prevalent in layer III; the other layers have higher percentages of single-labeled CB neurons (B). The few PV interneurons that do not contain D1-LIR tend to be in layers I and II (C).
Fig. 4.
Graph illustrating the degree to which different interneuron populations contain D1-LIR. Interneuron populations were defined by staining for GABA, CB, PV, or CR. The percentage of neurons in these populations that contained D1-LIR with SD bars is presented. GABA and CB neurons have similar degrees of D1 colocalization (75–80%), whereas PV neurons have markedly higher degrees of D1 colocalization (98%), and CR neurons have markedly lower degrees (40%).
We next analyzed the laminar distribution of single- and double-labeled interneurons in areas 9 and 46 (area 24 was excluded, because this area lacks a layer IV, making comparisons with six layered neocortex difficult). The two-way ANOVA for each cell class with factors of cortical area (areas 46 and 9) and cortical layer (layers I, II, III, IV, V, and VI) demonstrated that the subpopulations of interneurons differed in the laminar distribution of single- versus double-labeled cells. For both GABA neurons and CR neurons, the percentage of double-labeled, D1-LIR containing neurons did not vary in the different cortical layers (Table 2). PV and CB neurons, on the other hand, did show significantly different percentages of colocalization with D1 in different cortical layers (F(5,58) = 3.125; p = 0.014, PV neurons; F(4,68) = 16.300;p < 0.001, CB neurons; Table 2). Fewer double-labeled PV neurons were found in layers I and II than in other layers, whereas the percentage of double-labeled CB neurons peaked in layer III and fell off, both superficially in layer II as well as deeper in layers IV–VI (Table 2). It is tempting to speculate that this distribution of double-labeled CB+/D1+ cells is attributable to the labeling of layer III pyramidal cells by the CB antibody. We have seen examples of both single- and double-labeled CB+ pyramidal and nonpyramidal cells. However, without other markers to unambiguously divide CB neurons into pyramidal and nonpyramidal types, quantification of the percentage of colocalization with D1 in these two populations would not produce reliable results. No effect of cortical area was found for any of the four cell classes.
Table 2.
Percentage of interneurons labeled with GABA, CB, PV, or CR that were also labeled with D1 across the six cortical layers
| Layer | GABA/D1 (%) | CB/D1(%) | PV/D1 (%) | CR/D1 (%) |
|---|---|---|---|---|
| I | 70.4 ± 7.8 | — | 69.2 ± 44.22-f | 37.8 ± 31.6 |
| II | 72.8 ± 12.7 | 66.2 ± 12.42-a | 87.0 ± 11.9 | 41.8 ± 14.7 |
| III | 80.1 ± 10.4 | 93.6 ± 4.62-b | 98.3 ± 1.72-f | 44.7 ± 9.4 |
| IV | 85.2 ± 12.9 | 76.2 ± 32.72-c | 98.8 ± 1.92-f | 48.4 ± 23.6 |
| V | 69.2 ± 28.6 | 75.9 ± 12.52-d | 98.6 ± 2.32-f | 47.7 ± 29.2 |
| VI | 77.0 ± 17.8 | 54.8 ± 20.42-e | 98.8 ± 4.12-f | 36.0 ± 35.5 |
| 2-way ANOVA | ||||
| Main effect area | F(1,47) = 0.887;p = 0.351 | F(1,68) = 3.267;p = 0.075 | F(1,58) = 0.582;p = 0.449 | F(1,80) = 0.132;p = 0.717 |
| Main effect layer | F(5,47) = 1.673; p = 0.160 | F(4,68) = 16.30; p < 0.001 | F(5,58) = 3.125; p = 0.014 | F(5,80) = 0.538; p = 0.747 |
No CB+ cells were found in layer I. The post hocanalysis of significant main effects for the CB/D1 analyses are given below.
Versus layer III (p < 0.001) and layer IV (p = 0.004).
Versus layer II (p < 0.001), layer V (p = 0.014), and layer VI (p < 0.001).
Versus layer II (p = 0.004) and layer VI (p < 0.001).
Versus layer III (p = 0.014) and layer VI (p = 0.002).
Versus layer III (p < 0.001), layer IV (p < 0.001), and layer V (p = 0.002).
For PV/D1 the post hocanalyses are layer I trends to be lower than layer III (p = 0.084), layer IV (p= 0.067), layer V (p = 0.073), and layer VI (p = 0.068).
Subcellular localization of D1-LIR in interneurons
Material from double-label experiments was then examined with the electron microscope to confirm colocalization of D1 in interneurons and to examine the subcellular localization of D1 receptor in these neurons. DAB was used to reveal the presence of D1, and immunogold was used to reveal the presence of either GABA or PV. This method confirmed the presence of D1-LIR in both GABA+ and PV+ neurons. Gold particles were present throughout the cytoplasm and nucleus of labeled neurons. DAB was observed in the endoplasmic reticulum and Golgi complexes of both single- and double-labeled cells (Fig.5A–C). D1-LIR was not associated with the plasma membrane of the soma or the immediately adjacent proximal dendrites. This was true for all double-labeled cells examined as well as for all single-labeled, D1+, neurons.
Fig. 5.
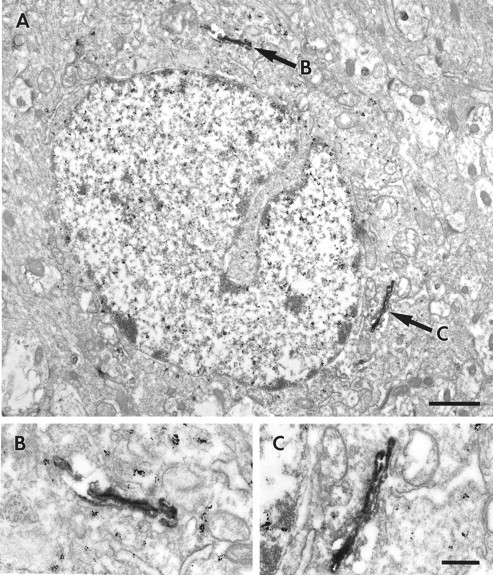
Electron micrographs illustrating a GABAergic interneuron that contains the D1 receptor. Gold particles, representing GABA immunostaining, fill the soma of the neuron. D1-LIR (DAB, arrows) labels the Golgi apparatus, shown at higher magnification in B andC. Scale bars: A, 1 μm; B, C, 250 nm.
We focused on D1/PV double-label experiments to examine the distal dendrites of interneurons for D1-LIR, both because the PV antibody reliably stained dendrites and axons at the electron microscopic level, and because the vast majority of PV neurons contained D1-LIR in our immunofluorescence experiments. D1-LIR could be identified as patches of DAB reaction product in PV+, immunogold-stained dendrites. In large-caliber, presumably proximal PV+ dendrites, D1-LIR could sometimes be identified (Fig. 6); however, the DAB was always associated with internal membrane structures and never the plasma membrane. Only in smaller-caliber, presumably distal PV+ dendrites were patches of D1-LIR seen associated with the plasma membrane of the dendrite, as well as with internal membranes. When followed in serial section, D1staining associated with the plasma membrane was often located adjacent to asymmetric synapses onto the PV dendrite (Fig.7), in a pattern that is reminiscent of the D1 staining in pyramidal cell spines, which receive asymmetric synapses.
Fig. 6.
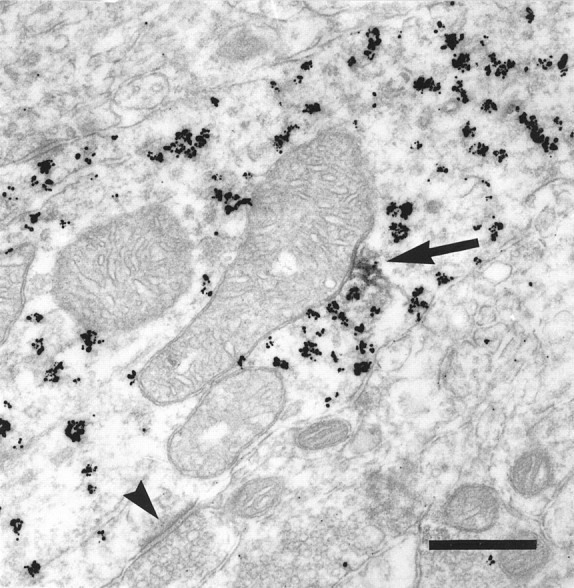
Electron micrograph illustrating D1 in the proximal dendrite of an interneuron. This large-caliber dendrite of an interneuron contains parvalbumin (gold particles) and receives an asymmetric synapse (arrowhead). D1-LIR (DAB,arrow) is found associated with internal vesicles but not with the plasma membrane. Scale bar, 400 nm.
Fig. 7.
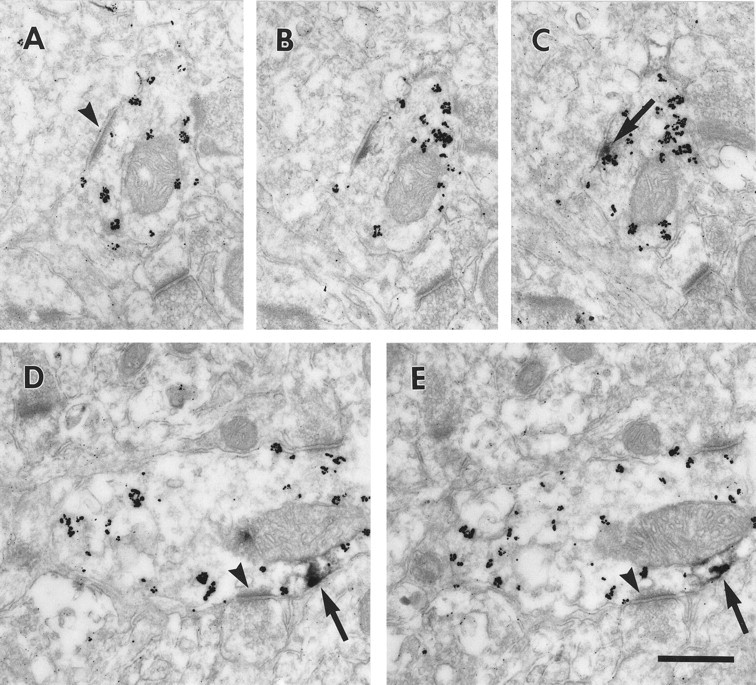
Electron micrographs illustrating D1in the distal dendrites of interneurons. Serial sections through two parvalbumin (gold particles)-containing small-caliber dendrites are presented. In the first, the dendrite receives an asymmetric synapse (A, arrowhead). The synapse disappears on the adjacent sections (B, C), and D1-LIR associated with the plasma membrane (DAB,arrow) appears. In the second (D,E), the dendrite receives an asymmetric synapse (arrowheads), and D1-LIR is associated with the plasma membrane, adjacent to the synapse (arrows). Scale bar, 400 nm.
In addition to D1 staining in distal dendrites, D1 was also localized in PV+ axon terminals. Figure8 illustrates two PV+ axons, identifiable by the synaptic vesicles that they contain, one of which gives rise to a symmetric synapse onto an unlabeled dendritic shaft; both profiles contain D1-LIR. Another example (Fig.9) contains a patch of D1-LIR, which, when followed in serial sections, is adjacent to the presynaptic specialization of a symmetric synapse onto a cell soma. This also parallels the presence of D1-LIR in axon terminals that give rise to asymmetric synapses (Bergson et al., 1995; Hersch et al., 1995).
Fig. 8.
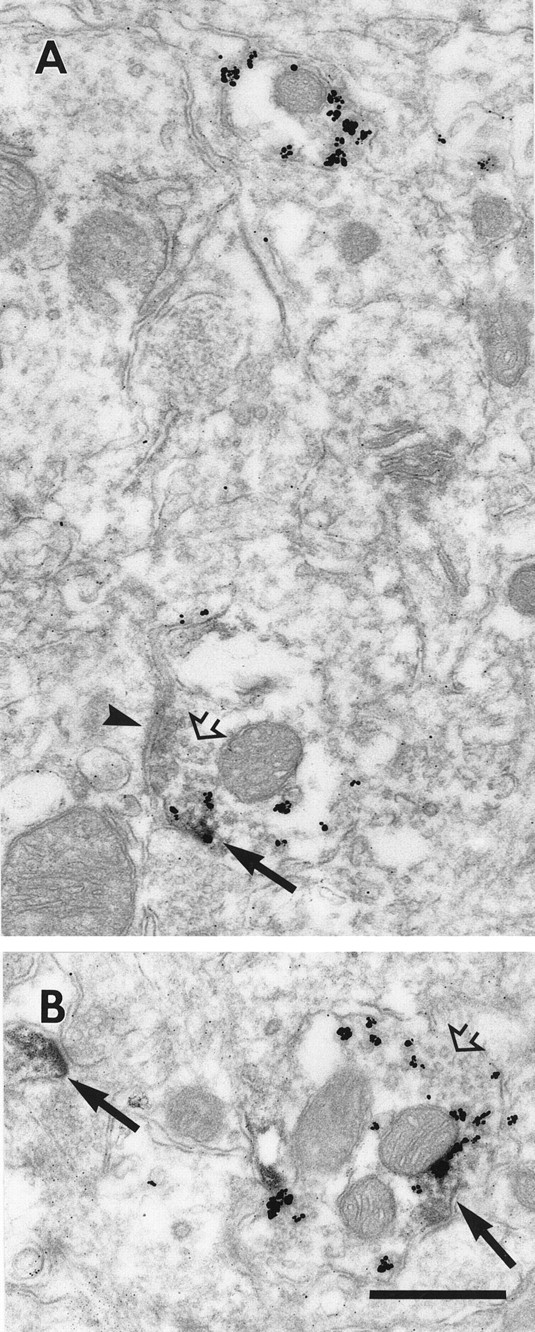
Electron micrographs illustrating D1in the axons of interneurons. A, Profile of the axon terminal of an interneuron, containing parvalbumin (gold particles) and synaptic vesicles (open arrow), which is making a symmetric synapse onto an unlabeled profile (arrowhead). D1-LIR is also seen in the terminal associated with the plasma membrane (arrow). Above the double-labeled axon terminal is a single-labeled PV+ profile for comparison.B, Axonal profile that is labeled with parvalbumin and contains synaptic vesicles (open arrow). D1-LIR is present in the profile as well as in a nearby dendritic spine (arrows). Scale bar, 400 nm.
Fig. 9.
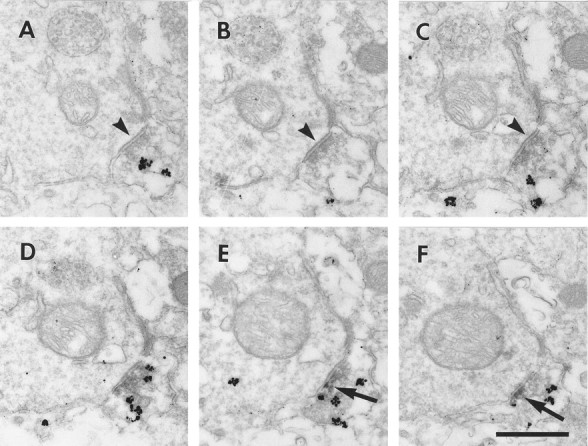
Electron micrographs of serial sections through a double-labeled axosomatic terminal. A parvalbumin-labeled axon terminal is located adjacent to an unlabeled soma. The terminal makes a symmetric synapse onto the soma (A–C, arrowheads). As the synapse leaves the plan of section, D1-LIR appears, associated with the plasma membrane (E, F, arrows). Scale bar, 400 nm.
DISCUSSION
These results demonstrate that the D1 receptor is present in GABAergic interneurons of macaque cerebral cortex and is differentially distributed in subtypes of interneurons defined by the presence of different CaBPs. D1 is seen in ∼75% of neurons labeled for GABA and in a similar percentage of neurons that contain CB. Almost all PV-containing interneurons (98%) and a minority of CR-containing interneurons (40%) contain D1-LIR. The distribution of D1-containing interneurons does not vary across different cortical areas but does vary across cortical laminae for some types of interneurons. At the ultrastructural level the localization of the D1 receptor in interneurons is analogous to that seen in pyramidal cells, being located in the distal dendrites of interneurons, adjacent to asymmetric, presumably glutamatergic synapses, and in presynaptic terminals.
Evidence for D1 in GABAergic neurons
Although previous studies of the D1 receptor in macaque prefrontal cortex have emphasized its presence in the spines of pyramidal neurons, there is precedence for D1 family receptors in GABAergic neurons. Stimulation of D1 family receptors increases the synthesis and release of GABA in the striatum (Girault et al., 1986;Steulet et al., 1990; Aceves et al., 1995) and substantia nigra pars reticulata (Aceves et al., 1992). D1-LIR has been reported in the medium spiny neurons of the striatum, which are GABAergic (Hersch et al., 1995; Yung et al., 1995; Surmeier et al., 1996). D1 family receptor stimulation modulates GABA-mediated IPSPs in the substantia nigra and basal forebrain (Cameron and Williams, 1993;Momiyama and Sim, 1996) and also augments evoked IPSPs in rodent prefrontal cortex (Yang et al., 1997). In addition, ligand binding studies in the rat have suggested that D1 family receptors are preferentially present in interneurons on the basis of the size of labeled cells (Vincent et al., 1993). In summary, the literature supports D1 family- and, in some cases, D1receptor-mediated effects in GABAergic cells in a variety of structures. The data reported here extend these findings to macaque cortex.
Implications of the distribution of D1 in different cortical areas, layers, and interneuron subtypes
Our finding that the percentage of D1-containing GABAergic neurons does not vary across cortical areas is surprising, given that the four areas examined receive dopaminergic input of such varying strength (Lewis et al., 1987; Van Eden et al., 1987; Williams and Goldman-Rakic, 1993). However, dopamine produces similar enhancement of NMDA-gated currents in human brain slices taken from temporal, frontal, parietal, and occipital cortex, and this effect is blocked by D1 antagonists (Cepeda et al., 1992, 1993). The cortical D1 receptor is located extrasynaptically (Smiley et al., 1994) and may be stimulated by the volume transmission of dopamine (Chergui et al., 1994; Garris and Wightman, 1994). Furthermore, dopaminergic afferents in different regions vary in their capacity to release and take up dopamine such that, in regions with different densities of dopaminergic inputs, there may be sufficient dopamine overflow to support volume transmission and stimulate extrasynaptic D1 receptors (Garris and Wightman, 1994).
We also find that subtypes of interneurons vary in the extent to which they contain D1. Almost all PV+ cells contain substantial D1-LIR, whereas most CR+ cells have no detectable D1-LIR, and CB+ cells fall in between these extremes. These findings parallel those of experiments examining contacts between dopaminergic axon terminals and interneurons. Axon terminals containing tyrosine hydroxylase (TH) have been shown to synapse onto subtypes of GABA-containing neurons in monkey cortex; specifically, TH-containing terminals synapse onto PV-containing interneurons but not onto CR-containing interneurons (Sesack et al., 1995; Lewis et al., 1996). PV+ neurons include basket and chandelier cells that target the proximal portions of pyramidal cells (DeFelipe et al., 1989; Hendry et al., 1989; Lund and Lewis, 1993; Condé et al., 1994), CB+ neurons include neurogliaform cells, which target the distal portions of pyramidal cells (Kisvarday et al., 1990; Lund and Lewis, 1993;Condé et al., 1994), and CR+ cells include a subgroup of double-bouquet cells whose terminals selectively target other interneurons (Gulyás et al., 1996; Meskenaite, 1997). Thus, D1-mediated effects on interneurons might be particularly strong on those cells with the strongest inhibitory effect on cortical pyramidal cells and weakest on those cells that may target other inhibitory interneurons and perform a disinhibitory role.
Functional implications
Although the effects of dopamine have long been believed to be inhibitory, recent evidence suggests that dopamine acting at the D1 receptor can facilitate neuronal firing (Williams and Goldman-Rakic, 1995; Yang and Seamans, 1996). Dopamine, acting at the D1 receptor, enhances glutamate-gated currents, specifically the NMDA-gated current (Cepeda et al., 1993; Maguire and Werblin, 1994; Smith et al., 1995; Zheng et al., 1996). A morphological substrate for the interaction between D1 receptors and glutamatergic inputs is the location of D1-LIR adjacent to asymmetric, presumably excitatory and glutamatergic synapses (Colonnier, 1968; DeFelipe et al., 1988), both on the spines of pyramidal cells and on the dendritic shafts of nonpyramidal cells (data presented here and Bergson et al., 1995). Electrophysiological recordings in the cortex and striatum demonstrate that dopamine can both enhance neuronal firing directly and increase the inhibitory input to that neuron (Penit-Soria et al., 1987; Williams and Millar, 1990).Williams and Millar (1990) have shown in the striatum that the balance between excitation and inhibition is dependent on the concentration of dopamine; excitation is seen at low levels of dopamine, whereas at higher levels of dopamine, inhibition dominates.
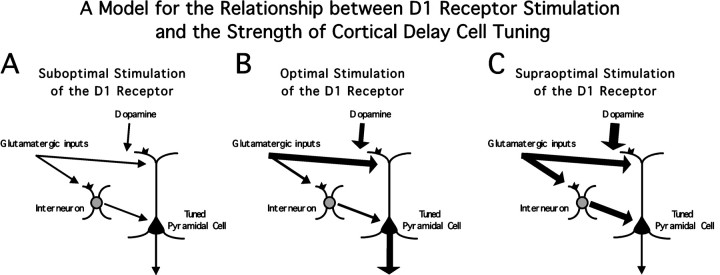
This suggests a possible model to explain the inverted U relationship of D1 activation and working memory performance (Murphy et al., 1996;Zahrt et al., 1997), as well as the results of D1 occupancy on neuronal delay period firing (Williams and Goldman-Rakic, 1995). With suboptimal stimulation of the D1 receptor, excitatory inputs to pyramidal and nonpyramidal cells support modest delay activity in pyramidal cells (Fig.10A). As dopaminergic stimulation of the D1 receptor increases, enhancement of excitatory inputs to pyramidal cells becomes maximal, while enhancement of inputs to interneurons is still modest, and the delay activity in pyramidal cells reaches a maximum (Fig. 10B). As dopaminergic stimulation of the D1 receptor increases further, the enhancement of excitatory inputs to interneurons reaches a maximum, and the enhancement of inputs to pyramidal cells plateaus. In this state, the delay activity in pyramidal cells is limited because of D1-mediated feed-forward inhibition (Fig. 10C).
Fig. 10.
Model for the relationship between D1 receptor stimulation and the strength of cortical activity during the delay of a working memory task. Dopamine, acting at D1 receptors, enhances glutamatergic inputs acting on the NMDA receptor. At low levels of dopamine release (A), these inputs are not enhanced to either pyramidal neurons or interneurons. At moderate levels of dopamine release, the glutamatergic inputs to pyramidal cells are primarily enhanced, leading to an increase in pyramidal cell delay activity (B). At high levels of dopamine release, the glutamatergic inputs are enhanced to both pyramidal cells and interneurons, leading to a reduction in pyramidal cell activity by feed-forward inhibition (C).
Two lines of evidence support the possibility of differential effectiveness of dopamine at D1 receptors in pyramidal versus nonpyramidal cells. First, in macaque prefrontal cortex, pyramidal cell dendrites have a higher density of close contacts with TH-containing axon terminals than interneuron dendrites (Krimer et al., 1997). Thus pyramidal cells may be in closer proximity to dopamine release sites than interneurons, and their D1 receptors might be maximally stimulated more readily than the D1receptors of interneurons. Second, the D1 receptor acts via a second messenger cascade that includes cAMP (Gingrich and Caron, 1993), which can diffuse from the site of its production (Hempel et al., 1996). Although the specific mechanism that underlies the interaction between D1 family receptor stimulation and altered glutamate-gated channel currents is not known, it likely involves this second messenger cascade. On pyramidal neurons, the spine can act as a biochemical compartment to restrict the diffusion of second messenger away from the associated asymmetric synapse and to maintain a high concentration for maximal effect (Müller and Connor, 1991; Koch and Zador, 1993). On nonpyramidal neurons, the location of the D1 receptor and asymmetric synapse on the dendritic shaft might allow for more diffusion and thus a lower concentration of second messengers and reduced effect at the asymmetric synapse. This model remains to be tested; nevertheless, the results presented here suggest that the impact of dopamine on working memory may involve actions on both nonpyramidal as well as pyramidal neurons.
Footnotes
This work was supported by National Institutes of Health Grant MH44866 and a Pfizer postdoctoral fellowship to E.C.M. We thank G. Williams, N. Vnek, and L. Mrzljak for helpful discussions.
Correspondence should be addressed to E. Chris Muly III, Department of Psychiatry, Yale University School of Medicine, P.O. Box 208001, C303 Sterling Hall of Medicine, 333 Cedar Street, New Haven, CT 06520-8001.
REFERENCES
- 1.Aceves J, Floran B, Martinez-Fong D, Benitez J, Sierra A, Flores G. Activation of D1 receptors stimulates accumulation of gamma-aminobutyric acid in slices of the pars reticulata of 6-hydroxydopamine-lesioned rats. Neurosci Lett. 1992;145:40–42. doi: 10.1016/0304-3940(92)90198-g. [DOI] [PubMed] [Google Scholar]
- 2.Aceves J, Floran B, Sierra A, Mariscal S. D-1 receptor mediated modulation of the release of gamma-aminobutyric acid by endogenous dopamine in the basal ganglia of the rat. Prog Neuropsychopharmacol Biol Psychiatry. 1995;19:727–739. doi: 10.1016/0278-5846(95)00127-h. [DOI] [PubMed] [Google Scholar]
- 3.Arai R, Geffard M, Calas A. Intensification of labelings of the immunogold silver staining method by gold toning. Brain Res Bull. 1992;28:343–345. doi: 10.1016/0361-9230(92)90200-h. [DOI] [PubMed] [Google Scholar]
- 4.Baxter LR, Schwartz JM, Phelps ME, Mazziotta JC, Guze BH, Selin CE, Gerner RH, Sumida RM. Reduction of prefrontal cortex glucose metabolism common to three types of depression. Arch Gen Psychiatry. 1989;46:243–249. doi: 10.1001/archpsyc.1989.01810030049007. [DOI] [PubMed] [Google Scholar]
- 5.Bergson C, Mrzljak L, Smiley JF, Pappy M, Levenson R, Goldman-Rakic PS. Regional, cellular, and subcellular variations in the distribution of D1 and D5 dopamine receptors in primate brain. J Neurosci. 1995;15:7821–7836. doi: 10.1523/JNEUROSCI.15-12-07821.1995. [DOI] [PMC free article] [PubMed] [Google Scholar]
- 6.Brozoski TJ, Brown RM, Rosvold HE, Goldman PS. Cognitive deficit caused by regional depletion of dopamine in prefrontal cortex of rhesus monkey. Science. 1979;205:929–932. doi: 10.1126/science.112679. [DOI] [PubMed] [Google Scholar]
- 7.Cameron DL, Williams JT. Dopamine D1 receptors facilitate transmitter release. Nature. 1993;366:344–347. doi: 10.1038/366344a0. [DOI] [PubMed] [Google Scholar]
- 8.Cepeda C, Radisavljevic Z, Peacock W, Levine MS, Buchwald NA. Differential modulation by dopamine of responses evoked by excitatory amino acids in human cortex. Synapse. 1992;11:330–341. doi: 10.1002/syn.890110408. [DOI] [PubMed] [Google Scholar]
- 9.Cepeda C, Buchwald NA, Levine MS. Neuromodulatory actions of dopamine in the neostriatum are dependent upon the excitatory amino acid receptor subtypes activated. Proc Natl Acad Sci USA. 1993;90:9576–9580. doi: 10.1073/pnas.90.20.9576. [DOI] [PMC free article] [PubMed] [Google Scholar]
- 10.Chergui K, Suad-Chagny MF, Gonon F. Nonlinear relationship between impulse flow, dopamine release and dopamine elimination in the rat brain in vivo. Neuroscience. 1994;62:641–645. doi: 10.1016/0306-4522(94)90465-0. [DOI] [PubMed] [Google Scholar]
- 11.Colonnier M. Synaptic patterns on different cell types in the different laminae of the cat visual cortex. An electron microscope study. Brain Res. 1968;9:268–287. doi: 10.1016/0006-8993(68)90234-5. [DOI] [PubMed] [Google Scholar]
- 12.Condé F, Lund JS, Jacobowitz DM, Baimbridge KG, Lewis DA. Local circuit neurons immunoreactive for calretinin, calbindin D-28k or parvalbumin in monkey prefrontal cortex: distribution and morphology. J Comp Neurol. 1994;341:95–116. doi: 10.1002/cne.903410109. [DOI] [PubMed] [Google Scholar]
- 13.DeFelipe J, Conti F, Van Eyck SL, Manzoni T. Demonstration of glutamate-positive axon terminals forming asymmetric synapses in cat neocortex. Brain Res. 1988;455:162–165. doi: 10.1016/0006-8993(88)90127-8. [DOI] [PubMed] [Google Scholar]
- 14.DeFelipe J, Hendry SHC, Jones EG. Visualization of chandelier cell axons by parvalbumin immunoreactivity in monkey cerebral cortex. Proc Natl Acad Sci USA. 1989;86:2093–2097. doi: 10.1073/pnas.86.6.2093. [DOI] [PMC free article] [PubMed] [Google Scholar]
- 15.Farde L, Haldin C, Stone-Elander S, Sedvall G. PET analysis of human dopamine receptor subtypes using 11C-SCH 23390 and 11C-raclopride. Psychopharmacology. 1987;92:278–284. doi: 10.1007/BF00210831. [DOI] [PubMed] [Google Scholar]
- 16.Gabbott PL, Bacon SJ. Local circuit neurons in the medial prefrontal cortex (areas 24a,b,c, 25 and 32) in the monkey: I. Cell morphology and morphometrics. J Comp Neurol. 1996;364:567–608. doi: 10.1002/(SICI)1096-9861(19960122)364:4<567::AID-CNE1>3.0.CO;2-1. [DOI] [PubMed] [Google Scholar]
- 17.Garris PA, Wightman RM. Different kinetics govern dopaminergic transmission in the amygdala, prefrontal cortex, and striatum: an in vivo voltammetric study. J Neurosci. 1994;14:442–450. doi: 10.1523/JNEUROSCI.14-01-00442.1994. [DOI] [PMC free article] [PubMed] [Google Scholar]
- 18.Gingrich JA, Caron MG. Recent advances in the molecular biology of dopamine receptors. Annu Rev Neurosci. 1993;16:299–321. doi: 10.1146/annurev.ne.16.030193.001503. [DOI] [PubMed] [Google Scholar]
- 19.Girault JA, Spampinato U, Glowinski J, Besson MJ. In vivo release of [3H]γ-aminobutyric acid in the rat neostriatum—II. Opposing effects of D1 and D2 dopamine receptor stimulation in the dorsal caudate putamen. Neuroscience. 1986;19:1109–1117. doi: 10.1016/0306-4522(86)90127-2. [DOI] [PubMed] [Google Scholar]
- 20.Goldman-Rakic PS. Handbook of physiology—the nervous system V, pp 373–417. American Physiological Society; Bethesda, MD: 1987. Circuitry of primate prefrontal cortex and regulation of behavior by representational memory. [Google Scholar]
- 21.Goldman-Rakic PS, Lidow MS, Gallager DW. Overlap of dopaminergic, adrenergic, and serotoninergic receptors and complementarity of their subtypes in primate prefrontal cortex. J Neurosci. 1990;10:2125–2138. doi: 10.1523/JNEUROSCI.10-07-02125.1990. [DOI] [PMC free article] [PubMed] [Google Scholar]
- 22.Gulyás AI, Hájos N, Freund TF. Interneurons containing calretinin are specialized to control other interneurons in the rat hippocampus. J Neurosci. 1996;16:3397–3411. doi: 10.1523/JNEUROSCI.16-10-03397.1996. [DOI] [PMC free article] [PubMed] [Google Scholar]
- 23.Hempel CM, Vincent P, Adams SR, Tsien RY, Selverston AI. Spatio-temporal dynamics of cyclic AMP signals in an intact neural circuit. Nature. 1996;384:166–169. doi: 10.1038/384166a0. [DOI] [PubMed] [Google Scholar]
- 24.Hendry SHC, Jones EG, Emson PC, Lawson DEM, Heizmann CW, Streit P. Two classes of cortical GABA neurons defined by differential calcium binding protein immunoreactivities. Exp Brain Res. 1989;76:467–472. doi: 10.1007/BF00247904. [DOI] [PubMed] [Google Scholar]
- 25.Hersch SM, Ciliax BJ, Gutekunst C-A, Rees HD, Heilman CJ, Yung KKL, Bolam JP, Ince E, Yi H, Levey AI. Electron microscopic analysis of D1 and D2 dopamine receptor proteins in the dorsal striatum and their synaptic relationships with motor corticostriatal afferents. J Neurosci. 1995;15:5222–5237. doi: 10.1523/JNEUROSCI.15-07-05222.1995. [DOI] [PMC free article] [PubMed] [Google Scholar]
- 26.Itoh K, Konishi A, Nomura S, Mizuno N, Nakamura Y, Sugimoto T. Application of coupled oxidation reaction to electron microscopic demonstration of horseradish peroxidase: cobalt-glucose oxidase method. Brain Res. 1979;175:341–346. doi: 10.1016/0006-8993(79)91013-8. [DOI] [PubMed] [Google Scholar]
- 27.Khan ZU, Mrzljak L, Gutierrez A, De La Calle A, Goldman-Rakic PS. Prominence of the dopamine D2 short isoform in dopaminergic pathways. Proc Natl Acad Sci USA. 1998;95:7731–7736. doi: 10.1073/pnas.95.13.7731. [DOI] [PMC free article] [PubMed] [Google Scholar]
- 28.Kisvarday ZF, Gulyás A, Beroukas D, North JB, Chubb IW, Somogyi P. Synapses, axonal and dendritic patterns of GABA-immunoreactive neurons in human cerebral cortex. Brain. 1990;113:793–812. doi: 10.1093/brain/113.3.793. [DOI] [PubMed] [Google Scholar]
- 29.Koch C, Zador A. The function of dedritic spines: devices subserving biochemical rather than electrical compartmentalization. J Neurosci. 1993;13:413–422. doi: 10.1523/JNEUROSCI.13-02-00413.1993. [DOI] [PMC free article] [PubMed] [Google Scholar]
- 30.Krimer LS, Jakab RL, Goldman-Rakic PS. Quantitative three-dimensional analysis of the catacholaminergic innervation of identified neurons in the macaque prefrontal cortex. J Neurosci. 1997;17:7450–7461. doi: 10.1523/JNEUROSCI.17-19-07450.1997. [DOI] [PMC free article] [PubMed] [Google Scholar]
- 31.Kubota Y, Hattori R, Yui Y. Three distinct subpopulations of GABAergic neurons in rat frontal agranular cortex. Brain Res. 1994;649:159–173. doi: 10.1016/0006-8993(94)91060-x. [DOI] [PubMed] [Google Scholar]
- 32.Levey AI, Hersch SM, Rye DB, Sunahara RK, Niznik HB, Kitt CA, Price DL, Maggio R, Brann MR, Ciliax BJ. Localization of D1 and D2 dopamine receptors in brain with subtype-specific antibodies. Proc Natl Acad Sci USA. 1993;90:8861–8865. doi: 10.1073/pnas.90.19.8861. [DOI] [PMC free article] [PubMed] [Google Scholar]
- 33.Lewis DA, Campbell MJ, Foote SL, Goldstein M, Morrison JH. The distribution of tyrosine hydrozylase-immunoreactive fibers in primate neocortex is widespread but regionally specific. J Neurosci. 1987;7:279–290. doi: 10.1523/JNEUROSCI.07-01-00279.1987. [DOI] [PMC free article] [PubMed] [Google Scholar]
- 34.Lewis DA, Hawrylak VA, Melchitzky DS, Sesack SR. Dopamine terminals in the monkey prefrontal cortex selectively innervate parvalbumin-containing local circuit neurons. Soc Neurosci Abstr. 1996;22:1321. [Google Scholar]
- 35.Lidow MS, Goldman-Rakic PS, Gallager DW, Rakic P. Distribution of dopaminergic receptors in the primate cerebral cortex: quantitative autoradiographic analysis using [3H]raclopride, [3H]spiperone and [3H]SCH23390. Neuroscience. 1991;40:657–671. doi: 10.1016/0306-4522(91)90003-7. [DOI] [PubMed] [Google Scholar]
- 36.Lidow MS, Elsworth JD, Goldman-Rakic PS. Down-regulation of the D1 and D5 dopamine receptors in the primate prefrontal cortex by chronic treatment with antipsychotic drugs. J Pharmacol Exp Ther. 1997;281:597–603. [PubMed] [Google Scholar]
- 37.Lund JS, Lewis DA. Local circuit neurons of developing and mature macaque prefrontal cortex: Golgi and immunocytochemical characteristics. J Comp Neurol. 1993;328:282–312. doi: 10.1002/cne.903280209. [DOI] [PubMed] [Google Scholar]
- 38.Maguire G, Werblin F. Dopamine enhances a glutamate-gated ionic current in OFF bipolar cells of the tiger salamander retina. J Neurosci. 1994;14:6094–6101. doi: 10.1523/JNEUROSCI.14-10-06094.1994. [DOI] [PMC free article] [PubMed] [Google Scholar]
- 39.Meador-Woodruff JH, Damask SP, Wang J, Haroutunian V, Davis KL, Watson SJ. Dopamine receptor mRNA expression in human striatum and neocortex. Neuropsychopharmacology. 1996;15:17–29. doi: 10.1016/0893-133X(95)00150-C. [DOI] [PubMed] [Google Scholar]
- 40.Meskenaite V. Calretinin-immunoreactive local circuit neurons in area 17 of the cynomolgus monkey, Macaca fascicularis. J Comp Neurol. 1997;379:113–132. [PubMed] [Google Scholar]
- 41.Momiyama T, Sim JA. Modulation of inhibitory transmission by dopamine in rat basal forebrain nuclei: activation of presynaptic D1-like dopaminergic receptors. J Neurosci. 1996;16:7505–7512. doi: 10.1523/JNEUROSCI.16-23-07505.1996. [DOI] [PMC free article] [PubMed] [Google Scholar]
- 42.Mrzljak L, Bergson C, Pappy M, Huff R, Levenson R, Goldman-Rakic PS. Localization of dopamine D4 receptors in GABAergic neurons of the primate brain. Nature. 1996;381:245–248. doi: 10.1038/381245a0. [DOI] [PubMed] [Google Scholar]
- 43.Murphy BL, Arnsten AFT, Goldman-Rakic PS, Roth RH. Increased dopamine turnover in the prefrontal cortex impairs spatial working memory performance in rats and monkeys. Proc Natl Acad Sci USA. 1996;93:1325–1329. doi: 10.1073/pnas.93.3.1325. [DOI] [PMC free article] [PubMed] [Google Scholar]
- 44.Müller U, von Cramon DY, Pollman S. D1- versus D2-receptor modulation of visuospatial working memory in humans. J Neurosci. 1998;18:2720–2728. doi: 10.1523/JNEUROSCI.18-07-02720.1998. [DOI] [PMC free article] [PubMed] [Google Scholar]
- 45.Müller W, Connor JA. Dendritic spines as individual neuronal compartments for synaptic Ca2+ responses. Nature. 1991;354:73–76. doi: 10.1038/354073a0. [DOI] [PubMed] [Google Scholar]
- 46.Penit-Soria J, Audinat E, Crepel F. Excitation of rat prefrontal cortical neurons by dopamine: an in vitro electrophysiological study. Brain Res. 1987;425:263–274. doi: 10.1016/0006-8993(87)90509-9. [DOI] [PubMed] [Google Scholar]
- 47.Rogers JH. Two calcium-binding proteins mark many chick sensory neurons. Neuroscience. 1989;31:697–709. doi: 10.1016/0306-4522(89)90434-x. [DOI] [PubMed] [Google Scholar]
- 48.Rogers JH. Immunohistochemical markers in rat cortex: co-localization of calretinin and calbindin-D28k with neuropeptides and GABA. Brain Res. 1992;587:147–157. doi: 10.1016/0006-8993(92)91439-l. [DOI] [PubMed] [Google Scholar]
- 49.Sawaguchi T, Goldman-Rakic PS. D1 dopamine receptors in prefrontal cortex: involvement in working memory. Science. 1991;251:947–950. doi: 10.1126/science.1825731. [DOI] [PubMed] [Google Scholar]
- 50.Sawaguchi T, Goldman-Rakic PS. The role of D1-dopamine receptor in working memory: local injections of dopamine antagonists into the prefrontal cortex of rhesus monkeys performing an oculomotor delayed-response task. J Neurophysiol. 1994;71:515–528. doi: 10.1152/jn.1994.71.2.515. [DOI] [PubMed] [Google Scholar]
- 51.Sesack SR, Bressler CN, Lewis DA. Ultrastructural associations between dopamine terminals and local circuit neurons in the monkey prefrontal cortex: a study of calretinin-immunoreactive cells. Neurosci Lett. 1995;200:9–12. doi: 10.1016/0304-3940(95)12076-g. [DOI] [PubMed] [Google Scholar]
- 52.Simon H, Scatton B, LeMoal M. Dopaminergic A10 neurones are involved in cognitive functions. Nature. 1980;286:150–151. doi: 10.1038/286150a0. [DOI] [PubMed] [Google Scholar]
- 53.Smiley JF, Goldman-Rakic PS. Heterogeneous targets of dopamine synapses in monkey prefrontal cortex demonstrated by serial section electron microscopy: a laminar analysis using the silver-enhanced diaminobenzidine sulfide (SEDS) immunolabeling technique. Cereb Cortex. 1993;3:223–238. doi: 10.1093/cercor/3.3.223. [DOI] [PubMed] [Google Scholar]
- 54.Smiley JF, Levey AI, Ciliax BJ, Goldman-Rakic PS. D1 dopamine receptor immunoreactivity in human and monkey cerebral cortex: predominant and extrasynaptic localization in dendritic spines. Proc Natl Acad Sci USA. 1994;91:5720–5724. doi: 10.1073/pnas.91.12.5720. [DOI] [PMC free article] [PubMed] [Google Scholar]
- 55.Smith DO, Lowe D, Temkin R, Jensen P, Hatt H. Dopamine enhances glutamate-activated currents in spinal motoneurons. J Neurosci. 1995;15:3905–3912. doi: 10.1523/JNEUROSCI.15-05-03905.1995. [DOI] [PMC free article] [PubMed] [Google Scholar]
- 56.Steulet A-F, Bernasconi R, Leonhardt T, Martin P, Grunenwald C, Bischoff S, Heinrich M, Bandelier V, Maitre L. Effects of selective dopamine D1 and D2 receptor agonists on the rate of GABA synthesis in mouse brain. Eur J Pharmacol. 1990;191:19–27. doi: 10.1016/0014-2999(90)94092-c. [DOI] [PubMed] [Google Scholar]
- 57.Surmeier DJ, Song WJ, Yan Z. Coordinated expression of dopamine receptors in neostriatal medium spiny neurons. J Neurosci. 1996;16:6579–6591. doi: 10.1523/JNEUROSCI.16-20-06579.1996. [DOI] [PMC free article] [PubMed] [Google Scholar]
- 58.Van Brederode JFM, Mulligan KA, Hendrickson AE. Calcium-binding proteins as markers for subpopulations of GABAergic neurons in monkey striate cortex. J Comp Neurol. 1990;298:1–22. doi: 10.1002/cne.902980102. [DOI] [PubMed] [Google Scholar]
- 59.Van Eden CG, Hoorneman EMD, Buijs RM, Matthijssen MAH, Geffard M, Uylings HBM. Immunocytochemical localization of dopamine in the prefrontal cortex of the rat at the light and electron microscopic level. Neuroscience. 1987;22:849–862. doi: 10.1016/0306-4522(87)92964-2. [DOI] [PubMed] [Google Scholar]
- 60.Vincent SL, Khan Y, Benes FM. Cellular distribution of dopamine D1 and D2 receptors in rat medial prefrontal cortex. J Neurosci. 1993;13:2551–2564. doi: 10.1523/JNEUROSCI.13-06-02551.1993. [DOI] [PMC free article] [PubMed] [Google Scholar]
- 61.Walker AE. A cytoarchitectural study of the prefrontal area of the macaque monkey. J Comp Neurol. 1940;73:59–86. [Google Scholar]
- 62.Weinberger DR, Berman KF, Zec RF. Physiological dysfunction of dorsolateral prefrontal cortex in schizophrenia I. Regional cerebral blood flow evidence. Arch Gen Psychiatry. 1986;43:114–124. doi: 10.1001/archpsyc.1986.01800020020004. [DOI] [PubMed] [Google Scholar]
- 63.Weinberger DR, Berman KF, Illowsky BP. Physiological dysfunction of dorsolateral prefrontal cortex in schizophrenia. Arch Gen Psychiatry. 1988;45:609–615. doi: 10.1001/archpsyc.1988.01800310013001. [DOI] [PubMed] [Google Scholar]
- 64.Williams GV, Goldman-Rakic PS. Modulation of memory fields by dopamine D1 receptors in prefrontal cortex. Nature. 1995;17:572–575. doi: 10.1038/376572a0. [DOI] [PubMed] [Google Scholar]
- 65.Williams GV, Millar J. Concentration-dependent actions of stimulated dopamine release on neuronal activity in rat striatum. Neuroscience. 1990;39:1–16. doi: 10.1016/0306-4522(90)90217-r. [DOI] [PubMed] [Google Scholar]
- 66.Williams SM, Goldman-Rakic PS. Characterization of the dopaminergic innervation of the primate frontal cortex using a dopamine-specific antibody. Cereb Cortex. 1993;3:199–222. doi: 10.1093/cercor/3.3.199. [DOI] [PubMed] [Google Scholar]
- 67.Yang CR, Seamans JK. Dopamine D1 receptor actions in layers V-VI rat prefrontal cortex neurons in vitro: modulation of dendritic-somatic signal integration. J Neurosci. 1996;16:1922–1935. doi: 10.1523/JNEUROSCI.16-05-01922.1996. [DOI] [PMC free article] [PubMed] [Google Scholar]
- 68.Yang CR, Seamans JK, Gorelova N. Mechanisms of dopamine (DA) modulation of GABAergic inputs to rat layer V-VI pyramidal prefrontal cortical (PFC) neurons in vitro. Soc Neurosci Abstr. 1997;23:1771. [Google Scholar]
- 69.Yung KKL, Bolam JP, Smith AD, Hersch SM, Ciliax BJ, Levey AI. Immunocytochemical localization of D1 and D2 dopamine receptors in the basal ganglia of the rat: light and electron microscopy. Neuroscience. 1995;65:709–730. doi: 10.1016/0306-4522(94)00536-e. [DOI] [PubMed] [Google Scholar]
- 70.Zahrt J, Taylor JR, Mathew RG, Arnsten AFT. Supranormal stimulation of D1 dopamine receptors in the rodent prefrontal cortex impairs spatial working memory performance. J Neurosci. 1997;17:8528–8535. doi: 10.1523/JNEUROSCI.17-21-08528.1997. [DOI] [PMC free article] [PubMed] [Google Scholar]
- 71.Zheng P, Bunney BS, Shi W-X. Opposite effects of dopamine D1 and D2-like receptor activation on glutamate NMDA receptor-mediated responses in the prefrontal cortex. Soc Neurosci Abstr. 1996;22:1772. [Google Scholar]


