

Abstract
A tetrodotoxin-resistant voltage-gated Na+current (TTX-R INa) appears to be the current primarily responsible for action potential generation in the cell body and terminals of nociceptive afferents. Although other voltage-gated Na+ currents are modulated by the activation of protein kinase C (PKC), protein kinase A (PKA), or both, the second messenger pathways involved in the modulation of TTX-RINa are still being defined. We have examined the modulation of TTX-R INa in isolated sensory neurons with whole-cell voltage-clamp recording. Activation of either PKC or PKA increased TTX-RINa. PKA activation also produced a leftward shift in the conductance–voltage relationship of TTX-RINa and an increase in the rates of current activation, deactivation, and inactivation. Inhibitors of PKC decreased TTX-R INa, whereas inhibitors of PKA had no effect on the current. Investigating the interaction between PKC and PKA revealed that although inhibitors of PKA had little effect on PKC-induced modulation of TTX-R INa, inhibitors of PKC significantly attenuated PKA-induced modulation of the current. Finally, although PGE2-induced modulation of TTX-R INa was more similar to PKA-induced modulation of the current than to PKC-induced modulation, PGE2-induced effects were inhibited by inhibitors of both PKC and PKA. Thus, although TTX-R INa is a common target for cellular processes involving the activation of either PKA or PKC, PKC activity is necessary to enable subsequent PKA-mediated modulation of TTX-R INa.
Keywords: dorsal root ganglion, inflammatory mediator, nociception, pain, primary afferent, second-messenger
Studies of voltage-gated sodium currents (VGSCs) indicate that VGSC isoforms may be differentially modulated by protein kinase C (PKC) and protein kinase A (PKA). For example, a VGSC from brain tissue is decreased by the concurrent activation of PKC and PKA (Gershon et al., 1992; Li et al., 1992;Cantrell et al., 1996, 1997), and a VGSC from cardiac muscle is decreased by PKC activation (Qu et al., 1994) and increased by PKA activation (Frohnwieser et al., 1995, 1997). That these changes in VGSCs are physiologically relevant is suggested by the observations that receptor-mediated changes in cellular excitability reflect, at least in part, PKC- and/or PKA-mediated changes in VGSCs.
We and others have recently demonstrated that a tetrodotoxin-resistant voltage-gated Na+ current (TTX-RINa), expressed primarily in nociceptive afferents, is modulated by hyperalgesic inflammatory mediators in a manner that is likely to enhance nociceptor excitability (England et al., 1996; Gold et al., 1996b; Cardenas et al., 1997). Although there is evidence both for (England et al., 1996) and against (Cardenas et al., 1997) a role for protein kinase A in the modulation of TTX-RINa, the contribution of PKC has yet to be investigated.
Using agents that activate or inhibit PKC and PKA, we have tested the hypothesis that these kinases are involved in the modulation of TTX-RINa present in sensory neurons from the adult rat. Furthermore, we have determined the contribution of PKC and PKA activity to prostaglandin E2(PGE2)-induced modulation of the current. Our results indicate that TTX-R INa is modulated by both PKA and PKC activity and that PKC activity is necessary to enable the expression of PKA-mediated effects. Furthermore, PKC and PKA modulate biophysical properties of TTX-R INadifferently. Finally, PGE2-induced modulation of TTX-RINa appears to require activity in both kinases.
MATERIALS AND METHODS
Cell culture. Primary cultures of dissociated adult rat DRG neurons were prepared as described previously (Gold et al., 1996a). Male Sprague Dawley rats (150–250 gm; Bantin and Kingman, Fremont, CA) were deeply anesthetized with an intraperitoneal injection of sodium pentobarbital (60 mg/kg). Lumbar (L1–L6) dorsal root ganglia (DRGs) were removed, and rats were subsequently killed by an overdose of sodium pentobarbital. DRGs were desheathed in ice-cold MEM–fetal bovine serum (FBS) composed of 90% MEM (Life Technologies, Gaithersburg, MD), 10% heat-inactivated FBS, and 1000 U/ml each of penicillin and streptomycin. DRGs were then incubated for 120 min at 37°C in 5 ml MEM–FBS, to which collagenase P (Boehringer Mannheim, Indianapolis, IN) had been added to a final concentration of 0.125%. DRGs were then incubated for 10 min at 37°C in Ca2+- and Mg2+-free HBSS (Life Technologies) containing 0.25% trypsin (Worthington, Bristol, UK) and 0.025% EDTA (Sigma, St. Louis, MO). Trypsin activity was inhibited by the addition of MEM–FBS containing 0.125% MgSO4, and DRGs were dissociated by trituration with a fire-polished Pasteur pipette. DRG cells were plated onto glass coverslips, previously coated by a solution of 5 μg/ml mouse laminin (Life Technologies) and 0.1 mg/ml (∼9 μm) poly-l-ornithine (Sigma). The cells were incubated in MEM–FBS at 37°C, 3% CO2, and 90% humidity. DRG neurons were studied between 6 and 24 hr after plating.
Electrophysiology. Voltage-clamp recordings were performed using an Axopatch 200A amplifier (Axon Instruments, Foster City, CA). Data were low-pass-filtered at 5–10 kHz with a four-pole Bessel filter and digitally sampled at 25–100 kHz. Capacity transients were cancelled and series resistance was compensated (>80%); a P/4 protocol was used for leak subtraction. Electrodes (0.7–3 MΩ) were filled with (in mm): 100 CsCl, 40 tetraethylammonium-Cl, 10 NaCl, 1 CaCl2, 2 MgCl2, 11 EGTA, 10 HEPES, 2 Mg-ATP, 1 Li-GTP; pH was adjusted to 7.2 with Tris-base, and osmolality was adjusted to 310 mOsm. Free Ca2+concentration was estimated to be 33 nm with software (Chelator, T. M. J. Schoemakers, University of Nijmegen, The Netherlands) that takes into account chelator–metal stability constants, temperature, pH, and ionic strength. The bath solution used to record whole-cell Na+ currents in isolation contained (in mm): 35 NaCl, 30 tetraethylammonium-Cl, 65 choline-Cl, 0.1 CaCl2, 5 MgCl2, 10 HEPES, 10 glucose, pH adjusted to 7.4, osmolality adjusted to 325 mOsm. TTX-R INa was isolated from TTX-sensitive Na+ currents by adding TTX (50 nm) to the bath solution. All salts were obtained from Sigma. Because TTX-RINa is preferentially expressed in small-diameter DRG neurons (Gold et al., 1996b), all experiments were performed on neurons <35 μm in diameter.
Experimental protocol. To facilitate comparison of data collected under different experimental conditions, a standard protocol was used for data collection. After formation of a tight seal (>5 GΩ) and compensation of pipette capacitance with amplifier circuitry, whole-cell access was established. Five hyperpolarizing pulses (10 msec, 20 mV) were recorded for use in the determination of the cell capacitance. Whole-cell capacitance and series resistance were compensated with the amplifier circuitry. We then began to collect data on TTX-R INa properties so that changes in response to test agents applied through the patch pipette could be determined. To assess changes in the current–voltage (I–V) and conductance–voltage (G–V) relationships data were collected for an I–V curve every 2 min. Current was evoked from a holding potential of −70 mV to potentials between −50 and +50 mV in 5 mV increments. G–V curves were constructed from I–V curves by dividing the evoked current by the driving force on the current, such thatG = I/(Vm −Vrev), where Vm is the potential at which current was evoked andVrev is the reversal potential for the current determined by extrapolating the linear portion of theI–V curve through 0 current. In experiments in which test agents were bath-applied, at least three completeI–V curves were collected before the application of a test agent. These I–V curves were used to establish the baseline response from which test agent-induced changes were compared. To assess changes in the steady-state inactivation of TTX-R INa, H-infinity curves were collected every 5 min; a 500 msec prepulse was varied between −80 and 0 mV at 5 mV increments followed by a 15 msec test pulse to +10 mV. Finally, TTX-R INa was evoked from a holding potential of −70 mV with a 15 msec test pulse to −10 mV (the average potential for half activation of the current), every 10 sec, betweenI–V and H-infinity runs.
Data analysis. Activation and steady-state inactivation were fitted with a Boltzmann equation of the form: G =Gmax/1 + exp[(V0.5 −Vm)/k], whereG = observed conductance, Gmax = the calculated maximal conductance, V0.5 = the potential for half activation or inactivation,Vm = command potential, and k = the slope factor. Once Gmax was calculated, data were normalized with respect to Gmax. Inactivation time constants were estimated from exponential fits to the falling phase of the current traces. Dose–response data were fitted with a Michaelis-Menten equation: percent change in TTX-RINa = ([test agent]n(Emax)/([test agent]n + EC50n), where [test agent] = the concentration of test agent used, n = the exponential term, Emax = the maximal change in TTX-RINa, and EC50 = the concentration of test agent that produces a change in TTX-RINa that is 50% of the maximum. Data were fit using a nonlinear least-square method (Sigma Plot, SPSS, Chicago, IL).
Test agents. PGE2 (Sigma) was used in this study because it is a well characterized direct-acting hyperalgesic inflammatory mediator. PGE2 is released in peripheral tissue and the spinal cord after injury, and it sensitizes nociceptors while causing little direct activation [depolarization and generation of action potentials (Birrell et al., 1991)]. Furthermore, inhibition of prostaglandin biosynthesis appears to be the mechanism underlying the antinociceptive effects of the widely used aspirin-like nonsteroidal anti-inflammatory analgesics (Vane, 1971; Ferreira, 1972).
Other test agents used in this study included the PKA inhibitors WIPTIDE and Rp-cAMPs; the PKC inhibitors staurosporine and PKC19–36; the PKA activators forskolin and 7β-deacetyl-7β-[γ-(morpholino) butyryl]-forskolin (7,7-forskolin); the inactive isomer of forskolin, 1,9-dideoxy-forskolin (dd-forskolin); the membrane-permeable analogs of cAMP 8-bromo-cAMP, and dibutyryl-cAMP; the PKC activators phorbol,12,13-dibutyrate (PDBu) and phorbol,12-myristate,13-acetate (PMA); and the inactive phorbol ester analogs 4-α-phorbol 12,13-didecanoate (4-α-PDD) and 4-α-phorbol 12-myristate 13-acetate (4-α-PMA). WIPTIDE was obtained from Peninsula Labs (Belmont, CA), staurosporine was obtained from Sigma, and all other test agents were obtained from RBI (Natick, MA). PGE2 was dissolved in 100% ethanol as a 10 mm stock solution that was diluted in bath solution as needed. Membrane-permeable analogs of cAMP, Rp-cAMPs, WIPTIDE, and 7,7-forskolin were dissolved in distilled water to form stock solutions (100–1000 times more concentrated than the final concentration used). All other compounds were dissolved in DMSO to form stock solutions (1000 times more concentrated than the final concentration used). Stocks were stored at −20°C and diluted in bath or electrode solutions immediately before use.
Three methods were used for the application of test agents: (1) preincubation—test agent was added to bath solution, and coverslips with neurons were stored in this solution at room temperature for 30–60 min before recording; (2) bath application—test agents were applied through the bath perfusion system; or (3) intracellular application—test agents were dissolved in the electrode solution and allowed to passively diffuse into the cell. Preliminary experiments indicated that the bath solution in the recording chamber was exchanged completely within 20 sec. Application of test agents via the patch pipette was slower than bath application; however, preliminary experiments (see Fig. 1) indicated that the effects of even relatively large molecules could be detected within tens of seconds.
Fig. 1.

PKC inhibitors decrease TTX-RINa. A, Including PKC19–36 (▪, 10 μm; n= 9) in the electrode solution results in a time-dependent decrease in TTX-R INa, whereas WIPTIDE (•, 10 μm; n = 10) had little effect on the current. Peak current evoked at 0 mV from a holding potential of −70 mV every 10 sec is plotted as a percentage change from the average current evoked over the first 30 sec of recording. B, Normalized conductance–voltage curves obtained 30 sec (•) and 10 min (▪) after establishing whole-cell access to a DRG neuron. The electrode solution contained 10 μm PKC19–36. Conductance was calculated as described in Materials and Methods. Data are fit with a single Boltzmann function. Values forV0.5 and slope factor were −8.3 and 4.3 mV at 30 sec, and −8.6 and 4.2 mV at 10 min. In this and subsequent figures, the dashed line represents a scaledG–V curve; the small curve is scaled to the size of the larger curve. Inset, Current evoked at 0 mV from a holding potential of −70 mV 50 sec (trace 1) and 11 min (trace 2) after establishing whole-cell access. Trace 3 was obtained by scaling trace 2 relative to the magnitude of the peak of the inward current in trace 1. The similarity in rates of activation, inactivation, and deactivation between trace 1 andtrace 2 are readily apparent. In this and subsequent figures, pooled data are plotted as mean ± SEM.
Statistics. Data are expressed as mean ± SEM. Preliminary experiments indicated that the most sensitive biophysical property with which to assess changes in TTX-RINa is the magnitude of conductance:G at V0.5. The effects of test agents were analyzed as a percentage change in G at baselineV0.5 (GV0.5 Base). Neurons were considered responsive to a test agent if the agent induced a change in GV0.5 Base >2 SDs from the mean time-dependent change in the current. For example, if the SD forGV0.5 Base was 3%, then this neuron would be considered responsive to a test agent if the test agent induced a change >6% in GV0.5 Base. Student’st test and one-way ANOVA with Tukey’s post hoctests were used to assess for the presence of statistically significant differences in mean percentage change in GV0.5 Base. The Fisher’s exact test was used to assess the presence of statistically significant differences in the proportion of neurons responsive to test agents under different experimental conditions.
RESULTS
PKC-induced modulation of TTX-R INa
To determine whether PKC activity influences the biophysical properties of TTX-R INa, we assessed the effects of PKC inhibitors and activators on TTX-RINa. The PKC inhibitors used were PKC19–36 (10 μm) and staurosporine (1 μm). Including PKC19–36 in the electrode solution or staurosporine in the bath solution resulted in a time-dependent decrease in magnitude of TTX-RINa. This decrease developed more rapidly in the presence of PKC19–36 (Fig.1A) than in the presence of staurosporine (data not shown). However, preincubating DRG neurons with staurosporine for 30–60 min before recording resulted in a larger reduction in current than that observed in the presence of PKC19–36. More than a 50% reduction in current density was observed in neurons preincubated with staurosporine (39.3 ± 6.9 pA/pF; n = 10) compared with control (85.8 ± 12.8 pA/pF; n = 15) neurons studied in parallel (p < 0.05). The PKC inhibitor-induced decrease in TTX-R INa was associated with neither a shift in G–V curve (Fig.1B; Table 1) nor a change in current kinetics (Fig. 1B,inset; Table 2).
Table 1.
Effects of kinase inhibitors on TTX-RINa voltage dependence of activation
| Test agent | n | Gmax % change | V0.5 | K | ||||
|---|---|---|---|---|---|---|---|---|
| 1 min (mV) | 10 min (mV) | Change | 1 min (mV) | 10 min (mV) | % Change | |||
| Control | 10 | −1.5 ± 3.4 | −9.2 ± 0.8 | −9.4 ± 0.8 | −0.3 ± 0.8 | 5.3 ± 0.2 | 5.6 ± 0.4 | 6.2 ± 4.7 |
| PKC19–36 (10 μm) | 6 | −22.4 ± 3.6* | −7.5 ± 0.5 | −8.7 ± 0.4 | −1.2 ± 0.3 | 4.6 ± 0.2 | 4.4 ± 0.2 | −1.6 ± 8.9 |
| Staurosporine (1 μm) | 7 | −17.3 ± 5.4* | −7.9 ± 0.5 | −11.3 ± 0.4 | −3.4 ± 0.6 | 5.0 ± 0.2 | 5.2 ± 0.1 | 4.2 ± 3.5 |
| WIPTIDE (10 μm) | 8 | −7.1 ± 2.0 | −6.4 ± 0.7 | −8.8 ± 1.0 | −2.3 ± 0.8 | 5.2 ± 0.4 | 5.0 ± 0.4 | 2.5 ± 13.1 |
| Rp-cAMPs (1 mm) | 9 | −5.6 ± 2.6 | −3.1 ± 0.6 | −4.5 ± 0.7 | −1.4 ± 0.4 | 5.7 ± 0.2 | 5.3 ± 0.2 | −5.0 ± 3.4 |
In this and Tables 3 and 5, values forGmax, V0.5, andK were obtained by fitting TTX-R INaconductance–voltage relationship with a Boltzmann equation as described in Materials and Methods. Control neurons were exposed to staurosporine vehicle (0.01% DMSO) for 10 min. PKC19–36, WIPTIDE, and Rp-cAMPs were included in the electrode solution; staurosporine was bath-applied.
*Significant differences between control and experimental groups (p < 0.05).
Table 2.
Effects of kinase inhibitors on the kinetics of TTX-RINa
| Test agent | n | T0.5activation (0 mV) | Tau inactivation (0 mV) | Tau deactivation2-a % change | ||||
|---|---|---|---|---|---|---|---|---|
| 1 min (msec) | 10 min (msec) | % Change | 1 min (mV) | 10 min (mV) | % Change | |||
| Control | 10 | 0.98 ± 0.04 | 0.99 ± 0.05 | 0.5 ± 3.0 | 4.7 ± 0.2 | 5.0 ± 0.3 | 6.7 ± 3.5 | −6.9 ± 2.5 |
| PKC19–36 (10 μm) | 6 | 1.08 ± 0.01 | 1.09 ± 0.05 | 1.1 ± 5.8 | 6.0 ± 0.4 | 6.0 ± 0.5 | −0.4 ± 3.4 | 3.2 ± 4.1 |
| Staurosporine (1 μm) | 7 | 0.94 ± 0.06 | 0.97 ± 0.04 | 4.2 ± 3.2 | 5.0 ± 0.5 | 5.5 ± 0.5 | 10.4 ± 2.0 | −12.5 ± 2.1 |
| WIPTIDE (10 μm) | 8 | 0.90 ± 0.07 | 0.84 ± 0.06 | −6.6 ± 1.4 | 5.1 ± 0.6 | 4.8 ± 0.4 | −1.4 ± 2.2 | 0.0 ± 4.6 |
| Rp-cAMPs (1 mm) | 9 | 1.00 ± 0.05 | 0.98 ± 0.04 | −1.0 ± 4.1 | 5.0 ± 0.3 | 4.8 ± 0.2 | −2.5 ± 3.7 | 1.0 ± 4.4 |
In this and Table 4, T0.5 activation is the time from the beginning of the activating voltage step to the point at which TTX-T INa had obtained half of its peak amplitude. Tau inactivation and tau deactivation are time constants obtained from fitting, respectively, the inactivating and deactivating phase of TTX-R INa with a single exponential function.
Data are pooled for neurons in which the deactivating voltage step was to either −50 or −70 mV, from an activating voltage step to −10 mV.
To investigate the modulation of TTX-R INa by PKC, we determined the effects of the PKC activators PMA and PDBu on the current. PMA dose-dependently increased TTX-RINa magnitude (Fig.2A). Pooled data were well fit by a Michaelis-Menten equation, resulting in values forEmax, EC50, andn (the Hill coefficient) equal to 30%, 6.8 nm, and 2, respectively. The onset of the PMA-induced increase in TTX-RINa was rapid (<15 sec), and a steady-state change in current was established within 2 min (data not shown). Although PMA increased the Gmax of TTX-RINa (by 30% at 100 nm), the increase in current was associated with little change in eitherG–V curve (Fig. 2B; Table3) or kinetics (Fig.2B, inset; Table4) of the current, even at saturating concentrations (100 nm).
Fig. 2.

Activation of PKC results in an increase in TTX-RINa. A, The effects of PMA (•) and PDBu (▪) are dose dependent. Data obtained with PMA are from seven DRG neurons collected as a cumulative dose–response; the peak current at 0 mV evoked immediately preceding the application of the next higher concentration of PMA is normalized with respect to the current evoked in the absence of PMA and plotted against PMA concentration. Pooled data for PMA are well fitted by the Michaelis-Menten equation, resulting in values forEmax, EC50, andn equal to 30%, 6.8 nm, and 2, respectively. Data obtained with PDBu were not collected as a cumulative dose–response, but rather are the response of groups of four to eight neurons to the different concentrations of PDBu; data were normalized as described for PMA. B, Conductance–voltage curves are plotted for data collected before (•) and 3 min after (▪) PMA (30 nm; n = 8); data are normalized to baseline Gmax. Values for V0.5 and slope factor were −8.3 mV and 6.0 mV before PMA and −8.2 mV and 6.4 mV after PMA. Similar data were obtained with PDBu (data not shown).Inset, TTX-R INa evoked at 0 mV immediately before (trace 1) and 120 sec after (trace 2) the application of PMA (30 nm). When trace 1 is scaled to the size of trace 2 to yield trace 3, the absence of a PMA-induced change in kinetics is apparent. C, PKC activation results in a rapid increase in TTX-R INa. Peak TTX-R INa evoked at 0 mV every 10 sec is plotted versus time. Within 15 sec of PDBu (500 nm) application, TTX-R INa is increased; the maximal effect was obtained within 2 min. The break in the sampling reflects the time that data were collected forG–V curves. PGE2 had no additional effect on the current magnitude. Inset, TTX-RINa evoked at 0 mV immediately before (trace 1) and 120 sec after (trace 2) the application of PDBu (500 nm). When trace 1is scaled to the size of trace 2 to yield trace 3, PDBu-induced changes in kinetics are apparent.
Table 3.
Effects of PKC and PKC activation and PGE2 on TTX-R INa voltage dependence of activation
| Test agent | n | Gmax % change | V0.5 | K | ||||
|---|---|---|---|---|---|---|---|---|
| Before (mV) | After (mV) | Change | Before (mV) | After (mV) | % Change | |||
| Control | 11 | −2.3 ± 2.0 | −7.1 ± 1.3 | −7.5 ± 1.4 | −0.4 ± 0.4 | 4.5 ± 0.2 | 4.4 ± 0.3 | −3.9 ± 2.6 |
| PMA (30 nm) | 8 | 24.9 ± 4.3* | −7.8 ± 1.3 | −8.0 ± 1.7 | −0.2 ± 0.6 | 4.3 ± 0.2 | 4.2 ± 0.2 | −3.7 ± 1.3 |
| PDBu (500 nm) | 8 | 12.1 ± 1.8 | −6.4 ± 1.2 | −8.5 ± 1.2 | −2.1 ± 0.3 | 4.3 ± 0.2 | 4.6 ± 0.2 | 5.5 ± 1.5 |
| Forskolin (10 μm) | 10 | 35.9 ± 6.5* | −8.1 ± 0.9 | −12.3 ± 0.7 | −4.2 ± 0.8* | 4.7 ± 0.2 | 5.0 ± 0.2 | 6.8 ± 2.8 |
| PGE2 (10 μm) | 19 | 19.1 ± 2.4* | −7.3 ± 0.7 | −9.7 ± 0.7 | −2.3 ± 0.3* | 4.7 ± 0.2 | 4.8 ± 0.2 | 3.5 ± 2.2 |
In this and Table 4, control neurons were exposed to PGE2 vehicle (0.1% ethanol).
*Significant differences between control and experimental groups (p < 0.05).
Table 4.
Effects of PKC and PKA activation and PGE2 on the kinetics of TTX-R INa
| Test agent | n | T0.5activation (0 mV) | Tau inactivation (0 mV) | Tau deactivation4-a % change | ||||
|---|---|---|---|---|---|---|---|---|
| Before (msec) | After (msec) | % Change | Before (mV) | After (mV) | % Change | |||
| Control | 11 | 0.93 ± 0.06 | 0.93 ± 0.06 | −0.1 ± 0.5 | 4.9 ± 0.5 | 4.7 ± 0.5 | −2.1 ± 1.6 | −3.6 ± 2.0 |
| PMA (30 nm) | 8 | 0.94 ± 0.05 | 0.91 ± 0.06 | −2.7 ± 6.5 | 5.1 ± 0.3 | 5.3 ± 0.6 | 4.7 ± 11.0 | −6.2 ± 3.6 |
| PDBu (500 nm) | 8 | 0.85 ± 0.06 | 0.74 ± 0.05 | −13.4 ± 1.9* | 4.4 ± 0.4 | 4.0 ± 0.4 | −8.6 ± 4.2 | −1.5 ± 5.0 |
| Forskolin (10 μm) | 10 | 0.86 ± 0.04 | 0.70 ± 0.04 | −19.8 ± 2.0* | 4.8 ± 0.3 | 3.6 ± 0.3 | −23.6 ± 3.0* | −31.5 ± 2.9* |
| PGE2(10 μm) | 19 | 0.90 ± 0.03 | 0.78 ± 0.03 | −13.1 ± 1.1* | 4.8 ± 0.3 | 4.0 ± 0.2 | −15.0 ± 1.3 | −20.4 ± 2.6* |
*Significant differences between control and experimental groups (p < 0.05).
Data are pooled for neurons in which the deactivating voltage step was to either −50 or −70 mV, from an activating voltage step to −10 mV.
That PMA-induced modulation of TTX-R INareflects activation of PKC was supported by the observations that the PMA-induced increase in GV0.5 Base was significantly inhibited by PKC19–36 and that the inactive isomer of PMA (4-α-PMA, 30 nm) had little effect on TTX-RINa. The PMA-induced increase inGV0.5 Base was 26.4 ± 4.8% (n = 8) in the absence of PKC19–36compared with 9.4 ± 1.8% (n = 4) in its presence (p < 0.05). The 4-α-PMA-induced change inGV0.5 Base was 6.0 ± 2.0% (n = 3).
PDBu also dose-dependently increased TTX-R INa. However, the PDBu-induced increase in TTX-R INawas not saturated by 500 nm, the highest concentration tested (Fig. 2A). Similar to the effects of PMA, PDBu-induced increase in TTX-R INa developed rapidly and reached a peak change within 2 min (Fig. 2C). Also similar to the effects of PMA, the PDBu-induced increase in TTX-RINa reflected an increase inGmax that was associated with little shift inG–V (data not shown). However, in contrast to the effects of PMA, PDBu-induced changes in TTX-RINa were associated with an increase in the rates of activation and inactivation of the current (Fig.2C, inset; Table 4).
The effects of PDBu were blocked by PKC inhibitors PKC19–36 and staurosporine, and the inactive isomer of PDBu, 4-α-PDD, had little effect. The PDBu-induced increase inGV0.5 Base was 34.7 ± 3.9% (n = 8) in the absence of inhibitors compared with 2.4 ± 3.6% (n = 5) in the presence of PKC19–36 and −2.6 ± 4.3% (n = 4) in the presence of staurosporine (p < 0.05). The 4-α-PDD-induced change in GV0.5 Base was −3.5 ± 5.8% (n = 5). These observations support the suggestion that the actions of PDBu were the result of PKC activation. That PDBu induced a change in TTX-RINa rates of activation and inactivation unlike the PMA-induced modulation of the current may reflect differences in the isoenzymes activated by these two compounds.
PKA-induced modulation of TTX-R INa
To determine whether PKA activity influences the biophysical properties of TTX-R INa, we assessed the effects of PKA inhibitors and activators on TTX-RINa. The PKA inhibitors used were WIPTIDE (10 μm) and Rp-cAMPs. We tested the effects of applying Rp-cAMPs via the bath solution at concentrations up to 500 μm as well as via the patch pipette (1 mm in the recording pipette) (Braha et al., 1993; Kozlowski et al., 1994)). WIPTIDE was applied via the recording pipette. Neither WIPTIDE nor Rp-cAMPs had any detectable effect on TTX-R INa(Fig. 1A).
To further investigate the modulation of TTX-RINa by PKA, we determined the effects of agents that increase cAMP on TTX-R INa. Although the adenylate cyclase activator forskolin is routinely used at concentrations between 30 and 50 μm (Akins and McCleskey, 1993), we observed little direct modulation of TTX-RINa with these concentrations. Similarly, we observed little modulation of TTX-R INa with bath application of membrane-permeable analogs of cAMP, 8-bromo-cAMP (500 μm to 1 mm) and db-cAMP (500 μm to 1 mm) (data not shown). The absence of an effect with these compounds at higher concentrations reflected a bell-shaped dose–response relationship, rather than the lack of involvement of this second messenger system in the modulation of TTX-RINa (Fig.3A). The threshold concentration for a forskolin-induced increase in TTX-RINa was ∼300 nm, with a peak effect at 10 μm. At 10 μm, forskolin-induced modulation of TTX-R INa was observed in 10 of 10 neurons tested. Forskolin (10 μm) induced an increase in Gmax (Fig. 3B, Table 3), a leftward shift in the G–V curve (Fig. 3B, Table 3), and an increase in the rates of activation, inactivation, and deactivation of the current (Fig.3C, Table 4). Although we did not exhaustively investigate the effects of membrane-permeable analogs of cAMP, we were able to demonstrate a similar direct modulation of TTX-RINa with 8-bromo-cAMP when lower concentrations (500 nm to 1 μm) were applied (data not shown). That the dose–response relationship for forskolin- and membrane-permeable analogs of cAMP-induced modulation of TTX-RINa is “bell-shaped” may explain whyCardenas and colleagues (1997) failed to detect a cAMP-induced change in the current, because they used a 200 μm solution of a membrane-permeable analog of cAMP, 8-chlorophenylthio-cAMP.
Fig. 3.

TTX-R INa is modulated after activation of PKA. A, Effects of forskolin were dose dependent. TTX-R INa was evoked with a 15 msec depolarizing step to 0 mV, every 10 sec. Five minutes after establishing whole-cell access, forskolin was applied continuously for 4–6 min, the time required for forskolin-evoked changes to develop fully. Forskolin-induced changes in peak current were determined relative to the mean peak current evoked over the minutes before the application of forskolin. Each concentration was tested on 4–10 different neurons. TTX-R INa was increased in 10 of 10 neurons tested with 10 μm forskolin, whereas 5 of 8 responded to 30 μm. B,G–V curves are plotted for data collected before (•) and 5 min after (▪) forskolin (10 μm; n = 10); data are normalized to baseline Gmax. C, Current evoked at 0 mV just before the application of forskolin (trace 1) and 3 min later (trace 2). When trace 1 is scaled to the size of trace 2 to yieldtrace 3, forskolin-induced changes in rates of activation, inactivation, and deactivation are readily apparent. TTX-RINa inactivation is well fit by a single exponential function (gray lines passing throughtraces 2 and 3). Inset, The rate constant (Tau) obtained from a single exponential fit of TTX-R INa is voltage-dependent before (•) and after (▪) application of 10 μm forskolin. The forskolin-induced increase in the rate of inactivation (reflected by smaller values of tau) is apparent at every potential between −20 and +20 mV. D, Forskolin-induced increase in TTX-R INareflects the activation of PKA. Forskolin (10-Fors; 10 μm)-induced increase in GV0.5 Base was significantly (p < 0.01) inhibited by the PKA inhibitor WIPTIDE (+WIP; 10 μm); the inactive isomer of forskolin, 1,9-dideoxy-forskolin (dd-Fors; 10–30 μm), had little effect TTX-RINa.
Including the PKA inhibitor WIPTIDE (10 μm) in the electrode solution resulted in a significant inhibition of forskolin-induced modulation of TTX-R INa (Fig.3D). The forskolin-induced increase in GV0.5 Base was 87 ± 13.3% (n = 10) in the absence of WIPTIDE, compared with 10.5 ± 8% (n = 9) in its presence (p < 0.05). The inactive isomer of forskolin, dd-forskolin (10–100 μm), had no effect on TTX-R INa (Fig. 3D).
Interaction between PKC and PKA in the modulation of TTX-RINa
To determine whether the effects of PKA were dependent on PKC activity and vice versa, we investigated the effects of forskolin in the presence of the PKC inhibitors staurosporine and PKC19–36, and PDBu in the presence of the PKA inhibitors Rp-cAMPs and WIPTIDE. Our results indicated that although the forskolin-induced modulation of TTX-R INa was significantly inhibited by PKC inhibitors (Fig.4A), PKA inhibitors had little effect on a PDBu-induced increase in the current (Fig.4B). Interestingly, although the PDBu-induced increase in TTX-R INa was unaffected by PKA inhibitors, the PDBu-induced changes in the kinetics of TTX-RINa were attenuated in the presence of the PKA inhibitors (data not shown).
Fig. 4.

PKA-induced modulation of TTX-RINa requires PKC activity but PKC activation does not require PKA activity. A, Forskolin (Forsk; 10 μm)-induced increase inGV0.5 Base is significantly attenuated by the inhibitors of PKC: staurosporine (+Stauro; 1 μm preincubated) and PKC19–36(+PKC19–36; 10 μm applied via the patch pipette). B, PDBu (500 nm)-induced increase in GV0.5 Base was unaffected by the presence of PKA inhibitors: WIPTIDE (+WIP; 10 μm) or Rp-cAMPs (+Rp-cAMPs; 1 mm), both applied via the patch pipette.
PGE2-induced modulation of TTX-RINa
Consistent with our previous observations (Gold et al., 1996b), PGE2-induced modulation of TTX-R INawas observed in ∼50% (27/52) of the neurons tested. PGE2was bath-applied at 10 μm to obtain a maximal effect. This is close to a saturating concentration of PGE2, as suggested by the observation that the increase in peak TTX-RINa in response to 10 μmPGE2 (25.4 ± 2.3%) is similar to the increase observed previously in response to 1 μm PGE2(22.7 ± 2.4%) (Gold et al., 1996b). PGE2-induced modulation of TTX-R INa is associated with an increase in the rates of activation, inactivation, and deactivation (Table 4), an increase in Gmax (Table 3), and a small leftward shift in the G–V curve (Table 3). Neurons in experimental and control groups were run concurrently. Because there were no statistically significant differences in either the proportion of neurons responsive to PGE2 or the magnitude of PGE2-induced changes in TTX-RINa between the neurons constituting the four (one for each kinase inhibitor tested) control groups, neurons from each of the control groups were pooled.
Role of PKC in PGE2-induced effects
Because data from both in vivo and in vitrostudies have implicated a role for PKC in nociceptor sensitization (Schepelmann et al., 1993; Barber and Vasko, 1996; Leng et al., 1996) and activation of particular E-type prostaglandin (EP) receptor subtypes may lead to the activation of PKC (Negishi et al., 1995), we investigated the possibility that activation of PKC may contribute to PGE2-induced modulation of TTX-RINa. Neurons were tested for responsiveness to PGE2 (10 μm) (see Materials and Methods for criteria used to determine whether neurons were responsive to a particular test agent) 10 min after establishing whole-cell access in the presence of either PKC19–36 (10 μm, applied via the electrode solution) or staurosporine (1 μm, bath-applied). Both inhibitors significantly attenuated PGE2-induced modulation of TTX-RINa (Table 5). The presence of staurosporine resulted in a significant decrease in the proportion of neurons responsive to PGE2 (0 of 9) compared with neurons tested in the absence of staurosporine (27 of 52) (Fig.5A). In the presence of PKC19–36, 4 of 10 neurons tested were responsive to PGE2. However, the mean percentage increase inGV0.5 Base induced by PGE2 in these four responsive neurons was significantly less than the mean percentage increase in GV0.5 Base induced by PGE2 in responsive neurons in the absence of PKC19–36 (Fig. 5B). PGE2-induced changes in TTX-R INa activation, inactivation, and deactivation rates also were attenuated by inhibitors of PKC (data not shown).
Table 5.
Effects of kinase inhibitors on PGE2-induced changes in TTX-R INa voltage dependence of activation
| Test agent | n | Gmax % Change | V0.5 | K | ||||
|---|---|---|---|---|---|---|---|---|
| Before (mV) | After (mV) | Change | Before (mV) | After (mV) | % Change | |||
| PGE2 (10 μm) | 19 | 19.1 ± 2.4 | −7.3 ± 0.7 | −9.7 ± 0.7 | −2.3 ± 0.3 | 4.7 ± 0.2 | 4.8 ± 0.2 | 3.5 ± 2.2 |
| PGE2 + PKC19–36 (10 μm) | 4 | −4.9 ± 3.3* | −5.1 ± 1.4 | −7.2 ± 0.8 | −2.0 ± 1.0 | 4.7 ± 0.3 | 4.7 ± 0.4 | −0.4 ± 1.3 |
| PGE2 + staurosporine (1 μm) | 10 | −1.8 ± 2.8* | −11.5 ± 0.5 | −12.0 ± 0.6 | −0.5 ± 0.2* | 5.1 ± 0.1 | 5.1 ± 0.1 | −0.4 ± 4.2 |
| PGE2 + WIPTIDE (10 μm) | 4 | 6.2 ± 3.8* | −8.4 ± 1.2 | −9.1 ± 1.4 | −0.8 ± 0.2 | 5.1 ± 0.6 | 4.9 ± 0.7 | −0.7 ± 0.7 |
| PGE2 + Rp-cAMPs (1 mm) | 9 | −7.4 ± 1.3* | −5.5 ± 0.5 | −6.6 ± 0.6 | −1.1 ± 0.3 | 5.0 ± 0.1 | 5.0 ± 0.2 | 1.2 ± 1.7 |
*Significant differences between the effects of PGE2alone and of PGE2 in the presence of PKC or PKA inhibitors (p < 0.05).
Fig. 5.

Inhibitors of both PKA and PKC attenuate PGE2-induced modulation of TTX-RINa. A, MeanG–V curves obtained after PGE2 application are plotted for the 27 of 52 PGE2-responsive neurons observed under control conditions (•), the 9 of 9 neurons observed after 10 min of continuous bath application of 1 μm staurosporine (▪), and the 10 of 10 neurons unresponsive to PGE2 application observed 10 min after establishing whole-cell access with an electrode solution containing 1 mm Rp-cAMPs (▴). This difference in the proportion of neurons responsive to PGE2 in the presence and absence of staurosporine or Rp-cAMPs was significant (p < 0.05). Values forV0.5 and slope factor were −10.4 mV and 4.9 mV for control neurons, −6.7 and 5.6 mV for neurons in the presence of staurosporine, and −6.7 and 4.8 mV for neurons in the presence of Rp-cAMPs. B, Subpopulations of neurons were responsive to PGE2 in the presence of either PKC19–36 or WIPTIDE. Four of 10 neurons were responsive to PGE2 10 min after establishing whole-cell access with an electrode solution containing 10 μm PKC19–36, whereas the same number of neurons (4 of 10) were responsive to PGE2 10 min after establishing whole-cell access with an electrode solution containing 10 μm WIPTIDE. However, the PGE2-induced increase in GV0.5 Base (PGE2; 42.3 ± 3.5 in 27 of 52 PGE2-responsive neurons) observed in control neurons was significantly attenuated (p < 0.05) in the presence of PKC19–36 (+PKC19–36; 12.5 ± 12.6 in the 4 of 10 PGE2-responsive neurons) and WIPTIDE (+WIPTIDE; 13.8 ± 2.3 in 4 of 10 PGE2-responsive neurons).
Our results with the PKC inhibitors suggested that PKC activity was necessary for the expression of PGE2-induced modulation of TTX-R INa. However, these observations do not indicate whether PKC activation is sufficient to explain PGE2-induced effects. To begin to investigate whether PKC activation is sufficient to explain PGE2-induced effects, we determined the effect of PGE2 (10 μm) after the application of PMA or PDBu. That is, if PGE2modulates TTX-R INa via another pathway, then PMA- or PDBu-induced modulation of the current should not occlude PGE2-induced modulation of the current. After the application of PMA (30 nm) or PDBu (500 nm), PGE2 induced no additional change in TTX-RINa (see Fig. 2C: mean change inG at V0.5 Base was −5.1 ± 2.8%; n = 5).
Role of PKA in PGE2-induced effects
To determine whether PKA activation was involved in PGE2-induced modulation of TTX-RINa, we determined the effects of PGE2 in the presence of the PKA inhibitors, Rp-cAMPs, and WIPTIDE. Ten minutes after establishing whole-cell access, neurons were tested for responsiveness to PGE2 (10 μm). The presence of Rp-cAMPs (1 mm) in the recording pipette resulted in a significant decrease in the proportion of neurons responsive to PGE2 (0 of 10) compared with neurons tested in the absence of Rp-cAMPs (27 of 52) (Fig. 5A). In the presence of WIPTIDE (10 μm), 4 of 10 neurons tested were responsive to PGE2. However, the mean percentage increase in GV0.5 Base induced by PGE2 in these four responsive neurons was significantly (p < 0.05) less than the mean percentage increase in GV0.5 Base induced by PGE2 in responsive neurons in the absence of WIPTIDE (Fig.5B). PGE2-induced changes in TTX-RINa activation, inactivation, and deactivation rates also were attenuated by inhibitors of PKA (data not shown).
To further investigate the involvement of PKA activation in PGE2-induced modulation of TTX-RINa, we determined the effects of agents that increase cAMP on PGE2-induced modulation of the current. The combination of PGE2 (10 μm) and forskolin (10 μm) induced changes in TTX-RINa that were not significantly different from the effects induced by forskolin alone: the combination of agents induced a 75.2 ± 10.6% increase in GV0.5 Base, whereas forskolin alone induced an increase of 87.5 ± 13.3% (p > 0.05). These results are consistent with the suggestion that PGE2 acts via PKA, given the possibility that the forskolin-induced effects occluded any additional modulation of the current by PGE2.
Interestingly, the effect of PGE2 (10 μm) in combination with high concentrations of forskolin (100 μm), the water soluble analog of forskolin, 7,7-forskolin (100 μm), or the membrane-permeable analogs of cAMP (db-cAMP or 8-bromo-cAMP) (1 mm) was significantly larger than the effect of PGE2 alone (p < 0.01) (Fig. 6A). At high concentrations these compounds alone produced little change in TTX-R INa (Fig. 6B).
Fig. 6.
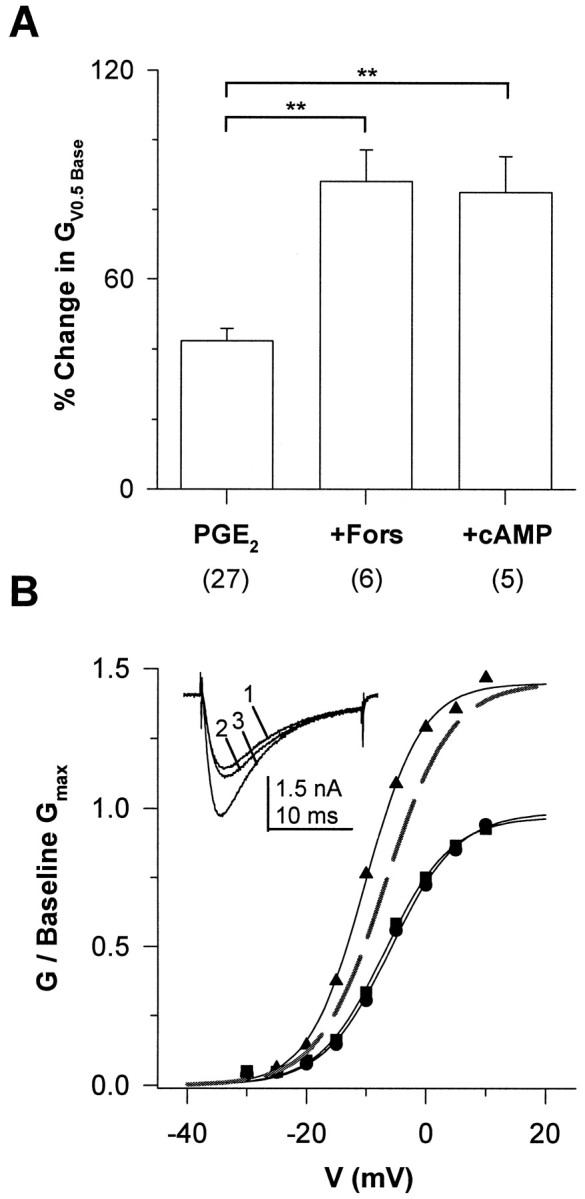
PGE2-induced modulation of TTX-RINa was potentiated by high concentrations of forskolin or 8-bromo-cAMP. A, The PGE2-induced increase in GV0.5 Base (PGE2; 42.3 ± 3.5 for the 27 of 52 PGE2-responsive neurons) observed in control neurons was significantly increased (p < 0.01) in the presence of 100 μm 7,7-forskolin (+Fors; 88.1 ± 9.1; 6 of 8 PGE2-responsive neurons) and 1 mm 8-bromo-cAMP (+cAMP; 87.5 ± 13.3; 5 of 9 PGE2-responsive neurons). B,G–V curves obtained before (▪) and after the application of 100 (7,7-forskolin) (•) and 100 μm 7,7-forskolin plus 10 μmPGE2 (▴). A 4 min application of 7,7-forskolin induced little change in the baseline G–V. However, 120 sec after the application of PGE2 in the presence of 7,7-forskolin, Gmax was increased (46%). Values for V0.5 and slope factor were −5.9 and 5.6 mV for baseline data, −6.8 and 5.5 mV in the presence of 7,7-forskolin, and −10.2 and 4.7 mV in the presence of 7,7-forskolin plus PGE2, respectively.Inset, TTX-R INa evoked at 0 mV, before (trace 1) and after the application of 7,7-forskolin (trace 2) and 7,7-forskolin plus PGE2 (trace 3).
DISCUSSION
We have investigated the regulation of TTX-RINa by PKC and PKA activity and the contribution of these kinases to PGE2-induced modulation of TTX-RINa in adult rat DRG neurons in vitro. Our results indicate that although activity in both kinases may influence the biophysical properties of TTX-RINa, their effects on this current are different. Furthermore, activity in both protein kinases appears to be necessary for the expression of PGE2-induced modulation of the current. Figure 7 represents a model of our working hypothesis regarding the modulation of TTX-RINa by PKC, PKA, and PGE2.
Fig. 7.

Possible mechanisms underlying PKC-, PKA- and PGE2-induced modulation of TTX-RINa. Pathways clearly implicated by experimental evidence are represented by solid arrows. Pathways for which there is minimal experimental evidence are represented by dashed arrows. Protein kinase C (PKC) appears to be constitutively active in DRG neurons. Inhibition (−) of PKC results in a decrease (−) in the maximal conductance (Gmax) of TTX-RINa. Activation (+) of PKC increases (+) theGmax of TTX-RINa. That activation of PKC increases TTX-RINa suggests that stimuli (thermal and chemical) whose transduction pathways result in the activation of PKC may sensitize nociceptors via the modulation of TTX-RINa. Activation of PKA also increasesGmax of TTX-RINa, in addition to increasing the rates of current activation, inactivation, and deactivation and shifting the voltage-dependence of activation in a hyperpolarizing direction. Although the magnitude of PKA-induced changes in TTX-RINa are larger than PKC-induced changes in the current, PKC activity is necessary to enable PKA-induced modulation of TTX-R INa. PGE2-induced modulation of TTX-R INa involves the activation of PKA and is dependent on PKC activity. Several observations suggest that PGE2 may activate another second messenger pathway(s) in addition to that involving activation of PKA (see Results for details). One such pathway may involve activation of PKC in a feedback mechanism resulting in the attenuation of PGE2-induced effects. A second additional pathway may involve inhibition of adenylate cyclase, resulting in a decrease in PKA activity.
PKC-induced modulation of TTX-R INa
Two observations support the suggestion that constitutively active PKC modulates TTX-R INa. First, PKC inhibitors alone decrease TTX-R INa density. This effect appears to be specific for PKC inhibitors because similar results were obtained with two different PKC inhibitors but not with PKA inhibitors. Second, at least one agent that activates PKC (i.e., PMA) induces changes in TTX-R INa that are not only opposite but are qualitatively similar to PKC inhibitor-induced changes in the current, suggesting that TTX-R INa density may be controlled by the level of PKC activity.
PKA-induced modulation of TTX-R INa
Our results indicate that activation of PKA mediates modulation of TTX-R INa. This conclusion is based on the observations that the effects of forskolin and membrane-permeable analogs of cAMP were blocked by inhibitors of PKA and that the inactive isoform of forskolin was without effect. Because PKC-modulation of TTX-RINa is qualitatively different from that induced by PKA, we suggest that PKC- and PKA-induced modulation of TTX-RINa occur via distinct processes.
Interaction between PKC and PKA in the modulation of TTX-RINa
Our results suggest that PKC activity is necessary to enable PKA-induced modulation of the TTX-R INa. This suggestion is based on the observation that both staurosporine and PKC19–36 significantly inhibited forskolin-induced modulation of the current, whereas in the reverse experiment, WIPTIDE had little effect on a PDBu-induced increase in TTX-RINa. These observations are analogous to those obtained with brain type IIA channels where it has been demonstrated that PKC-induced phosphorylation of the channel protein at serine 1506 is necessary to enable PKA-induced phosphorylation of other sites on the channel protein (Li et al., 1993).
PKC and PKA induce changes in TTX-R INa that, when taken together, are different from those induced in other VGSCs. TTX-R INa is the only current described to date that is increased after activation of PKA and PKC. In contrast, the majority of VGSCs modulated by PKC and/or PKA are inhibited by these kinases (Gershon et al., 1992; Li et al., 1992,1993; Ono et al., 1993; Thio and Sontheimer, 1993; Qu et al., 1994;Cantrell et al., 1996, 1997). VGSC passing through skeletal muscle SkM1 channels are unaffected by PKA activation (Bendahhou et al., 1997; Frohnwieser et al., 1997). Furthermore, although a PKA- or PKC-induced increase in other VGSCs has been described, changes in the biophysical properties of these currents associated with the increase in current are different from the PKC- and PKA-induced changes in TTX-RINa. For example, unlike the PKA-induced increase in TTX-R INa rates of activation, inactivation, and deactivation (Fig. 3), the PKA-induced increases in hH1 (Frohnwieser et al., 1997) or SkM2 (Schreibmayer et al., 1994) currents are associated with no change in kinetics. Finally, the PKC-mediated increase in the TTX-insensitive current present in astrocytes is associated with a 6–18 mV leftward shift in the activation of the current (Thio and Sontheimer, 1993), whereas we did not observe a similar shift associated with the PKC-induced increase in TTX-R INa.
Contribution of PKA activation to PGE2-induced modulation of TTX-R INa
Data from a number of studies have implicated the activation of PKA as an underlying mechanism of inflammatory mediator-induced hyperalgesia (Taiwo et al., 1989, 1992) and nociceptor sensitization (Cui and Nicol, 1995; Hingtgen et al., 1995; Mizumura et al., 1996;Wang et al., 1996). The strongest evidence in support of a role for the activation of PKA in PGE2-induced modulation of TTX-RINa is the inhibition of PGE2-induced effects by inhibitors of PKA (i.e., WIPTIDE and Rp-cAMPs). Further support is provided by the observation that PGE2-induced effects are mimicked by agents, such as forskolin, that increase the intracellular concentration of cAMP. That PGE2-induced modulation of TTX-R INainvolves the activation of PKA is consistent with the suggestion that modulation of TTX-R INa is an underlying mechanism of inflammatory hyperalgesia and nociceptor sensitization.
Several of our observations, however, are compatible with the suggestion that PGE2 activates other second messenger pathway(s) in addition to one resulting in the activation of PKA. First, PGE2-induced modulation of TTX-RINa was potentiated after application of a high “ineffective” concentration of forskolin. If PGE2 acted solely through the activation of a cAMP/PKA pathway, then the addition of PGE2 after a high concentration of forskolin should not have had any effect on TTX-R INa. The fact that similar results were obtained with 8-bromo-cAMP argues against the possibility that the absence of a direct effect with high concentrations of forskolin reflects a nonspecific action of this compound.
Second, the effects of 10 μm PGE2 were significantly less than those observed in response to 10 μm forskolin. It is unlikely that 10 μmPGE2 is not a saturating concentration of agonist given that the affinity of PGE2 for its various receptors ranges between 2.9 and 21 nm (Sugimoto et al., 1992; Honda et al., 1993; Watabe et al., 1993), and there is little difference between 1 and 10 μm PGE2-induced changes in TTX-RINa. A more likely possibility is that PGE2 is not a full agonist in adult DRG neurons. PGE2 may appear to function as a partial agonist if two EP receptor subtypes coupled to opposing second messenger pathways are present in the same neuron (Negishi et al., 1995). Such a mechanism has been proposed to underlie modality-specific sensitization of nociceptors (Mizumura et al., 1996).
Third, PGE2-induced modulation of TTX-RINa was significantly attenuated by inhibitors of PKC.
Contribution of PKC activation to PGE2-induced modulation of TTX-R INa
The presence of either PKC19–36 or staurosporine significantly inhibited PGE2-induced changes in TTX-RINa, suggesting that PKC activity is necessary for PGE2-induced modulation of TTX-RINa. However, these results do not indicate whether PKC is activated by PGE2. Although the question of whether PGE2-induced modulation of TTX-RINa involves the activation of PKC remains to be determined, the observation that activation of PKC fails to mimic PGE2-induced modulation of the current suggests that PGE2 must activate another second messenger pathway (in addition to one dependent on PKC).
PGE2 failed to induce any additional change in TTX-RINa when PGE2 was applied after PMA or PDBu. The absence of additional PGE2-induced effects may reflect a “ceiling effect.” However, this is unlikely given that the combination of PGE2 and 8-bromo cAMP induced an increase in TTX-R INa that was significantly larger than the increase induced by either PMA or PDBu. Another possibility is that the activation of PKC may serve as a form of feedback inhibition for PGE2-induced sensitization. The involvement of PKC in the inhibition of receptor-mediated processes has been demonstrated previously (Swartz et al., 1993; Blanc et al., 1995).
Physiological significance
The physiological relevance of our data, obtained in vitro from the cell body of DRG neurons, is largely predicated on the assumption that TTX-R INa is present in the terminals of primary afferent nociceptors in vivo. Although the current is clearly present in the DRG cell body in vivo(Ritter and Mendell, 1992), results from several studies suggest that the current also may be present both in the central (Jeftinija, 1994;Gu and MacDermott, 1997) and the peripheral terminals of nociceptive afferents (Khasar et al., 1998; Strassman et al., 1997). There also is evidence that TTX-R INa is present in axons (Quasthoff et al., 1995), but given that axonal conduction is blocked with TTX (Ritter and Mendell, 1992; Villiere and McLachlan, 1996), the function of TTX-R INa in the axon has yet to be determined. Nevertheless, the available data does support the suggestion that TTX-R INa contributes to the control of the excitability of central and peripheral terminals of nociceptors. Furthermore, there is increasing evidence indicating that the excitability of the sensory neuron cell body may have important physiological and pathophysiological ramifications (Kajander et al., 1992; McLachlan et al., 1993). In that light, our observations raise several important issues concerning the underlying mechanisms of nociceptor sensitization. First, the fact that activation of either PKA or PKC increases TTX-R INa suggests that modulation of this current may serve as a common mechanism underlying nociceptor sensitization induced by diverse physiological processes. Second, the involvement of two second messenger pathways in the modulation of TTX-R INa may facilitate the interaction between hyperalgesic inflammatory mediators and other stimuli (thermal, mechanical, and chemical) in the establishment of nociceptor sensitization. Third, because PKC activity appears to be necessary to enable an increase in TTX-RINa, targeting the PKC isoform(s) underlying the regulation of TTX-R INa density may provide a novel therapeutic intervention for the treatment of pain.
Footnotes
This work was supported by National Institutes of Health Grant 1RO1NS36929-01A1 (M.S.G.), by the Department of Anesthesiology, University of California Los Angeles, and by a postdoctoral fellowship from the Gianini Foundation. We thank Dr. Francisco Bezanilla for many helpful discussions concerning experimental design and the preparation of this manuscript.
Correspondence should be addressed to Dr. Michael S. Gold, University of Maryland, Baltimore Dental School, Department of Oral and Craniofacial Biological Sciences, Room 5-A-12, 666 West Baltimore Street, Baltimore, MD 21201.
REFERENCES
- 1.Akins PT, McCleskey EW. Characterization of potassium currents in adult rat sensory neurons and modulation by opioids and cyclic AMP. Neuroscience. 1993;56:759–769. doi: 10.1016/0306-4522(93)90372-m. [DOI] [PubMed] [Google Scholar]
- 2.Barber LA, Vasko MR. Activation of protein kinase C augments peptide release from rat sensory neurons. J Neurochem. 1996;67:72–80. doi: 10.1046/j.1471-4159.1996.67010072.x. [DOI] [PubMed] [Google Scholar]
- 3.Bendahhou S, Cummins TR, Agnew WS. Mechanism of modulation of the voltage-gated skeletal and cardiac muscle sodium channels by fatty acids. Am J Physiol. 1997;272:C592–C600. doi: 10.1152/ajpcell.1997.272.2.C592. [DOI] [PubMed] [Google Scholar]
- 4.Birrell GJ, McQueen DS, Iggo A, Coleman RA, Grubb BD. PGI2-induced activation and sensitization of articular mechanonociceptors. Neurosci Lett. 1991;124:5–8. doi: 10.1016/0304-3940(91)90809-8. [DOI] [PubMed] [Google Scholar]
- 5.Blanc E, Vignes M, Recasens M. Protein kinase C differently regulates quisqualate- and 1S,3R-trans aminocyclopentane dicarboxylate-induced phosphoinositide hydrolysis during in vitro development of hippocampal neurons. Neurochem Int. 1995;26:623–633. doi: 10.1016/0197-0186(94)00174-s. [DOI] [PubMed] [Google Scholar]
- 6.Braha O, Edmonds B, Sacktor T, Kandel ER, Klein M. The contributions of protein kinase A and protein kinase C to the actions of 5-HT on the L-type Ca2+ current of the sensory neurons in Aplysia. J Neurosci. 1993;13:1839–1851. doi: 10.1523/JNEUROSCI.13-05-01839.1993. [DOI] [PMC free article] [PubMed] [Google Scholar]
- 7.Cantrell AR, Ma JY, Scheuer T, Catterall WA. Muscarinic modulation of sodium current by activation of protein kinase C in rat hippocampal neurons. Neuron. 1996;16:1019–1026. doi: 10.1016/s0896-6273(00)80125-7. [DOI] [PubMed] [Google Scholar]
- 8.Cantrell AR, Smith RD, Goldin AL, Scheuer T, Catterall WA. Dopaminergic modulation of sodium current in hippocampal neurons via cAMP-dependent phosphorylation of specific sites in the sodium channel α subunit. J Neurosci. 1997;17:7330–7338. doi: 10.1523/JNEUROSCI.17-19-07330.1997. [DOI] [PMC free article] [PubMed] [Google Scholar]
- 9.Cardenas CG, Del Mar LP, Cooper BY, Scroggs RS. 5HT4 receptors couple positively to tetrodotoxin-insensitive sodium channels in a subpopulation of capsaicin-sensitive rat sensory neurons. J Neurosci. 1997;17:7181–7189. doi: 10.1523/JNEUROSCI.17-19-07181.1997. [DOI] [PMC free article] [PubMed] [Google Scholar]
- 10.Cui M, Nicol GD. Cyclic AMP mediates the prostaglandin E2-induced potentiation of bradykinin excitation in rat sensory neurons. Neuroscience. 1995;66:459–466. doi: 10.1016/0306-4522(94)00567-o. [DOI] [PubMed] [Google Scholar]
- 11.England S, Bevan S, Docherty RJ. PGE2 modulates the tetrodotoxin-resistant sodium current in neonatal rat dorsal root ganglion neurons via the cyclic AMP-protein kinase A cascade. J Physiol (Lond) 1996;495:429–440. doi: 10.1113/jphysiol.1996.sp021604. [DOI] [PMC free article] [PubMed] [Google Scholar]
- 12.Ferreira SH. Prostaglandins, aspirin-like drugs and analgesia. Nature. 1972;240:200–203. doi: 10.1038/newbio240200a0. [DOI] [PubMed] [Google Scholar]
- 13.Frohnwieser B, Weigl L, Schreibmayer W. Modulation of cardiac sodium channel isoform by cyclic AMP dependent protein kinase does not depend on phosphorylation of serine 1504 in the cytosolic loop interconnecting transmembrane domains III and IV. Pflügers Arch. 1995;430:751–753. doi: 10.1007/BF00386171. [DOI] [PubMed] [Google Scholar]
- 14.Frohnwieser B, Chen LQ, Schreibmayer W, Kallen RG. Modulation of the human cardiac sodium channel alpha-subunit by cAMP-dependent protein kinase and the responsible sequence domain. J Physiol (Lond) 1997;498:309–318. doi: 10.1113/jphysiol.1997.sp021859. [DOI] [PMC free article] [PubMed] [Google Scholar]
- 15.Gershon E, Weigl L, Lotan I, Schreibmayer W, Dascal N. Protein kinase A reduces voltage-dependent Na+ current in Xenopus oocytes. J Neurosci. 1992;12:3743–3752. doi: 10.1523/JNEUROSCI.12-10-03743.1992. [DOI] [PMC free article] [PubMed] [Google Scholar]
- 16.Gold MS, Dastmalchi S, Levine JD. Co-expression of nociceptor properties in dorsal root ganglion neurons from the adult rat in vitro. Neuroscience. 1996a;71:265–275. doi: 10.1016/0306-4522(95)00433-5. [DOI] [PubMed] [Google Scholar]
- 17.Gold MS, Reichling DB, Shuster MJ, Levine JD. Hyperalgesic agents increase a tetrodotoxin-resistant Na+ current in nociceptors. Proc Natl Acad Sci USA. 1996b;93:1108–1112. doi: 10.1073/pnas.93.3.1108. [DOI] [PMC free article] [PubMed] [Google Scholar]
- 18.Gu JG, MacDermott AB. Activation of ATP P2X receptors elicits glutamate release from sensory neuron synapses. Nature. 1997;389:749–753. doi: 10.1038/39639. [DOI] [PubMed] [Google Scholar]
- 19.Hingtgen CM, Waite KJ, Vasko MR. Prostaglandins facilitate peptide release from rat sensory neurons by activating the adenosine 3′,5′-cyclic monophosphate transduction cascade. J Neurosci. 1995;15:5411–5419. doi: 10.1523/JNEUROSCI.15-07-05411.1995. [DOI] [PMC free article] [PubMed] [Google Scholar]
- 20.Honda A, Sugimoto Y, Namba T, Watabe A, Irie A, Negishi M, Narumiya S, Ichikawa A. Cloning and expression of a cDNA for mouse prostaglandin E receptor EP2 subtype. J Biol Chem. 1993;268:7759–7762. [PubMed] [Google Scholar]
- 21.Jeftinija S. The role of tetrodotoxin-resistant sodium channels of small primary afferent fibers. Brain Res. 1994;639:125–134. doi: 10.1016/0006-8993(94)91772-8. [DOI] [PubMed] [Google Scholar]
- 22.Kajander KC, Wakisaka S, Bennett GJ. Spontaneous discharge originates in the dorsal root ganglion at the onset of a painful peripheral neuropathy in the rat. Neurosci Lett. 1992;138:225–228. doi: 10.1016/0304-3940(92)90920-3. [DOI] [PubMed] [Google Scholar]
- 23.Khasar SG, Gold MS, Levine JD (1998) A tetrodotoxin -resistant sodium current mediates inflammatory pain. Neurosci Lett, in press. [DOI] [PubMed]
- 24.Kozlowski RZ, Goodstadt LJ, Twist VW, Powell T. Modulation of cardiac L-type Ca2+ channels by GTP gamma S in response to isoprenaline, forskolin and photoreleased nucleotides. Br J Pharmacol. 1994;111:250–258. doi: 10.1111/j.1476-5381.1994.tb14052.x. [DOI] [PMC free article] [PubMed] [Google Scholar]
- 25.Leng S, Mizumura K, Koda H, Kumazawa T. Excitation and sensitization of the heat response induced by a phorbol ester in canine visceral polymodal receptors studied in vitro. Neurosci Lett. 1996;206:13–16. doi: 10.1016/0304-3940(96)12414-9. [DOI] [PubMed] [Google Scholar]
- 26.Li M, West JW, Lai Y, Scheuer T, Catterall WA. Functional modulation of brain sodium channels by cAMP-dependent phosphorylation. Neuron. 1992;8:1151–1159. doi: 10.1016/0896-6273(92)90135-z. [DOI] [PubMed] [Google Scholar]
- 27.Li M, West JW, Numann R, Murphy BJ, Scheuer T, Catterall WA. Convergent regulation of sodium channels by protein kinase C and cAMP-dependent protein kinase. Science. 1993;261:1439–1442. doi: 10.1126/science.8396273. [DOI] [PubMed] [Google Scholar]
- 28.McLachlan EM, Jang W, Devor M, Michaelis M. Peripheral nerve injury triggers noradrenergic sprouting within dorsal root ganglia. Nature. 1993;363:543–546. doi: 10.1038/363543a0. [DOI] [PubMed] [Google Scholar]
- 29.Mizumura K, Koda H, Kumazawa T. Opposite effects of increases in intracellular cyclic AMP on the heat and bradykinin responses of canine visceral polymodal receptors in vitro. Neurosci Res. 1996;25:335–341. doi: 10.1016/0168-0102(96)01056-5. [DOI] [PubMed] [Google Scholar]
- 30.Negishi M, Sugimoto Y, Ichikawa A. Molecular mechanisms of diverse actions of prostanoid receptors. Biochim Biophys Acta. 1995;1259:109–119. doi: 10.1016/0005-2760(95)00146-4. [DOI] [PubMed] [Google Scholar]
- 31.Ono K, Fozzard HA, Hanck DA. Mechanism of cAMP-dependent modulation of cardiac sodium channel current kinetics. Circ Res. 1993;72:807–815. doi: 10.1161/01.res.72.4.807. [DOI] [PubMed] [Google Scholar]
- 32.Qu Y, Rogers J, Tanada T, Scheuer T, Catterall WA. Modulation of cardiac Na+ channels expressed in a mammalian cell line and in ventricular myocytes by protein kinase C. Proc Natl Acad Sci USA. 1994;91:3289–3293. doi: 10.1073/pnas.91.8.3289. [DOI] [PMC free article] [PubMed] [Google Scholar]
- 33.Quasthoff S, Grosskreutz J, Schroder JM, Schneider U, Grafe P. Calcium potentials and tetrodotoxin-resistant sodium potentials in unmyelinated C fibres of biopsied human sural nerve. Neuroscience. 1995;69:955–965. doi: 10.1016/0306-4522(95)00307-5. [DOI] [PubMed] [Google Scholar]
- 34.Ritter AM, Mendell LM. Somal membrane properties of physiologically identified sensory neurons in the rat: effects of nerve growth factor. J Neurophysiol. 1992;68:2033–2041. doi: 10.1152/jn.1992.68.6.2033. [DOI] [PubMed] [Google Scholar]
- 35.Schepelmann K, Messlinger K, Schmidt RF. The effects of phorbol ester on slowly conducting afferents of the cat’s knee joint. Exp Brain Res. 1993;92:391–398. doi: 10.1007/BF00229027. [DOI] [PubMed] [Google Scholar]
- 36.Schreibmayer W, Frohnwieser B, Dascal N, Platzer D, Spreitzer B, Zechner R, Kallen RG, Lester HA. Beta-adrenergic modulation of currents produced by rat cardiac Na+ channels expressed in Xenopus laevis oocytes. Receptors Channels. 1994;2:339–350. [PubMed] [Google Scholar]
- 37.Strassman AM, Raymond SA, Burstein R. Modulation of mechanosensitivity of rat intracranial meningeal afferents by mechanical and chemical stimuli. Soc Neurosci Abstr. 1997;23:1256. [Google Scholar]
- 38.Sugimoto Y, Namba T, Honda A, Hayashi Y, Negishi M, Ichikawa A, Narumiya S. Cloning and expression of a cDNA for mouse prostaglandin E receptor EP3 subtype. J Biol Chem. 1992;267:6463–6466. [PubMed] [Google Scholar]
- 39.Swartz KJ, Merritt A, Bean BP, Lovinger DM. Protein kinase C modulates glutamate receptor inhibition of Ca2+ channels and synaptic transmission. Nature. 1993;361:165–168. doi: 10.1038/361165a0. [DOI] [PubMed] [Google Scholar]
- 40.Taiwo YO, Bjerknes LK, Goetzl EJ, Levine JD. Mediation of primary afferent peripheral hyperalgesia by the cAMP second messenger system. Neuroscience. 1989;32:577–580. doi: 10.1016/0306-4522(89)90280-7. [DOI] [PubMed] [Google Scholar]
- 41.Taiwo YO, Heller PH, Levine JD. Mediation of serotonin hyperalgesia by the cAMP second messenger. Neuroscience. 1992;48:479–483. doi: 10.1016/0306-4522(92)90507-x. [DOI] [PubMed] [Google Scholar]
- 42.Thio CL, Sontheimer H. Differential modulation of TTX-sensitive and TTX-resistant Na+ channels in spinal cord astrocytes following activation of protein kinase C. J Neurosci. 1993;13:4889–4897. doi: 10.1523/JNEUROSCI.13-11-04889.1993. [DOI] [PMC free article] [PubMed] [Google Scholar]
- 43.Vane JR. Inhibition of prostaglandin synthesis as a mechanism of action for aspirin-like drugs. Nat New Biol. 1971;231:232–235. doi: 10.1038/newbio231232a0. [DOI] [PubMed] [Google Scholar]
- 44.Villiere V, McLachlan EM. Electrophysiological properties of neurons in intact rat dorsal root ganglia classified by conduction velocity and action potential duration. J Neurophysiol. 1996;76:1924–1941. doi: 10.1152/jn.1996.76.3.1924. [DOI] [PubMed] [Google Scholar]
- 45.Wang JF, Khasar SG, Ahlgren SC, Levine JD. Sensitization of C-fibres by prostaglandin E2 in the rat is inhibited by guanosine 5′-O-(2-thiodiphosphate), 2′,5′-dideoxyadenosine and Walsh inhibitor peptide. Neuroscience. 1996;71:259–263. doi: 10.1016/0306-4522(95)00429-7. [DOI] [PubMed] [Google Scholar]
- 46.Watabe A, Sugimoto Y, Honda A, Irie A, Namba T, Negishi M, Ito S, Narumiya S, Ichikawa A. Cloning and expression of cDNA for a mouse EP1 subtype of prostaglandin E receptor. J Biol Chem. 1993;268:20175–20178. [PubMed] [Google Scholar]