

Abstract
In situ expression of c-fos observed in response to phenylephrine (PE)-induced hypertension provided a basis for characterizing the organization and neurotransmitter specificity of neurons at nodal points of medullary baroreflex circuitry. Sustained hypertension induced by a moderate dose of PE provoked patterns ofc-fos mRNA and protein expression that conformed in the nucleus of the solitary tract (NTS) to the termination patterns of primary baroreceptor afferents and in the caudal ventrolateral medulla (CVLM) to a physiologically defined depressor region. A majority of barosensitive CVLM neurons concurrently displayed markers for the GABAergic phenotype; few were glycinergic. Phenylephrine-sensitive GABAergic neurons that were retrogradely labeled after tracer deposits in pressor sites of the rostral ventrolateral medulla (RVLM) occupied a zone extending ∼1.4 mm rostrally from the level of the calamus scriptorius, intermingled partly with catecholaminergic neurons of the A1 and C1 cell groups. By contrast, barosensitive neurons of the NTS were found to be phenotypically complex, with very few projecting directly to the RVLM. Extensive colocalization of PE-induced Fos-IR and markers for the nitric oxide phenotype were seen in a circumscribed, rostral, portion of the baroreceptor afferent zone of the NTS, whereas only a small proportion of PE-sensitive neurons in the NTS were found to be GABAergic. PE treatment parameters have been identified that provide a basis for defining and characterizing populations of neurons at the first station in the central processing of primary baroreceptor input and at a key inhibitory relay in the CVLM.
Keywords: baroreflex, GABA, glycine, nitric oxide, c-fos, nucleus of the solitary tract, ventrolateral medulla
The arterial baroreceptor reflex provides a rapid negative feedback mechanism that dampens fluctuations in cardiovascular parameters induced by environmental insults. A rise in arterial transmural pressure increases the discharge of high-pressure mechanoreceptors in the carotid sinus and aortic arch that are sensitive to changes in vessel wall distention. Sensory information originating from these receptors is conveyed to the medulla by branches of the glossopharyngeal and vagus nerves to modulate vagal and sympathetic outflow to the heart and peripheral vasculature, resulting in bradycardia and peripheral vasodilation, respectively (Spyer, 1990). Despite their essential simplicity, the neural substrates underlying these responses remain to be fully elaborated.
The carotid sinus and aortic depressor nerves convey primary baroreceptor afferent information to partly overlapping regions of the nucleus of the solitary tract (NTS) (for review, see Loewy, 1990;Spyer, 1990). Many cells within this barorecipient zone exhibit powerful, short latency responses to afferent nerve stimulation, supporting the existence of a continuous “baroreceptor strip” region in the NTS (Spyer, 1994). Nevertheless, the complexity of postsynaptic potentials that may be evoked within the strip region after baroreceptor activation suggests an involvement of local microcircuits, even in the early stages of processing (for review, seeSpyer, 1994). The precise location and phenotype of second-order neurons supplied by baroreceptor afferents, as well as the identity of subsequent relays within the NTS, have not been rigorously defined.
Output from the NTS modulates the activity of reticulospinal vasomotor neurons in the rostral ventrolateral medulla (RVLM) that mediate tonic and reflex adjustments of sympathetic outflow (Morrison et al., 1988;Haselton and Guyenet, 1989; for review, see Dampney, 1994). The manner in which baroreceptor information reaches the RVLM remains unsettled. Although evidence exists of a direct NTS–RVLM projection (Ross et al., 1985), electrophysiological (Agarwal and Calaresu, 1991; Jeske et al., 1993) and pharmacological (Willette et al., 1984; Blessing, 1988) data support the view that baroreceptor information accesses the RVLM principally via interneurons in a functionally defined “depressor region” of the caudal ventrolateral medulla (CVLM) (Aicher et al., 1995; Jeske et al., 1995). A clear anatomic and phenotypic definition of the CVLM depressor region has not been achieved, owing in part to complications imposed by the fact that depressor neurons may be interdigitated among functionally related catecholaminergic relay (Day et al., 1983; Aicher et al., 1995), vagal cardiomotor (Bieger and Hopkins, 1987), and ventral respiratory (Ellenberger et al., 1990;Pilowsky et al., 1990) cell groups.
Recognition of the ability of certain cellular immediate-early genes (IEG), notably the c-fos proto-oncogene, to provide sensitive, inducible, and high resolution markers of extended neural systems activated by salient environmental events holds potential for functional mapping of cardiovascular regulatory circuitry (for review, see Morgan and Curran, 1991; Dampney et al., 1995). Using this technology, we and others have demonstrated that acute or sustained hypertension provokes c-fos expression in noncatecholaminergic medullary neurons, the distribution of which in the NTS conforms to the termination patterns of primary baroreceptor afferents and in the CVLM overlaps with the caudal depressor region (e.g., Badoer et al., 1994; Chan and Sawchenko, 1994; Li and Dampney, 1994). In the present study, we sought to characterize further the organization and neurotransmitter specificity of neurons at these key points in the baroreflex pathway using approaches that enabled combined localization of (1) c-fos expression provoked by sustained phenylephrine-induced hypertension, (2) markers for major inhibitory neurotransmitter systems, catecholamines, and nitric oxide (NO), and (3) retrograde labeling after tracer injections into physiologically defined pressor sites in the RVLM.
Parts of this paper have been published previously in abstract form (Chan and Sawchenko, 1995b).
MATERIALS AND METHODS
Animals and surgery. Adult male Sprague Dawley albino rats (280–350 gm) were housed individually in a temperature-controlled room on a 12:12 hr light/dark cycle (lights on at 6:00 A.M.), with food and water available ad libitum, and were adapted to handling for a week before any manipulation. For intravenous infusion, a catheter containing sterile heparin–saline (500 U/ml) was implanted in the external jugular vein under methoxyflurane anesthesia 2 d before treatment, as described previously (Chan and Sawchenko, 1994).
Cardiovascular challenges. On the day of experimentation, the jugular catheter was connected to a remote infusion system filled with the vasoconstrictor drug l-phenylephrine hydrochloride (PE; Sigma, St. Louis, MO) dissolved in 0.9% sterile saline at moderate (0.6 μg/μl) or higher (0.75–0.8 μg/μl) doses or with vehicle. Doses of PE were titrated in preliminary experiments to induce a reflex bradycardia and a sustained increase in mean arterial pressure (MAP) that averaged 24.7 ± 1.1 mm Hg (moderate) or 43.6 ± 1.5 mm Hg (high). Infusions were performed at a constant rate of 10 μl/min for 25 min (i.e., moderate dose, 2.14 μg/kg/min; high dose, 2.85 μg/kg/min). A low infusion rate was used in an attempt to minimize mechanical stimulation of cardiac volume receptors, as well as fluid loading (Hainsworth, 1991), whereas the duration was chosen to provide a sufficiently salient stimulus to evoke comparablec-fos mRNA and protein responses (cf. Chan and Sawchenko, 1994). Experiments were performed in two separate groups of conscious, freely moving rats (high dose, n = 19 with 3–6/time point; moderate dose, n = 20 with 3–7/time point) housed individually in their home cages between 8:30 and 10:30 A.M. Animals were killed at 0.5, 1, 2, 3, or 4 hr after infusion to permit analysis of temporal and spatial changes in c-fos expression in the medulla. Control animals (n = 11) received similar manipulations and infusions (saline) before perfusion. Animals were submitted to the experiment in groups of three, in which both experimental and control groups were represented. All protocols were approved by the Institutional Animal Care and Use Committee.
Retrograde-tracing studies. To identify PE-responsive neurons in CVLM that project to RVLM, we anesthetized animals with a ketamine, xylazine, and acepromazine mix (25:5:1 mg/kg, s.c.), and animals received iontophoretic deposits of the retrogradely transported fluorescent tracer Fluorogold (2% in saline) (Schmued and Fallon, 1986). The calamus scriptorius, defined as the caudal-most tip of the area postrema (Ross et al., 1985), was exposed after retraction of the atlanto-occipital membrane and served as a reference landmark. Deposits were placed stereotaxically in the rostral aspect of the RVLM (n = 6/PE dose) at a site identified as one at which pressure injection (Pneumatic Picopump; WPI) of l-glutamate (injection volume, 12–24 nl; 0.1 m dissolved in 0.1m sodium phosphate buffer, pH 7.4) yielded pressor responses of >20 mm Hg (Benarroch et al., 1986). Coordinates used for tracer injection were 1.9–2.3 mm rostral to the calamus scriptorius, 1.93–1.94 mm lateral to the midline, and 2.94 mm ventral to the dorsal surface of the medulla. Fluorogold was deposited iontophoretically from glass micropipettes (10 μm inner diameter; Drummond) by passing 2.5 μA of anodal current for 20–25 min (50% duty cycle) using a constant current device (Transkinetics).
To allow concurrent localization of a retrograde tracer with Fos-IR and mRNAs encoding transmitter-related proteins, we pressure injected 10 nl of colloidal gold-labeled wheat germ agglutinin–horseradish peroxidase complex (WGA-ApoHRP-Gold; 0.5–1%; EY Laboratories) (Basbaum and Menétrey, 1987) into pressor sites in rostral RVLM (n = 5–6/dose) via a thick wall glass micropipette. Silver intensification of WGA-ApoHRP-Gold allowed the retrograde signals to persist throughout the hybridization protocol. Tracer deposits in regions of the lateral medullary reticular formation outside the pressor zone of the RVLM served as controls.
To identify vagal motor neurons, we injected 500–700 nl of 5% true blue (Dr. Illing GmbH & Co.) suspension in sterile distilled water beneath the epineurium of the cervical vagus nerve using a microliter syringe (n = 3/dose). Tissue immediately surrounding the injection site was carefully cleaned to remove any leached tracer. Animals were allowed to survive for 7 (WGA-ApoHRP-Gold and true blue) days or 14 (Fluorogold) days before PE challenge and were perfused 2 hr later, the time at which maximal Fos expression was observed.
Hemodynamic measurements. PE effects on arterial pressure and heart rate were monitored in separate groups of conscious animals (n = 4/dose) implanted 48 hr earlier with femoral arterial (polyethylene-50 tubing) and jugular catheters (see above) and subjected to PE or vehicle infusions as described above. MAP was calculated as: 1/3 systolic + 2/3 diastolic pressure. Baroreflex sensitivity over the course of PE-induced hypertension was determined as the ratio of the change in heart rate to the change in MAP. Shifting of the arterial pressure–heart rate curve is generally taken as an index of baroreflex resetting (Chapleau et al., 1988).
Histology. After treatment followed by their respective survival intervals, rats were deeply anesthetized with chloral hydrate (35 mg/kg, i.p.) and perfused via the ascending aorta with saline followed by 500–700 ml of ice-cold 4% paraformaldehyde in 0.1m borate buffer, pH 9.5, at 10°C. Brains were post-fixed for 4 hr and cryoprotected in 20% sucrose in 0.1 mphosphate buffer overnight at 4°C. Frozen sections were cut in the coronal plane at 20 μm with a sliding microtome. Six one-in-six series through the medulla were collected in cold cryoprotectant (Chan and Sawchenko, 1994) and stored at −20°C until final group sizes were achieved for histochemical analysis. This enabled all materials from animals the data of which were to be compared to be processed in tandem, using common batches of immunological and molecular probes.
Immunohistochemistry. Sections collected from all challenged animals were processed for immunohistochemical detection of Fos-IR using a polyclonal antiserum raised against a synthetic N-terminal fragment of human Fos (residues 3–16; Santa Cruz Biotechnology, Santa Cruz, CA), at a dilution of 1:4000. Localization was achieved using a conventional nickel-enhanced avidin–biotin immunoperoxidase protocol described previously (Chan and Sawchenko, 1994). The specificity of immunostaining for Fos was verified by preabsorption controls (50 μm overnight at 4°C) and by substitution of normal for immune sera; in neither case did this result in discriminable staining in any brainstem cell group of PE-treated animals.
The distribution of Fos-positive nuclei was plotted onto drawings prepared from an adjoining series of Nissl-stained sections using a scanning system coupled to a Macintosh computer. The number of Fos-IR nuclear profiles within the confines of cell groups of interest was counted under 250× magnification in complete series of sections; estimates were corrected for double-counting errors (Abercrombie, 1946). The distribution of barosensitive Fos-IR cells in the CVLM region was plotted with reference to the rostrocaudal distance from the level of the calamus scriptorius.
The tracer placements in the RVLM were verified by counterstaining sections from injected animals for phenylethanolamineN-methyltransferase (PNMT, a marker for adrenergic neurons) by indirect immunofluorescence, using a rabbit polyclonal antiserum raised against rat adrenal PNMT (1:1000 dilution) and kindly supplied by Dr. M. C. Bohn (see Cunningham et al., 1990). The position of deposits relative to PNMT-IR C1 neurons was evaluated by fluorescence (Fluorogold) or polarized epifluorescence (silver-intensified WGA-ApoHRP-Gold) microscopy.
Choline acetyltransferase (CAT)-IR vagal motor neurons and catecholaminergic neurons in the VLM were identified using a goat polyclonal antiserum raised against human placental CAT (1:4000 dilution; Chemicon, Temecula, CA) and a rabbit polyclonal antiserum raised against purified rat adrenal tyrosine hydroxylase (TH; 1:2000 dilution; Pel-Freeze Biologicals, Rogers, AR), respectively. Detection was achieved using the immunoperoxidase protocol. The specificity of the antisera has been described previously (Shiromani et al., 1990;Chan and Sawchenko, 1995a).
In situ histochemical hybridization. Hybridization histochemical localization was performed using antisense35S-labeled cRNA probes. Protocols for riboprobe synthesis, hybridization, and autoradiographic localization of mRNA signal were adapted from Simmons et al. (1989). After immunoperoxidase staining, tissue sections were mounted onto poly-l-lysine-coated slides, desiccated under vacuum overnight, fixed, digested by proteinase K, acetylated, and dehydrated (Chan and Sawchenko, 1994). After vacuum drying, 100 μl of hybridization mixture (107 cpm/ml; 50% formamide) was spotted on each slide, sealed under a coverslip, and incubated at 55°C overnight. Slides were treated with ribonuclease A and washed in 0.1× SSC for 30 min at 78–82°C. Sections were dehydrated, exposed to x-ray film (β-max; Amersham, Arlington Heights, IL) for 24 hr, defatted in xylenes, and dipped in NTB2 nuclear emulsion (diluted 1:1 with distilled water; Eastman Kodak, Rochester, NY). In colocalization experiments, dehydration steps were abbreviated to minimize dissolution of diaminobenzidine reaction product (Chan and Sawchenko, 1995a). Slides were exposed for 10–31 d and developed in D19 developer (Eastman Kodak) for 4 min at 14°C. All sections were processed in tandem for the in situ hybridization and autoradiographic procedures. Grain densities over cell-sized areas exceeding five times background levels were arbitrarily taken as representing positive hybridization signals (McCabe and Pfaff, 1989). Similarly labeled sense-strand runoffs were used as controls. No signal was detected after pretreatment of sections with ribonuclease or hybridization with labeled sense-strand probes.
cRNA probes. Antisense and sense (control) cRNA probes were generated from full-length cDNAs encoding c-fos (2.1 kb; Dr. T. Curran, St. Jude Children’s Hospital; see Morgan and Curran, 1991), NGFI-B (2.4 kb; Dr. J. Milbrandt, Washington University; Milbrandt, 1988), and GAD 65 and 67 (2.0 and 2.7 kb, respectively; Dr. A. J. Tobin, University of California, Los Angeles; Erlander et al., 1991) or from partial cDNA inserts for the glycine transporter GLYT-2 (3.1 kb; Dr. N. Nelson, Tel Aviv University; Liu et al., 1993), brain nitric oxide synthase (bNOS) (2.4 kb; Dr. S. H. Snyder, Johns Hopkins University; Bredt et al., 1991), TH (1.2 kb; Dr. J. Mallet, Centre National de la Recherche Scientifique; Grima et al., 1985), and CAT (2.3 kb; Dr. T. Deguchi, Toyko Metropolitan Institute for Neurosciences; Ishii et al., 1990). Antisense cRNA probes labeled with α-35S-UTP and -ATP (NEN) were synthesized using T3 (CAT; NGFI-B; NOS; TH) or T7 (c-fos; GAD 65; GAD 67; GLYT-2) RNA polymerases after linearization of the plasmids (pBluescript SK+) with appropriate restriction enzymes. Unincorporated nucleotides were removed by Quick Spin columns (Boehringer Mannheim, Indianapolis, IN). The specific activities of the probes were approximately 2.3–3 × 10⁹cpm/μg. Using antisense riboprobes synthesized with two radiolabeled nucleotides (35S-UTP and -ATP) greatly improved the sensitivity of hybridization histochemical detection of lower abundance transcripts (Petersen and McCrone, 1994).
Dual labeling. Dual-labeling experiments were performed to establish the neurochemical specificity and/or connectivity of barosensitive (i.e., Fos-IR) neurons. To identify neurotransmitter-related molecules expressed by barosensitive neurons, we coupled avidin-biotin immunoperoxidase localization of Fos either with hybridization histochemical detection of GAD, GLYT-2, TH, or NOS mRNAs or with NADPH diaphorase histochemistry. To determine the extent to which PE-sensitive neurons project to the RVLM, we coupled immunoperoxidase localization of Fos with fluorescence detection of retrogradely transported Fluorogold in material from animals bearing tracer deposits at pressor sites in the RVLM. To probe the topographic relationship between catecholaminergic and GABAergic neurons in the VLM, we combined immunoperoxidase localization of TH with hybridization histochemical detection of GAD mRNAs.
In an attempt to identify any vagal motor neurons targeted by the baroreceptor stimuli, we coupled immunoperoxidase localization of Fos with hybridization detection of CAT mRNA or with fluorescence detection of retrogradely transported true blue after injection into the cervical vagus at the level of the nodose ganglion. Because we failed to detect PE-induced Fos-IR in the expected complement of vagal motor neurons, immunoperoxidase localization of CAT was also coupled with hybridization detection of mRNA encoding a second, independent IEG marker, NGFI-B. NGFI-B is an orphan steroid hormone receptor (Milbrandt, 1988) that has been used as an alternative or adjunct toc-fos in marking activated neurons in brainstem cardiovascular control circuitry (Chan et al., 1993) and has identified sites of situation-specific cellular activation that escaped detection using c-fos expression as a marker (Ericsson et al., 1995).
Dual localization experiments were performed in material from animals killed at the times of maximal c-fos induction, that is, at 1 hr after the challenge for c-fos mRNA and at 2 hr for Fos protein. In all dual-labeling experiments, immunostaining was performed first, and with the exception of experiments involving fluorescent tracers (Fluorogold or true blue), nickel enhancement steps were not used. For combined immuno- and hybridization histochemical localization, the immunostaining methods were modified to avoid RNase contamination and leaching of reaction product (Watts and Swanson, 1989). These modifications essentially included omission of tissue pretreatments with hydrogen peroxide and sodium borohydride, as well as substitution of 2% bovine serum albumin and 5% heparin sulfate for blocking sera. For NADPH diaphorase histochemistry, sections were incubated in 0.1 m Tris-HCl, pH 8.0, containing 0.3% Triton, nitroblue tetrazolium (0.25 mg/ml dissolved in 100 μl/mg of DMSO), and β-NADPH (1 mg/ml) at 37°C for 30–60 min (Vincent and Kimura, 1992) and then were immunolabeled for nuclear Fos. The number of doubly-labeled Fos-IR cells in all animals of a given treatment group was counted visually under 400× magnification in complete series of coronal sections through cell groups of interest and corrected for double-counting errors.
Combined retrograde transport (WGA-ApoHRP-Gold), immunohistochemistry (Fos), and hybridization histochemistry (GAD and GLYT-2 mRNAs) using color microautoradiography. Animals bearing WGA-ApoHRP-Gold deposits in the RVLM were challenged with PE, as described, and killed 2 hr later. Avidin–biotin immunoperoxidase localization of PE-induced Fos was performed first, followed by silver enhancement of colloidal gold-based retrograde signal (Basbaum and Menétrey, 1987) and then hybridization histochemistry. For silver intensification, sections were rinsed in distilled water for 10 min and developed in the IntenSEM kit (Amersham) for 15–25 min. After development, sections were rinsed in distilled water and then in KPBS for 10 min before mounting onto poly-l-lysine-coated slides.
In situ hybridization detection of GAD and GLYT-2 mRNAs was performed with antisense 35S-labeled cRNA probes as described above. After posthybridization, sections were briefly dehydrated (three to five rapid dips), exposed to x-ray film for 24 hr, defatted in xylenes, coated with 3% pyroxylin in ethyl acetate (Polysciences, Warrington, PA), and dipped in NBT2 nuclear emulsion (diluted 1:1 with distilled water; Eastman Kodak). After exposure times of 10 (GLYT-2) days to 31 (GAD 65 and 67) days, the emulsion was developed, bleached, and coupled to a magenta dye that allowed reduced silver indicative of a hybridization signal (purple) to be distinguished from the signal that was representative of colloidal gold-labeled retrograde tracer (black). The methodology for color microautoradiography was adapted from Haase et al. (1985). All procedures before development were performed in a darkroom under safelight conditions (Wratten filter 2). In brief, slides were developed in D19 developer (Eastman Kodak) for 4 min at 14°C. Emulsion was stabilized by cross-linking in 0.37% formalin buffered with photographic grade 0.6% sodium carbonate for 3 min. The slides were then washed in distilled water for 2 min, bleached in a solution of 10% potassium ferrocyanide and 5% potassium bromide (photographic grade; Sigma) for 1 min, washed again in distilled water for 2 min, and developed in freshly prepared dye coupler for 1 min. The dye coupler was prepared by mixing color developer and magenta dye coupler solution in a ratio of 9:1 (v/v) immediately before use. The color developer contained 0.22% CD2 (4-N,N-diethyl-2-methylphenylenediamine monohydrochloride; Acros), 0.22% sodium sulfite (photographic grade; Sigma), 0.11% potassium bromide, and 2.22% sodium carbonate in distilled water. The magenta dye coupler solution contained 2% M-38 [1-(2,4,6-trichlorophenyl)−3-(p-nitroanilino)−2-pyrazolin-5-one; Acros] and 0.2N sodium hydroxide in absolute ethanol. After color development, the slides were washed in distilled water for 2 min, bleached in 10% potassium ferricyanide and 5% potassium bromide for 1 min, washed again in distilled water for 2 min, and fixed in 15% sodium sulfite solution and 24% sodium thiosulfate (photographic grade; Sigma) for 5 min. The slides were air-dried briefly, coverslipped in buffered glycerol (50% glycerin in 0.4 mpotassium bicarbonate, pH 8.6), and stored at −20°C.
Statistics. Data presented are mean ± SEM. A one-way ANOVA followed by the Dunn’s test (StatView 4.0) was used to compare MAP changes between treatments. In all analyses, a probability ofp < 0.05 was taken to be statistically significant.
RESULTS
Phenylephrine-induced changes in cardiovascular parameters
We sought to identify PE treatment parameters that would yield a sustained hypertension that would provoke comparable c-fosmRNA and protein induction at key points along the baroreflex pathway, to permit characterization of Fos-IR neurons while not seriously compromising the discreteness of the activation pattern seen in response to bolus infusions (cf. Chan and Sawchenko, 1994). Continuous (25 min) infusion of PE at doses of 2.14 and 2.85 μg/kg/min induced a sustained increase in MAP that averaged 24.7 ± 1.1 mm Hg (+25.8% from the baseline MAP, 95.6 ± 2.8 mm Hg) and 43.6 ± 1.5 mm Hg (+45.6%), respectively (Fig. 1). These responses differed significantly from controls (p < 0.005) and from one another (p < 0.01). The elevation in arterial pressure was also accompanied by a pronounced bradycardia, the magnitude of which decreased over the course of hypertension. This gradual reduction in the bradycardiac response was reflected in a decreased Δ heart rate (HR)/Δ MAP ratio and may indicate resetting of baroreceptor sensitivity in response to sustained hypertension (Chapleau et al., 1988).
Fig. 1.

Phenylephrine-induced changes in cardiovascular parameters. Time course of changes in the MAP (top) and the baroreflex index (Δ heart rate/Δ MAP) (bottom) induced by sustained intravenous infusion of PE. Data are presented as mean ± SEM; n = 4/dose. PE-induced hypertensive responses differed significantly from controls (***p < 0.005) and from one another (++p < 0.01 compared with the moderate dose). Thesolid bar below the curves represents the 25 min duration of drug or vehicle infusion. The pronounced changes in baroreflex indices are assumed to be indicative of rapid resetting of baroreceptor sensitivity in response to a conditioning pressure ramp.
Temporal and spatial patterns of PE-induced c-fosexpression in the medulla
In material from control rats, which received prolonged saline infusion, Fos-IR or c-fos mRNA signals were only sporadically encountered in the NTS and ventrolateral medullary reticular formation. The few positively labeled cells that were detected displayed no suggestion of any preferential regional distribution or consistent pattern from section to section, within or between subjects. Although the basal level of Fos-IR in barosensitive regions of the medulla is low, some degree of constitutivec-fos expression was displayed consistently in the spinal trigeminal and lateral reticular nuclei of control, as well as nonmanipulated, animals.
In contrast to the acute hypertensive model used previously (Chan and Sawchenko, 1994), sustained PE-induced hypertension provokedc-fos mRNA and Fos protein expressions that were comparable in strength and distribution in circumscribed regions of the medulla that are generally recognized as nodal points in baroreflex control circuitry (Figs. 2,3). Fos induction in animals receiving moderate or higher doses of PE followed similar time courses, with Fos-IR and c-fos mRNA first appearing within 0.5 hr, the earliest time point examined. Maximal expression of c-fosmRNA and Fos-IR were detected at 1 and 2 hr, respectively, after PE infusion (Figs. 2, 3). These abated gradually thereafter, and by 4 hr no consistent above-background immuno- or hybridization signals were detected.
Fig. 2.
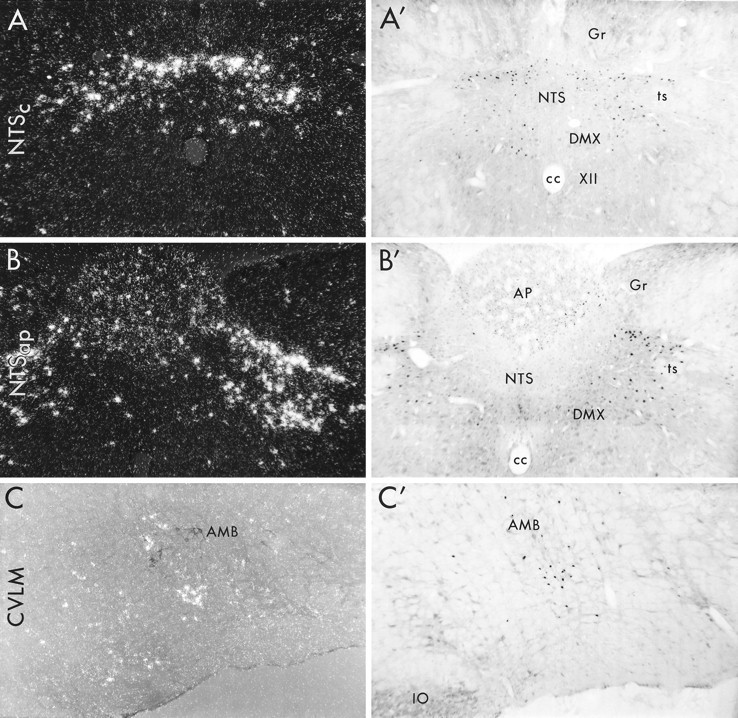
Medullary patterns of c-fos mRNA and Fos protein expression induced by prolonged PE infusion. Dark field (A, B) and bright field (A′, B′, C′) photomicrographs depicting hybridization and avidin–biotin immunoperoxidase localization of c-fos mRNA and Fos-IR in the NTS at the levels of the commissural subnucleus (NTSc; A,A′) and the area postrema (NTSap; B,B′) and in the CVLM (C,C′) at 1 and 2 hr after hypertensive challenge, respectively. C, Combined immuno- and hybridization histochemical detection of choline acetyltransferase-IR cells in the nucleus ambiguus (black cells) and PE-inducedc-fos mRNA (white silver grains), respectively, photographed using polarized epifluorescence illumination. In contrast to the acute infusion model, sustained hypertension resulted in comparable strengths and distributions ofc-fos mRNA and protein expression in each region. This includes robust induction in the dorsal baroreceptor strip of the commissural NTS (NTSc) that extended into the dorsal and dorsolateral aspects of NTS at the level of area postrema (NTSap). Noncatecholaminergic neurons of the CVLM region were also reliably activated.AMB, Nucleus ambiguus; AP, area postrema;cc, central canal; DMX, dorsal motor nucleus of vagus; Gr, gracile nucleus;IO, inferior olive; NTS, nucleus of solitary tract; ts, solitary tract; XII, hypoglossal nucleus. All photomicrographs, 75×.
Fig. 3.
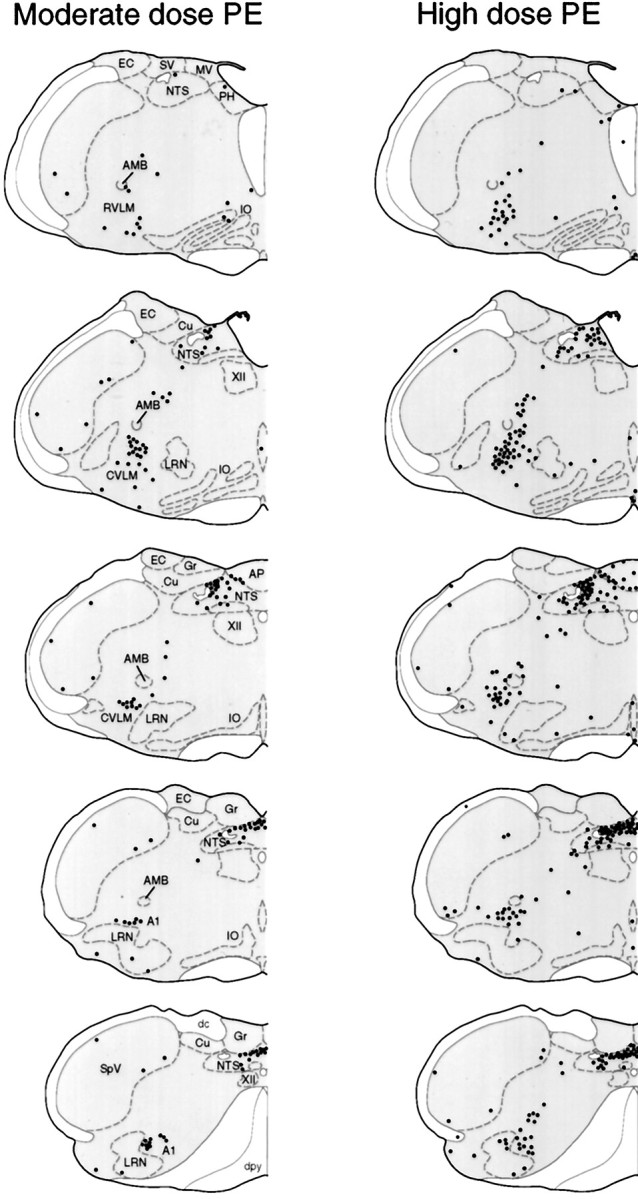
Dose-related patterns of PE-induced Fos-IR expression in medullary neurons. Line drawings of coronal sections through the medulla showing the distribution of Fos-IR nuclei (black dots) at 2 hr after hypertensive challenges induced by moderate (left) or higher (right) doses of PE. In addition to a dose-related increase in Fos-IR neurons in the baroreceptor strip of commissural NTS and the CVLM region, high dose PE also provoked a more-pronounced Fos induction in the medial subnucleus of NTS and in the lateral reticular nucleus and medullary raphe nuclei. A1, A1 noradrenergic cell group; AMB, nucleus ambiguus; AP, area postrema; Cu, cuneate nucleus; dc, dorsal column; dpy, pyramidal decussation;EC, external cuneate nucleus; Gr, gracile nucleus; IO, inferior olive; LRN, lateral reticular nucleus; MV, medial vestibular nucleus;NTS, nucleus of solitary tract; PH, prepositus nucleus; py, pyramidal tract;RVLM, rostral ventrolateral medulla;CVLM, caudal depressor region; SpV, spinal trigeminal nucleus; SV, spinal vestibular nucleus; XII, hypoglossal nucleus.
Descriptions of c-fos expression patterns are made with reference to cytoarchitectonic subdivisions described by Loewy and Burton (1978), Kalia and Sullivan (1982), and Altschuler et al. (1989)for the NTS, by Bieger and Hopkins (1987) for the nucleus ambiguus, and by Ruggiero et al. (1989) for the VLM. Nomenclature for medullary catecholaminergic cell groups follows Hökfelt et al. (1984). The following description pertains to c-fos expression patterns seen in response to the moderate-dose PE challenge.
Within the NTS, Fos-IR neurons were first detected in circumscribed regions of the commissural NTS at 1 hr, and their number and staining intensity peaked at 2 hr. In response to the moderate PE dose, the total NTS population was estimated at 977 ± 178 neurons in six animals killed at the 2 hr time point. At levels caudal to the apex of the calamus scriptorius, the principal grouping of responsive neurons comprised a horizontal strip at the dorsal margin of the commissural part of the NTS (NTSc). This was rostrally contiguous with a bilaterally symmetric, obliquely oriented array that extended into the dorsal and dorsolateral subnuclei of the NTS, partially enwrapping medial aspects of the solitary tract at the level of the area postrema (NTSap) (Figs. 2, 3). The zone of maximal labeling extended approximately from 120 μm caudal to the level of calamus scriptorius through the rostral-most extent of the area postrema. Secondary accumulations of cells displaying PE-induced Fos-IR or c-fosmRNA were seen reliably in the medial subnucleus of the NTS, which was rostrocaudally coextensive with induction in the baroreceptor strip regions highlighted above. In addition, scattered activated neurons were detected in the dorsal motor nucleus of the vagus and in a discontinuous ring of cells at the ventral and ventrolateral margins of the area postrema (Figs. 2, 3). The number of NTS neurons exhibiting PE-induced c-fos expression tapered sharply at levels rostral to that of the area postrema, and the lateral division of the NTS complex contained few activated neurons throughout its rostrocaudal extent.
In VLM, the bulk of Fos-IR cells (822 ± 122; n = 6) were distributed primarily between the level of the calamus scriptorius to the midextent of the RVLM, spanning a length of ∼1.3–1.4 mm from the apex of the calamus scriptorius and lying immediately subjacent to the principal column of the ambiguual complex (Figs. 2, 3). Although these responsive cells were intermingled extensively with aminergic neurons of the A1 and C1 cell groups, Fos-IR cells in the CVLM region were overwhelmingly nonaminergic, were noncholinergic (Fig. 2C), and were not retrogradely labeled after tracer deposits in the cervical vagus nerve (data not shown), indicating this PE-activated cell column to be distinct from functionally allied catecholaminergic cell groups and from vagal cardiomotor neurons in the ambiguual complex. It is noteworthy that relatively few Fos-IR neurons were encountered caudal to the level of the calamus scriptorius, in the so-called caudal subdivision of the CVLM that is believed not to play a major role in mediating baroreflex responses (Cravo et al., 1991). At the time of maximal expression, some scattered Fos-IR cells were also detected along the transtegmental tract extending between the NTS and VLM. At the rostral extreme of the RVLM, in proximity to the facial motor nucleus, Fos-IR cells were extremely sparse. The moderate-dose PE challenge failed to evoke reliable c-fos expression in other medullary regions.
Dose response
The higher dose of PE provoked substantially more extensivec-fos expression in the dorsal commissural strip of NTSc; the dorsal subnucleus of the NTSap; the area postrema, proper; the lateral tegmental field; and the CVLM region (Fig. 3). The total number of Fos-IR cells counted in the NTS (2416 ± 373) and VLM (2433 ± 297) were elevated 2.5- and 3-fold, respectively, over values obtained from a comparable sampling of animals treated with the moderate PE dose (n = 6; animals killed 2 hr after infusion). The most-pronounced increment of Fos-IR cells was seen in the medial subnucleus of NTSap, in which the labeling extended to include somewhat more rostral aspects of NTS (Fig.3). Also evident in these animals was an increase in the small number of cells constitutively expressing Fos-IR in the lateral reticular and spinal trigeminal nuclei and novel, although minor, sites of induction in the medial aspects of the gigantocellular reticular nucleus and in the aspects of the nucleus raphe pallidus.
Phenotypes and connectivities of activated neurons
Neurons activated in response to PE-induced hypertension were characterized by the labeling for nuclear Fos-IR combining with that of markers for major inhibitory neurotransmitter systems, the gaseous free radical neurotransmitter nitric oxide, and catecholaminergic neurons, which comprise important relays for conveying sensory information from the cardiovascular system to neuroendocrine and autonomic effectors (Chan and Sawchenko, 1994). Additional groups of animals received injections of the retrograde tracer Fluorogold into pressor sites of the RVLM before being subjected to a PE challenge and subsequent processing for concurrent demonstration of transported tracer and stimulated Fos-IR.
Tracer deposits in these experiments were 0.8–1.0 mm in diameter and were centered 0.36–0.54 mm caudal to the caudal pole of the facial motor nucleus, medial to the compact formation of nucleus ambiguus near the level of its maximal development, and extended from the base of the brain to, but not beyond, the principal column of the ambiguual complex. These gave rise to patterns of retrograde labeling in the medulla that were comparable with those reported previously using similar approaches (e.g., Ross et al., 1985; Badoer et al., 1994). Thus, labeled perikarya in the NTS were concentrated in the caudal two-thirds of the medial subnucleus. Retrograde labeling in the baroreceptor strip region was sparse caudal to the level of the calamus scriptorius and more pronounced rostrally in the dorsal subnucleus at the level of the area postrema. In the ventrolateral medulla, labeled cells principally comprised a tight, obliquely oriented column extending toward the ambiguual complex, which was rostrocaudally coextensive and overlapping in its ventral aspects with the distribution of PE-stimulated Fos-IR. Throughout the medulla, retrogradely labeled cells were distributed bilaterally with a strong ipsilateral preponderance. Tracer deposits placed outside the pressor zone of the RVLM resulted in a pronounced diminution in retrograde labeling of barosensitive neurons in the CVLM. Possible uptake of Fluorogold by fibers of passage cannot be excluded, but we saw no evidence to indicate that this may have been pervasive. For example, deposits in the RVLM region that impinged on internal arcuate fibers consistently failed to result in retrograde labeling in the dorsal column nuclei.
GABA
Multiple localization studies were performed to determine the extent to which PE-responsive neurons in the medulla might express major inhibitory neurotransmitters (GABA and glycine) and/or project to pressor regions of the RVLM. For GABAergic neurons, the expression patterns of mRNAs encoding both glutamic acid decarboxylase isoforms (GAD 65 and 67) (Erlander and Tobin, 1991; Esclapez et al., 1994) were analyzed (see Fig. 5). In control animals, GAD 67 mRNAs were found to be ubiquitously expressed in all major divisions of the NTS and in the area postrema. In recognized subdivisions of the caudal NTS, neurons displaying GAD 67 mRNA signals were most abundant in the medial and interstitial subnuclei, moderate to scattered in the dorsal and commissural subnuclei (including the baroreceptor strip region), and very sparse in the subpostrema region and in the dorsal motor nucleus of the vagus, a pattern consistent with the distribution of GAD-IR (Blessing et al., 1984; Meeley et al., 1985) or GABA-IR perikarya (Maley and Newton, 1985; Izzo et al., 1992). Numerous cells exhibiting hybridization signals for GAD 67 mRNA were also detected throughout the medullary reticular formation, including the CVLM and RVLM. The topography of cells labeled for GAD 67 mRNA is similar to that described based on immunolocalization of GAD in the medulla of colchicine-treated animals (Meeley et al., 1985; Ruggiero et al., 1985). Transcripts encoding the GAD 65 isoform were similarly, although considerably less robustly, expressed when hybridized in material from the same brains, using probes of comparable size, GC content, and specific activity (data not shown). Similar disparities in the relative level of constitutive expression of these isoforms have been reported in other regions of the brain (Esclapez et al., 1994).
Fig. 5.
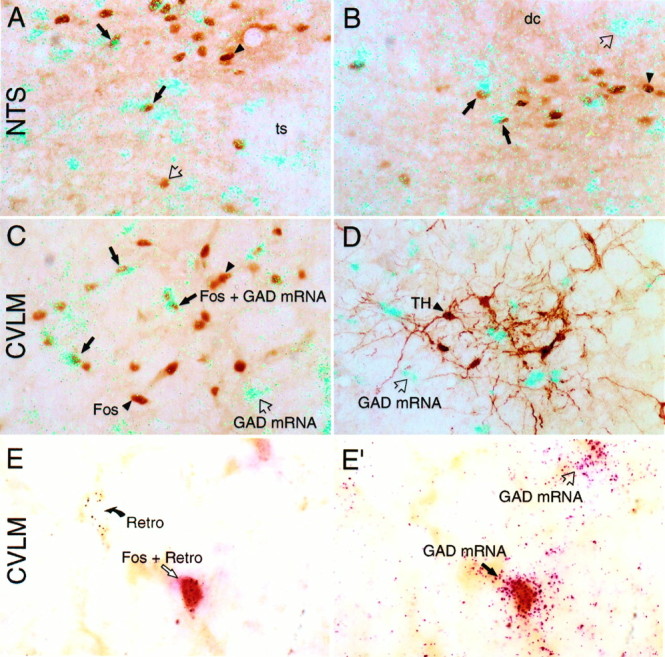
PE-induced Fos-IR in medullary GABAergic neurons.A–D, Polarized epifluorescence images showing GAD 67 mRNA signal (aqua grains) and peroxidase staining for Fos-IR (brown nuclei; A–C) or TH-IR (brown cytoplasm; D) in the NTSap (A), in the commissural NTS (B), and in the CVLM region (C,D). Despite robust expression of GAD in the NTS, only a small subset of neurons in the baroreceptor strip that displayed Fos-IR in response to a moderate PE dose colabeled for GAD mRNA (A, B). By contrast, a substantial fraction of Fos-IR barosensitive neurons in the CVLM region displayed GAD transcripts (C). Very few TH-IR neurons in the CVLM region displayed GAD transcripts (D).Black arrows denote examples of doubly-labeled neurons,open arrows denote cells displaying GAD mRNA only, andarrowheads indicate cells labeled only for Fos-IR (A–C) or TH-IR (D).E, E′, Barosensitive GABAergic neurons projecting to the RVLM; bright-field images of a single field in the CVLM taken at two focal planes to show PE-induced Fos-IR (brown nuclei), silver-enhanced retrograde labeling after WGA-ApoHRP-Gold injection in the RVLM (Retro;black grains; E), and hybridization signals for GAD 67 mRNA (magenta grains;E′). The neuron at the bottom right ofE and E′ displays all three markers. The cell at the left center of E is retrogradely labeled only, whereas the one to the upper right of E′ is positive only for GAD mRNA.dc, Dorsal column; ts, solitary tract. Magnifications: A–D, 150×; E,E′, 375×.
Despite the widespread expression of GAD in the NTS, only 19.0 ± 1.1 and 15.8 ± 1.8% of neurons in the baroreceptor strip that displayed Fos-IR colabeled for GAD mRNA in response to moderate and higher dose PE challenges, respectively (Figs. 4,5) A greater degree (moderate dose, 45.3 ± 6.0%; high dose, 34.5 ± 2.8%) of colocalization was encountered in the medial subnucleus (Figs. 4, 5), although the bulk of these neurons was not retrogradely labeled from RVLM at either dose of PE. The handful of RVLM-projecting neurons that exhibited PE-induced Fos-IR in the medial subnucleus of NTSap did not display detectable GAD mRNA signals. By contrast, a substantial fraction (moderate dose, 65.5 ± 3.1%; high dose, 49.3 ± 2.6%) of Fos-IR barosensitive neurons in the CVLM region displayed GAD transcripts (Figs. 5,6). Doubly-labeled cells were distributed uniformly throughout the longitudinal extent of the Fos-IR column. The higher dose of PE resulted in only a moderate increase in the absolute number of Fos-positive neurons displaying GAD mRNA in the CVLM, which, in the face of a more-pronounced increment in the number of Fos-IR cells, yielded a consistent reduction in the proportion of barosensitive neurons colabeled for GAD (Fig. 6). This is presumably a consequence of recruitment to Fos expression of nonintegral components of baroreflex pathways, such as nearby catecholamine-containing neurons (see below), in response to more severe hypertensive episodes.
Fig. 4.

Phenotypic characterization of PE-sensitive neurons in NTS. Top, Schematic drawings of the NTS depicting the subregions in which PE-induced Fos-IR neurons were characterized. These include the dorsal aspect of the commissural division (I) at caudal levels (NTSc; left), the dorsal and dorsolateral subnuclei (II) at the level of the area postrema (NTSap;right), and the medial subnucleus (III) at both levels. Bottom, Comparison of the proportion of Fos-IR neurons within these aspects of the NTS that were colabeled for GAD or GLYT-2 mRNAs, TH-IR, or a retrograde tracer (Fluorogold) after deposits in the RVLM. Data from animals treated with moderate or higher doses of PE are given.AP, Area postrema; cc, central canal;Cu, cuneate nucleus; DMX, dorsal motor nucleus of vagus; Gr, gracile nucleus;NTS, nucleus of solitary tract; ts, solitary tract; XII, hypoglossal nucleus.
Fig. 6.
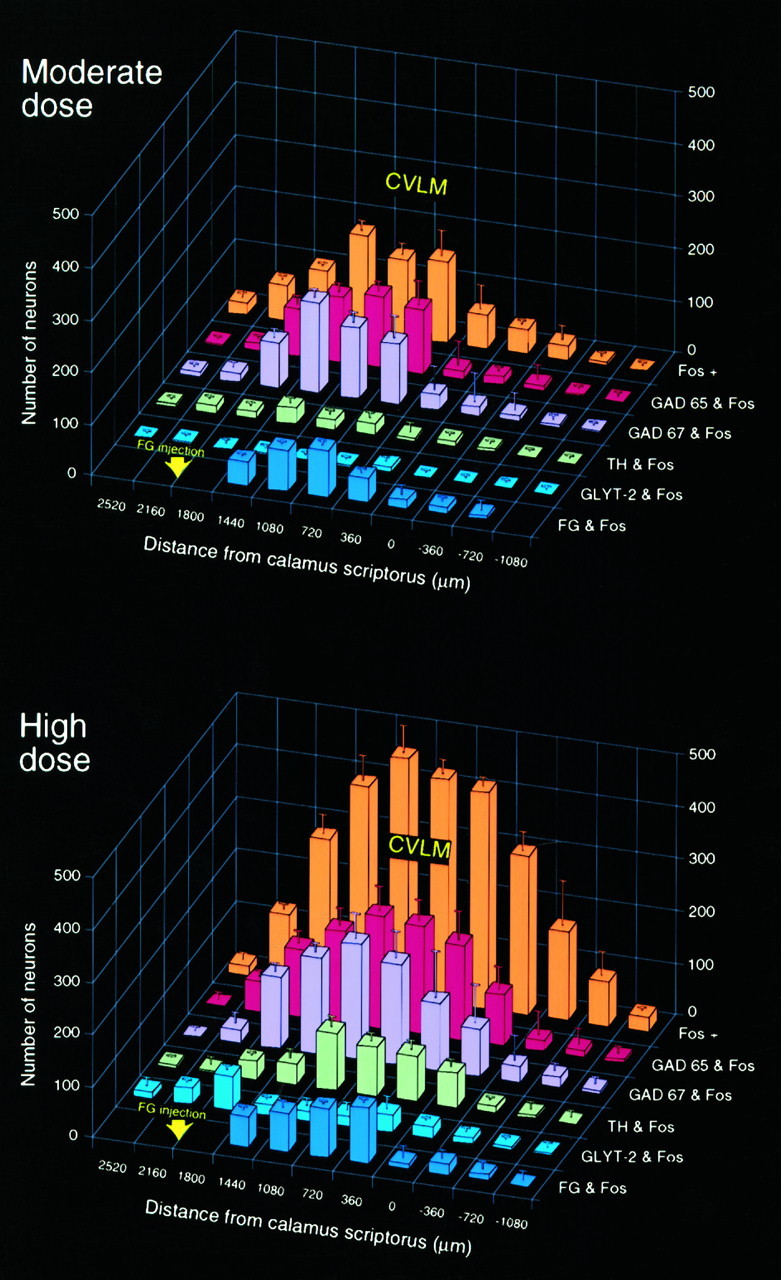
Anatomic and phenotypic characterization of PE-sensitive neurons of the VLM. A, B, Three-dimensional histograms showing the number of barosensitive (Fos-IR) neurons seen in response to moderate (A) and higher (B) doses of PE at regular intervals through the medulla (orange columns) and the number colabeled for GAD or GLYT-2 mRNAs, TH-IR, or a retrograde tracer (FG) after deposits in the RVLM at the level indicated. Data are presented as mean ± SEM; n = 6–7/dose. Both PE doses induced c-fos expression concentrated between the level of the calamus scriptorius and that of the caudal aspect of the RVLM. In material from animals treated with a moderate PE dose, Fos-IR neurons were found to be predominantly GABAergic, with a majority projecting to the RVLM. A higher dose of PE gave rise to more robust Fos expression; a diminished proportion of these colabeled for GAD mRNA or the retrograde tracer, and an increased fraction displayed the catecholaminergic phenotype.
Material from rats bearing Fluorogold deposits in the RVLM displayed retrograde labeling of Fos-IR neurons throughout the longitudinal extent of the PE-sensitive column of the CVLM. The relative abundance of these covaried in the rostrocaudal dimension with the barosensitive GAD-expressing population, although their absolute values were lower (Fig. 6). To determine whether the activated GAD-expressing and RVLM-projecting populations overlap, we prepared rats bearing WGA-ApoHRP-Gold deposits in pressor regions of the RVLM and killed them 2 hr after a PE challenge for concurrent visualization of PE-induced Fos-IR, silver-intensified tracer, and GAD mRNA, the latter using color microautoradiography to facilitate discrimination of silver grains indicative of retrograde tracer from hybridization signals for GAD transcripts. Examples of triply-labeled cells (Fig.5E,E′) were very prominent within the ipsilateral CVLM and distributed uniformly throughout the core of the PE-responsive population. Fewer were seen along the transtegmental tract extending dorsomedially toward the NTS, and only occasional examples were detected in the contralateral CVLM. Because of the clear decrement in the sensitivity of the constituent methods in such combined applications, no attempt was made to extract quantitative information from this material.
Glycine
Because a common pathway for glycine biosynthesis is shared by cells that do and do not use this amino acid as a neurotransmitter, its biosynthetic enzyme is not a useful phenotypic marker. The neuron-specific glycine transporter GLYT-2 (Liu et al., 1993, Adams et al., 1995), which serves to terminate synaptic transmission via a reuptake mechanism (Clark and Amara, 1993), has provided a useful means of localizing glycinergic neurons.
In the medulla of control animals, neurons expressing GLYT-2 mRNA were much less abundant than were those hybridized for GAD mRNA, most notably in the NTS, in which the majority of GLYT-2-positive neurons were concentrated in the lateral division of the nucleus (Fig. 4). The few positively hybridized neurons detected in the medial division were confined principally to the interstitial and dorsal subnuclei (Fig. 4). A far greater number of neurons expressing the transporter was seen in the medullary reticular formation, including the CVLM and RVLM, the distribution of which primarily mirrored that of cells expressing GAD mRNAs but was less dense. The topography of cells displaying positive hybridization signals for GLYT-2 mRNA is consistent with the distribution of glycine-IR perikarya reported in the medulla of noncolchicine-treated animals (Pourcho et al., 1992; Fort et al., 1993). In keeping with the paucity of GLYT-2-expressing neurons in the NTS, examples of dual localization of PE-induced Fos-IR and GLYT-2 mRNA (0.8–4.0%) were extremely limited throughout the medulla (Fig. 6). A somewhat higher degree (moderate dose, 7.2 ± 2.2%; higher dose, 9.1 ± 3.0%) of dual labeling was encountered at the rostral end of the CVLM region (data not shown), and a small fraction of these cells was retrogradely labeled after tracer deposits in the RVLM.
Nitric oxide
Neurons exhibiting the NO phenotype were detected by NADPH diaphorase histochemistry and hybridization for mRNA encoding bNOS, which catalyzes NO production from l-arginine (Dawson et al., 1991; Hope et al., 1991). In the NTS, NADPH- and bNOS-positive neurons displayed indistinguishable distribution patterns (Fig. 7). At caudal levels, positive labeling for both markers was encountered in the dorsal aspect of the commissural NTS, in the dorsal subnucleus (with a distribution similar to that of PE-induced Fos-IR), in interstitial and medial aspects of NTSap, and sporadically in the subpostrema region. A few weakly labeled cells were occasionally encountered in the area postrema, proper. At rostral levels, robustly labeled cell clusters were distributed in the central subnucleus and in medial and ventral aspects of the NTS and were scattered throughout the dorsal motor nucleus. Labeling in the medullary reticular formation was considerably less dense than that obtained using probes for GAD or GLYT-2 mRNAs. The CVLM and RVLM contained no remarkable accumulations of positive neurons but were bordered, and sometimes invaded, by moderately dense clusters of NOS-positive cells associated with adjoining cell groups, such as the spinal trigeminal complex, the ambiguual complex, and more medial aspects of the reticular formation. The distribution of NADPH diaphorase staining and hybridization signals for NOS mRNA encountered in our material was similar to that of NOS-IR described in the medulla of noncolchicine-treated animals (Dun et al., 1994).
Fig. 7.

A subset of barosensitive NTS neurons display markers for the nitric oxide phenotype. Bright-field (right) and polarized epifluorescence (left) renderings showing peroxidase staining for Fos (brown nuclei) and either NADPH diaphorase activity (blue/black cytoplasm; left) or mRNA encoding nitric oxide synthase (aqua silver grains; right) in the dorsolateral part of NTS at the level of the area postrema (NTSap). Open arrows, Cells displaying NADPH diaphorase staining or NOS mRNA; filled arrowheads, Fos-IR nuclei; filled arrows, cells displaying both markers. PE-induced Fos-IR was frequently colocalized with markers for NO in the rostral baroreceptive region of the NTSap. Cu, Cuneate nucleus. Magnification, 150×.
Of particular interest was the finding that a substantial proportion of the PE-sensitive neurons in the strip region of the NTS displayed diaphorase activity or NOS mRNA. These were preferentially massed in the dorsal subnucleus of the NTSap, circumscribing the dorsomedial aspect of the solitary tract at this level (Fig.7), where a substantial majority of activated cells were NOS-positive. The proportion of Fos-IR cells exhibiting markers for the NO phenotype tapered progressively at levels caudal to that of the calamus scriptorius. In the dorsal and dorsolateral subnuclei of the NTSap, NOS mRNA signals were detected in over 49.1 ± 6.4 and 58.6 ± 4.4% of the Fos-IR neurons seen in response to a moderate and higher PE doses (Fig. 4). This pattern of double labeling conforms more closely with the terminal distribution of primary baroreceptor afferents carried by the aortic depressor, not the carotid sinus, nerve (Ciriello, 1983; Housley et al., 1987). A substantial fraction (37.8–48.3%) of Fos-IR cells in these regions was also retrogradely labeled from RVLM, and these displayed a topography similar to that of PE-activated, NOS-expressing neurons.
Only a very small fraction of Fos-IR neurons in the VLM displayed NADPH diaphorase activity or positive hybridization signals for NOS mRNA (both doses, 3.4–3.7%; Fig. 6), and those that did exhibited no distinctive topography. Few, if any, instances of colocalization were detected in other regions of the medulla at either dose of PE.
Tyrosine hydroxylase
Tyrosine hydroxylase, the rate-limiting enzyme in catecholamine biosynthesis, was used as a marker for noradrenergic and adrenergic cell groups in the medulla. In line with our previous findings that acute hypertension targets preferentially nonaminergic neurons in the medulla (Chan and Sawchenko, 1994), dual localization of Fos-IR and TH mRNA in the noradrenergic A1 (10.8 ± 1.6%) and A2 (0%) and the adrenergic C1 (13.7 ± 2.1%) and C2 (11.5 ± 3.9%) cell groups was relatively low at the moderate dose of PE. Although intermingled partly with the rostral noradrenergic A1 and the caudal adrenergic C1 neurons, the bulk of GABAergic barosensitive neurons in CVLM is situated dorsal to the aminergic cell groups and ventral to the ambiguual complex (Fig. 8). As has been described (Roland and Sawchenko, 1993), only small subpopulations of TH-IR neurons concurrently displaying GAD mRNA were encountered in the VLM (4.5–5.1%) and the NTS (2.9–3.6%). In contrast, a higher dose of PE gave rise to much more substantial fractions of the Fos-IR neurons displaying the aminergic phenotype in the NTS and VLM (A1, 23.1 ± 1.6%; A2, 1.0 ± 0.2%; C1, 30.0 ± 4.1%; C2, 19.9 ± 1.5%) (Figs. 6, 8).
Fig. 8.

Distribution of GABAergic and RVLM-projecting barosensitive neurons in VLM and their relationship to aminergic cell groups. A–F, Plots of the distribution of cells displaying PE-induced Fos-IR and GAD mRNA (filled circles) or retrogradely labeled after tracer deposits in pressor sites in the RVLM (crosses). The distribution of medullary aminergic (TH-IR) neurons in the same animal (open circles) is shown for comparison. The rostrocaudal distance from the level of the calamus scriptorius is indicated on the lower right-hand cornerof each panel. The results define a barosensitive CVLM region extending ∼1.3–1.4 mm rostrally from the level of the calamus scriptorius in which the bulk of PE-sensitive, RVLM-projecting, and/or GABAergic neurons are found. A1, A1 noradrenergic cell group; Amb, nucleus ambiguus; C1, C1 adrenergic cell group; dpy, pyramidal decussation;IO, inferior olive; LRN, lateral reticular nucleus; py, pyramidal tract;SpV, spinal trigeminal nucleus.
PE-induced Fos expression in vagal motor neurons
Although PE-induced hypertension was accompanied by a pronounced bradycardia, cholinergic neurons of the ambiguual complex that were retrogradely labeled from tracer injections in the cervical vagus nerve did not display detectable levels of c-fos mRNA or protein in any experiments (Fig. 2C). This includes cells of the external formation of the complex, the dominant seat of vagal cardiomotor neurons (Bieger and Hopkins, 1987). Use of an independent immediate-early gene marker, NGFI-B, also failed to provide evidence of PE-induced activation of ambiguual neurons in this region (data not shown). The somewhat surprising lack of a PE-stimulated activational response at this locus may be indicative of a relative insensitivity of IEGs to mark activation of motor neurons (see also Menétrey et al., 1989; Bullit, 1990; Wisden et al., 1990). Nonetheless, a few cells exhibiting PE-induced Fos-IR and CAT-IR or retrograde tracer were seen reliably in the dorsal motor nucleus of vagus, aspects of which have been implicated as participating in the chronotropic regulation of the heart (Nosaka et al., 1982; Izzo et al., 1993; Standish et al., 1995).
DISCUSSION
PE-induced expression of c-fos has permitted anatomical and neurochemical characterization of cell groups that, to a first approximation, may be considered the initial station in the central processing of primary baroreceptor input (NTS) and a principal relay through which the baroreceptor inhibition of sympathetic outflow is effected (CVLM). A topographically distinct group of PE-sensitive cells in the NTS displays markers for the NO phenotype, and in contrast to the remainder of the baroreceptor strip, a substantial fraction of these project to the RVLM. A more homogeneous arrangement was seen in the CVLM, where PE-activated neurons comprised a longitudinally organized column of GABAergic cells, many of which were identified as projecting to the RVLM (Fig. 9).
Fig. 9.

Summary of the organization of medullary baroreflex pathways. In the NTS, PE-induced Fos-IR is concentrated in a continuous strip (dark gray) occupying discrete aspects of the commissural and dorsal subnuclei at levels 1 and 2, respectively. We provide evidence here that a rostrally situated subset of barosensitive NTS neurons (level 2) projects directly to pressor sites in the RVLM (level 4) and/or expresses markers for the NO phenotype. Most barosensitive neurons of the NTS, however, do not project directly to the RVLM. The available evidence suggests that they come to influence sympathetic outflow indirectly, via one or more interneurons in the medial division of the NTS (light gray), which in turn projects to the CVLM (dashed lines). Based on criteria of phenotype and connectivity, we define the CVLM as a diffuse, longitudinally organized column of cells, maximally developed atlevel 3, and composed primarily of barosensitive neurons that are GABAergic neurons and project to the RVLM (thick black line). Drawings of sections through the medulla are modified from the atlas of Swanson (1992). AMB, Nucleus ambiguus;AP, area postrema; CVLM, caudal depressor region; NO, nitric oxide; NTS, nucleus of solitary tract; RVLM, rostral ventrolateral medulla;NTSap, NTS at the level of area postrema;NTSc, commissural NTS.
PE-induced hypertension as a baroreceptor activation model
PE is a vasoconstrictor agent that acts primarily on α1-adrenoceptors of peripheral vascular beds (Hieble et al., 1995), also stimulates baroreceptors directly (Kunze, 1981;Hirooka et al., 1992), and is widely used to assess arterial baroreflex function (e.g., Imaizumi et al., 1984; Morrison et al., 1988). In a previous study, bolus injections of PE provoked discretec-fos mRNA expression in the barorecipient zone of the NTS and in nonaminergic neurons of the CVLM, but this was not accompanied by correspondingly robust Fos protein expression (Chan and Sawchenko, 1994). Here, we have identified PE infusion parameters that reliably provoke concordant, and comparably discrete, c-fos mRNA and protein expression patterns throughout the brainstem, providing a basis for characterizing baroreflex pathways in conscious, freely moving rats. Similar challenge paradigms have been shown to induce Fos-IR expression in medullary regions pertinent to the orchestration of baroreflex responses (Badoer et al., 1994; Li and Dampney, 1994; Polson et al., 1995). Thus, the extent to which putative second-order NTS neurons exhibit IEG induction seems dependent on the duration, as well as the magnitude, of the conditioning pressure ramp. This may be attributed to the nonlinear responsiveness, and differential sensitivity, of NTS neurons to changes in arterial pressure (Rogers et al., 1993).
A higher PE dose gave rise to less circumscribed Fos induction patterns, notably including expanded involvement of the medial NTS, medullary raphe nuclei, and catecholaminergic neurons. Similar observations have been reported after electrical stimulation of baroreceptor nerves (Erickson and Millhorn, 1991; McKitrick et al., 1992; Rutherfurd et al., 1992) and sustained high PE doses (Badoer et al., 1994). This may reflect activation of nonintegral components of baroreflex circuitry, such as low-pressure receptors (Li and Dampney, 1994), neurons of the ventral respiratory group (Ellenberger et al., 1990), or spinally projecting medullary raphe neurons that may modulate baroreflex functions at the level of the sympathetic preganglionics (Spyer, 1994). Alternatively, higher doses of PE may recruit neurons involved in resetting of baroreceptor gain, which is reflected by a shift of the arterial pressure–heart rate curve over the course of sustained hypertension (Gonzales et al., 1983). Finally, the activation of medullary catecholamine neurons in response to more severe levels of PE-induced hypertension is somewhat paradoxical in view of the acknowledged involvement of these neurons in stimulating adaptive autonomic and neuroendocrine responses to hypotensivestimuli (see, e.g., Chan and Sawchenko, 1994; Li and Dampney, 1994). Only a very small subset of aminergic neurons was identified as displaying the GABA phenotype, arguing against any substantial overlap of the two populations of the VLM. It is worthy of mention that patients receiving inadvertent overdoses of PE show generalized stress symptoms (Fraunfelder and Scafidi, 1978), and the recruitment of medullary catecholamine neurons seen in response to strenuous, but not milder, PE challenges may help explain such observations. A subset of these innervates stress-related hypothalamic neurosecretory cell groups (Cunningham and Sawchenko, 1988; Cunningham et al., 1990), and distribution of aminergic neurons activated in the high-dose PE situation more closely approximates that of the hypothalamically projecting adrenergic population than it does that of the reticulospinal subset (Tucker et al., 1987). Overall, although the functional significance of the expanded distribution of IEG expression seen in response to higher doses of PE is unclear, these seem to involve nonessential components of the baroreflex pathway. As detailed below, the moderate dose more discretely activated cells in the barorecipient zone of the NTS and GABAergic column of the CVLM.
Organization and phenotype of medullary barosensitive neurons
Nucleus of the solitary tract
We identified a contiguous strip of barosensitive neurons situated in the dorsal part of the commissural NTS and extending rostrally into circumscribed aspects of the dorsal subnucleus that displayed robustc-fos expression in response to PE-induced hypertension and overlaps extensively with terminal fields of the carotid sinus (Housley et al., 1987) and aortic depressor nerves (Ciriello, 1983). Cells in these regions have been demonstrated to display short-latency EPSPs to primary baroreceptor afferent stimulation (Donoghue et al., 1985;Rogers et al., 1993) and likely conform in large part to second-order neurons supplied by these nerves. In support of this view, we have recently found that Fos induction in both the NTS and CVLM in this paradigm is essentially abolished by complete sinoaortic denervation (Chan and Sawchenko, 1996) (R. Chan and P. Sawchenko, unpublished observations). It remains unclear whether neurons comprising a secondary focus of barosensitive cells in the medial NTS may be activated directly by baroreceptor afferents or polysynaptically in response to PE treatment. Unlike the baroreceptor strip, the medial subnucleus is a major source of projections to the ventrolateral medulla (Sawchenko and Swanson, 1982; Ross et al., 1985), and the PE-responsiveness of medial NTS cells may reflect a position as a relay interposed between second-order neurons and the VLM. On the other hand, transganglionic tracing experiments have revealed secondary accumulations of baroreceptor afferent terminals in the medial subnucleus (Ciriello, 1983; Chan and Sawchenko, 1996), leaving open the possibility of direct activation by primary afferents.
Despite the great number of GABAergic neurons in the NTS (Blessing et al., 1984; Izzo et al., 1992), only a small proportion of barosensitive neurons were found to express GAD mRNA. It is unclear whether those that do may constitute an organized substrate for inhibitory interneuronal processing of baroreceptor input within the primary afferent termination zone. Evidence exists to support a role of GABAergic interneurons in the modulation of baroreflex function within the NTS (Sved and Tsukamoto, 1992). In any case, the bulk of GABAergic barosensitive neurons throughout the NTS do not project to the RVLM, supporting the notion that NTS is not a major source of inhibitory influences on cells providing reticulospinal vasomotor outflow (Meeley et al., 1985; Milner et al., 1987). The extremely limited representation of GLYT-2-positive barosensitive neurons in the NTS suggests that glycinergic neurons are unlikely to play a major direct role in the initial handling of primary baroreceptor input.
By contrast, a subgroup of NO-producing neurons in the NTS are positioned to play a central role in baroreceptor information processing. We identified a circumscribed group of barosensitive neurons in aspects of the dorsal NTS known to be supplied preferentially by the aortic depressor nerve (Ciriello, 1983) that displayed markers for the NO phenotype. A disproportionately high percentage of these cells could be retrogradely labeled from tracer deposits in the RVLM, suggesting a direct route by which the baroreceptor inhibition of sympathetic outflow may be effected. Because vagal cardiomotor and ventral respiratory neurons are distributed within the locus of tracer injections in the RVLM (Bieger and Hopkins, 1987; Ellenberger et al., 1990), we cannot exclude the possibility that these may comprise baroreflex-relevant targets of NO-producing neurons in the strip region of the NTS (see also Miselis et al., 1989). Physiological studies have implicated endogenous NO mechanisms in the NTS and RVLM as differentially affecting basal and reflex adjustments in sympathetic nerve activity, but in a manner independent of arterial baroreceptor reflexes (Shapoval et al., 1991; Harada et al., 1993). Thus, the functional importance of any NO-containing NTS–RVLM pathway vis-à-vis the better-documented NTS–CVLM-RVLM circuit in mediating baroreflex inhibition of sympathetic outflow remains to be evaluated. In any event, our findings indicate clearly that neurons of the baroreceptor strip are both anatomically and phenotypically differentiated.
Caudal ventrolateral medulla
Physiological mapping of CVLM depressor sites using chemical (Bonham and Jeske, 1989; Cravo et al., 1991) and electrical (Day et al., 1983) stimulation methods has generally highlighted a sympathoinhibitory periambiguual zone extending 0.4–0.7 mm rostrally from the level of the calamus scriptorius (Bonham and Jeske, 1989). This depressor region houses barosensitive cells that provide tonic and phasic inhibitory drive to the RVLM (Jeske et al., 1993), and the distribution of depressor sites is distinct from that of proximate catecholaminergic neurons (Day et al., 1983; Bonham and Jeske, 1989). The present analysis suggests a broader definition of the CVLM as basically comprising a diffuse GABAergic cell column ventral to the special visceral efferent core of the ambiguual complex, which is maximally developed over a region extending 1.3–1.4 mm rostrally from the level of the calamus scriptorius. Although partly intermingled with catecholamine neurons, the bulk of GABAergic barosensitive neurons in CVLM lay dorsal to the A1 and C1 cell groups. The proximity of GABAergic and aminergic neurons may account for the presence of a mixture of pressor and depressor sites encountered in stimulation studies of the CVLM (Day et al., 1983; Bonham and Jeske, 1989). The present analysis failed to identify any organizational correlate that might underlie the functional differentiation between the rostral and caudal aspects of the CVLM, as articulated by Cravo et al. (1991).
Because the bulk of ventrolaterally directed projections from the caudomedial NTS contact noncatecholaminergic elements in the CVLM region, some of which may correspond to the depressor neurons implicated in the baroreflex control of sympathetic outflow (Chan et al., 1995), our findings further consolidate the notion that GABAergic neurons in CVLM constitute an important relay for NTS–RVLM interaction (for review, see Reis et al., 1994; Dampney et al., 1995). In addition, our evidence supporting an extremely limited involvement of glycinergic neurons in the CVLM–RVLM relay is in line with previous pharmacological findings (Ross et al., 1984; Willette et al., 1984;Blessing, 1988).
In conclusion, Fos expression provoked by select PE treatment parameters has provided a means by which to define and characterize cell groups likely to be involved in the initial central processing of baroreceptor input and at a pivotal inhibitory relay in the CVLM. The ability to identify these as populations should facilitate addressing such lingering issues as the nature and source(s) of synaptic input to each and the pathways by which baroreceptor information is distributed from its initial point of entry into the brain to the ventrolateral medulla, as well as to other levels of the CNS.
Footnotes
This work was supported by National Institutes of Health Grant HL-35137 and American Heart Association Grant-in-Aid 97-260 and was conducted in part by the Foundation for Medical Research. P.E.S is an investigator of the Foundation for Medical Research. Funding support for R.K.W.C. was provided by the American Heart Association, California Affiliate. We are grateful to Drs. T. Curran, T. Deguchi, J. Mallet, J. Milbrandt, N. Nelson, S. H. Snyder, and A. J. Tobin for providing plasmids and to Carlos Arias, Kris Trulock, Rita Wong, and Belle Wamsley for excellent assistance in the preparation of histological materials, figures, and this manuscript, respectively.
Correspondence should be addressed to Dr. P. E. Sawchenko, The Salk Institute, P.O. Box 85800, San Diego, CA 92186-5800.
REFERENCES
- 1.Abercrombie M. Estimation of nuclear population from microtome sections. Anat Rec. 1946;94:239–247. doi: 10.1002/ar.1090940210. [DOI] [PubMed] [Google Scholar]
- 2.Adams RH, Sato K, Shimada S, Tohyama M, Püschel AW, Betz H. Gene structure and glial expression of the glycine transporter GlyT-1 in embryonic and adult rodents. J Neurosci. 1995;15:2524–2532. doi: 10.1523/JNEUROSCI.15-03-02524.1995. [DOI] [PMC free article] [PubMed] [Google Scholar]
- 3.Agarwal SK, Calaresu FR. Monosynaptic connection from caudal to rostral ventrolateral medulla in the baroreceptor reflex pathway. Brain Res. 1991;555:70–74. doi: 10.1016/0006-8993(91)90861-o. [DOI] [PubMed] [Google Scholar]
- 4.Aicher SA, Kurucz OS, Reis DJ, Milner TA. Nucleus tractus solitarius efferent terminals synapse on neurons in the caudal ventrolateral medulla that project to the rostral ventrolateral medulla. Brain Res. 1995;693:51–63. doi: 10.1016/0006-8993(95)00660-i. [DOI] [PubMed] [Google Scholar]
- 5.Altschuler SM, Bao X, Bieger D, Hopkins DA, Miselis RR. Viscerotopic representation of the upper alimentary tract in the rat: sensory ganglia and nuclei of the solitary and spinal trigeminal tracts. J Comp Neurol. 1989;283:248–268. doi: 10.1002/cne.902830207. [DOI] [PubMed] [Google Scholar]
- 6.Badoer E, McKinley MJ, Oldfield BJ, McAllen RM. Localization of barosensitive neurons in the caudal ventrolateral medulla which project to the rostral ventrolateral medulla. Brain Res. 1994;657:258–268. doi: 10.1016/0006-8993(94)90975-x. [DOI] [PubMed] [Google Scholar]
- 7.Basbaum AI, Menétrey D. Wheat germ agglutinin-apoHRP gold: a new retrograde tracer for light- and electron-microscopic single- and double-label studies. J Comp Neurol. 1987;261:306–318. doi: 10.1002/cne.902610211. [DOI] [PubMed] [Google Scholar]
- 8.Benarroch EE, Granata AR, Ruggiero DA, Park DH, Reis DJ. Neurons of C1 area mediate cardiovascular responses initiated from ventral medullary surface. Am J Physiol. 1986;250:R932–R945. doi: 10.1152/ajpregu.1986.250.5.R932. [DOI] [PubMed] [Google Scholar]
- 9.Bieger D, Hopkins DA. Viscerotopic representation of the upper alimentary tract in the medulla oblongata in the rat: the nucleus ambiguus. J Comp Neurol. 1987;262:546–562. doi: 10.1002/cne.902620408. [DOI] [PubMed] [Google Scholar]
- 10.Blessing WW. Depressor neurons in rabbit caudal medulla act via GABA receptors in rostral medulla. Am J Physiol. 1988;254:H686–H692. doi: 10.1152/ajpheart.1988.254.4.H686. [DOI] [PubMed] [Google Scholar]
- 11.Blessing WW, Oertel WH, Willoughby JO. Glutamic acid decarboxylase immunoreactivity is present in perikarya of neurons in nucleus tractus solitarius of rat. Brain Res. 1984;322:346–350. doi: 10.1016/0006-8993(84)90131-8. [DOI] [PubMed] [Google Scholar]
- 12.Bonham AC, Jeske I. Cardiorespiratory effects of d,l-homocysteic acid in caudal ventrolateral medulla. Am J Physiol. 1989;256:H688–H696. doi: 10.1152/ajpheart.1989.256.3.H688. [DOI] [PubMed] [Google Scholar]
- 13.Bredt DS, Hwang PH, Glatt C, Lowenstein C, Reed RR, Snyder SH. Cloned and expressed nitric oxide synthase structurally resembles cytochrome P-450 reductase. Nature. 1991;351:714–718. doi: 10.1038/351714a0. [DOI] [PubMed] [Google Scholar]
- 14.Bullit E. Expression of c-fos-like protein as a marker for neuronal activity following noxious stimulation in rat. J Comp Neurol. 1990;296:517–530. doi: 10.1002/cne.902960402. [DOI] [PubMed] [Google Scholar]
- 15.Chan RKW, Sawchenko PE. Spatially and temporally differentiated patterns of c-fos expression in brainstem catecholaminergic cell groups induced by cardiovascular challenges in the rat. J Comp Neurol. 1994;348:433–460. doi: 10.1002/cne.903480309. [DOI] [PubMed] [Google Scholar]
- 16.Chan RKW, Sawchenko PE. Hemodynamic regulation of tyrosine hydroxylase messenger RNA in medullary catecholamine neurons: a c-fos-guided hybridization histochemical study. Neuroscience. 1995a;66:377–390. doi: 10.1016/0306-4522(94)00600-a. [DOI] [PubMed] [Google Scholar]
- 17.Chan RKW, Sawchenko PE. A c-fos-guided analysis of the organization and transmitter-specificity of medullary baroreflex circuitry. Soc Neurosci Abstr. 1995b;21:640. [Google Scholar]
- 18.Chan RKW, Sawchenko PE. Effects of carotid sinus nerve transection on phenylephrine-induced Fos expression in the nucleus of the solitary tract. Soc Neurosci Abstr. 1996;22:631. [Google Scholar]
- 19.Chan RKW, Brown ER, Ericsson A, Kovács KJ, Sawchenko PE. A comparison of two immediate early genes, c-fos and NGFI-B, as markers for functional activation in stress-related neuroendocrine circuitry. J Neurosci. 1993;13:5126–5138. doi: 10.1523/JNEUROSCI.13-12-05126.1993. [DOI] [PMC free article] [PubMed] [Google Scholar]
- 20.Chan RKW, Peto CA, Sawchenko PE. The A1 catecholamine cell group: fine structure and synaptic inputs from the nucleus of the solitary tract. J Comp Neurol. 1995;351:62–80. doi: 10.1002/cne.903510107. [DOI] [PubMed] [Google Scholar]
- 21.Chapleau MW, Haiduczok G, Abboud FM. Mechanisms of resetting of arterial baroreceptors: an overview. Am J Med Sci. 1988;295:327–334. doi: 10.1097/00000441-198804000-00019. [DOI] [PubMed] [Google Scholar]
- 22.Ciriello J. Brainstem projections of aortic baroreceptor afferent fibers in the rat. Neurosci Lett. 1983;36:37–42. doi: 10.1016/0304-3940(83)90482-2. [DOI] [PubMed] [Google Scholar]
- 23.Clark JA, Amara SG. Amino acid neurotransmitter transporters: structure, function, and molecular diversity. Bioessays. 1993;15:323–332. doi: 10.1002/bies.950150506. [DOI] [PubMed] [Google Scholar]
- 24.Cravo SL, Morrison SF, Reis DJ. Differentiation of two cardiovascular regions within caudal ventrolateral medulla. Am J Physiol. 1991;261:R985–R994. doi: 10.1152/ajpregu.1991.261.4.R985. [DOI] [PubMed] [Google Scholar]
- 25.Cunningham ET, Jr, Sawchenko PE. Anatomical specificity of noradrenergic inputs to the paraventricular and supraoptic nuclei of the rat hypothalamus. J Comp Neurol. 1988;274:60–76. doi: 10.1002/cne.902740107. [DOI] [PubMed] [Google Scholar]
- 26.Cunningham ET, Jr, Bohn MC, Sawchenko PE. Organization of adrenergic inputs to the paraventricular and supraoptic nuclei of the hypothalamus in the rat. J Comp Neurol. 1990;292:651–667. doi: 10.1002/cne.902920413. [DOI] [PubMed] [Google Scholar]
- 27.Dampney RAL. Functional organization of central pathways regulating the cardiovascular system. Physiol Rev. 1994;74:323–364. doi: 10.1152/physrev.1994.74.2.323. [DOI] [PubMed] [Google Scholar]
- 28.Dampney RAL, Li YW, Hirooka Y, Potts P, Polson JW. Use of c-fos functional mapping to identify the central baroreceptor reflex pathway: advantages and limitations. Clin Exp Hypertens. 1995;17:197–208. doi: 10.3109/10641969509087065. [DOI] [PubMed] [Google Scholar]
- 29.Dawson TM, Bredt DS, Fotuhi M, Hwang PM, Synder SH. Nitric oxide synthase and neuronal NADPH diaphorase are identical in brain and peripheral tissues. Proc Natl Acad Sci USA. 1991;88:7797–7801. doi: 10.1073/pnas.88.17.7797. [DOI] [PMC free article] [PubMed] [Google Scholar]
- 30.Day TA, Ro A, Renaud LP. Depressor area within caudal ventrolateral medulla does not correspond to the A1 catecholamine cell groups. Brain Res. 1983;279:299–302. doi: 10.1016/0006-8993(83)90197-x. [DOI] [PubMed] [Google Scholar]
- 31.Donoghue S, Felder RB, Gilbey MP, Jordan D, Spyer KM. Post-synaptic activity evoked in the nucleus tractus solitarius by carotid sinus and aortic nerve afferents in the cat. J Physiol (Lond) 1985;360:261–273. doi: 10.1113/jphysiol.1985.sp015616. [DOI] [PMC free article] [PubMed] [Google Scholar]
- 32.Dun NJ, Dun SL, Förstermann U. Nitric oxide synthase immunoreactivity in rat pontine medullary neurons. Neuroscience. 1994;59:429–445. doi: 10.1016/0306-4522(94)90607-6. [DOI] [PubMed] [Google Scholar]
- 33.Ellenberger HH, Feldman JL, Zhan WZ. Subnuclear organization of the lateral tegmental field of the rat. II. Catecholamine neurons and ventral respiratory group. J Comp Neurol. 1990;294:212–222. doi: 10.1002/cne.902940206. [DOI] [PubMed] [Google Scholar]
- 34.Erickson JT, Millhorn DE. Fos-like protein is induced in neurons of the medulla oblongata after stimulation of the carotid sinus nerve in awake and anesthetized rats. Brain Res. 1991;567:11–24. doi: 10.1016/0006-8993(91)91430-9. [DOI] [PubMed] [Google Scholar]
- 35.Ericsson A, Liu C, Hart RP, Sawchenko PE. Type 1 interleukin-1 receptor in the rat brain: distribution, regulation, and relationship to sites of IL-1-induced cellular activation. J Comp Neurol. 1995;361:681–698. doi: 10.1002/cne.903610410. [DOI] [PubMed] [Google Scholar]
- 36.Erlander MG, Tobin AJ. The structural and functional heterogeneity of glutamic acid decarboxylase: a review. Neurochem Res. 1991;16:215–226. doi: 10.1007/BF00966084. [DOI] [PubMed] [Google Scholar]
- 37.Erlander MG, Tillakaratne NJK, Feldblum S, Patel N, Tobin AJ. Two genes encode distinct glutamate decarboxylases. Neuron. 1991;7:91–100. doi: 10.1016/0896-6273(91)90077-d. [DOI] [PubMed] [Google Scholar]
- 38.Esclapez M, Tillakaratne NJK, Kaufman DL, Tobin AJ, Houser CR. Comparative localization of two forms of glutamic acid decarboxylase and their mRNAs in rat brain supports the concepts of functional differences between the forms. J Neurosci. 1994;14:1834–1855. doi: 10.1523/JNEUROSCI.14-03-01834.1994. [DOI] [PMC free article] [PubMed] [Google Scholar]
- 39.Fort P, Luppi P-H, Jouvet M. Glycine-immunoreactive neurones in the cat brainstem reticular formation. NeuroReport. 1993;4:1123–1126. [PubMed] [Google Scholar]
- 40.Fraunfelder FT, Scafidi AF. Possible adverse effects from topical ocular 10% phenylephrine. Am J Ophthalmol. 1978;85:447–453. doi: 10.1016/s0002-9394(14)75239-0. [DOI] [PubMed] [Google Scholar]
- 41.Gonzales ER, Krieger AJ, Sapru HN. Central resetting of baroreflex in the spontaneously hypertensive rat. Hypertension. 1983;5:346–352. doi: 10.1161/01.hyp.5.3.346. [DOI] [PubMed] [Google Scholar]
- 42.Grima B, Lamouroux A, Blanot F, Faucon-Biguet N, Mallet J. Complete coding sequence of rat tyrosine hydroxylase mRNA. Proc Natl Acad Sci USA. 1985;82:617–621. doi: 10.1073/pnas.82.2.617. [DOI] [PMC free article] [PubMed] [Google Scholar]
- 43.Haase AT, Walker D, Stowring L, Ventura P, Geballe A, Blum H, Brahic M, Goldberg R, O’Brien K. Detection of two viral genomes in single cells by double-label hybridization in situ and color microradioautography. Science. 1985;227:189–192. doi: 10.1126/science.2981430. [DOI] [PubMed] [Google Scholar]
- 44.Hainsworth R. Reflexes from the heart. Physiol Rev. 1991;71:617–658. doi: 10.1152/physrev.1991.71.3.617. [DOI] [PubMed] [Google Scholar]
- 45.Harada S, Tokunaga S, Momohara M, Masaki H, Tagawa T, Imaizumi T, Takeshita A. Inhibition of nitric oxide formation in the nucleus tractus solitarius increases renal sympathetic nerve activity in rabbits. Circ Res. 1993;72:511–516. doi: 10.1161/01.res.72.3.511. [DOI] [PubMed] [Google Scholar]
- 46.Haselton JR, Guyenet PG. Electrophysiological characterization of putative C1 adrenergic neurons in the rat. Neuroscience. 1989;30:199–214. doi: 10.1016/0306-4522(89)90365-5. [DOI] [PubMed] [Google Scholar]
- 47.Hieble JP, Nichols AJ, Langer SZ, Ruffolo RR., Jr . Pharmacology of the sympathetic nervous system. In: Munson PL, Mueller RA, Breese GR, editors. Principles of pharmacology. Basic concepts and clinical applications. Chapman and Hall; New York: 1995. pp. 121–144. [Google Scholar]
- 48.Hirooka Y, Imaizumi T, Sugimachi M, Takeshita A. Mechanisms involved in aortic baroreceptor excitation during drug-induced aortic pressure elevation in intact rabbits. J Auton Nerv Syst. 1992;40:99–106. doi: 10.1016/0165-1838(92)90021-8. [DOI] [PubMed] [Google Scholar]
- 49.Hökfelt T, Johansson O, Goldstein M. Central catecholamine neurons as revealed by immunohistochemistry with special reference to adrenaline neurons. In: Bjorklund A, Hökfelt T, editors. Handbook of chemical neuroanatomy, Vol 2. Elsevier; Amsterdam: 1984. pp. 157–276. [Google Scholar]
- 50.Hope BT, Michael GL, Knigge KM, Vincent SR. Neuronal NADPH diaphorase is a nitric oxide synthase. Proc Natl Acad Sci USA. 1991;88:2811–2814. doi: 10.1073/pnas.88.7.2811. [DOI] [PMC free article] [PubMed] [Google Scholar]
- 51.Housley GD, Martin-Body RL, Dawson NJ, Sinclair JD. Brain stem projections of the glossopharyngeal nerve and its carotid sinus branch in the rat. Neuroscience. 1987;22:237–250. doi: 10.1016/0306-4522(87)90214-4. [DOI] [PubMed] [Google Scholar]
- 52.Imaizumi T, Brunk SD, Gupta BN, Thames MD. Central effect of intravenous phenylephrine on baroreflex control of renal nerves. Hypertension. 1984;6:906–914. doi: 10.1161/01.hyp.6.6.906. [DOI] [PubMed] [Google Scholar]
- 53.Ishii K, Oda Y, Ichikawa T, Deguchi T. Complementary DNAs for choline acetyltransferase from spinal cords of rat and mouse: nucleotide sequences, expression in mammalian cells, and in situ hybridization. Mol Brain Res. 1990;7:151–159. doi: 10.1016/0169-328x(90)90092-r. [DOI] [PubMed] [Google Scholar]
- 54.Izzo PN, Sykes RM, Spyer KM. γ-Aminobutyric acid immunoreactive structures in the nucleus tractus solitarius: a light and electron microscopic study. Brain Res. 1992;591:69–78. doi: 10.1016/0006-8993(92)90979-j. [DOI] [PubMed] [Google Scholar]
- 55.Izzo PN, Deuchars J, Spyer KM. Localization of cardiac vagal preganglionic motoneurones in the rat: immunocytochemical evidence of synaptic inputs containing 5-hydroxytryptamine. J Comp Neurol. 1993;327:572–583. doi: 10.1002/cne.903270408. [DOI] [PubMed] [Google Scholar]
- 56.Jeske I, Morrison SF, Cravo SL, Reis DJ. Identification of baroreceptor reflex interneurons in the caudal ventrolateral medulla. Am J Physiol. 1993;264:R169–R178. doi: 10.1152/ajpregu.1993.264.1.R169. [DOI] [PubMed] [Google Scholar]
- 57.Jeske I, Reis DJ, Milner TA. Neurons in the barosensory area of the caudal ventrolateral medulla project monosynaptically on to sympathoexcitatory bulbospinal neurons in the rostral ventrolateral medulla. Neuroscience. 1995;65:343–353. doi: 10.1016/0306-4522(94)00470-p. [DOI] [PubMed] [Google Scholar]
- 58.Kalia M, Sullivan JM. Brainstem projections of sensory and motor components of the vagus nerve in the rat. J Comp Neurol. 1982;211:248–264. doi: 10.1002/cne.902110304. [DOI] [PubMed] [Google Scholar]
- 59.Kunze DL. Rapid resetting of the carotid baroreceptor reflex in the cat. Am J Physiol. 1981;241:H802–H806. doi: 10.1152/ajpheart.1981.241.6.H802. [DOI] [PubMed] [Google Scholar]
- 60.Li YW, Dampney RAL. Expression of Fos-like protein in brain following sustained hypertension and hypotension in conscious rabbits. Neuroscience. 1994;61:613–634. doi: 10.1016/0306-4522(94)90439-1. [DOI] [PubMed] [Google Scholar]
- 61.Liu QR, L-pez-Corcuera B, Mandiyan S, Nelson H, Nelson N. Cloning and expression of a spinal cord- and brain-specific glycine transporter with novel structural features. J Biol Chem. 1993;268:22802–22808. [PubMed] [Google Scholar]
- 62.Loewy AD. Central autonomic pathways. In: Loewy AD, Spyer KM, editors. Central regulation of autonomic functions. Oxford; New York: 1990. pp. 88–103. [Google Scholar]
- 63.Loewy AD, Burton H. Nuclei of the solitary tract: efferent projections to the lower brain stem and spinal cord of the cat. J Comp Neurol. 1978;181:421–450. doi: 10.1002/cne.901810211. [DOI] [PubMed] [Google Scholar]
- 64.Maley B, Newton BW. Immunohistochemistry of γ-aminobutyric acid in the cat nucleus tractus solitarius. Brain Res. 1985;330:364–368. doi: 10.1016/0006-8993(85)90699-7. [DOI] [PubMed] [Google Scholar]
- 65.McCabe JT, Pfaff DW. In situ hybridization: a methodological guide. In: Conn PM, editor. Methods in neuroscience, Vol 1, Gene probes. Academic; New York: 1989. pp. 98–126. [Google Scholar]
- 66.McKitrick DJ, Krukoff TL, Calaresu FR. Expression of c-fos protein in rat brain after electrical stimulation of the aortic depressor nerve. Brain Res. 1992;599:215–222. doi: 10.1016/0006-8993(92)90394-o. [DOI] [PubMed] [Google Scholar]
- 67.Meeley MP, Ruggiero DA, Ishitsuka T, Reis DJ. Intrinsic γ-amino-butyric acid neurons in the nucleus of the solitary tract and the rostral ventrolateral medulla of the rat: an immunocytochemical and biochemical study. Neurosci Lett. 1985;58:83–89. doi: 10.1016/0304-3940(85)90333-7. [DOI] [PubMed] [Google Scholar]
- 68.Menétrey D, Gannon A, Lenne JD, Basbaum AI. Expression of c-fos protein in interneurons and projection neurons of the rat spinal cord in response to noxious somatic articular and visceral stimulation. J Comp Neurol. 1989;285:177–195. doi: 10.1002/cne.902850203. [DOI] [PubMed] [Google Scholar]
- 69.Milbrandt J. Nerve growth factor induces a gene homologous to the glucocorticoid receptor gene. Neuron. 1988;1:183–188. doi: 10.1016/0896-6273(88)90138-9. [DOI] [PubMed] [Google Scholar]
- 70.Milner TA, Pickel VM, Chan J, Massari VJ, Oertel WH, Park DH, Joh TH, Reis DJ. Phenylethanolamine N-methyltransferase-containing neurons in the rostral ventrolateral medulla. II. Synaptic relationships with GABAergic terminals. Brain Res. 1987;411:46–57. doi: 10.1016/0006-8993(87)90679-2. [DOI] [PubMed] [Google Scholar]
- 71.Miselis RR, Rogers WT, Schwaber JS, Spyer KM. Localization of cardiomotor neurones in the anesthetized rat; cholera-toxin HRP conjugate and pseudorabies labeling. J Physiol (Lond) 1989;416:63P. [Google Scholar]
- 72.Morgan JI, Curran T. Stimulus-transcription coupling in the nervous system: involvement of the inducible proto-oncogenes fos and jun. Annu Rev Neurosci. 1991;14:421–451. doi: 10.1146/annurev.ne.14.030191.002225. [DOI] [PubMed] [Google Scholar]
- 73.Morrison SF, Milner TA, Reis DJ. Reticulospinal vasomotor neurons of the rat rostral ventrolateral medulla: relationship to sympathetic nerve activity and the C1 adrenergic cell group. J Neurosci. 1988;8:1286–1301. doi: 10.1523/JNEUROSCI.08-04-01286.1988. [DOI] [PMC free article] [PubMed] [Google Scholar]
- 74.Nosaka S, Yasunaga K, Tamai S. Vagal cardiac preganglionic neurons: distribution, cell types and reflex discharges. Am J Physiol. 1982;243:R92–R98. doi: 10.1152/ajpregu.1982.243.1.R92. [DOI] [PubMed] [Google Scholar]
- 75.Petersen SL, McCrone S. Characterization of the receptor complement of individual neurons using dual-label in situ hybridization histochemistry. In: Eberwine JH, Valentino KL, Barchas JD, editors. In situ hybridization in neurobiology, Advances in methodology. Oxford; New York: 1994. pp. 78–95. [Google Scholar]
- 76.Pilowsky PM, Jiang C, Lipski J. An intracellular study of respiratory neurons in the rostral ventrolateral medulla of the rat and their relationship to catecholamine-containing neurons. J Comp Neurol. 1990;301:604–617. doi: 10.1002/cne.903010409. [DOI] [PubMed] [Google Scholar]
- 77.Polson JW, Potts PD, Li YW, Dampney RA. Fos expression in neurons projecting to the pressor region in the rostral ventrolateral medulla after sustained hypertension in conscious rabbits. Neuroscience. 1995;67:107–123. doi: 10.1016/0306-4522(95)00034-g. [DOI] [PubMed] [Google Scholar]
- 78.Pourcho RG, Goebel DJ, Jojich L, Hazlett JC. Immunocytochemical evidence for the involvement of glycine in sensory centers of the rat brain. Neuroscience. 1992;46:643–656. doi: 10.1016/0306-4522(92)90151-q. [DOI] [PubMed] [Google Scholar]
- 79.Reis DJ, Golanov EV, Ruggiero DA, Sun MK (1994) Sympatho-excitatory neurons of the rostral ventrolateral medulla are oxygen sensors and essential elements in the tonic and reflex control of the systemic and cerebral circulations. J Hypertens 12[Suppl 10]:S159–S180. [PubMed]
- 80.Rogers RF, Paton JF, Schwaber JS. NTS neuronal responses to arterial pressure and pressure changes in the rat. Am J Physiol. 1993;265:R1355–R1368. doi: 10.1152/ajpregu.1993.265.6.R1355. [DOI] [PubMed] [Google Scholar]
- 81.Roland BL, Sawchenko PE. Local origins of some GABAergic projections to the paraventricular and supraoptic nuclei of the hypothalamus in the rat. J Comp Neurol. 1993;332:123–143. doi: 10.1002/cne.903320109. [DOI] [PubMed] [Google Scholar]
- 82.Ross CA, Ruggiero DA, Park DH, Joh TH, Sved AF, Fernandez-Pardal J, Saavedra JM, Reis DJ. Tonic vasomotor control by the rostral ventrolateral medulla: effect of electrical or chemical stimulation of the area containing C1 adrenaline neurons on arterial pressure, heart rate, and plasma catecholamines and vasopressin. J Neurosci. 1984;4:474–494. doi: 10.1523/JNEUROSCI.04-02-00474.1984. [DOI] [PMC free article] [PubMed] [Google Scholar]
- 83.Ross CA, Ruggiero DA, Reis DJ. Projections from the nucleus of the tractus solitarii to the rostral ventrolateral medulla. J Comp Neurol. 1985;242:511–534. doi: 10.1002/cne.902420405. [DOI] [PubMed] [Google Scholar]
- 84.Ruggiero DA, Meeley MP, Anwar M, Reis DJ. Newly identified GABAergic neurons in regions of the ventrolateral medulla which regulate blood pressure. Brain Res. 1985;339:171–177. doi: 10.1016/0006-8993(85)90640-7. [DOI] [PubMed] [Google Scholar]
- 85.Ruggiero DA, Cravo SL, Arango V, Reis DJ. Central control of the circulation by the rostral ventrolateral reticular nucleus, anatomical substrates. In: Ciriello J, Caverson MM, Polosa C, editors. The central neural organization of cardiovascular control, Vol 81, Progress in brain research. Elsevier; Amsterdam: 1989. pp. 49–79. [DOI] [PubMed] [Google Scholar]
- 86.Rutherfurd SD, Widdop RE, Sannajust F, Louis WJ, Gundlach AL. Expression of c-fos and NGFI-A messenger RNA in the medulla oblongata of the anesthetized rat following stimulation of vagal and cardiovascular afferents. Mol Brain Res. 1992;13:301–312. doi: 10.1016/0169-328x(92)90213-u. [DOI] [PubMed] [Google Scholar]
- 87.Sawchenko PE, Swanson LW. The organization of noradrenergic pathways from the brainstem to the paraventricular and supraoptic nuclei in the rat. Brain Res Rev. 1982;4:275–325. doi: 10.1016/0165-0173(82)90010-8. [DOI] [PubMed] [Google Scholar]
- 88.Schmued LC, Fallon JH. Fluoro-gold: a new fluorescent retrograde axonal tracer with numerous unique properties. Brain Res. 1986;377:147–154. doi: 10.1016/0006-8993(86)91199-6. [DOI] [PubMed] [Google Scholar]
- 89.Shapoval LN, Sagach VF, Pobegailo LS. Nitric oxide influences ventrolateral medullary mechanisms of vasomotor control in cat. Neurosci Lett. 1991;132:47–50. doi: 10.1016/0304-3940(91)90430-2. [DOI] [PubMed] [Google Scholar]
- 90.Shiromani PJ, Floyd C, Velazquez-Moctezuma J. Pontine cholinergic neurons simultaneously innervate two thalamic targets. Brain Res. 1990;532:317–322. doi: 10.1016/0006-8993(90)91774-b. [DOI] [PubMed] [Google Scholar]
- 91.Simmons DM, Arriza JL, Swanson LW. A complete protocol for in situ hybridization of messenger RNAs in brain and other tissues with radiolabeled single-stranded RNA probes. J Histotechnol. 1989;12:169–181. [Google Scholar]
- 92.Spyer KM. The central nervous organization of reflex circulatory control. In: Loewy AD, Spyer KM, editors. Central regulation of autonomic functions. Oxford; New York: 1990. pp. 168–188. [Google Scholar]
- 93.Spyer KM. Central nervous mechanisms contributing to cardiovascular control. J Physiol (Lond) 1994;474:1–19. doi: 10.1113/jphysiol.1994.sp019997. [DOI] [PMC free article] [PubMed] [Google Scholar]
- 94.Standish A, Enquist LW, Escardo JA, Schwaber JS. Central neuronal circuit innervating the rat heart defined by transneuronal transport of pseudorabies virus. J Neurosci. 1995;15:1998–2012. doi: 10.1523/JNEUROSCI.15-03-01998.1995. [DOI] [PMC free article] [PubMed] [Google Scholar]
- 95.Sved AF, Tsukamoto K. Tonic stimulation of GABAB receptors in the nucleus tractus solitarius modulates the baroreceptor reflex. Brain Res. 1992;592:37–43. doi: 10.1016/0006-8993(92)91655-x. [DOI] [PubMed] [Google Scholar]
- 96.Swanson LW. Brain maps: structure of the rat brain. Elsevier; Amsterdam: 1992. [Google Scholar]
- 97.Tucker DC, Saper CB, Ruggiero DA, Reis DJ. Organization of central adrenergic pathways. I. Relationships of ventrolateral medullary projections to the hypothalamus and spinal cord. J Comp Neurol. 1987;259:591–603. doi: 10.1002/cne.902590408. [DOI] [PubMed] [Google Scholar]
- 98.Vincent SR, Kimura SR. Histochemical mapping of nitric oxide synthase in the rat brain. Neuroscience. 1992;46:755–784. doi: 10.1016/0306-4522(92)90184-4. [DOI] [PubMed] [Google Scholar]
- 99.Watts AG, Swanson LW. The combination of in situ hybridization with immunohistochemistry and retrograde tract-tracing. In: Conn PM, editor. Methods in neurosciences, Vol 1. Academic; New York: 1989. pp. 127–136. [Google Scholar]
- 100.Willette RN, Punnen S, Krieger AJ, Sapru HN. Interdependence of rostral and caudal ventrolateral medullary areas in the control of blood pressure. Brain Res. 1984;321:169–174. doi: 10.1016/0006-8993(84)90696-6. [DOI] [PubMed] [Google Scholar]
- 101.Wisden W, Errington ML, Williams S, Dunnett SB, Waters C, Hitchcock D, Evan G, Bliss TVP, Hunt SP. Differential expression of immediate early genes in the hippocampus and spinal cord. Neuron. 1990;4:603–614. doi: 10.1016/0896-6273(90)90118-y. [DOI] [PubMed] [Google Scholar]