Abstract
We studied the regulation of spontaneous activity in the embryonic (day 10–11) chick spinal cord. After bath application ofeither an excitatory amino acid (AP-5 or CNQX) and a nicotinic cholinergic (DHβE or mecamylamine) antagonist,or glycine and GABA receptor (bicuculline, 2-hydroxysaclofen, and strychnine) antagonists, spontaneous activity was blocked for a period (30–90 min) but then reappeared in the presence of the drugs. The efficacy of the antagonists was assessed by their continued ability to block spinal reflex pathways during the reappearance of spontaneous activity. Spontaneous activity ceased over the 4–5 hour monitoring period when both sets of antagonists were applied together.
After application of glycine and GABA receptor antagonists, the frequency of occurrence of spontaneous episodes slowed and became highly variable. By contrast, during glutamatergic and nicotinic cholinergic blockade, the frequency of occurrence of spontaneous episodes initially slowed and then recovered to stabilize near the predrug level of activity. Whole-cell recordings made from ventral spinal neurons revealed that this recovery was accompanied by an increase in the amplitude of spontaneously occurring synaptic events.
We also measured changes in the apparent equilibrium potential of the rhythmic, synaptic drive of ventral spinal neurons using voltage or discontinuous current clamp. After excitatory blockade, the apparent equilibrium potential of the rhythmic synaptic drive shifted ∼10 mV more negative to approximately −30 mV. In the presence of bicuculline, the apparent equilibrium potential of the synaptic drive shifted toward the glutamate equilibrium potential.
Considered with other evidence, these findings suggest that spontaneous rhythmic output is a general property of developing spinal networks, and that GABA and glycinergic networks alter their function to compensate for the blockade of excitatory transmission.
Keywords: spinal plasticity, rhythmicity, embryonic networks, development, motoneurons, spontaneous neural activity
Neural networks in the developing spinal cord are spontaneously active. In the spinal cord of the chick embryo, this activity begins early in development at embryonic day 5–6 (E5–E6) and is manifest as recurring episodes of limb movements (Alconero, 1965; Bekoff, 1976; O’Donovan and Landmesser, 1987). There is accumulating evidence that such activity plays an important role in the development of spinal neurons and networks (Fields and Nelson, 1992; Kalb and Hockfield, 1992; Garner et al., 1994; Mendelson, 1994) and is essential for the proper formation of muscles and joints (Ruano-Gil et al., 1978; Toutant et al., 1979; Persson, 1983; Hall and Herring, 1990). Despite the developmental importance of this activity, surprisingly little is known about how it is regulated and generated. Our previous work, using an isolated preparation of the chick spinal cord, suggested that interneurons projecting into the ventrolateral funiculus provide part of the rhythmic, synaptic drive to motoneurons (Ho and O’Donovan, 1993; O’Donovan and Ritter, 1995). Very little is known, however, about how such interneurons participate in the genesis of rhythmic activity or how the output of these networks is regulated.
In earlier work, we made the puzzling observation that spontaneous episodes were blocked initially in the presence of NMDA receptor antagonists but then recovered toward the control level of activity in the presence of the drugs (see Barry and O’Donovan, 1987, their Fig. 3). This finding suggested that the spinal networks may have compensated in some manner for the blockade of NMDA receptors. Although a similar recovery in output was observed with other excitatory amino acid antagonists, we did not investigate the ability of networks to recover their output after complete blockade of excitatory synaptic transmission. The existence of such compensation might reflect a homeostatic process that operates to stabilize network output. The goal of this work, therefore, was to investigate the ability of spinal networks to recover from neurotransmitter blockade and to obtain preliminary evidence for the mechanism of this adjustment.
A brief account of this work has been published as an abstract (Chub and O’Donovan, 1996), and it has been discussed in a review (O’Donovan and Chub, 1997).
MATERIALS AND METHODS
All experiments were performed on the isolated spinal cord of E10–E11 White Leghorn chicken embryos maintained in a forced draught incubator at 38°C. The lumbosacral spinal cord with attached nerves was dissected under cooled (10–15°C) oxygenated Tyrode’s solution (in mm: 139 NaCl, 12 glucose, 17 NaHCO3, 5 KCl, 1 MgCl2, and 3 CaCl2). The concentration of K+ in the recording medium was elevated in these experiments from 2.9 mm (used in our previous studies) to 5.0 mm. Although this change was not essential, it reduced the time required for the reappearance of activity.
The preparation was then transferred to a recording chamber at room temperature (20–22°C), and the recordings were made after heating the perfusate to 28°C. During the dissection and recording, the spinal cord was continuously superfused with Tyrode’s solution.
Neural activity was recorded from spinal roots or muscle nerves. The neural recordings (DC-3 kHz) were made using tight-fitting suction electrodes connected to high-gain DC amplifiers (Grass P16 or World Precision Instruments DAM70), digitized (NeuroCorder DR-886, Neuro Data Instruments), and recorded on videotape for further analysis.
The pharmacology of network activity was examined using bath-applied agents. These included the excitatory amino acid antagonists (±)-2-amino-5-phosphonopentanoic acid (AP-5) and 6-cyano-7-nitroquinoxaline-2,3-dione (CNQX), the nicotinic cholinergic antagonists dihydro-β-erythroidine HBr (DHβE) and mecamylamine HCl (MEC), and the GABAB antagonists 2-hydroxysaclofen (2-HS), phaclofen (PHAC), and 5-aminovaletic acid HCl (5-AVA). These drugs were obtained from Research Biochemicals International (Natick, MA). We also used the GABAA antagonist (−)-bicuculline methiodide (BIC) and the glycine antagonist strychnine hydrochloride (STR), which were obtained from Sigma (St. Louis, MO). The drugs were prepared as 10 mm stocks in distilled water and diluted before use or made up freshly and used immediately.
Whole-cell recording from ventral horn neurons. Rhythmic synaptic currents and potentials were recorded from ventrally located but otherwise unidentified spinal neurons. Electrodes were pulled from thin-walled glass in two stages using a Brown–Flaming puller. The patch solution contained (in mm): 10 NaCl, 130 K-gluconate, 10 HEPES, 1.1 EGTA, 1 MgCl2, 0.1 CaCl2, 1 Na2ATP, 10 QX-314 (lidocaine,N-ethyl bromide quaternary salt), 10 tetraethylammonium acetate, and 0.1 verapamil [(±)-verapamil, methoxy-HCl]. The channel blockers were included to allow measurement of the reversal potential of rhythmic synaptic potentials without the complications of voltage-dependent conductances. The pH of intracellular solution was adjusted to 7.3 with KOH. Tip resistances were ∼4–8 MΩ. Recordings were made with an Axoclamp 2A amplifier (Axon Instruments) and referenced to a 3 m KCl agar bridge indifferent electrode. Gigaohm seals were formed in bridge mode with the application of gentle suction. Slight negative pressure was applied to rupture the membrane underneath the electrode tip and achieve the whole-cell recording. Only cells showing a stable resting membrane potential that was more negative than −45 mV (for 1–2 hr) were used for analysis. Recordings were made under voltage or discontinuous current clamp. When using discontinuous current clamp, sample rates of 2.5–4.5 kHz were used, and the head stage voltage was monitored to ensure adequate sampling and capacitance compensation. Series resistance was not compensated under voltage clamp.
RESULTS
Recovery of spontaneous rhythmic activity in the presence of glutamate and nicotinic cholinergic antagonists
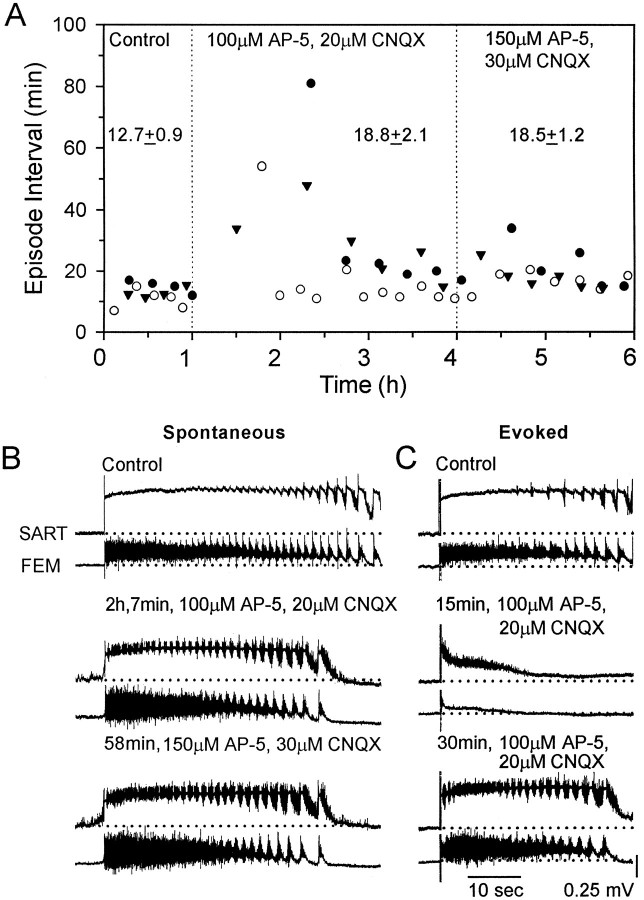
Spontaneous episodes of rhythmic activity, recorded from hindlimb muscle nerves, were blocked for an average of 56.3 min (range, 34–81 min) after bath application of the excitatory amino acid antagonists AP-5 (100 μm) and CNQX (20 μm) (Fig.1A, three experiments). A stimulus given 15 min after the application of the antagonists failed to trigger rhythmic activity, evoking instead a prolonged depolarizing potential in the muscle nerves (Fig. 1C, middle). By 30 min, however, electrical stimulation did trigger an episode with multiple cycles, although spontaneous activity, in this particular experiment (Fig. 1A, filled circles), did not resume for another 50 min. This result indicates an important distinction in the ability of the network to generate activityspontaneously and the ability of the network to produce a rhythmic episode given a suitable trigger, such as an electrical stimulus. Our results show that spontaneous output is generally more sensitive to antagonist blockade than electrically evoked episodes. These observations are consistent with our proposal that different mechanisms control the spontaneous occurrence of activity and network behavior during a rhythmic episode (O’Donovan and Chub, 1997).
Fig. 1.
Spontaneous rhythmic activity recovers in the presence of bath-applied excitatory antagonists. A, Plot of the interval between spontaneous episodes in control Tyrode’s solution and in the presence of 100 μm AP-5 and 20 μm CNQX. After 3 hr in the antagonists the concentrations of AP-5 and CNQX were increased to 150 and 30 μm, respectively. Numbers over the datapoints are the mean ± SEM episode intervals for that period. B, Examples of spontaneous rhythmic episodes recorded from sartorius (SART) and femorotibialis (FEM) muscle nerves in control Tyrode’s solution (top), in 100 μm AP-5 and 20 μm CNQX (middle), and in 150 μm AP-5 and 30 μm CNQX (bottom). C, Electrically evoked rhythmic episodes in control Tyrode’s solution (top) and 15 min (middle) and 30 min (bottom) after bath application of 100 μm AP-5 and 20 μm CNQX. The records were obtained at the times shown, referenced to when the drugs indicated were first applied.
When spontaneous activity did recover, the interval between episodes decreased rapidly to an approximately stable level of 18.8 ± 2.1 min. This was slightly longer than the mean interval before the drugs were applied (12.7 ± 0.9 min). After the frequency of episodes had stabilized in the presence of AP-5 and CNQX, we applied a higher concentration of the antagonists (150 and 30 μm, respectively). This resulted in a small, transient lengthening of the interval between episodes, although the average interval was not affected significantly (18.5 ± 1.2 min). This transient increase in the interval suggests the persistence of a degree of excitatory function within the network, although glutamatergic ventral root reflexes were blocked at the lower concentrations (100 μmAP-5 and 20 μm CNQX) of the antagonists (Fig.2).
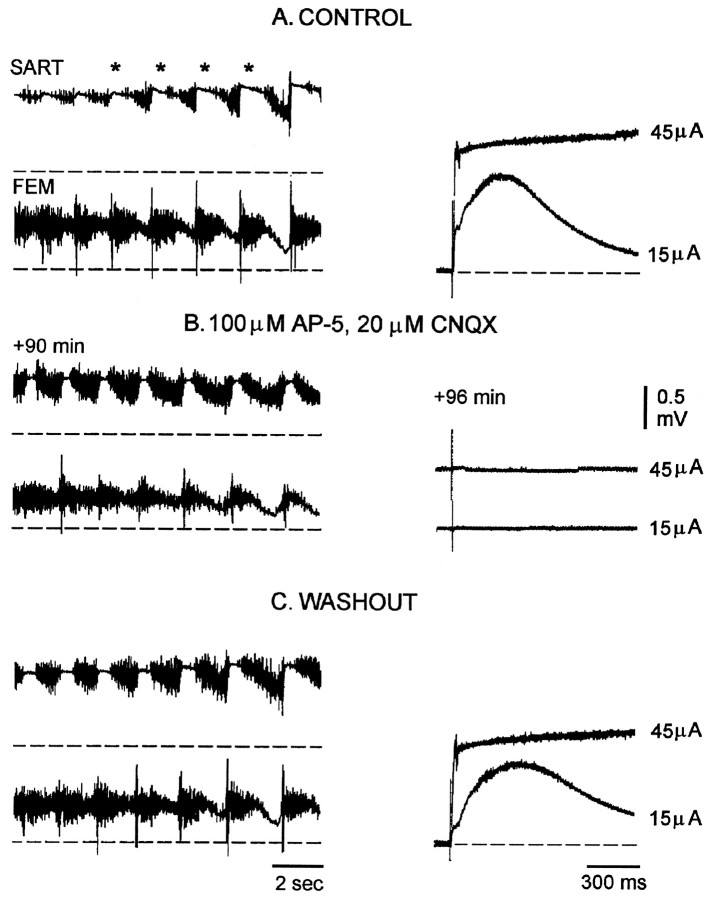
Fig. 2.
Ventral root reflexes are blocked, although rhythmic activity recovers and flexor–extensor alternation is preserved in the presence of excitatory antagonists. Left panels, Episodes of rhythmic activity in control Tyrode’s solution (A), after recovery during excitatory blockade (B), and during washout (C) recorded from sartorius flexor (SART) and femorotibialis extensor (FEM) muscle nerves. Right panels, Two superimposed responses from the contralateral LS4 ventral root (VR c-LS4) after stimulation (single stimulus, 0.5 msec, 15 and 45 μA) of the contralateral LS4 dorsal root during the control period (A), 90–96 min after bath application of 100 μm AP-5 and 20 μm CNQX (B), and 40–45 min after washout in Tyrode’s solution (C). The rhythmic episodes displayed in the left panels are not shown in full length;dashed lines indicate the baseline slow potentials before the onset of the episode, and asterisks mark the pause in several cycles of sartorius discharge.
The pattern of nerve activity in the presence of the glutamatergic antagonists was remarkably similar to the control recordings (Fig.1B), with any changes most evident in the recordings from the nerve to the flexor, sartorius muscle. The basic structure of an episode was unchanged, and surprisingly, the alternating pattern of discharge in the sartorius and the femorotibialis muscle nerves was preserved (Fig. 2B). Discharge in both muscle nerves was increased, and there was an accompanying reduction in the duration of the pause in each cycle of sartorius firing (Fig.1B, asterisks in Fig.2A,B). The control value of the sartorius pause was 0.87 ± 0.02 sec (74 cycles in eight episodes, three embryos), and this decreased to 0.47 ± 0.02 sec during drug application (89 cycles in nine episodes, three embryos). In addition, the amplitude of the slow, tonic potential recorded from the sartorius and femorotibialis muscle nerves was decreased in the recovery period. This slow potential is an electrotonic recording of the rhythmic, synaptic potentials generated in a population of motoneurons (O’Donovan 1989a). During drug application the amplitude of the slow potential decreased 31.5 ± 2.7% for sartorius and 26.2 ± 5.9% for femorotibialis muscle nerves (three experiments). In the presence of the glutamatergic antagonists the episodes were shorter (37.1 ± 1.3 sec, 19 episodes, three experiments) than before the drugs were applied (47.9 ± 3.3 sec, 12 episodes, three experiments).
To establish that the excitatory amino acid antagonists maintained their action during the recovery period, we stimulated the dorsal roots and recorded the evoked potentials in the ventral roots. These potentials are known to be mediated by excitatory amino acid transmission (Lee et al., 1988). The dorsal root was usually stimulated at two intensities. The first was sufficient to evoke monosynaptic and polysynaptic potentials in motoneurons, and the second was sufficient to trigger rhythmic activity (Fig. 2A,right). Both responses were abolished in the presence of AP-5 (100 μm) and CNQX (20 μm) at a time when spontaneous rhythmic activity had recovered and could be evoked by electrical stimulation (Fig. 2B). These results indicate that the antagonists remain functional during the recovery period and have not broken down or become inactive.
Recently it has been demonstrated that the cholinergic recurrent collaterals of motoneurons can contribute excitatory drive during swimming in the Xenopus embryo (Perrins and Roberts 1995a,b). Recurrent motoneuron potentials can be detected in the chick embryo at E10–E11, the age of the embryos used in these experiments. Moreover, such potentials are sensitive to nicotinic cholinergic, GABA, and glycine antagonists, suggesting that they may be mediated by the avian analog of the mammalian Renshaw pathway (O’Donovan, 1989b; Whelan and O’Donovan, 1997). However, it is not known whether such projections, or other spinal cholinergic pathways, contribute to rhythmic activity. Nevertheless, we sought to establish whether rhythmic activity expressed in the presence of excitatory amino acid blockade was mediated by excitatory cholinergic connections. For this reason we tested the ability of the spinal cord to recover its rhythmic output when nicotinic cholinergic antagonists were applied with the excitatory amino acid receptor blockers.
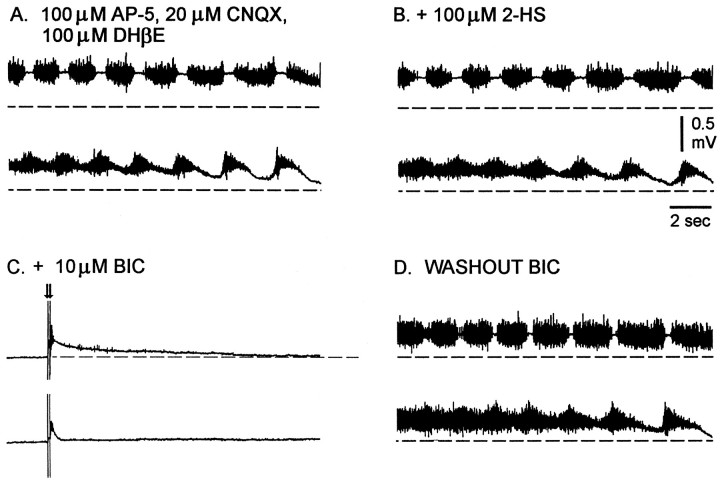
We found that rhythmic activity also recovered when the nicotinic cholinergic antagonist DHβE (100 μm) was added to the AP-5 and CNQX. The efficacy of DHβE during the recovery of rhythmic activity was demonstrated by its blockade of recurrent ventral root potentials (three experiments; data not shown). Despite the presence of these drugs, the alternating pattern of flexor and extensor activity was preserved, and the rhythmic activity was similar to control behavior (Fig. 3A). This result indicates that activation of recurrent inhibitory interneurons by cholinergic motoneuron collaterals is not essential for the pause in firing in each cycle of sartorius activity, in contrast to earlier speculations (O’Donovan 1989a).
Fig. 3.
A, Recordings of the electrically evoked (single stimulus, 0.5 msec, 80 μA) rhythmic activity from the sartorius and femorotibialis muscle nerves during bath application of excitatory antagonists 100 μm AP-5 and 20 μm CNQX and 100 μm DHβE.B, Forty minutes after 100 μm 2-HS was added to the excitatory antagonists. C, Forty minutes after 5 μm BIC was added to the other drugs, a single stimulus evoked small responses in the muscle nerves (data not shown). The concentration of bicuculline (BIC) was increased to 10 μm, and double pulse stimulation (arrows) after 120 min evoked only a small response.D, An episode of rhythmic activity 50 min after beginning washout of the bicuculline but in the presence of 100 μm AP-5, 20 μm CNQX, 100 μmDHβE, and 100 μm 2-HS. Rhythmic episodes are not shown in full length, and the dashed lines are the baseline of the slow potentials before the onset of the rhythmic episode.
Because rhythmic activity recovered in a spinal cord that had the major excitatory amino acid and cholinergic pathways blocked, we hypothesized that the activity was generated by glycine and GABA networks. This hypothesis is plausible, because glycine and GABA are depolarizing and can be excitatory in developing networks (Ben-Ari et al., 1989;Cherubini et al., 1991; Wu et al., 1992; Sernagor et al., 1995;Nishimaru et al., 1996).
Therefore, to test this hypothesis, we initially blocked activity with a mixture of AP-5 (100 μm), CNQX (20 μm), and DHβE (100 μm). Spontaneous activity was allowed to recover (Fig. 3A,B), and then its sensitivity to GABA antagonists was tested. Addition of the GABAB antagonist 2-hydroxysaclofen (100 μm) had little effect on the recovered activity (Fig. 3B, three experiments). In contrast, low concentrations (5–10 μm) of the GABAA antagonist bicuculline abolished both spontaneous and evoked episodes of rhythmic activity. Electrical stimulation of the spinal cord produced only a small ventral root potential when 10 μm bicuculline was added to the other antagonists (Fig.3C). Spontaneous rhythmic activity recovered when the bicuculline was washed out but with the other drugs still present (Fig.3D).
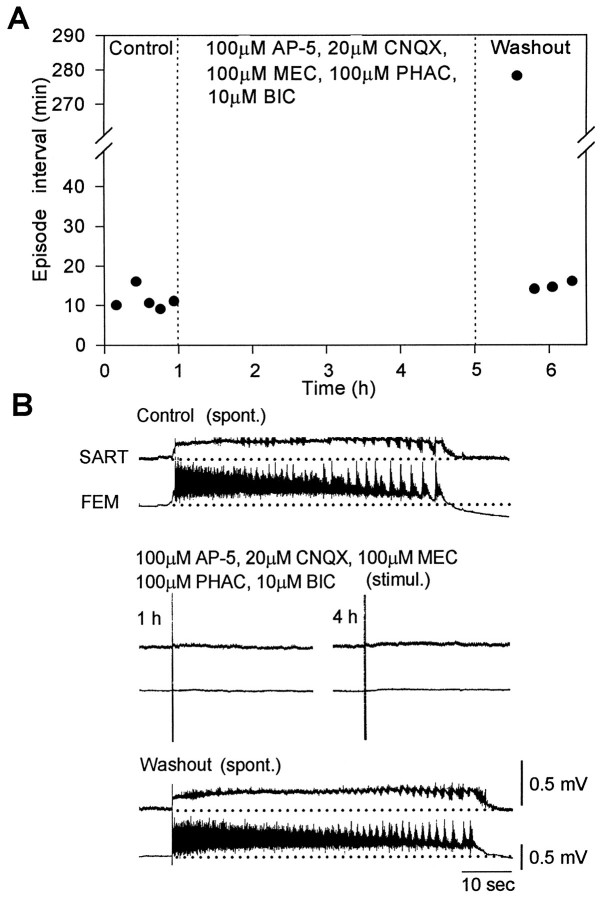
These findings suggest that after rhythmic activity recovers in the presence of excitatory amino acid and nicotinic cholinergic receptor antagonists, it is produced by networks that require functional GABAA (and possibly glycinergic) receptors. If this hypothesis is true, then we would expect that spontaneous activity should not recover when the spinal cord is superfused with a solution of agonists to glutamate, nicotinic cholinergic, and GABA receptors. To test this hypothesis, the spinal cord was superfused with a solution containing (in μm): 10 bicuculline, 100 AP-5, 20 CNQX, 100 mecamylamine, and 100 phaclofen (Fig.4). Under these conditions, both spontaneous and evoked rhythmic activity were blocked and did not recover over the 4 hr period that the drugs were applied (Fig.4A). Significantly, during this period, ventral root potentials evoked by electrical stimulation of the ventral spinal cord were barely detectable, suggesting very little residual network function (Fig. 4B, middle). Shortly after the drugs were washed out, the spontaneous activity resumed, and the episode structure was similar to control recordings (Fig.4B).
Fig. 4.
Spontaneous and evoked rhythmic activity is blocked in the presence of glutamate, nicotinic cholinergic, and GABA receptor antagonists. A, Plot of the intervals between spontaneous episodes in control Tyrode’s solution (left), in the presence of 100 μm AP-5, 20 μm CNQX, 100 μm MEC, 100 μmPHAC, and 10 μm BIC (middle), and during washout in control Tyrode’s solution (right).B, Example of a spontaneous rhythmic episode (spont.) recorded from sartorius (SART) and femorotibialis (FEM) muscle nerves in control Tyrode’s solution (top). Electrical stimulation (stimul.) of the spinal cord at 1 and 4 hr after application of the antagonists did not evoke a significant response in the muscle nerves (middle). A spontaneous episode recorded 60 min after starting the washout is shown (bottom).
These results suggest that after glutamatergic and cholinergic blockade, both spontaneous activity and episode generation primarily depend on GABAergic activity. It is important to emphasize that none of the results we have described so far exclude the existence of changes in other systems that we have not assayed (e.g., amines, neuropeptides, neurotrophins, and ion release), that could influence network excitability. However, we can conclude that any such changes cannot support either spontaneous activity or episode generation in the absence of glutamatergic, cholinergic and GABAergic neurotransmission (see Discussion).
Occurrence of spontaneous rhythmic activity in the presence of glycine and GABA blockade
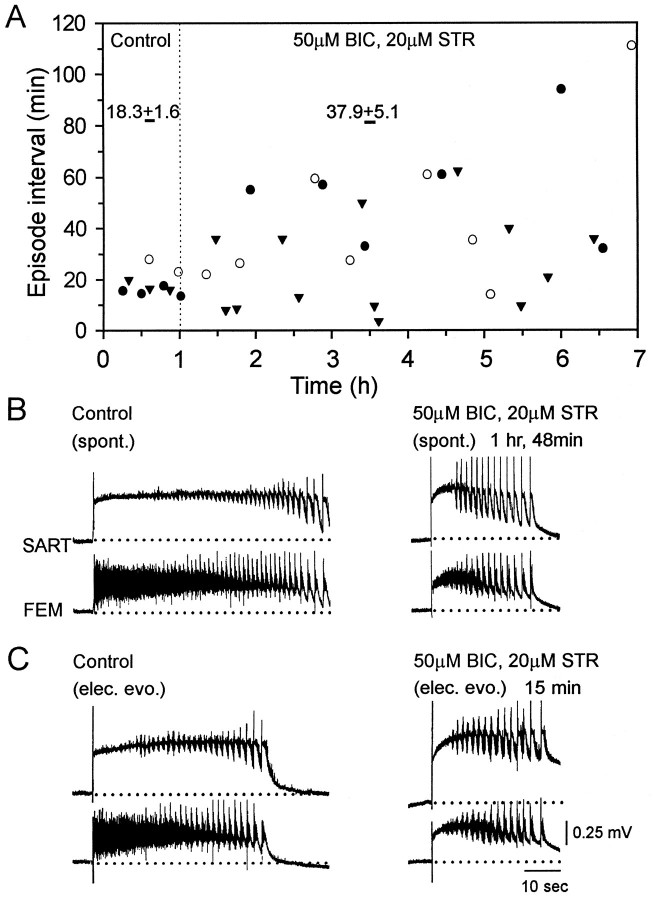
The results described in the previous section suggest that rhythmic activity can recover in the presence of glutamatergic and cholinergic blockade and can be supported by glycinergic and GABAergic networks. The goal of the next set of experiments was to establish whether spontaneous or evoked rhythmic activity could occur during blockade of glycine and GABAergic receptors. This was accomplished by examining the effects of bath-applied bicuculline (50 μm) and strychnine (20 μm). In some experiments we added the GABAB antagonists 5-AVA (1 mm) and 2-hydroxysaclofen (100 μm) to the glycine and GABA antagonists. We found that spontaneous rhythmic activity was still expressed in the presence of the drugs, although at a lower frequency than in the control period. In contrast to the effects of glutamatergic and cholinergic blockade, the frequency of episodes did not show any recovery even 6 hr after the application of the antagonists (Fig.5A). During glycine and GABA receptor blockade, the average interval between spontaneous episodes was 37.9 ± 5.1 min, compared with a control interval of 18.3 ± 1.6 min (n = 3; Fig. 5A). In addition, the intervals between bursts became highly variable (Fig.5A).
Fig. 5.
Rhythmic activity slows in the presence of glycine and GABA antagonists. A, Plot of the interval between spontaneous episodes in control Tyrode’s solution (left) and in the presence of 50 μm BIC and 20 μm STR (right) for three experiments. Numbers over the data pointsare the mean ± SEM of the episode intervals for that period.B, Examples of the spontaneous rhythmic episodes (spont.) recorded from sartorius (SART) and femorotibialis (FEM) muscle nerves in control Tyrode’s solution (left) and in the presence of 50 μm BIC and 20 μm STR (right) (1 hr 48 min after first applying the antagonists). C, Electrically evoked (elec. evo.) rhythmic episodes in control Tyrode’s solution (left) and 15 min after beginning bath application of the glycine and GABA antagonists (right) are shown.
Electrical stimulation of the spinal cord 15 min after the application of the antagonists evoked a rhythmic episode (Fig. 5C), indicating that these drugs alone are insufficient to prevent episode generation.
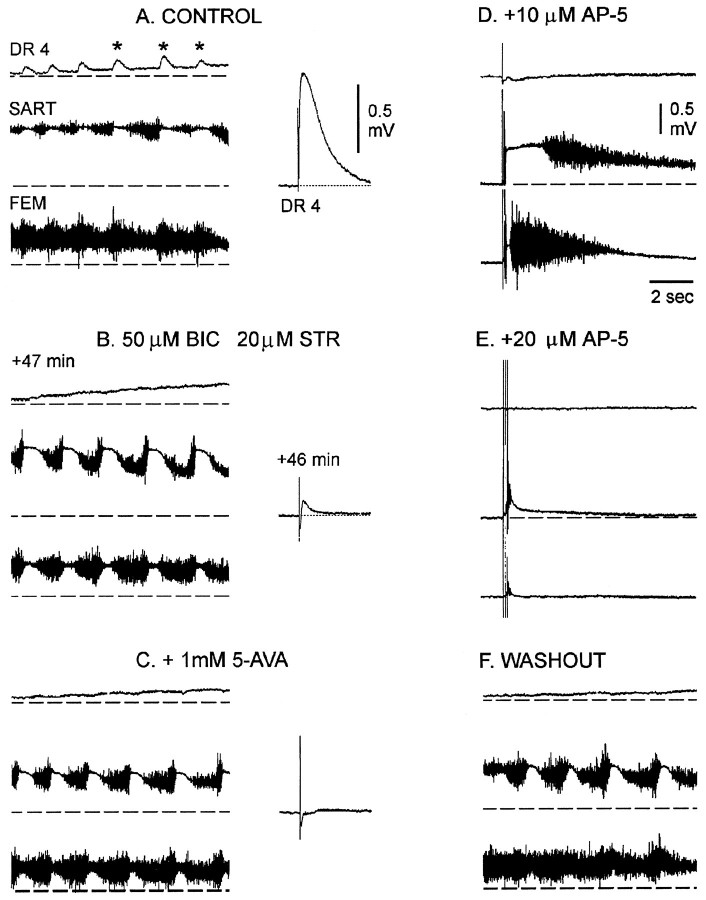
Spontaneous or evoked episodes in the presence of the glycine and GABA antagonists differed from the predrug activity in several ways. In the presence of the drugs the episodes were substantially shorter (18.9 ± 1.8 sec, 14 episodes, four experiments) than the controls (43.1 ± 3.8 sec, 14 episodes, four experiments) (see Fig.5B,C, right). In addition, the pattern of nerve discharge differed from the control in that a pause in firing was induced in the discharge of each cycle of femorotibialis discharge, confirming earlier findings (Sernagor et al., 1995) (Fig.6A,B, compareleft panels). Although these alterations in the timing of discharge indicated that the antagonists remained functional during the recovery period, we sought direct evidence for this by examining dorsal root potentials, which are known to be sensitive to glycine and GABA antagonists (M. J. O’Donovan, unpublished data). Dorsal root potentials are depolarizing responses that can be recorded from the dorsal roots in response to stimulation of adjacent dorsal roots and are presumed to be electrotonically recorded potentials generated synaptically in the axons of primary afferent fibers (Eccles et al., 1963). After bath application of bicuculline (50 μm) and strychnine (20 μm), the evoked dorsal root potential was depressed greatly (Fig. 6B, middle), and the cyclical depolarization of the dorsal root potential (Fig.6A, asterisks) was abolished (see alsoChub and Baev, 1991). The evoked dorsal root potential was depressed further when the GABAB antagonist 5-AVA was added to the glycine and GABA amino acid antagonists. Addition of the GABAB antagonists did not affect the occurrence of spontaneous activity, although it did depress the amplitude of the slow potentials recorded from the muscle nerves (Fig. 6C).
Fig. 6.
Dorsal root reflexes and potentials are blocked, although rhythmic activity occurs in the presence of glycine and GABA antagonists. A–C, The left panels show rhythmic dorsal root potentials recorded from lumbosacral root (DR4) together with muscle nerve activity recorded during an episode of rhythmic activity in control Tyrode’s solution (A), in the presence of 50 μm BIC and 20 μm STR (B), and when the GABAB antagonist 5-AVA was added to the other drugs (C).B, The recordings were made at the times shown after initial application of the drugs. The asterisks on the dorsal root recording (A, left) illustrate the cyclical component of the dorsal root potential that coincides with the pause in sartorius discharge. A–C, The right panels show the responses in the LS4 dorsal root (DR4) generated by electrical stimulation of the adjacent LS5 dorsal root (single stimulus, 0.5 msec, 25 μA) under the same conditions. D, E, Responses recorded from DR4 and the muscle nerves in response to three stimuli applied to the spinal cord after 10 μm (D) and 20 μm (E) AP-5 were added to the glycine and GABA antagonists. F, Rhythmic activity could be recorded 30 min after washout of the AP-5 but in the presence of the other drugs. Dashed lines are the baseline potentials before the onset of the rhythmic episode.
These findings suggest that spinal networks comprising predominantly glutamatergic and cholinergic interconnections are capable of supporting rhythmic activity. To test this idea, we examined the sensitivity of these networks (in the presence of glycine and GABA blockade) to excitatory amino acid blockade. We found that bath application of low doses of AP-5 (10–20 μm) blocked the recovered activity. After washout of the AP-5 (but maintaining the glycine and GABA antagonists), the spontaneous activity recovered (Fig.6F). Although we did not test the effect of other excitatory amino acid antagonists, these findings were consistent with the idea that rhythmic activity expressed in the presence of glycine and GABA receptor antagonists was generated predominantly by excitatory synaptic networks.
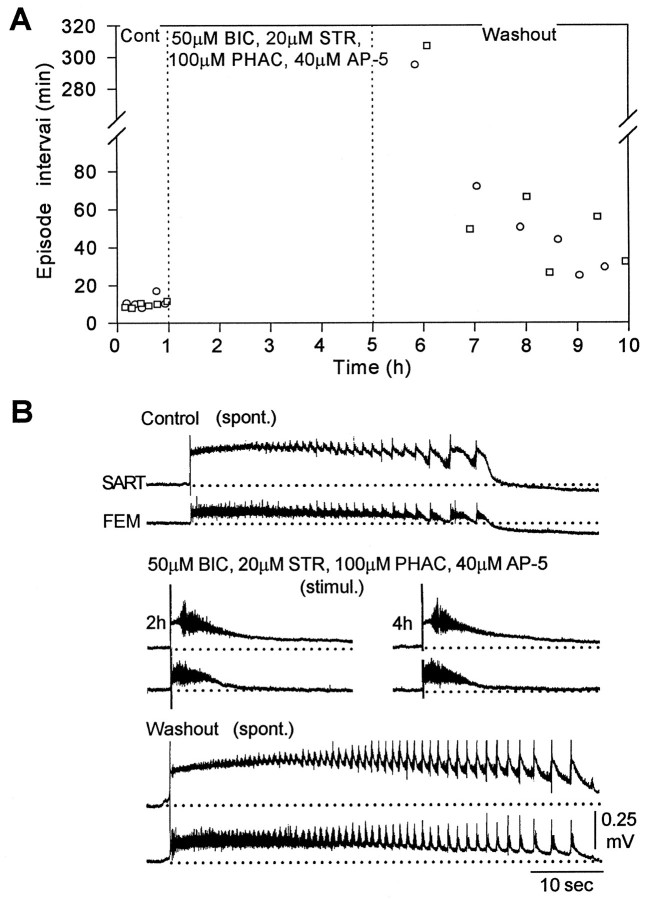
If glutamatergic and cholinergic networks generate the rhythmic activity in the presence of bicuculline and strychnine, then we predicted that addition of an excitatory antagonist should block all spontaneously occurring activity. This prediction was confirmed when 40 μm AP-5 was added to the glycine and GABA antagonists (Fig. 7A, two experiments). Furthermore, electrical stimulation of the spinal cord at 2 and 4 hr failed to evoke multicycle activity, although it did evoke a single abnormal cycle of alternating discharge from the sartorius and femorotibialis muscle nerves (Fig. 7B). This residual activity may have been mediated by AMPA/kainate or cholinergic receptors that were not blocked. When the drugs were washed out, spontaneous activity reappeared (Fig. 7A,washout, B, bottom), although its rate of occurrence never returned to control values. Rather, the interval between episodes progressively declined over a 5 hr period (Fig.7A). This differed considerably from the behavior of spontaneous activity after washout of the excitatory antagonists and bicuculline. After washout of these drugs, spontaneous activity recovered to control levels within 1 hr (Fig.4A).
Fig. 7.
Spontaneous rhythmic activity does not recover in the presence of glycine, GABA, and NMDA receptor antagonists.A, Plot of the interval between spontaneous episodes in control Tyrode’s solution (left), in the presence of 50 μm BIC, 20 μm STR, 100 μmPHAC, and 40 μm AP-5 (middle), and after washout of the drugs (right). B, An episode of spontaneous activity (spont.) in control Tyrode’s solution (top), electrically evoked activity 2 hr and 4 hr after application of the bicuculline, strychnine, and AP-5 (middle), and an episode of spontaneous activity during drug washout (bottom).
Changes in the rhythmic synaptic currents of ventral spinal neurons in the presence of neurotransmitter antagonists
The pharmacological experiments described in the previous sections suggest that rhythmic activity can be generated by a network comprising predominantly glutamatergic and cholinergic or predominantly glycine and GABA synaptic connections. If this hypothesis is true, then we would expect corresponding changes in the equilibrium potential of the rhythmic synaptic drive potentials. We recognized the limitations associated with the measurement of equilibrium potentials in cells embedded within the spinal cord. However, we were primarily interested in documenting the changes after recovery of activity in the presence of the antagonists. Therefore, we made whole-cell voltage-clamp (n = 19 cells) and discontinuous current-clamp (n = 18 cells) recordings from ventrally located spinal neurons before and during the recovery of spontaneous activity in the various transmitter antagonists. Although they were not identified, this population of cells probably included both interneurons and motoneurons.
Apparent equilibrium potentials of rhythmic synaptic currents after glutamatergic and cholinergic receptor blockade
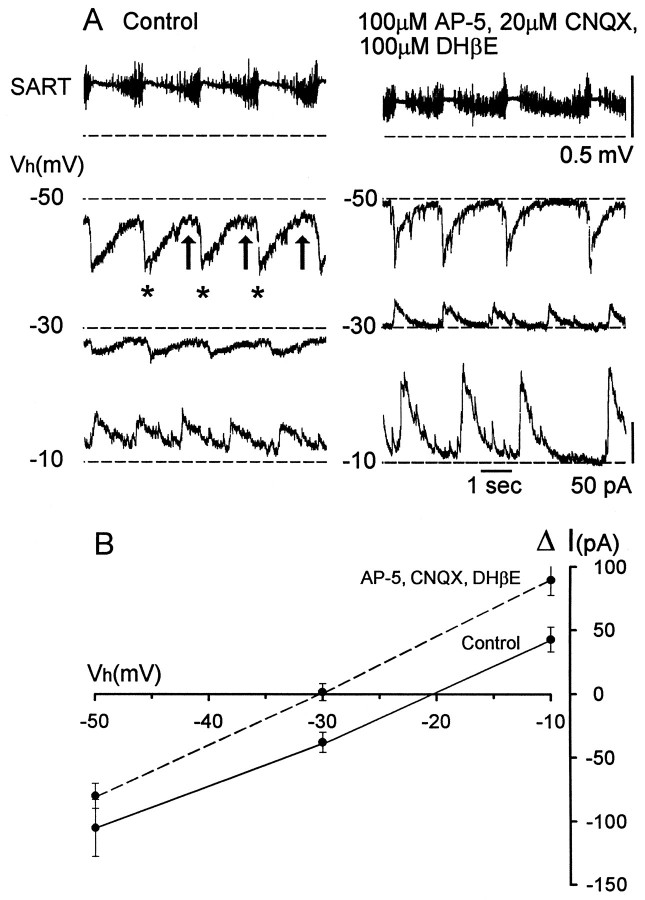
The form and apparent equilibrium potential of rhythmic synaptic currents changed when rhythmic activity recovered in the presence of excitatory amino acid and cholinergic antagonists. This can be seen in the experiments illustrated in Figure 8. The control recordings show that the rhythmic synaptic drive exhibits two components at a holding potential of −50 mV, as reported previously for some classes of motoneuron (Sernagor and O’Donovan, 1991). A rapid inward current (Fig. 8A,asterisks) occurs at the onset of the pause in sartorius discharge and a slower sustained current (arrows) is coincident with the discharge in the muscle nerve (Fig. 8A,left). At a holding potential of −30 mV, the rapid inward current was substantially reduced, and it reversed at −10 mV. In control recordings, the apparent reversal potential for the currents was −20.3 ± 1.1 mV (five cells, three experiments).
Fig. 8.
The apparent equilibrium potential of the rhythmic synaptic drive recorded in unidentified ventral spinal neurons shifts toward the GABAA equilibrium potential in the presence of glutamate and nicotinic cholinergic antagonists. A, Examples of rhythmic synaptic currents at different holding potentials [Vh (mV)] in control Tyrode’s solution (left panels) and in the presence of glutamate and nicotinic cholinergic synaptic potentials (right panels) during an episode of rhythmic activity. The top traces indicate the simultaneously recorded sartorius muscle nerve activity associated with the recordings made at −50 mV. Dashed lines are the current levels before the rhythmic episode. Currents shown in theleft and right panels were recorded from two different cells. B, AveragedI–V plots for synaptic currents recorded from five cells in control Tyrode’s solution (solid line) and from five cells in the presence of excitatory antagonists (dashed line). Error bars indicate SEM.
When rhythmic activity recovered in the presence of AP-5, CNQX, and DHβE, the apparent equilibrium potential for the rhythmic currents shifted to −30.6 ± 1.3 mV, ∼10 mV more negative than in the control recordings (Fig. 8A, right). Furthermore, the form of the synaptic current changed. At each holding potential the current was briefer and decayed more rapidly than the control currents. The peak amplitude of the current in control recordings was −109 ± 20.8 pA when measured at −50 mV (five episodes, five cells at −50 mV), and this decreased to −80 ± 9.9 pA (five episodes, five cells) after recovery during glutamatergic and cholinergic blockade.
These findings are consistent with the idea that the nature of the synaptic drive to motoneurons and other spinal interneurons changed after recovery from glutamatergic and cholinergic receptor blockade. The apparent equilibrium potential shifted in a negative direction, consistent with the drive being derived primarily from GABAergic or glycinergic synaptic inputs.
Apparent equilibrium potentials of rhythmic synaptic currents during GABAA blockade
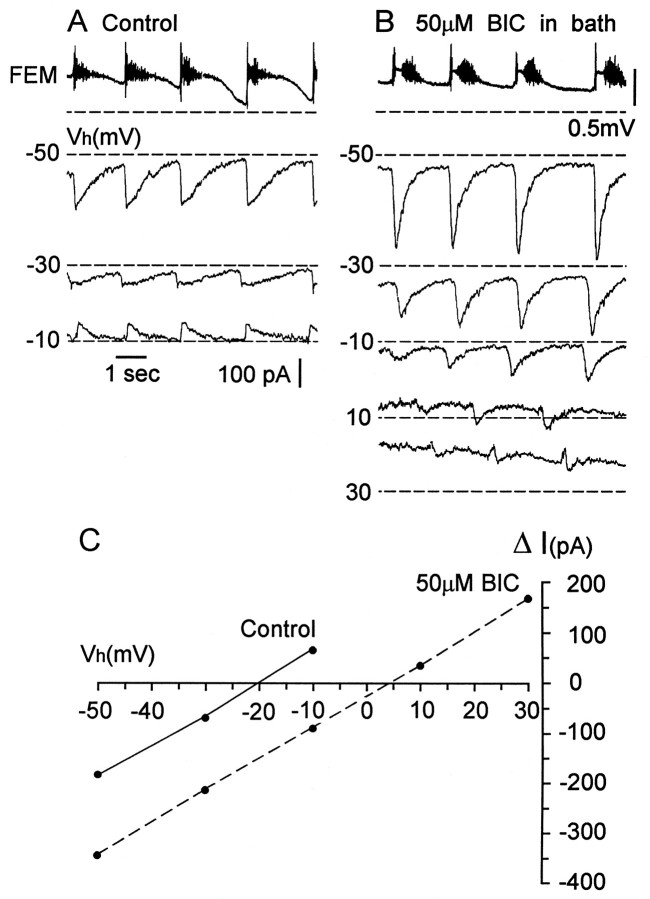
We then examined the change in the rhythmic synaptic currents after recovery of activity in the presence of bath-applied bicuculline (three experiments). These results are illustrated in Figure9. After recovery of rhythmic activity in the presence of 50 μm bicuculline, the peak inward currents were significantly larger than the control currents at a holding potential of −50 mV. The peak amplitude of the inward current in control recordings was −130 ± 14.8 pA (five cells, five episodes), and this increased to −305 ± 21.9 pA (five cells, five episodes) after recovery in the presence of bicuculline. At very positive holding potentials (+10 and +30 mV) the currents reversed, and they appeared to be dominated by a tonic component. The apparent reversal potential averaged +3.4 ± 1.24 mV in the presence of bicuculline (five cells), which was 23 mV more positive than the apparent equilibrium potential in control recordings (−20.3 ± 0.8 mV, five cells).
Fig. 9.
The apparent equilibrium potential of the rhythmic synaptic drive in an unidentified ventral spinal neuron shifts toward the glutamate equilibrium potential in the presence of bicuculline.A, B Activity recorded from the femorotibialis (FEM) muscle nerve and the rhythmic synaptic currents at different holding potentials [Vh (mV)] during a rhythmic episode in control Tyrode’s solution (A) and during bath application 50 μm BIC (B). The FEMnerve activity corresponds only to the current traces atVh = −50 mV. Dashed lines in the current traces indicate the current level before the rhythmic episode. The recordings shown in A and B were obtained from the same cell. C,I–V plots for the synaptic currents recorded from the cell shown in A and Bin control Tyrode’s solution (solid line) and in the presence of 50 μm BIC (dashed line).
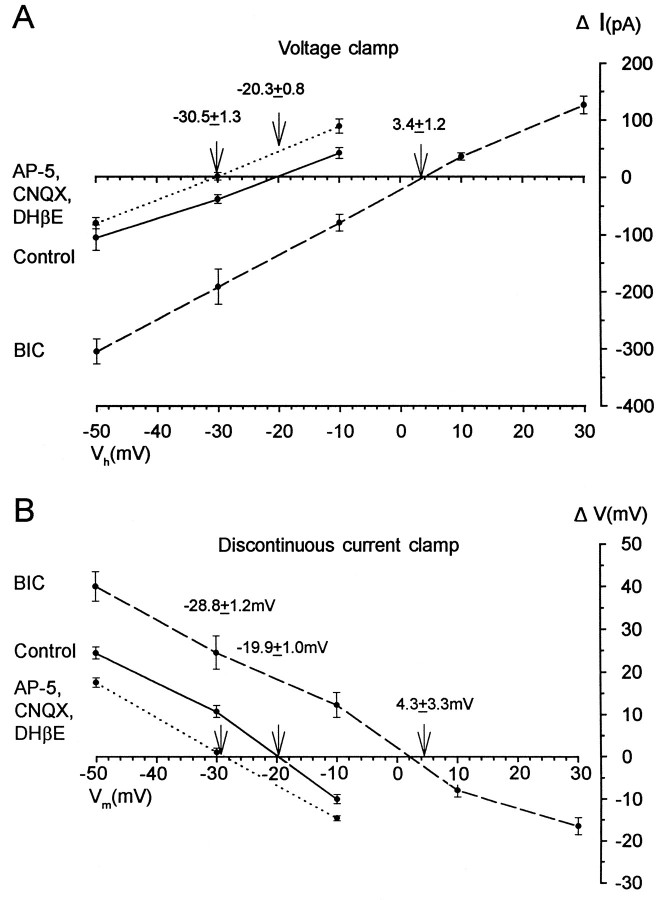
The changes in the apparent equilibrium potential are summarized in Figure 10, which shows theI–V plots obtained during voltage clamp for three conditions: control, glutamatergic and cholinergic blockade, and bicuculline application. The changes in the apparent equilibrium potential observed are consistent with the notion that rhythmic activity is supported primarily by GABAergic (and possibly glycinergic) networks during glutamatergic and cholinergic blockade and, conversely, by glutamatergic and cholinergic networks after bicuculline application.
Fig. 10.
Summary of the changes in the apparent equilibrium potential of the rhythmic synaptic drive measured under voltage and discontinuous current clamp. A, B, AveragedI–V plots for synaptic current and averaged I–V plots for synaptic potentials recorded in control Tyrode’s solution (solid lines), in the presence of excitatory antagonists (short dashed lines), and in the presence of glycine and GABA antagonist (long dashed lines). The arrowsand numbers indicate the mean apparent equilibrium potential. Error bars indicate SEM.
The I–V relation for the rhythmic current measured in control Tyrode’s or bicuculline was surprisingly linear, given the known voltage dependence of the NMDA channel. Although this observation might suggest that NMDA receptors are not engaged during a rhythmic episode, this seems unlikely, given the effects of AP-5 on the expression of rhythmic activity in the presence of glycine and GABAergic antagonists (Fig. 6). An alternative possibility, the one we consider most likely, is that the voltage dependence of the NMDA channel is abolished by the shunting effects of other rhythmically active synaptic conductances (O’Donovan, 1989a; Sernagor et al., 1995). Indeed, it has been shown in the lamprey spinal cord that simultaneous activation of NMDA and non-NMDA receptors can abolish the voltage dependency of the NMDA channel (Moore et al., 1995).
We were concerned, when making voltage-clamp measurements, that the uncompensated series resistance might lead to errors. Therefore, we repeated the experiments in 18 cells using discontinuous current clamp (DCC). These results are illustrated in Figure 10Band compared with the voltage-clamp measurements (Fig.10A). In control recordings the apparent reversal potential for the rhythmic potentials was −20.3 ± 0.8 mV under voltage clamp, compared with −19.9 ± 1.0 mV using DCC. After glutamatergic and cholinergic blockade, the values were −30.5 ± 1.3 mV for voltage clamp and −28.8 ± 1.2 mV for DCC. During bicuculline administration they were 3.4 ± 1.2 mV (voltage clamp) compared with 4.3 ± 3.3 mV (DCC). These results indicate that uncompensated series resistance does not lead to significant errors in the estimate of the reversal potentials. This is probably because the series resistance was small in comparison with the input resistance of the cells (Rin = 545 ± 59 MΩ, 16 cells).
The amplitude of spontaneous synaptic currents increases during recovery in glutamatergic and cholinergic receptor antagonists
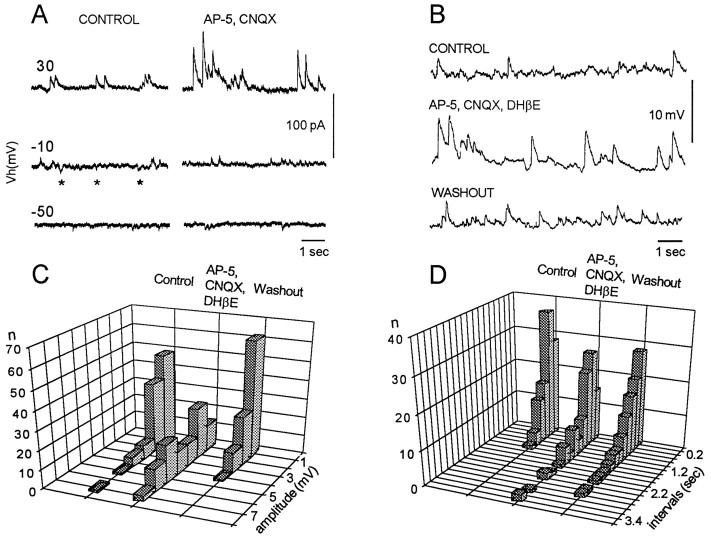
In the interval between spontaneous episodes, it was possible to record spontaneous synaptic potentials or currents when recording intracellularly from ventrally located spinal neurons. During glutamatergic and cholinergic blockade spontaneous currents were easily detected at Vh = +30 mV (Fig.11A). However, at this holding potential cells could be damaged within 10–20 min. Therefore, measurement of the amplitudes and interevent intervals was made using current clamp at −50mV (Fig. 11B). Measurements from one cell are shown in Figure 11C. This figure shows that the amplitude of spontaneous synaptic potentials increased from a control value of 1.6 ± 0.1 mV to 3.6 ± 0.2 mV (100 events) during glutamatergic and cholinergic blockade and returned to 1.8 ± 0.1 mV during the washout. The interval between events did not change significantly in the presence of the antagonists. The interval between synaptic events was 0.6 ± 0.05 sec in the control and 0.8 ± 0.09 sec during glutamatergic and cholinergic blockade.
Fig. 11.
The amplitude of spontaneous postsynaptic events recorded in ventral spinal neurons increases after application of the excitatory antagonists. A, Spontaneous postsynaptic currents at different holding potentials [Vh (mV)] recorded in control Tyrode’s solution (left) and 60 min after bath application 100 μm AP-5 and 20 μm CNQX (right). Theasterisks indicate the presence of spontaneous inward currents that disappear after glutamate and nicotinic cholinergic blockade. B, Spontaneous postsynaptic potentials in control bath solution (top), 50 min after bath application of 100 μm AP-5, 20 μm CNQX, and 100 μm DHβE (middle), and 60 min after washout (bottom). Membrane potential was −50 mV.C, D, Histograms of the amplitudes (C) and interevent intervals (D) measured for 100 events for the cell shown inB.
Although we do not know the origin of these potentials, it seems reasonable to assume they are derived from release of either GABA or glycine. If so, this finding raises the possibility that some aspect of GABAergic or glycinergic synaptic transmission is altered in the presence of excitatory amino acid and cholinergic receptor blockade (see Discussion).
DISCUSSION
This work has revealed an unsuspected and surprising robustness in the behavior of the networks generating spontaneous rhythmic activity in the developing spinal cord. Spontaneous rhythmic activity can be expressed by networks comprising primarily either glycine and GABA connections or glutamatergic and nicotinic cholinergic connections. Furthermore, after glutamatergic and cholinergic receptor blockade, the network output progressively recovers (after an initial period of inactivity) to stabilize near the control level of activity. Such recovery was not seen after blockade of glycinergic and GABAergic connections; instead the frequency of spontaneous episodes slowed and became erratic.
Spontaneous rhythmic activity is a general property of developing spinal networks
We hypothesized previously that rhythmic activity generated by the developing spinal cord is produced by immature networks of the central pattern generator for locomotion (O’Donovan et al., 1992). The work reported here, considered with other evidence, has led us to another conclusion: that spontaneous activity is a general property of developing spinal networks rather than the product of an immature locomotor pattern generator.
We have reached this conclusion for the following reasons. First, the results of the present work show that spontaneous rhythmic activity can be produced by very different spinal networks, comprising predominantly glutamatergic (and possibly cholinergic) or alternatively GABAergic (and possibly glycinergic) connections. It is difficult to reconcile this finding with the detailed and specific synaptic connections that are often assumed to underlie central pattern-generating circuits in many other species (Grillner and Matsushima, 1991; Selverston, 1992;Arshavsky et al., 1993). It might be argued that our observations could be interpreted as a manifestation of the redundancy that appears to exist in several locomotor central pattern generators. For example, reciprocal glycinergic inhibition of half-centers has been proposed to be one of the important mechanisms for left–right alternation during swimming in the lamprey and the Xenopus embryo (Grillner and Matsushima, 1991; Roberts and Tunstall, 1990). In the lamprey, blockade of strychnine-sensitive inhibition alters, but does not prevent, the generation of rhythmic activity (Cohen and Harris-Warrick, 1984;McPherson et al., 1994), and longitudinal section of theXenopus spinal cord does not prevent rhythmic activity (Kahn and Roberts, 1982). This type of result has led to the idea that central pattern generators use multiple mechanisms for rhythm and perhaps pattern generation, and that inactivation of one mechanism results in the predominance of another. We think this is an unlikely explanation of our results, because, to our knowledge, none of the spinal pattern-generating networks described in vertebrates can maintain either the alternation of flexors and extensorsor rhythmic activity in the presence of cholinergic and glutamatergic receptor blockade.
Second, the networks responsible for rhythmic output are not well localized within the developing spinal cord. Isolated strips of either the ventral or the lateral cord can generate rhythmic activity (Ho and O’Donovan, 1993). Considered together with the observation that networks restricted to the dorsal horn can generate spontaneous activity during development (Chub and Baev, 1991), these findings indicate that nonlocomotor spinal networks are active during development.
Finally, spontaneous activity in ventral networks of the chick cord is expressed transiently in development and is lost by E16–E20, to be replaced by the coordinated behaviors that are regulated by descending commands. The transient expression of spontaneous activity appears to be a general characteristic of developing networks and is not unique to the spinal cord. It is now recognized that other regions of the developing nervous system, including the cortex and the retina, can express spontaneous activity briefly during their development (Ben-Ari et al., 1989; Yuste et al., 1995; Feller et al., 1996).
Genesis of spontaneous activity in the normal cord
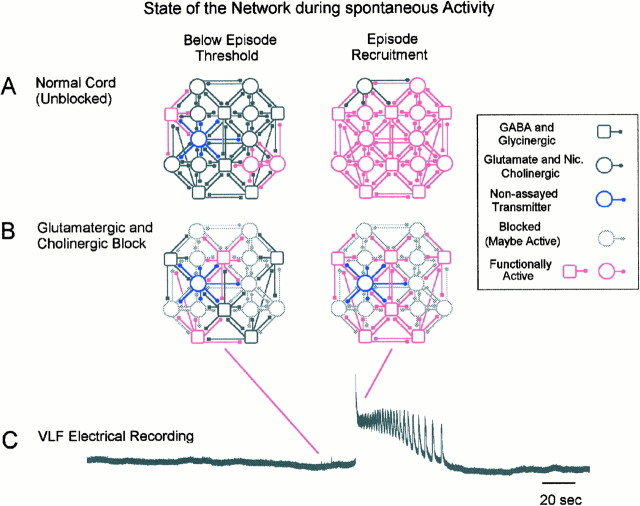
To explain the changes in the network behavior after the various pharmacological treatments, it is necessary to review the mechanisms we believe are responsible for rhythmic activity in the normal spinal cord. We have recently proposed a conceptual model to account for the occurrence of spontaneous activity and the production of rhythmic episodes (described by O’Donovan and Chub, 1997; O’Donovan and Rinzel, 1997) (Fig. 12). A similar model has been developed by Senn et al. (1996) to account for the spontaneous behavior of cultured spinal neurons. In this model, rhythmic activity is generated by an interneuronal network comprising functionally excitatory connections, which is subject to a periodic variation in excitability. This variation arises in the following manner. Once an episode occurs, it produces synaptic depression in active terminals (Fedirchuk and O’Donovan, 1996) and also results in a postepisode hyperpolarization of the active cells (Chub and O’Donovan, 1995). As the synaptic depression recovers and the membrane spontaneously depolarizes, some neurons begin to fire. The source of the spontaneous depolarization is not understood, but it may involve a modulation of GABA and glutamate receptor function or release of these transmitters into the extracellular space (Chub and O’Donovan, 1995;O’Donovan and Chub, 1997). Once a critical number of neurons is active, excitation propagates rapidly throughout the whole network (Fig. 12A). After the network is recruited, it continues to oscillate for a period by a mechanism that is not understood (for a discussion of possible mechanisms, see O’Donovan and Chub, 1997). The network activity results in synaptic depression and postepisode hyperpolarization, which act to terminate the episode. As these processes recover, spontaneous activity can recur.
Fig. 12.
Diagram illustrating hypothesized mechanism for spontaneous activity in the normal spinal cord and after neurotransmitter blockade. The network diagrams show excitatory (glutamate and nicotinic cholinergic) and GABA and glycinergic interconnections within a region of the ventral spinal cord. The majority of cells are assumed to use these transmitters, but a subpopulation may not (blue cell). The state of this network is illustrated at two time points during the occurrence of spontaneous activity. These points are indicated on the electrical recording from the ventrolateral funiculus (C, VLF) of a spontaneous episode of rhythmic activity. Theleft schematics show the state of the normal unblocked network (A) and the network in the presence of glutamatergic and cholinergic antagonists (B) shortly before the occurrence of a spontaneous episode. At this time there are only a few spontaneously active cells that are functionally connected (left, red). Blocked cells (B, left, gray) may also be active, but their output does not contribute to network activity. In the right schematics, the network has been fully recruited, and this activity can be recorded from the ventrolateral funiculus or motor nerves as an episode of rhythmic activity. Nic., Nicotinic.
One important characteristic of this model is that the frequency of spontaneous activity will be related to the number of functionally connected neurons in the network. A reduction in this number will decrease the rate of spontaneous activity, because more neurons will have to be active before the network triggers. Furthermore, if the network has fewer functional neurons, the episodes may be shorter (Ho and O’Donovan, 1993; O’Donovan and Chub, 1997). This feature of the model will be important in explaining the behavior of spinal networks in the presence of the antagonists.
Genesis of spontaneous activity produced by blocked networks
We presume that activity of the blocked networks is produced in a manner similar to that of the normal spinal cord, an assumption that will have to be verified in future experiments. Accordingly, the cells that remain functional in the blocked networks will be subject to the same activity-dependent synaptic depression and postepisode hyperpolarization that occurs in the normal network. We further assume that network activity generated in the presence of either set of antagonists is produced by the same mechanism, because in each case, the connections that remain are functionally excitatory.
In the presence of glutamatergic and nicotinic cholinergic receptor antagonists, activity is probably mediated primarily by glycinergic and GABAergic synapses (Fig. 12B). We conclude this for two reasons. First, the apparent equilibrium potential for the rhythmic synaptic drive of ventral spinal neurons is approximately −30 mV. This is close to the reported GABAA equilibrium potential of developing Xenopus spinal neurons (Rohrbough and Spitzer, 1996), and it is probably similar in chick spinal neurons (O’Donovan, 1989a; Sernagor et al., 1995) (N. Chub and M. J. O’Donovan, unpublished data). Second, when GABA receptor blockers are included with the glutamatergic and cholinergic antagonists, spontaneous and evoked activity is completely blocked (Fig. 4). Rhythmic activity generated in the presence of glycine and GABA receptor antagonists is likely to be generated by excitatory amino acids and possibly cholinergic connections.
In Figure 12 we illustrate these mechanisms using a GABA and glycinergic network as an example. When the antagonists are first applied, a fraction of the neurons will be removed from the circuit (Fig. 12B, gray cells). As a consequence, spontaneous activity will slow, because more neurons have to be active before the threshold for network recruitment is reached. A rhythmic episode will be generated after a critical number of active neurons trigger the explosive recruitment of the network (Fig.12B). Because the number of active neurons is reduced in the presence of the antagonists, the episodes will be shorter, as we observed experimentally.
Recovery of activity during glutamatergic and cholinergic blockade
When the GABA and glycinergic antagonists were applied, spontaneous activity slowed and showed no tendency to change thereafter. In contrast, spontaneous activity was abolished for up to 90 min after the initial application of glutamatergic and cholinergic antagonists. When it recovered, the rate of occurrence increased progressively to stabilize near the control level. We do not know the mechanism of this recovery. However, it cannot be attributable simply to the elevated concentration of K+ in the Tyrode’s solution (5 vs 2.9 mm) used in these experiments, because a similar recovery has been observed in normal K+concentration after blockade of NMDA receptors (Barry and O’Donovan, 1987, their Fig. 3).
Two observations implicate GABA or glycinergic transmitter function in the recovery. First, this type of recovery did not occur when GABAergic and glycinergic function was blocked. Instead the rate of spontaneous activity slowed and did not change over the 6 hr monitoring period. Second, during glutamatergic and cholinergic blockade, we observed an increase in the amplitude of spontaneously occurring synaptic potentials. Although the origin of these potentials is unknown, it seems reasonable to assume that they arise from glycinergic or GABAergic terminals, first, because the currents reverse between −50 and −10 mV (Fig. 11A), and second, because GABA and glycine are the dominant functional transmitters after excitatory blockade (Figs. 3, 4). If such changes reflect an increase in functional connectivity within the network, this will result in more frequently occurring episodes, because the threshold for network recruitment will be reduced.
We recognize that several other mechanisms could be involved in this recovery, including changes in the rate constants for the recovery from synaptic depression, a more rapid postepisode depolarizing ramp, or changes in neurotransmitters or modulators that we have not assayed. For example, the reduced activity that initially follows application of the glutamatergic and cholinergic antagonists might result in the release of serotonin or some other factor that can increase neuronal excitability (Muramato et al., 1996). An increase in neuronal excitability will increase the rate of occurrence of episodes. In addition, it is possible that other activity-sensitive processes could be involved, similar to those described for the regulation of firing patterns in cultured stomatogastric neurons (Siegel et al., 1994;Turrigiano et al., 1994).
Whatever the mechanism for the recovery, our observations raise the possibility that the output of developing spinal networks is homeostatically regulated. Perhaps this is not surprising, given the importance of embryonic activity for several aspects of muscle and neuronal development (Toutant et al., 1979; Kalb and Hockfield, 1992;Garner et al., 1994; Mendelson, 1994). In future experiments it will be important to establish whether spinal network output is regulated in the absence of transmitter blockers and, if so, to identify the range and class of perturbations that can be compensated.
Footnotes
We thank Uri Cohen and Dr. Joel Tabak for their comments on this manuscript.
Correspondence should be addressed to Michael J. O’Donovan, Room 3A50, Building 49, National Institutes of Health, Bethesda, MD 20892.
REFERENCES
- 1.Alconero BB. The nature of the earliest spontaneous activity of the chick embryo. J Embryol Exp Morphol. 1965;13:255–266. [PubMed] [Google Scholar]
- 2.Arshavsky Y, Orlovsky GN, Panchin Y, Roberts A, Soffe SR. Neuronal control of swimming locomotion: analysis of the pteropod mollusc Clione and embryos of the amphibian Xenopus. Trends Neurosci. 1993;16:227–233. doi: 10.1016/0166-2236(93)90161-e. [DOI] [PubMed] [Google Scholar]
- 3.Barry M, O’Donovan MJ. The effects of excitatory amino acids and their antagonists on the generation of motor activity in the isolated chick cord. Dev Brain Res. 1987;36:271–276. doi: 10.1016/0165-3806(87)90030-7. [DOI] [PubMed] [Google Scholar]
- 4.Bekoff A. Ontogeny of leg motor output in the chick embryo: a neural analysis. Brain Res. 1976;106:271–291. doi: 10.1016/0006-8993(76)91025-8. [DOI] [PubMed] [Google Scholar]
- 5.Ben-Ari Y, Cherubini E, Corradetti R, Gaiarsa JL. Giant synaptic potentials in immature rat CA3 hippocampal neurones. J Physiol (Lond) 1989;16:303–325. doi: 10.1113/jphysiol.1989.sp017762. [DOI] [PMC free article] [PubMed] [Google Scholar]
- 6.Cherubini E, Gaiarsa JL, Ben-Ari Y. GABA: an excitatory transmitter in early postnatal life. Trends Neurosci. 1991;14:515–519. doi: 10.1016/0166-2236(91)90003-d. [DOI] [PubMed] [Google Scholar]
- 7.Chub NL, Baev KV. N-methyl-d-aspartate effect on spontaneous activity of 16–20 day old chick embryo spinal cord. Neirofiziologiia. 1991;23:205–213. [PubMed] [Google Scholar]
- 8.Chub N, O’Donovan MJ. Multi-functional actions of GABA in the regulation of spontaneous activity in the isolated spinal cord of the chick embryo. Soc Neurosci Abstr. 1995;21:688. [Google Scholar]
- 9.Chub N, O’Donovan MJ. Homeostatic regulation of rhythmic neural output in the developing chick spinal cord. Soc Neurosci Abstr. 1996;22:1377. [Google Scholar]
- 10.Cohen AH, Harris-Warrick RM. Strychnine eliminates alternating motor output during fictive locomotion in the lamprey. Brain Res. 1984;293:164–167. doi: 10.1016/0006-8993(84)91464-1. [DOI] [PubMed] [Google Scholar]
- 11.Eccles JC, Schmidt RF, Willis WD. Depolarisation of central terminals of group 1 afferent fibers of muscle. J Physiol (Lond) 1963;160:62–93. doi: 10.1113/jphysiol.1962.sp006835. [DOI] [PMC free article] [PubMed] [Google Scholar]
- 12.Fedirchuk B, O’Donovan MJ (1996) Evoked potentials are transiently depressed following rhythmic activity in the embryonic chick spinal cord. Soc Neurosci Abstr 22.1377.
- 13.Feller MB, Wellis DP, Stellwagen D, Werblin FS, Shatz CJ. Requirement for cholinergic synaptic transmission in the propagation of spontaneous retinal waves. Science. 1996;272:1182–1187. doi: 10.1126/science.272.5265.1182. [DOI] [PubMed] [Google Scholar]
- 14.Fields RD, Nelson PG. Activity-dependent development of the vertebrate nervous system. Int Rev Neurobiol. 1992;34:133–214. doi: 10.1016/s0074-7742(08)60098-7. [DOI] [PubMed] [Google Scholar]
- 15.Garner LK, Mendelson B, Albers KM, Kindy M, Overbeck TL, Davis BM. Ontogeny and effect of activity on proenkephalin mRNA expression during development of the chick spinal cord. J Comp Neurol. 1994;347:36–46. doi: 10.1002/cne.903470104. [DOI] [PubMed] [Google Scholar]
- 16.Grillner S, Matsushima T. The neural network underlying locomotion in Lamprey-synaptic and cellular mechanisms. Neuron. 1991;7:1–15. doi: 10.1016/0896-6273(91)90069-c. [DOI] [PubMed] [Google Scholar]
- 17.Hall BK, Herring SW. Paralysis and growth of the musculoskeletal system in the embryonic chick. J Morphol. 1990;206:45–56. doi: 10.1002/jmor.1052060105. [DOI] [PubMed] [Google Scholar]
- 18.Ho S, O’Donovan MJ. Regionalization and inter-segmental coordination of rhythm generating networks in the spinal cord of the chick embryo. J Neurosci. 1993;13:1345–1371. doi: 10.1523/JNEUROSCI.13-04-01354.1993. [DOI] [PMC free article] [PubMed] [Google Scholar]
- 19.Kahn JA, Roberts A. Experiments on the central pattern generator for swimming in amphibian embryos. Philos Trans R Soc Lond [Biol] 1982;296:229–243. doi: 10.1098/rstb.1982.0004. [DOI] [PubMed] [Google Scholar]
- 20.Kalb RG, Hockfield S. Activity-dependent development of spinal cord motor neurons. Brain Res Rev. 1992;17:283–289. doi: 10.1016/0165-0173(92)90020-m. [DOI] [PubMed] [Google Scholar]
- 21.Lee MT, Koebbe MJ, O’Donovan MJ. The development of sensorimotor synaptic connections in the lumbosacral spinal cord of the chick embryo. J Neurosci. 1988;8:2530–2543. doi: 10.1523/JNEUROSCI.08-07-02530.1988. [DOI] [PMC free article] [PubMed] [Google Scholar]
- 22.McPherson DR, Buchanan JT, Kasicki S. Effects of strychnine on fictive swimming in the lamprey: evidence for glycinergic inhibition, discrepancies with model predictions, and novel modulatory rhythms. J Comp Physiol [A] 1994;175:311–321. doi: 10.1007/BF00192990. [DOI] [PubMed] [Google Scholar]
- 23.Mendelson B. Chronic embryonic MK-801 exposure disrupts the somatotopic organization of cutaneous nerve projections in the chick spinal cord. Dev Brain Res. 1994;82:152–166. doi: 10.1016/0165-3806(94)90158-9. [DOI] [PubMed] [Google Scholar]
- 24.Moore LE, Buchanan JT, Murphey CR. Localization and interaction of N-methyl-d-aspartate receptors of lamprey spinal neurons. Biophys J. 1995;68:96–103. doi: 10.1016/S0006-3495(95)80163-3. [DOI] [PMC free article] [PubMed] [Google Scholar]
- 25.Muramoto T, Mendelson B, Phelan KD, Garcia-Rill E, Skinner RD, Puskarich-May C. Developmental changes in the effects of serotonin and N-methyl-d-aspartate on intrinsic membrane properties of embryonic chick motoneurons. Neuroscience. 1996;75:607–618. doi: 10.1016/0306-4522(96)00185-6. [DOI] [PubMed] [Google Scholar]
- 26.Nishimaru H, Iizuka M, Ozaki S, Kudo N. Spontaneous motoneuronal activity mediated by glycine and GABA in the spinal cord of rat fetuses in vitro. J Physiol (Lond) 1996;497:131–143. doi: 10.1113/jphysiol.1996.sp021755. [DOI] [PMC free article] [PubMed] [Google Scholar]
- 27.O’Donovan MJ. Motor activity in the isolated spinal cord of the chick embryo: synaptic drive and firing pattern of single motoneurons. J Neurosci. 1989a;9:943–958. doi: 10.1523/JNEUROSCI.09-03-00943.1989. [DOI] [PMC free article] [PubMed] [Google Scholar]
- 28.O’Donovan MJ. The development of recurrent motoneuronal connections in the spinal cord of the chick embryo. Soc Neurosci Abstr. 1989b;15:919. [Google Scholar]
- 29.O’Donovan MJ, Chub N. Population behavior and self-organization in the genesis of spontaneous rhythmic activity by developing spinal networks. Semin Cell Dev Biol. 1997;8:21–28. doi: 10.1006/scdb.1996.0117. [DOI] [PubMed] [Google Scholar]
- 30.O’Donovan MJ, Landmesser L. The development of hindlimb motor activity studied in the isolated spinal cord of the chick embryo. J Neurosci. 1987;7:3256–3264. doi: 10.1523/JNEUROSCI.07-10-03256.1987. [DOI] [PMC free article] [PubMed] [Google Scholar]
- 31.O’Donovan MJ, Rinzel J. Synaptic depression: a dynamic regulator of synaptic communication with varied functional roles. Trends Neurosci. 1997;20:431–433. doi: 10.1016/s0166-2236(97)01124-7. [DOI] [PubMed] [Google Scholar]
- 32.O’Donovan MJ, Ritter A. Optical recording and lesioning of spinal neurones during rhythmic activity in the chick embryo spinal cord. In: Taylor A, Gladden MH, Durbaba R, editors. Alpha and gamma motor systems. Plenum; New York: 1995. pp. 557–563. [Google Scholar]
- 33.O’Donovan MJ, Sernagor E, Sholomenko G, Ho S, Antal M, Yee W. The development of spinal motor networks in the chick embryo. J Exp Zool. 1992;261:261–273. doi: 10.1002/jez.1402610306. [DOI] [PubMed] [Google Scholar]
- 34.Perrins R, Roberts A. Cholinergic contribution to excitation in a spinal locomotor central pattern generator in Xenopus embryos. J Neurophysiol. 1995a;73:1013–1019. doi: 10.1152/jn.1995.73.3.1013. [DOI] [PubMed] [Google Scholar]
- 35.Perrins R, Roberts A. Cholinergic and electrical motoneuron-to-motoneuron synapses contribute to on-cycle excitation during swimming in Xenopus embryos. J Neurophysiol. 1995b;73:1005–1012. doi: 10.1152/jn.1995.73.3.1005. [DOI] [PubMed] [Google Scholar]
- 36.Persson M. The role of movements in the development of sutural and diarthrodial joints tested by long-term paralysis of chick embryos. J Anat. 1983;137:591–599. [PMC free article] [PubMed] [Google Scholar]
- 37.Roberts A, Tunstall MJ. Mutual re-excitation with post-inhibitory rebound: a simulation study on the mechanisms for locomotor rhythm generation in the spinal cord of Xenopus embryos. Eur J Neurosci. 1990;2:11–23. doi: 10.1111/j.1460-9568.1990.tb00377.x. [DOI] [PubMed] [Google Scholar]
- 38.Rohrbough J, Spitzer NC. Regulation of intracellular Cl− levels by Na(+)-dependent Cl− cotransport distinguishes depolarizing from hyperpolarizing GABAA receptor-mediated responses in spinal neurons. J Neurosci. 1996;16:82–91. doi: 10.1523/JNEUROSCI.16-01-00082.1996. [DOI] [PMC free article] [PubMed] [Google Scholar]
- 39.Ruano-Gil D, Nardi-Vilardaga J, Tejedo-Mateu A. Influence of extrinsic factors on the development of the articular system. Acta Anat (Basel) 1978;101:36–44. doi: 10.1159/000144947. [DOI] [PubMed] [Google Scholar]
- 40.Selverston AI. Pattern generation. Curr Opin Neurobiol. 1992;2:776–780. doi: 10.1016/0959-4388(92)90133-6. [DOI] [PubMed] [Google Scholar]
- 41.Senn W, Wyler K, Streit J, Larkum M, Luscher H-R, Mey H, Muller L, Stainhauser D, Vogt K, Wannier TH. Dynamics of a random neural network with synaptic depression. Neural networks. 1996;9:575–588. [Google Scholar]
- 42.Sernagor E, O’Donovan MJ. Whole cell patch clamp of rhythmically active motoneurons in the isolated spinal cord of the chick embryo. Neurosci Lett. 1991;128:211–216. doi: 10.1016/0304-3940(91)90263-s. [DOI] [PubMed] [Google Scholar]
- 43.Sernagor E, Chub N, Ritter A, O’Donovan MJ. Pharmacological characterization of the rhythmic synaptic drive onto lumbosacral motoneurons in the chick embryo spinal cord. J Neurosci. 1995;15:7452–7464. doi: 10.1523/JNEUROSCI.15-11-07452.1995. [DOI] [PMC free article] [PubMed] [Google Scholar]
- 44.Siegel M, Marder E, Abbott LF. Activity-dependent current distributions in model neurons. Proc Natl Acad Sci USA. 1994;91:11308–11312. doi: 10.1073/pnas.91.24.11308. [DOI] [PMC free article] [PubMed] [Google Scholar]
- 45.Toutant JP, Toutant MN, Renaud D, Le Douarin GH. Enzymatic differentiation of muscle fiber types in embryonic latissimus dorsi of the chick: effects of spinal cord stimulation. Cell Differ. 1979;8:375–382. doi: 10.1016/0045-6039(79)90022-8. [DOI] [PubMed] [Google Scholar]
- 46.Turrigiano G, Abbott LF, Marder E. Activity-dependent changes in the intrinsic properties of cultured neurons. Science. 1994;264:974–977. doi: 10.1126/science.8178157. [DOI] [PubMed] [Google Scholar]
- 47.Wu W, Ziskind-Conhaim L, Sweet MA. Early development of Glycine- and GABA- mediated synapses in rat spinal cord. J Neurosci. 1992;12:3935–3945. doi: 10.1523/JNEUROSCI.12-10-03935.1992. [DOI] [PMC free article] [PubMed] [Google Scholar]
- 48.Yuste R, Nelson DA, Rubin WW, Katz LC. Neuronal domains in developing neocortex: mechanisms of coactivation. Neuron. 1995;14:7–21. doi: 10.1016/0896-6273(95)90236-8. [DOI] [PubMed] [Google Scholar]


