

Abstract
Potassium channels govern duration and frequency of excitable membrane events and may regulate signals that are important in neuronal development. This study assesses the developmental expression of the large conductance Ca2+-dependent K+ channel in vivo and in vitro in rat cerebellum. In vivo, transcript levels for the Ca2+-dependent K+channel (KCa) were shown by Northern analysis to increase during development, whereas transcript levels for the voltage-gated K+ channel Kv3.1, a delayed rectifier (KD), remained relatively constant. A comparable pattern was demonstrated by expression in Xenopusoocytes of poly(A)-enriched RNA isolated from postnatal rat cerebella. In cerebellar cultures, increased external K+provided a simple manipulation of cell excitability that influenced KCa transcript levels during development. With low external K+ (5.3 mm), the levels of KCa channel transcript (assessed by semiquantitative PCR) remained constant throughout development. However, in culture medium that supported significant dendritic outgrowth (10 mm extracellular K+), an upregulation of KCa transcript level was observed similar to that seen in vivo. Tetraethylammonium (TEA; 1 mm) similarly enhanced KCa expression, suggesting that depolarizing stimuli increased KCa expression. The stimulatory effects of increased K+ or TEA on KCa expression required extracellular Ca2+ and were abolished in low external calcium (0.1 mm, buffered with EGTA), although morphological development and survival were not impaired. The regulation of KCa channel expression by depolarization and Ca2+ entry provides evidence of a logical feedback mechanism governing Ca2+ signals that may be significant in cerebellar development.
Keywords: calcium-dependent K+ channel, rat cerebellum, transcription, mslo, rslo, BK channel, calbindin, depolarization, quantitative PCR
The rat cerebellum is immature at birth and develops rapidly in the first weeks of postnatal life. Purkinje neurons in culture undergo physiological and morphological maturation that resembles development in vivo (Woodward et al., 1969) and acquire branched dendrites (Gruol and Franklin, 1987;Baptista et al., 1994) and a pacemaker-like firing activity (Yool and Gruol, 1987). This transition in excitability is accompanied by increases in both Ca2+ and Ca2+-dependent K+ channel (KCa) membrane conductances (Yool et al., 1988; Gruol et al., 1992). The Purkinje neuron is the primary source of the KCa signal in the cerebellum (Knaus et al., 1996); the channels are present in soma and dendrites (Gruol et al., 1991) and show properties of the big conductance (BK) type (Pallotta et al., 1981; Blatz and Magleby, 1987), including a high unitary conductance (100 pS in physiological saline), dependence on internal Ca2+, and sensitivity to millimolar tetraethylammonium (Reinhart et al., 1989).
Various classes of ion channels exhibit different patterns of expression during neuronal development (Ribera and Spitzer, 1992). The expression of a number of K+ channel types is developmentally regulated in the rodent brain (Swanson et al., 1990;Trimmer, 1993). Channel expression can be regulated by depolarization and activation of intracellular signaling pathways (Levitan et al., 1995; Takimoto et al., 1995; Gan et al., 1996). Data presented here show that the expression of the rslo sequence encoding the large conductance KCa channel is regulated at the transcriptional level during development of the rat cerebellum; in contrast, a subtype of delayed rectifier channel (Kv3.1) is expressed uniformly at 2–21 d postnatal. The expression pattern seen for KCa in vivo is mimicked in cultures treated with chronic depolarizing stimuli (10 mmK+ or 1 mm TEA) but not seen in cultures maintained in low external K+ medium. An advantage of using TEA as a chronic depolarizing stimulus is that its effectiveness on electrophysiological properties of the neuron does not seem to decrease with time of exposure (R. Reitstetter and A. J. Yool, unpublished observations), as would be predicted for other agents such as excitatory amino acid transmitters that undergo desensitization. In cerebellar cultures, application of 0.5–1 mm external TEA depolarizes the resting membrane potential of the Purkinje neuron by 5–8 mV and increases the voltage-dependent Ca2+ component of the action potential by slowing the late repolarization phase (Yool et al., 1988). Our results suggest that depolarization and calcium entry contribute to the transcriptional regulation of KCa. Dynamic regulation of KCa channels during development of the rat cerebellum could influence membrane potential and calcium signaling and thus be significant in the process of neuronal maturation.
MATERIALS AND METHODS
Isolation of poly(A)-enriched RNA from postnatal rat cerebella. Sprague Dawley rat pups were anesthetized by CO2 and decapitated at postnatal days 2, 4, 6, 7, 8, 10, and 14. The cerebellar cortices were dissected, frozen in liquid N2, and then ground on dry ice in separate preparations for each age. The powdered tissue was denatured in guanidinium thiocyanate solution. After digestion with RNase-free DNase, the total RNA was extracted by phenol and chloroform and precipitated with isopropanol. Polyadenylated-RNA was enriched from total RNA by oligodeoxythymidine affinity separation (Poly ATtract kit; Promega, Madison, WI). Gel electrophoresis of the poly(A) RNA samples showed the expected range of RNAs from 2 to 9 kb and faint but distinct ribosomal RNA bands.
Xenopus oocyte expression. Oocytes from anesthetizedXenopus laevis were obtained by surgical removal of lobes of ovary and were dissociated with collagenase type IA (1.5 mg/ml; Sigma, St. Louis, MO) for 2–3 hr in calcium-free medium containing (in mm): NaCl, 82; KCl, 2.5; MgCl2, 1.0; and HEPES, 5, pH 7.6. Each oocyte was injected with 100–150 ng of rat cerebellar poly(A) RNA in 50 nl of sterile water and incubated for at least 2 d at 18°C in buffered-Na+ bath saline [“ND96” containing (in mm): NaCl, 96; KCl, 2.0; CaCl2, 1.8; MgCl2, 1.0; and HEPES, 5, pH 7.6] before recording. Two-electrode voltage clamp was used to record currents expressed in injected and uninjected oocytes, using electrodes filled with 3 m KCl (0.5–1.5 MΩ). Oocytes were held at −80 mV, uniformly stepped to 0 mV to activate endogenous voltage-gated Ca2+ channels (and allow Ca2+ influx if present in the bath saline), and then stepped to various test potentials to evaluate current amplitudes before and after perfusion of 1 mm TEA. The KCa component was determined as the TEA-sensitive current recorded in Na+ bath saline containing external Ca2+. The KD component was determined as the TEA-insensitive component in Na+bath saline with CaCl2 omitted. Capacitance and leak were subtracted on-line using five subthreshold pulses at one-fifth the amplitude of the test voltage (P/5 technique). Data were collected by GeneClamp (Axon Instruments), filtered at 2 kHz, digitized at 200 μsec, and stored on a Dell 486 computer for subsequent analyses with pClamp software. The expression of cerebellar poly(A) RNA inXenopus oocytes (Dascal, 1987) provided a functional assay for the presence of K+ channel transcripts at different developmental stages.
Northern blot analysis. Rat cerebellar poly(A) RNA from postnatal days 2, 4, 6, 7, 8, 10, 14, and 21 was prepared from 15 to 50 rat pups per time point (more were used at the younger ages). Totals of 10 μg of each preparation of rat cerebellar mRNA were loaded on a denaturing formaldehyde gel, separated by size via electrophoresis, and then transferred to a nylon filter (GeneScreen) by standard techniques (Sambrook et al., 1989). The filter was screened by hybridization with32P-labeled antisense RNA probes prepared from the linearized plasmids for two types of cloned cDNAs, (1) the KCa channel mslo (Butler et al., 1993) provided by Drs. Ganetzky and Robertson, University of Wisconsin, and linearized with HindIII to include bases 2208–4610 (putative membrane spanning regions S9 and S10 and the C terminal) and (2) the delayed rectifier Kv3.1 (Shaw subfamily; Swanson et al., 1990) provided by Dr. Swanson, Merck Research Laboratories, and linearized with EcoRI to include the full-length sequence (regions S1–S6 and termini). The Kv3.1 and mslo probes were hybridized overnight at 50°C with 50% formamide and were washed 15 min at room temperature in 1× SSC and 45 min at 62°C in 0.5× SSC, using solutions and methods described by Sambrook et al. (1989). The constitutively expressed gene for cyclophilin (Danielson et al., 1988) served as a control for the amount of RNA loaded on each lane. The randomly primed cDNA probe for cyclophilin was hybridized overnight at 37°C. Semiquantitative analysis of the Northern blot was performed by measuring the signal intensity of the bands on the scanned images of the exposed x-ray films (Ambis 4000 laser densitometer). Samples of equal areas were scanned with a rectangular sampling tool, set to enclose the largest band. Net signals were obtained by subtracting an equal area of background adjacent to the band in the same lane and were standardized by comparison with the intensity of the net signal for cyclophilin in the same lane.
Primary cerebellar cell culture methods. The primary cerebellar cell cultures were established using techniques described previously (Gruol and Franklin, 1987). Purkinje cells undergo final mitosis at approximately embryonic day 16 (Altman, 1972). The cerebellar cortices were dissected from rat embryos at day 20 of gestation (1 d before birth), gently minced and triturated in Ca2+-free saline without enzymes, and then placed on poly-d-lysine-coated dishes containing minimum essential medium (MEM; GIBCO BRL) with 10% each heat-inactivated horse and fetal bovine sera. The cultures were incubated at 37°C in a humidified 5% CO2 incubator. After 3 d, the cultures were treated with 0.02 mg/ml 5-fluorodeoxyuridine (FUDR) and then maintained in MEM with 10% horse serum. The medium supplied from GIBCO BRL contained 5.3 mm K+ and was used as the “low K” condition; the medium was supplemented with sterile KCl to a final concentration of 10 mm for the “high K” condition. Culture medium containing 1.8 mm Ca2+provided the control level; in “low calcium” experiments, the external Ca2+ was reduced to a calculated free concentration of 0.1 mm by 1.7 mm EGTA or to 0.1 μm by 3.5 mm EGTA (Fabiato, 1988).
Semiquantitative PCR. To assess relative levels of KCa channel transcripts during development in culture, we used a modified technique for PCR (the semiquantitative, noncompetitive method) (Madsen et al., 1995; Zhao et al., 1995). This method allows comparison of the amount of a target sequence with respect to the amount of a constitutively expressed reference sequence such as cyclophilin. The subsaturating level of cDNA template that is needed to produce a dose-dependent amount of reaction product is defined empirically in initial experiments by testing a range of template concentrations. The relative intensity of the target sequence product visualized with ethidium bromide can then be interpreted as reflecting the relative abundance of the target mRNA in the original total RNA pool (Zhao et al., 1995).
From a batch of sibling cultures, three to four culture plates were combined to generate each RNA sample. Three sets of RNA samples were prepared from different batches of sibling cultures. Cultures were washed several times with PBS, and cells were scraped from the plates and lysed in Nonidet P-40 (Sigma). Proteins were digested with Proteinase K, and cytoplasmic RNA was extracted by phenol and chloroform and precipitated by isopropanol. Possibly contaminating DNA was removed by incubating with RNase-free DNase at a final concentration of 2 μg/ml at 37°C for 60 min. The concentration of the total RNA for each sample was determined by UV spectrophotometry, and 2 μg was used to synthesize single-stranded cDNA by reverse transcription with 1 μg of random primer, 0.2 μg of oligodeoxythymidine (dT) primer, and 50 U of reverse transcriptase M-MuLV (Moloney Murine Leukemia Virus; Boehringer Mannheim, Indianapolis, IN) in 25 μl of total volume at 37°C for 1 hr by standard techniques (Sambrook et al., 1989).
Aliquots of the reverse-transcribed cDNA preparations were used for PCR amplification with sequence-specific synthetic oligodeoxyribonucleotide primers. Primers for the KCa-related sequences were sense 5′-GGCTGGAAGTGAATTCTGTAG-3′ and antisense 5′-TGAGTAAGTAGACACATTCCC-3′. These primer sequences are based on the rat brain KCa sequencerslo in regions that correspond in mslo to 1063–1083 bases (between S3 and S4) and to 1354–1374 bases (near H5), respectively, and produced a product of the expected size at 312 base pairs (bp). The PCR-amplified product for KCa was 98% identical in nucleotide sequence between mouse and rat, reflecting the high overall homology (96% at the amino acid level) that exists between the rslo and mslo coding regions (based on a 2.9 kb partial sequence for rslo; H. Y. Mi and T. Schwarz, personal communication). Cyclophilin served as an internal standard for the relative quantitative comparisons; primers for the cyclophilin sequence (Danielson et al., 1988) were sense 5′-GGGGAGAAAGGATTTGGCTA-3′ (from 166 to 185 bases) and antisense 5′-ACATGCTTGCCATCCAGCC-3′ (from 404 to 422 bp) and produced a product at the expected size of 259 bp. Calbindin is a specific marker for Purkinje neurons in the cerebellum; primers for the rat calbindin sequence (Hunziker and Schrickel, 1988) were sense 5′-CTGCACCATGGCAGAATCCC-3′ and antisense 5′-GCCACTGTGGTCAGTGTCATAC-3′. These primer sequences were located spanning the initiation methionine at 279–298 and midway through the coding region at 611–633, respectively, and generated a product of 355 bp. PCR reactions for KCa, cyclophilin, and calbindin were performed in parallel in separate reaction tubes. Each PCR amplification (50 μl of final volume) contained 25 pmole of each primer, 0.2 mm each of deoxynucleotides (dNTP), 10 mm Tris-HCl, 1.5 mmMgCl2, 50 mm KCl, and 2.5 U Taq DNA polymerase (Boehringer Mannheim) aliquoted from maximally diluted stocks to enhance reproducibility of the pipetted volumes. The reactions (Perkin-Elmer 9600 thermocycler) used the following steps: denaturation at 94°C for 30 sec, annealing at 57°C for 30 sec, and polymerization at 72°C for 1 min for 25 cycles, ending with 5 min at 72°C and storage at 4°C. Initial PCR reactions first surveyed the different preparations to determine which seemed to have high intensity products and then tested a dilution series of template cDNA from that same preparation to determine the concentration of template that yielded an amount of product near the midpoint of the dose-dependent range. The empirically determined subsaturation levels of template were 50 ng of cDNA for the rslo and calbindin reactions and 5 ng of cDNA for cyclophilin reactions; these values were held constant for the subsequent comparisons of relative abundance across cDNA preparations from all stages. For gel electrophoresis, one-fifth of the PCR product volumes were combined for sample-matched rsloand cyclophilin reactions into the same lanes of a 3% MetaPhor high-resolution agarose (FMC Bioproducts, Rockland, ME) gel and run at 60 V for 4 hr. Gels were stained with freshly prepared ethidium bromide and photographed. Regions sampled by National Institutes of Health software (NIH Image) from an imaged gel were determined from total intensities of equal areas defined with a rectangular sampling tool that was set to enclose the largest band; this tool was held constant for all measurements (both signal and background) made from the same image. The background area subtracted for each band was determined from the adjacent region immediately above the band within the same lane. Signal intensity data for the rslo KCa or the calbindin bands (multiplied by 0.1 to account for the 10-fold higher proportion of cDNA template used in the reactions) were standardized to the intensity of the signal for cyclophilin in the same lane. Results were obtained from three sets of total RNA preparations from three different batches of cultures, based on two to three different PCR reactions at each time point, with data analyzed from two gels per PCR reaction. These multiple comparisons demonstrated that the PCR results were comparable within a given preparation as well as across preparations from different batches of cultures.
To ensure that the amplification of contaminating genomic DNA did not contribute to the signals of interest, we performed a negative control reaction in which RNA samples without reverse transcription were used as the templates; no PCR products were found. To verify that the PCR product was indeed the rslo sequence and not a nonspecific product, we subjected the PCR product for rslo to restriction enzyme digestions with NcoI (10 U) andSacI (10 U) in final volumes of 20 μl at 37°C for 2–3 hr. Restriction digests were analyzed by gel electrophoresis (3% MetaPhor high-resolution agarose); fragments were observed at the predicted sizes of 99 and 213 bp for SacI and 61 and 251 bp for NcoI, in addition to a small amount of uncut DNA at the predicted size of 312 bp. In addition, the PCR products for cyclophilin, calbindin, and rslo were subcloned into pGEM-T vector (Promega) and cycle-sequenced with Taq FS DNA polymerase and fluorescent dideoxy chain termination (Arizona Research Laboratories, Division of Biotechnology). The DNA sequencing results showed that the amplified products had the exact sequences that were predicted from the published full-length sequences (100% identity; data not shown) and confirmed the identities of the products analyzed by semiquantitative PCR.
Immunocytochemistry and morphometric analysis. Cell cultures were rinsed three times in MEM with 10 mm HEPES and 4% sucrose, pH 7.3, at 37°C and were fixed in 4% paraformaldehyde (in MEM with 10 mm HEPES and 4% sucrose) for 30 min at room temperature. Cells were permeabilized with stop/permeabilizing buffer (0.05% Triton X-100 in PBS, containing 0.1% bovine serum albumin, pH 7.3; repeated twice for 5 min each). Permeabilized cultures were incubated with 1 ml of primary antibody (2 hr at room temperature), rinsed with stop/permeabilizing buffer (three times for 5 min each), and then incubated with 1 ml of secondary antibody solution (1 hr at room temperature). The primary antibody used in this study was anti-calbindin 28k (monoclonal raised in mouse from Sigma and used at 1:400 dilution or polyclonal raised in rabbit from Swant, Bellinzona, Switzerland, and used at 1:500 dilution). Antibodies were diluted to the indicated concentrations in stop/permeabilizing buffer. Secondary antibodies were fluorescein-labeled anti-mouse IgG (made in horse, 4 ml/ml; Vector Laboratories, Burlingame, CA) and Texas Red-labeled anti-rabbit IgG (made in goat, 6 ml/ml; Vector Laboratories). After incubation with secondary antibody, cultures were rinsed three times with PBS, pH 8.0, for 5 min each and visualized with fluorescein (B-2A filter set) or Texas Red (G-2B filter set) using a Nikon Diaphot 200 inverted microscope with 40× objective (plan 40; NA 0.55; equipped with a correction ring for culture dish thickness compensation). Photographs for documentation were taken using Kodak Tri-X or T-Max 35 mm black and white film, 400 ASA; 35 mm negatives were digitized using a Nikon Coolscan slide scanner and analyzed with NIH Image software using the macro Neurite Labeling (C. Thomas, Integrated Microscopy, University of Wisconsin, 1994). Neurite lengths, numbers, and branch orders were measured by computer-assisted linking of individual neurite segments with a polygon tool; bifurcations defined the branchpoints and the positions for +1 increments in branch order; and primary (1°) branches were defined as those arising from the soma. Statistically significant differences were determined by the Mann–Whitney rank test with p < 0.05.
RESULTS
Development of K+ channels in vivoassessed by RNA expression in oocytes
Figure 1 illustrates the current responses evoked by voltage clamp in oocytes injected with poly(A) RNA isolated from postnatal rat cerebella. Outward currents generated in the presence of external Ca2+ consisted of two components, TEA-sensitive and TEA-insensitive. In RNA from older pups, a TEA-sensitive current was observed that was not present in the RNA from younger pups, suggesting a developmental difference in the level of expression of the KCa channel. At 1 mm, external TEA serves as a useful tool for selectively identifying the KCa channels in Purkinje neurons (Yool et al., 1988). The TEA-sensitive current was present in oocytes injected with RNA from postnatal cerebella but not in oocytes with RNA from young postnatal cerebella or in uninjected controls (Fig.1A). The TEA-sensitive component showed properties of the KCa conductance; activation of the current required external Ca2+ and a prepulse step to 0 mV that allowed Ca2+ entry through endogenous voltage-gated channels, and the outward current persisted at negative potentials (−50 to −30 mV) indicating K+selectivity. Uninjected oocytes recorded with external Ca2+ showed currents averaging 150 nA (146 ± 48, mean ± SE; n = 9); a reversal potential of approximately −20 mV (data not shown) suggested that this TEA-insensitive current expressed in both injected and uninjected oocytes was the Ca2+-dependent Cl− current native to Xenopusoocytes.
Fig. 1.

Expression of KCa and KD currents in Xenopus oocytes injected with cerebellar mRNA isolated from postnatal rats. Poly(A)-enriched RNA isolated from rat pups at postnatal day 2 (P2), P4, P6, P8, P10, and P14 was expressed in Xenopus oocytes to assess the presence of transcripts encoding KCa and KD currents in vivo. A,B, Currents were recorded by two-electrode voltage clamp with external Ca2+ at 1.8 mm(A) and in medium with external Ca2+ omitted (B). A prepulse step to 0 mV was followed by test steps to various potentials. For clarity, only the currents evoked by test steps to +60 mV are shown for examples of an uninjected oocyte (Uninj.) and oocytes injected with RNA from postnatal days 4 and 10 (P4,P10). External TEA (1 mm) was applied by perfusion. Capacitance and leak were subtracted on-line with subthreshold steps. C, Peak current amplitudes (mean ± SE) of the expressed current are plotted as a function of the developmental age (days postnatal) of the rat cerebellar source of RNA. The net TEA-sensitive Ca2+-dependent component identified as the KCa current (open triangles) was significantly different at P8, P10, and P14 (*p < 0.01, unpaired t test) with respect to P2, whereas the TEA-insensitive Ca2+-independent current attributed to KD channels (open circles) showed no significant difference at any age with respect to P2. D, The current–voltage plot shows the relationship between steady-state current amplitudes (mean ± SE) and the test voltage steps (from −80 to +60 mV; in 20 mV increments) recorded from oocytes injected with cerebellar mRNA isolated at postnatal day 10 (n = 4 for KCa;n = 6 for KD). Both KCa and KD currents were activated at test steps of −40 mV and above and exhibited voltage-dependent outward rectification. The outward currents seen at negative potentials (−50 to −30 mV) are consistent with the identification of the currents as K+-selective.
Uninjected oocytes showed little current (49 ± 16 nA, mean ± SE; n = 5) in the absence of external Ca2+ (Fig. 1B), indicating that the KD current endogenous to oocytes was small in comparison with exogenously expressed currents. Oocytes injected with cerebellar RNA recorded in nominally Ca2+-free bath saline showed outward currents (230–320 nA) that were insensitive to 1 mm TEA and were expressed from RNA isolated at all postnatal stages. The endogenous KD current was not subtracted, because it could not be independently determined for the same oocytes, but should account only for 15–20% of the total Ca2+-independent current measured for cerebellar RNA, assuming that the amplitude of the endogenous current remains constant.
Figure 1C shows the net TEA-sensitive component (KCa) calculated from pairwise comparisons in each oocyte; data are presented as the mean difference in current amplitude before and after application of 1 mm TEA. In this analysis, the endogenous oocyte K+ and Cl− currents and the cerebellar KDcurrents were effectively subtracted because of their insensitivity to TEA. The mean amplitude of the KCa component expressed in oocytes was significantly increased at postnatal days 8, 10, and 14 when compared with day 2 (p < 0.01, unpaired Student’s t test), whereas KD currents showed no statistically significant difference at any age with respect to day 2 (p > 0.05, unpaired Student’st test). Although oocyte expression would not necessarily be expected to reflect the presence of mRNA in a quantitative manner, the mean current amplitude did show a rising trend with age that matched results of Northern analysis (see below) and suggested that the average current amplitude could reflect relative RNA abundance in the cerebellar preparation. The observation of a trend may have been facilitated by standardizing the concentrations of poly(A) RNA (determined by UV spectrophotometry) in the injection solutions.
Current–voltage plots (Fig. 1D) show the relationship between steady state current amplitude (mean ± SE) and voltage in oocytes injected with mRNA from postnatal day 10 (n = 4 for KCa;n = 6 for KD). Both KCa and KD currents exhibited outward rectification and outward currents at negative potentials (−50 to −30 mV), consistent with their identification as K+selective conductances.
K+ channel expression in vivoassessed by Northern blot analysis
Figure 2A shows a scanned radiographic image of a Northern blot used to assess the levels of transcripts homologous to cloned KCa and KD channels in RNA isolated from postnatal rat cerebella. The delayed rectifier channels are characterized by a core region with six putative transmembrane domains (S1–S6); the fslo,mslo, and rslo channels cloned fromDrosophila, mouse, and rat have four additional hydrophobic segments (S7–S10) that are unique to the KCachannels (Atkinson et al., 1991; Adelman et al., 1992; Butler et al., 1993) (Mi and Schwarz, personal communication on rslo). The probe used for homology screening of the rslo-related sequence was derived from the S9 to S10 region of mslo. The major band detected at 4.4 kb increased in intensity with age after postnatal day 7, yielding a pattern generally consistent with the expression of KCa current in injected oocytes (Fig.1). A probe for another type of K+ channel that is expressed at high levels in the cerebellum (Perney et al., 1992) was generated from the full-length sequence of the delayed rectifier Kv3.1 (Shaw family). The Kv3.1 probe showed continuous expression of a major band at 5.5 kb, also in a pattern generally consistent with the expression of KD current in injected oocytes. Faint secondary bands were seen on the Northern blots; a band at 1.8 kb detected by the mslo probe and a band at 2.4 kb detected by the Kv3.1 probe were present in RNA at postnatal day 8 and older (data not shown). KCa and Kv3.1 genes are known to generate alternatively spliced transcripts (Luneau et al., 1991;Adelman et al., 1992), but an extensive diversity was not evident in the relatively simple pattern observed in the Northern analysis of cerebellar RNA. Cyclophilin (0.6 kb) served as a control for the amounts of mRNA loaded.
Fig. 2.

Northern blot analysis of K+channel transcripts in postnatal rat cerebellum in vivo.A, Poly(A)-enriched RNA was isolated from rat pup cerebella at P2, P4, P6, P7, P8, P10, P14, and P21 and screened by Northern blot analysis with 32P-labeled antisense probes for rslo (mslo probe, region S9–S10) and Kv3.1 (full-length probe) sequences. A 4.4 kb band detected by themslo probe was increased in signal intensity at day 7 and thereafter. A 5.5 kb band detected by the Kv3.1 probe was present at all stages. Constitutively expressed cyclophilin (cyclo; 0.6 kb) served as a standard for the amount of RNA loaded in each lane. All bands inlanes P2 and P4 appeared to run slightly faster than those in other lanes; ladders run on both sides of the sample lanes showed a comparable difference. The shifted positions were taken into account when analyzing signals at P2 and P4.B, Densitometric analysis of the Northern blot provided an estimate of relative intensities of the rslo and Kv3.1 signals after subtraction of adjacent background and standardization to the signal for cyclophilin. Signal intensities are calculated as a percentage of the signal measured at postnatal day 2 (the first time point assayed) and plotted as a function of developmental age of the rat cerebellum.
The intensities of the bands detected by Northern analysis were measured by densitometer to evaluate relative levels of expression in postnatal cerebellum (Fig. 2B). Band intensities were adjusted by subtraction of an adjacent background region within the same lane to determine the signal values. Signals for K+ channel sequences were standardized to the signal for cyclophilin in the same lanes and are plotted as the percentage of the signal detected on postnatal day 2 (Fig. 2B). The results suggested an upregulation of the levels ofrslo-related transcripts at postnatal day 7 and older and a fairly constant level of expression of Kv3.1 during postnatal development.
Semiquantitative analysis of rslo transcriptionin vitro assessed by PCR
Semiquantitative PCR (Zhao et al., 1995) allowed the evaluation of relative amounts of rslo transcripts at different stages in culture. Figure 3A shows the products resulting from PCR reactions done with a dilution series of reverse-transcribed cDNA templates. Intensities of ethidium bromide-stained bands showed a dose-dependent relationship with template concentration (Fig. 3B). Products were obtained from separate amplifications with primers for rslo, calbindin, or cyclophilin and were combined on gels for the same cerebellar template. The products ran at the expected sizes of 312 bp for rslo, 259 bp for cyclophilin, and 355 bp for calbindin. Saturation of the amount of reaction product was evident at cDNA template levels of >10 ng for cyclophilin and >200 ng forrslo and calbindin (Fig. 3B). Subsaturating amounts of cDNA template at 50 ng for rslo and calbindin and at 5 ng for cyclophilin were used for developmental analyses.
Fig. 3.

PCR analysis of the dose-dependent amplification of rslo, calbindin, and cyclophilin sequences from reverse-transcribed RNA isolated from cerebellar cultures.A, Example of a gel showing PCR products generated from a dilution series of template, using sequence-specific primers forrslo and cyclophilin (cyc), is shown. Products stained with ethidium bromide were seen at the expected sizes (rslo at 312 bp; cyclophilin at 259 bp) and showed a dose-dependent relationship to the amount of template. Template for the analysis was prepared from cytoplasmic RNA of rat cerebellar cell cultures at 4 d in vitro for cyclophilin and 7 d in vitro for rslo. Comparable results were obtained from replicate analyses of rslo and calbindin, amplified in parallel with cyclophilin. B, Relative signal intensities of the PCR products were summed for uniform areas by NIH Image software, adjusted by subtraction of adjacent background values, and plotted as a proportion of the maximum signal as a function of template concentration. The maximum signal (Imax) was set as the intensity of the product at saturating amounts of template. Lines were fit using:I = Imax *[C]/(K0.5 + [C]), where I is the measured intensity and C is the concentration of template (nanograms per 50 μl). Data are mean ± SE from triplicate experiments.
Figure 4 shows that the levels ofrslo transcript (assessed at 14 d in vitro) were smallest in the low K+ culture condition (5.3 mm K+) and were enhanced by treatment either with high K+ (10 mmK+) or with 1 mm TEA. All cultures were initially established in low K+ medium and then were transferred to experimental media at either day 3 or day 13 in vitro. Some cultures were maintained continuously in low K+ medium for comparison. All cultures were harvested in these experiments on day 14 in vitro. Significant increases in rslo transcript levels were observed after the long-term (11 d) treatment with the high K+ or TEA media. Although not significantly different in the short-term (1 d) treatment, similar trends indicated that the effects of the stimulatory agents could be observed after only 24 hr of treatment preceding the cell harvest and suggested that the cells remained capable of responding to depolarizing cues with an increase in rslo transcription despite their long incubation in low K+ medium. The stimulation of rsloexpression by depolarizing stimuli depended on the presence of external Ca2+. When external free Ca2+ was buffered with EGTA from 1.8 to 0.1 mm, the levels ofrslo transcripts remained low (at a level comparable with that seen in the low K+ treatment) regardless of the treatment with 10 mm K+ or 1 mm TEA. Low Ca2+ medium did not seem to affect adversely the overall development of cerebellar neurons or the survival of Purkinje neurons (see Figs. 6, 7). In essence, the lack of available external Ca2+ seemed to prevent the expected change in levels of rslo transcripts and suggested that the developmental change in rslo expression may depend on environmental cues that promote voltage-gated Ca2+ signaling.
Fig. 4.

Quantitative comparison of the relative abundance of rslo transcripts in cerebellar cultures after short-term (1 d) and long-term (11 d) treatments with different K+, TEA, and Ca2+ conditions.A, PCR products were generated with template synthesized from cytoplasmic RNA that was isolated from cerebellar cultures at 14 d in vitro. Products stained with ethidium bromide were seen at the expected sizes (rslo at 312 bp; cyclophilin at 259 bp). Treatments are summarized at thebottom of B. B, Thebox plot summarizes the intensities ofrslo signals resulting from different treatmentsin vitro, standardized to the corresponding intensity of the signal for cyclophilin. Box boundaries indicate the full range of data values; internal horizontal barsrepresent median values. Long-term treatments with TEA and with 10 mm extracellular K+ significantly increased the abundance of rslo transcripts in comparison with the low K+ treatment (*p < 0.05, nonparametric Mann–Whitney test). In low calcium medium (0.1 mm), the effects of TEA and high extracellular K+ were negated. In short-term treatments, similar trends were evident but not statistically significant.
Fig. 6.
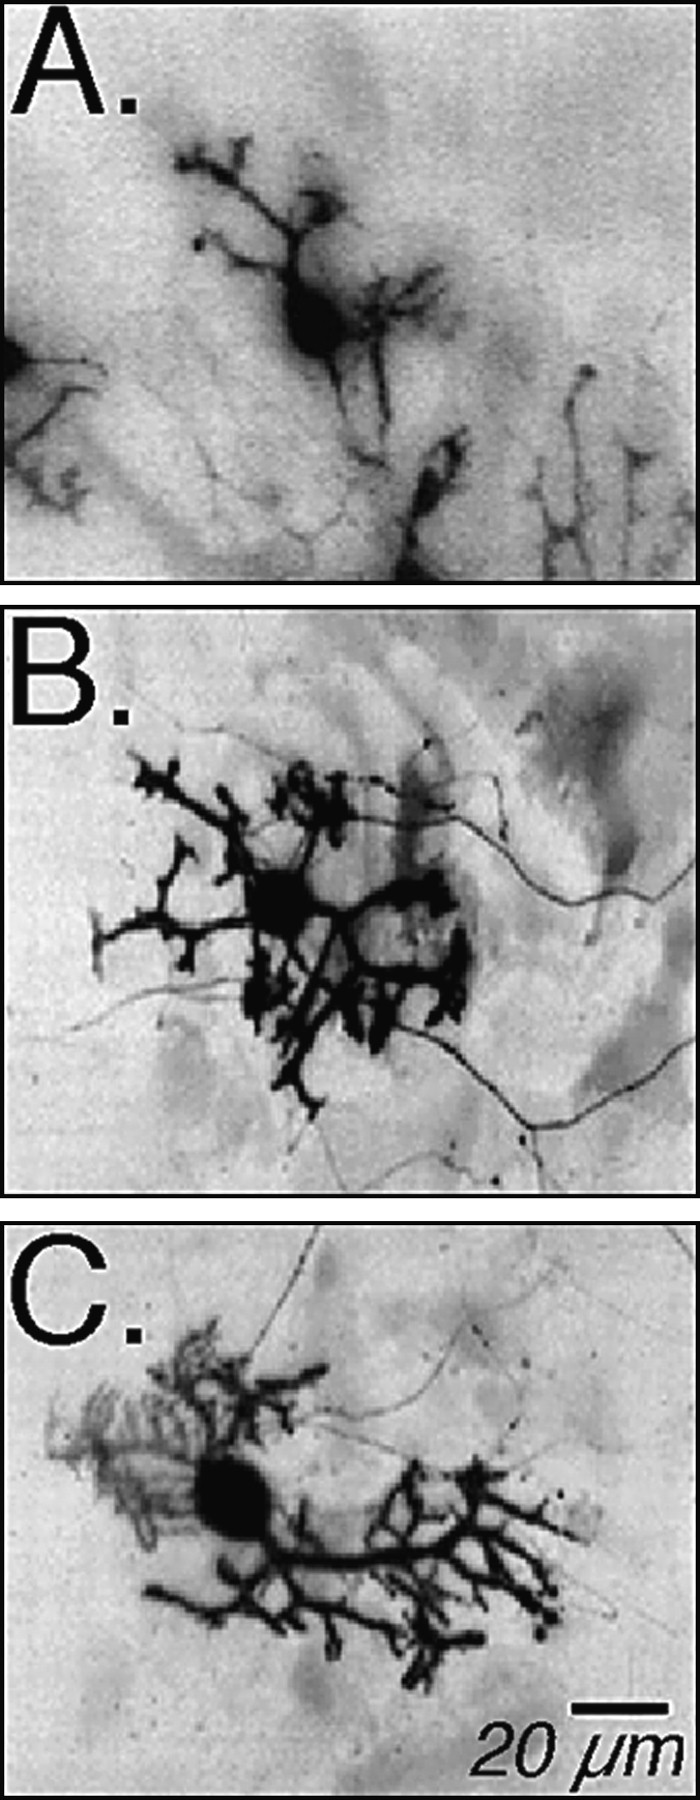
Morphological development of identified Purkinje neurons in cerebellar cultures after long-term (12 d) treatments with different K+ and Ca2+ conditions. Rat cerebellar Purkinje neurons in cultures at 15 d in vitro were identified by anti-calbindin fluorescence imaging. Digital images show (A) Purkinje neurons grown in low K+ (5.3 mm) medium, (B) a Purkinje neuron grown in high K+ (10 mm) medium, and (C) a Purkinje neuron grown in high K+ medium in which the external free Ca2+ was buffered to 100 nm with EGTA. High K+ medium stimulates neurite development; low external Ca2+ does not seem to prevent this development (see Table 1).
Fig. 7.
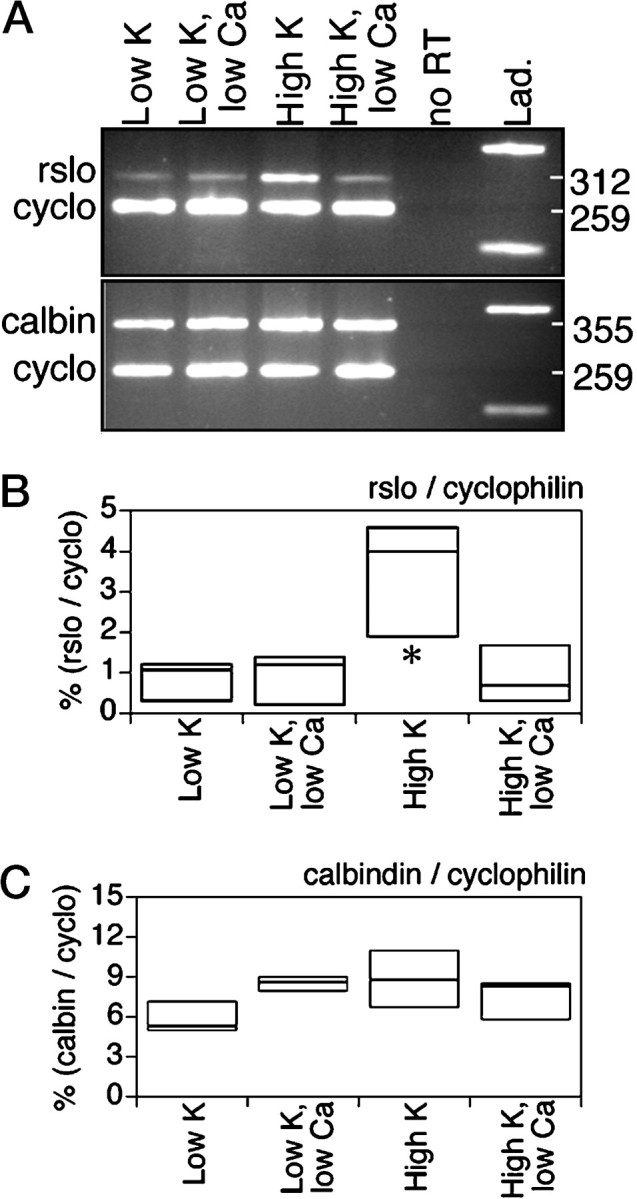
Comparison of the effects of altered K+ and Ca2+ concentrations on the expression of rslo and calbindin in cerebellar cultures.A, PCR products were generated with template synthesized from cytoplasmic RNA that was isolated from cerebellar cultures at 14 d in vitro. Products stained with ethidium bromide were seen at the expected sizes (rslo at 312 bp; calbindin at 355 bp; and cyclophilin at 259 bp). Treatments, initiated on day 3 in culture, were low K+ (5.3 mm) and high K+ (10 mm) conditions, without or with EGTA (low Ca2+) to buffer the free Ca2+ concentration to 0.1 mm. RNA template prepared without reverse transcriptase (no RT) yielded no detectable PCR product (top) and was comparable with a blanklane (bottom), indicating that genomic DNA did not contribute to the amplified signals. The molecular weight standard ladder (Lad.) shows bands at 200 and 400 bp for reference. B, C, The box plots summarize the rslo(B) and the calbindin (C) signals standardized to the corresponding signals for cyclophilin, for triplicate experiments. Box boundaries indicate the full range of data values; internal horizontal bars represent median values. Significant differences between treatments are indicated by asterisks (*p < 0.05, unpaired Mann–Whitney test).
Intensities of signals, standardized as the ratio of rslo to cyclophilin signals, are summarized from duplicate analyses of gels from two complete sets of PCR reactions per RNA preparation for two different RNA preparations, producing eight measurements per sample point (Fig. 4B). In long-term treatments (from day 3 to day 14 in culture) with high K+ or TEA, the intensity of signal for rslo was increased significantly when compared with the level observed in cultures maintained continuously in low K+ (p < 0.05, nonparametric Mann–Whitney test). Short-term treatments (24 hr) with high K+ or TEA showed similar trends in the intensities of signals for rslo. In low calcium (0.1 mm) culture medium, the levels of rslotranscripts were not significantly different from those in the low K+ condition alone, indicating that the expression-promoting effects of chronic TEA or 10 mmexternal K+ were inhibited by the reduction of external Ca2+. Restriction digests and DNA sequencing confirmed that the PCR product analyzed in our studies accurately represented the rslo sequence encoding the rat KCa channel.
Figure 5 shows the developmental profile of rslo expression. The pattern of expression observed for RNA in vivo (above, as assessed by oocyte expression and Northern analysis) also was observed in vitro when the cerebellar cultures were grown in the presence of a chronic depolarizing stimulus but not when grown in its absence. Cytoplasmic RNA was isolated from cerebellar cultures at 4, 8, 10, 14, and 21 d in vitro and analyzed by semiquantitative PCR (Fig.5A). Relative intensities of the PCR product bands were calculated from the ratio of rslo to cyclophilin after background subtraction, in replicate experiments from four PCR analyses of two separate batches of culture preparations (Fig. 5B). For cultures grown in the low K+ culture medium, the intensity of signals for rslo remained low and exhibited no significant difference at any age (p > 0.05, nonparametric Mann–Whitney test) when compared with day 4. However, in cultures maintained in low external K+ in combination with 1 mm TEA, the rslo signal intensity was increased significantly with development at 10, 14, and 21 d when compared with the age-matched low K+cultures (p < 0.05, nonparametric Mann–Whitney test). A comparison of the patterns of rslo expression suggests that the cerebellar culture system is more representative of the developing cerebellum in vivo, at least with respect to KCa channel expression, in a background of increased neuronal excitability.
Fig. 5.

Quantitative comparison of the relative abundance of rslo transcripts during development of cerebellar cultures in low K+ medium with and without 1 mm TEA. A, PCR products were generated from reverse-transcribed cytoplasmic RNA that was harvested from cerebellar cultures at different ages (days in vitro). All cultures were maintained in low K+ medium, either without TEA (left) or with 1 mm TEA treatment initiated at 3 d in vitro (right).B, The box plot summarizes therslo signals standardized to the corresponding signals for cyclophilin as a function of developmental age, for quadruplicate experiments. Box boundaries indicate the full range of data values; internal horizontal bars represent median values. Significant differences between age-matched cultures with and without TEA are indicated by asterisks(*p < 0.05, unpaired Mann–Whitney test).
Morphological development in culture
A quantitative morphological analysis of Purkinje neurons at different ages in culture allowed a comparison of the effects of low K+ (5.3 mm), high K+(10 mm), and reduced external Ca2+ (0.1 μm) treatments on the overall development of the neurons. Purkinje neurons were identified by fluorescence immunohistochemistry with antibody to calbindin, a specific marker within the cerebellum for Purkinje neurons (Fig. 6). Greater neurite outgrowth was seen for Purkinje neurons maintained in the high K+ culture medium (Fig. 6B) when compared with those in low K+ medium (Fig.6A). The stimulatory effect of high K+ was not blocked by low Ca2+(Fig. 6C); these neurons showed an enhanced neurite outgrowth when compared with neurons grown in the low K+ condition.
Table 1 summarizes the average neurite lengths and numbers of branchpoints for cerebellar Purkinje neurons grown in the various treatment conditions. Neurons grown in high K+ had significantly longer neurites and a tendency toward more neurite branching than did those grown in the low K+ condition. Reduced external Ca2+ was not overtly detrimental to overall development; growth in high K+ was not significantly different when compared between the normal Ca2+ (1.8 mm) and reduced Ca2+ (0.1 μm) conditions. In low K+ medium, the presence of 1 mm external TEA increased neurite outgrowth in a manner similar to that seen in the high K+treatment (data not shown).
Table 1.
Maximal neurite lengths and numbers of branchpoints per cell at 15 d in vitro for Purkinje neurons grown in altered K+ and Ca2+ conditions
| Set | Treatment1-a | Morphometric measurements1-b | ||
|---|---|---|---|---|
| [K+] mm | [Ca2+] mm | Number of branchpoints mean ± SD (n) | Maximum length mean ± SD (n) | |
| A | 5.3 | 1.8 | 2.4 ± 2.1 (27) | 49 ± 25 (27) |
| 10 | 1.8 | 3.2 ± 3.2 (26) | 72 ± 33 (26) | |
| NS | * | |||
| B | 10 | 1.8 | 4.4 ± 2.9 (14) | 75 ± 30 (14) |
| 10 | 10−4 | 4.1 ± 2.6 (20) | 88 ± 37 (20) | |
| NS | NS | |||
Cultures from the same set of sibling rats (A) were maintained in media with low K+(5.3 mm) or high K+ (10 mm). Cultures from a separate litter (B) were maintained in high K+ with either normal Ca2+ (1.8 mm) or low Ca2+ (100 nm).
Data are mean ± SD; the number of Purkinje neurons is n. Treatments within the same culture set are denoted by an asterisk if significantly different or by NS if not significantly different (p < 0.05; Mann–Whitney rank test).
The ability of Purkinje neurons to respond to high K+ with enhanced outgrowth, despite a reduction in external Ca2+, indicated that the blocking effect of reduced Ca2+ on rslo gene expression did not result indirectly from stunting development. This supported our interpretation that intracellular Ca2+ signaling may be involved in the regulation of rslo expression. However, a possibility remained that the observed decrease in the rslosignal after low Ca2+ treatment was caused by the selective death of a hypothetical subpopulation of Purkinje neurons that expressed the rslo gene. To rule out this alternative hypothesis, we assessed the effects of altered K+and Ca2+ on the levels of expression of a Purkinje specific marker, calbindin, referenced to a marker for all cells in the heterogeneous cultures, cyclophilin. If the selective deaths of Purkinje neurons were occurring, it would be apparent as a decrease in the ratio of calbindin to cyclophilin signals.
Figure 7 shows that low external Ca2+ treatment (which antagonized the stimulation ofrslo transcript levels in 10 mmK+) did not decrease the relative calbindin signal, and thus the effect on rslo level cannot be explained simply as a loss of Purkinje neurons. Cultures were treated beginning on day 3 in low K+ (5.3 mm) or high K+ (10 mm) conditions without or with EGTA to buffer free Ca2+ to 0.1 mm and were harvested on day 14 in vitro. PCR was used to confirm the subsaturation range of the dose–response relationship for the reverse-transcribed templates, and the semiquantitative method was used to assess the relative levels of transcripts (Fig. 7A). In the high K+ condition with normal Ca2+, the level of rslo transcript, standardized to cyclophilin, was significantly increased with respect to the other three treatment conditions, and this stimulatory effect was blocked in the low Ca2+ condition (Fig.7B). In contrast, the calbindin signal did not decrease in the low Ca2+ conditions (Fig. 7C), as would be expected if Purkinje neurons were dying during the treatment. Calbindin levels were not stimulated by the high K+treatment nor reduced by the imposition of low Ca2+in addition to the low K+ or high K+ treatments, indicating that the survival of Purkinje neurons was not appreciably compromised. This interpretation presumes that the levels of calbindin transcripts per Purkinje neuron are similar, an idea that is supported qualitatively from our observations that (1) all neurons with distinctive Purkinje morphologies were positive for calbindin (there were no calbindin-free subpopulations), (2) the numbers of Purkinje neurons per culture plate did not appear to be different (comparable numbers of neurons were imaged from all culture plates), and (3) the calbindin immunofluorescent signals used to image the Purkinje cells did not show any obvious differences in intensities. Direct counting of the numbers of Purkinje neurons per plate was impractical because the cultures were established as explants of small chunks of cerebellar tissue (from which cells migrated out to cover the plate), and thus the initial numbers of neurons per plate were variable. Assessing the ratio of signals for a Purkinje-specific molecular marker with reference to a general marker for all cells is a useful method for determining the relative survival of Purkinje neurons within the mixed population of cells that are present in primary cerebellar cultures.
DISCUSSION
The pattern of rslo transcription in the rat cerebellum showed an upregulation during the first 2 weeks of postnatal development in vivo. A comparable pattern was seen in cultures that were chronically exposed to mildly depolarizing stimuli. In contrast, the levels of rslo transcript showed no change during development in low K+ culture medium, which may represent a chronically understimulated environment. The resting membrane potential in the Purkinje neuron is set primarily by the K+ equilibrium potential; a brief application of bath saline in which the NaCl is substituted with KCl (a “symmetrical K+” condition) results in a rapid transient depolarization by ∼60 mV (Yool et al., 1992), in agreement with the prediction of the Nernst equation. Thus, the effects of altered external K+ described here for the cerebellar cultures are likely to be a direct consequence of depolarization of the resting membrane potential. The difference in external K+ concentration between 5.3 and 10 mmis predicted from the Nernst equation to cause a difference in the K+ equilibrium potential of approximately +16 mV. Based on published studies of current-clamp recordings in cultured Purkinje neurons, this difference in membrane potential could shift the cell from slow firing or virtual quiescence to a steady fast pacemaker-like firing activity (Yool et al., 1988).
The effects of TEA on the development of the cerebellar cultures may result not only from depolarization of the resting membrane potential but also from an increase in the voltage-dependent Ca2+ component of the action potentials that results from a slowing of the late repolarization phase (Yool et al., 1992). Because the effects of 10 mm K+ and TEA treatments on rslo transcript levels are comparable in magnitude and Ca2+ dependence and because the effects of these treatments complement the developmental pattern ofrslo expression observed in vivo, it seems unlikely that the upregulation of rslo in the TEA treatments here is caused simply by the block of the channels per se. Instead, the effect of TEA on channel transcription is more easily ascribed to an alteration in transmembrane signaling that is comparable with the effect of 10 mm K+.
The Northern analysis complemented the studies using oocyte expression of RNA, matching the molecular detection of specific signals with a broader analysis of functional expression. Although the sequences used as probes for the Northern analysis (rslo and Kv3.1) proved to be representative of a general pattern of KCa and KD channel expression in developing cerebellum, it is important to note that the results from oocyte recordings must in fact be considered as the summed effect of a more complex state, involving the differential expression of multiple K+ channel subtypes (Drewe et al., 1992; Perney et al., 1992; Maletic-Savatic et al., 1995; Gurantz et al., 1996). Kv3.1 is expressed at highest levels in cerebellum (Drewe et al., 1992; Perney et al., 1992). Other types of delayed rectifiers, including Kv1.1, Kv1.2, Kv1.3, and Kv3.4, also are present in cerebellum (Wang et al., 1993; Goldman-Wohl et al., 1994;Sheng et al., 1994; Veh et al., 1995; McNamara et al., 1996). Themslo region S9–S10 used as the probe for Northern analysis is in a region that is alternatively spliced (Adelman et al., 1992); it is possible other KCa gene products are expressed in cerebellum but were not detected in our analysis of in vivoexpression.
The RNA detected by Northern analysis and the currents expressed in oocytes represented the transcripts present at the age of cerebellar harvest and showed that rslo and Kv3.1 channels continued to be actively expressed during development of the cerebellum. The correlation between the oocyte expression and Northern analysis indicated that full-length RNA sequences for K+channels were successfully obtained in the poly(A) RNA isolation procedure. We would not expect to distinguish between different types of delayed rectifiers when analyzing oocytes by two-electrode voltage clamp. Thus, the overall constancy of KD current expression may reflect overlapping patterns of expression of various types of delayed rectifiers. However, the conclusion relevant to this study is that the combined delayed rectifier component seems to remain fairly constant during development and supports the results of previous single channel studies that showed an increase in KCa but not in KD channel abundance during the development of Purkinje neurons in culture (Yool et al., 1988).
There is an interesting similarity between the developmental pattern ofrslo transcription in vivo and that seen in vitro in the presence of TEA or increased external K+. The ability of 1 mm TEA to stimulaterslo expression in low K+ suggests that the important factor is not increased external K+per se but its likely effect in creating a mild depolarization of the resting membrane potential that seems to provide the signal for an enhanced rslo expression over basal levels. Presumably, this key aspect also would be a natural part of the developmental environment in vivo. One possible mechanism in vivo might be that depolarizing stimuli are provided from developing excitatory synaptic inputs from climbing fibers or parallel fibers, or both. For example, excitatory synapses from multiple climbing fibers are clearly formed in vivo on Purkinje neurons in rat cerebellum during the first week postnatal and are progressively eliminated to a single fiber innervation pattern by the end of the second week (Mariani and Changeux, 1981). Purkinje neuronsin vivo also undergo extensive synaptogenesis with parallel fibers from granule cells and show a dramatic increase in the number of synaptic junctions during early postnatal development (Herndon and Oster-Granite, 1975). Additional indirect support for the idea that the cultured neurons may be chronically understimulated (relatively hyperpolarized) in the absence of an exogenous depolarizing stimulus comes from the observation that the average resting membrane potential recorded in Purkinje neurons in slice preparations is more negative than that in vivo, suggesting that the removal (by the slicing process) of excitatory synaptic inputs lowers the resting membrane potential (Llinás and Sugimori, 1980). Presumably, in cerebellar cultures, a similar lack of excitatory input could exist because the inferior olivary nucleus is absent and the numbers of granule cells are suppressed by the mitotic inhibitor FUDR. Exogenous depolarizing agents such as K+ or TEA may partially mimic aspects of the natural condition in vivo. Therslo expression in vivo (Fig. 2) and in vitro (Fig. 5) suggested a possible peak in transcript levels near day 14 and a small decline by day 21. This decrease may be simply coincidental or might reflect a limited duration of sensitivity of the neurons to the putative signal that upregulates the expression of KCa channels.
Intracellular Ca2+ is a potent regulatory element in the control of gene expression (Bading et al., 1993; Ghosh et al., 1994; Ginty, 1997; Hardingham et al., 1997), including the expression of ion channels (Huang et al., 1994; Linsdell and Moody, 1995). Membrane depolarization regulates gene expression in cerebellar granule cells (Bessho et al., 1994; Harris et al., 1995; Resink et al., 1995). Our results show that the stimulation of rslo expression by chronic depolarization in culture requires the presence of external Ca2+. This suggests a possible involvement of voltage-gated Ca2+ channels in mediating the response, an idea that could be tested further with Ca2+ channel-selective antagonists. The ability of the Purkinje neurons in culture to undergo morphological development in an even lower external Ca2+ concentration (0.1 μm) than that used in the studies of transcript levels (100 μm) suggests that the low external Ca2+ treatment itself is not detrimental and that the cells in low Ca2+ medium are able to maintain a sufficient level of normal function to survive and grow. Interestingly, this finding also suggests that the depolarization-stimulated morphological outgrowth of Purkinje cell neurites is not strongly Ca2+ dependent or relies on Ca2+from intracellular stores. In contrast, the mechanism of depolarization-induced increase in rslo expression would seem to require mm amounts of external Ca2+ to be effective.
KCa channels provide a sensitive mechanism for the control of Ca2+ influx through voltage-gated Ca2+ channels (Gorman and Thomas, 1978; Blatz and Magleby, 1987). The existence of a calcium-dependent upregulation of KCa channel expression would seem to represent a logical feedback control in the cerebellar neurons. Therefore, it will be of interest to determine whether the sensitivity of neurons to the control signal is truly enhanced during early developmental stages of the cerebellum. The regulated expression of KCachannel abundance and subcellular localization could exert a substantial influence on actively propagated dendritic Ca2+ spikes (Llinás and Sugimori, 1980;Markram and Sakmann, 1994). Regulated expression of the KCa channel thus could be an important factor in the development of information processing capabilities in the cerebellar Purkinje neuron.
Footnotes
This work was supported by Whitehall Foundation Research Grant W95-27. We thank Drs. B. Ganetzky, G. Robertson, R. Swanson, H. Y. Mi, and T. Schwarz for providing cloned cDNAs.
Correspondence should be addressed to Dr. Andrea J. Yool, Department of Physiology, University of Arizona College of Medicine, Tucson, AZ 85724-5051.
REFERENCES
- 1.Adelman J, Shen KZ, Kavanaugh MP, Warren RA, Wu YN, Lagrutta A, Bond CT, North RA. Calcium-activated potassium channels expressed from cloned complementary DNAs. Neuron. 1992;9:209–216. doi: 10.1016/0896-6273(92)90160-f. [DOI] [PubMed] [Google Scholar]
- 2.Altman J. Postnatal development of the cerebellum cortex in the rat. II. Phases in the maturation of Purkinje cells and of the molecular layer. J Comp Neurol. 1972;145:399–464. doi: 10.1002/cne.901450402. [DOI] [PubMed] [Google Scholar]
- 3.Atkinson NS, Robertson GA, Ganetzky B. A component of calcium activated potassium channels encoded by the Drosophila slo locus. Science. 1991;253:551–553. doi: 10.1126/science.1857984. [DOI] [PubMed] [Google Scholar]
- 4.Bading H, Ginty DD, Greenberg ME. Regulation of gene expression in hippocampal neurons by distinct calcium signaling pathways. Science. 1993;260:181–186. doi: 10.1126/science.8097060. [DOI] [PubMed] [Google Scholar]
- 5.Baptista CA, Hatten ME, Blazeski R, Mason CA. Cell–cell interactions influence survival and differentiation of purified Purkinje cells in vitro. Neuron. 1994;12:243–260. doi: 10.1016/0896-6273(94)90268-2. [DOI] [PubMed] [Google Scholar]
- 6.Bessho Y, Nawa H, Nakanishi S. Selective up-regulation of an NMDA receptor subunit mRNA in cultured cerebellar granule cells by K+-induced depolarization and NMDA treatment. Neuron. 1994;12:87–95. doi: 10.1016/0896-6273(94)90154-6. [DOI] [PubMed] [Google Scholar]
- 7.Blatz AL, Magleby KL. Calcium-activated potassium channels. Trends Neurosci. 1987;10:463–467. [Google Scholar]
- 8.Butler A, Tsunoda S, McCobb DP, Wei A, Salkoff L. Mslo, a complex mouse gene encoding “maxi” calcium-activated potassium channels. Science. 1993;261:221–224. doi: 10.1126/science.7687074. [DOI] [PubMed] [Google Scholar]
- 9.Danielson PE, Forss-Petter S, Brow MA, Calavetta L, Douglass J, Milner RJ, Sutcliffe JG. plB15: a cDNA clone of the rat mRNA encoding cyclophilin. DNA. 1988;7:261–267. doi: 10.1089/dna.1988.7.261. [DOI] [PubMed] [Google Scholar]
- 10.Dascal N. The use of Xenopus oocytes for the study of ion channels. Crit Rev Biochem. 1987;22:317–387. doi: 10.3109/10409238709086960. [DOI] [PubMed] [Google Scholar]
- 11.Drewe J, Verma S, Frech G, Joho RH. Distinct spatial and temporal expression patterns of K+ channel mRNAs from different subfamilies. J Neurosci. 1992;12:538–548. doi: 10.1523/JNEUROSCI.12-02-00538.1992. [DOI] [PMC free article] [PubMed] [Google Scholar]
- 12.Fabiato A. Computer programs for calculating total from specified free or free from specified total ionic concentrations in aqueous solutions containing multiple metals and ligands. Methods Enzymol. 1988;157:378–417. doi: 10.1016/0076-6879(88)57093-3. [DOI] [PubMed] [Google Scholar]
- 13.Gan L, Perney TM, Kaczmarek LK. Cloning and characterization of the promoter for a potassium channel expressed in high frequency firing neurons. J Biol Chem. 1996;271:5859–5865. doi: 10.1074/jbc.271.10.5859. [DOI] [PubMed] [Google Scholar]
- 14.Ghosh A, Ginty DD, Bading H, Greenberg ME. Calcium regulation of gene expression in neuronal cells. J Neurobiol. 1994;25:294–303. doi: 10.1002/neu.480250309. [DOI] [PubMed] [Google Scholar]
- 15.Ginty DD. Calcium regulation of gene expression: isn’t that spatial? Neuron. 1997;18:183–186. doi: 10.1016/s0896-6273(00)80258-5. [DOI] [PubMed] [Google Scholar]
- 16.Goldman-Wohl DS, Chan E, Baird D, Heintz N. Kv3.3b: a novel Shaw type potassium channel expressed in terminally differentiated cerebellar Purkinje cells and deep cerebellar nuclei. J Neurosci. 1994;14:511–522. doi: 10.1523/JNEUROSCI.14-02-00511.1994. [DOI] [PMC free article] [PubMed] [Google Scholar]
- 17.Gorman ALF, Thomas MV. Changes in the intracellular concentration of free calcium ions in a pace-maker neuron, measured with the metallochromic dye arsenazo III. J Physiol (Lond) 1978;275:357–376. doi: 10.1113/jphysiol.1978.sp012194. [DOI] [PMC free article] [PubMed] [Google Scholar]
- 18.Gruol DL, Franklin CL. Morphological and physiological differentiation of Purkinje neurons in cultures of rat cerebellum. J Neurosci. 1987;7:1271–1293. doi: 10.1523/JNEUROSCI.07-05-01271.1987. [DOI] [PMC free article] [PubMed] [Google Scholar]
- 19.Gruol DL, Jacquin T, Yool AJ. Single-channel K+ currents recorded from the somatic and dendritic regions of cerebellar Purkinje neurons in culture. J Neurosci. 1991;11:1002–1015. doi: 10.1523/JNEUROSCI.11-04-01002.1991. [DOI] [PMC free article] [PubMed] [Google Scholar]
- 20.Gruol DL, Deal CR, Yool AJ. Developmental changes in calcium conductances contribute to the physiological maturation of cerebellar Purkinje neurons in culture. J Neurosci. 1992;12:2838–2848. doi: 10.1523/JNEUROSCI.12-07-02838.1992. [DOI] [PMC free article] [PubMed] [Google Scholar]
- 21.Gurantz D, Ribera AB, Spitzer NC. Temporal regulation of Shaker- and Shab-like potassium channel gene expression in single embryonic spinal neurons during K+ current development. J Neurosci. 1996;16:3287–3295. doi: 10.1523/JNEUROSCI.16-10-03287.1996. [DOI] [PMC free article] [PubMed] [Google Scholar]
- 22.Hardingham GE, Chawla S, Johnson CM, Bading H. Distinct functions of nuclear and cytoplasmic calcium in the control of gene expression. Nature. 1997;385:260–265. doi: 10.1038/385260a0. [DOI] [PubMed] [Google Scholar]
- 23.Harris BT, Costa E, Grayson DR. Exposure of neuronal cultures to K+ depolarization or to N-methyl-d-aspartate increases the transcription of genes encoding the alpha 1 and alpha 5 GABAA receptor subunits. Mol Brain Res. 1995;28:338–342. doi: 10.1016/0169-328x(94)00240-f. [DOI] [PubMed] [Google Scholar]
- 24.Herndon RM, Oster-Granite ML. The effect of granule cell destruction on the development and maintenance of the Purkinje cell dendrite. Adv Neurol. 1975;12:361–371. [PubMed] [Google Scholar]
- 25.Huang CF, Flucher BE, Schmidt MM, Stroud SK, Schmidt J. Depolarization–transcription signals in skeletal muscle use calcium flux through L channels, but bypass the sarcoplasmic reticulum. Neuron. 1994;13:167–177. doi: 10.1016/0896-6273(94)90467-7. [DOI] [PubMed] [Google Scholar]
- 26.Hunziker W, Schrickel S. Rat brain calbindin D28: six domain structure and extensive amino acid homology with chicken calbindin D28. Mol Endocrinol. 1988;2:465–473. doi: 10.1210/mend-2-5-465. [DOI] [PubMed] [Google Scholar]
- 27.Knaus HG, Schwarzer C, Koch ROA, Eberhart A, Kaczorowski GJ, Glossmann H, Wunder F, Pongs O, Garcia ML, Sperk G. Distribution of high conductance Ca2+-activated K+ channels in rat brain: targeting to axons and nerve terminals. J Neurosci. 1996;16:955–963. doi: 10.1523/JNEUROSCI.16-03-00955.1996. [DOI] [PMC free article] [PubMed] [Google Scholar]
- 28.Levitan ES, Gealy R, Trimmer JS, Takimoto K. Membrane depolarization inhibits Kv1.5 voltage-gated K+ channel gene transcription and protein expression in pituitary cells. J Biol Chem. 1995;270:6036–6041. doi: 10.1074/jbc.270.11.6036. [DOI] [PubMed] [Google Scholar]
- 29.Linsdell P, Moody WJ. Electrical activity and calcium influx regulate ion channel development in embryonic Xenopus skeletal muscle. J Neurosci. 1995;15:4507–4514. doi: 10.1523/JNEUROSCI.15-06-04507.1995. [DOI] [PMC free article] [PubMed] [Google Scholar]
- 30.Llinás R, Sugimori M. Electrophysiological properties of in vitro Purkinje cell somata in mammalian cerebellar slices. J Physiol (Lond) 1980;305:171–195. doi: 10.1113/jphysiol.1980.sp013357. [DOI] [PMC free article] [PubMed] [Google Scholar]
- 31.Luneau CJ, Williams JB, Marshall J, Levitan ES, Oliva C, Smith JS, Antanavage J, Folander K, Stein RB, Swanson R, Kaczmarek LK, Buhrow SA. Alternative splicing contributes to K+ channel diversity in the mammalian central nervous system. Proc Natl Acad Sci USA. 1991;88:3932–3936. doi: 10.1073/pnas.88.9.3932. [DOI] [PMC free article] [PubMed] [Google Scholar]
- 32.Madsen MW, Reiter BE, Lykkesfeldt AE. Differential expression of estrogen receptor mRNA splice variants in the tamoxifen resistant human breast cancer cell line MCF-7/TAMR-1 compared to the parental MCF-7 cell line. Mol Cell Endocrinol. 1995;109:197–207. doi: 10.1016/0303-7207(95)03503-y. [DOI] [PubMed] [Google Scholar]
- 33.Maletic-Savatic M, Lenn NJ, Trimmer JS. Differential spatiotemporal expression of K+ channel polypeptides in rat hippocampal neurons developing in situ and in vitro. J Neurosci. 1995;15:3840–3851. doi: 10.1523/JNEUROSCI.15-05-03840.1995. [DOI] [PMC free article] [PubMed] [Google Scholar]
- 34.Mariani J, Changeux J-P. Ontogenesis of olivocerebellar relationships: I. Studies by intracellular recordings of the multiple innervation of Purkinje cells by climbing fibers in the developing rat cerebellum. J Neurosci. 1981;1:696–702. doi: 10.1523/JNEUROSCI.01-07-00696.1981. [DOI] [PMC free article] [PubMed] [Google Scholar]
- 35.Markram H, Sakmann B. Calcium transients in dendrites of neocortical neurons evoked by single subthreshold excitatory postsynaptic potentials via low-voltage-activated calcium channels. Proc Natl Acad Sci USA. 1994;9:5207–5211. doi: 10.1073/pnas.91.11.5207. [DOI] [PMC free article] [PubMed] [Google Scholar]
- 36.McNamara NM, Averill S, Wilkin GP, Dolly JO, Priestley JV. Ultrastructural localization of a voltage-gated K+ channel alpha subunit (Kv1.2) in the rat cerebellum. Eur J Neurosci. 1996;8:688–699. doi: 10.1111/j.1460-9568.1996.tb01254.x. [DOI] [PubMed] [Google Scholar]
- 37.Pallotta BS, Magleby KL, Barrett JN. Single channel recordings of Ca2+ activated K+ currents in rat muscle culture. Nature. 1981;293:471–474. doi: 10.1038/293471a0. [DOI] [PubMed] [Google Scholar]
- 38.Perney TM, Marshall J, Martin KA, Hockfield S, Kaczmarek LK. Expression of the mRNAs for the Kv3.1 potassium channel gene in the adult and developing rat brain. J Neurophysiol. 1992;68:756–766. doi: 10.1152/jn.1992.68.3.756. [DOI] [PubMed] [Google Scholar]
- 39.Reinhart PH, Chung S, Levitan IB. A family of calcium-dependent potassium channels from rat brain. Neuron. 1989;2:1031–1041. doi: 10.1016/0896-6273(89)90227-4. [DOI] [PubMed] [Google Scholar]
- 40.Resink A, Villa M, Benke D, Möhler H, Balázs R. Regulation of the expression of NMDA receptor subunits in rat cerebellar granule cells: effect of chronic K+-induced depolarization and NMDA exposure. J Neurochem. 1995;64:558–565. doi: 10.1046/j.1471-4159.1995.64020558.x. [DOI] [PubMed] [Google Scholar]
- 41.Ribera AB, Spitzer NC. Developmental regulation of potassium channels and the impact on neuronal differentiation. Ion Channels. 1992;3:1–38. doi: 10.1007/978-1-4615-3328-3_1. [DOI] [PubMed] [Google Scholar]
- 42.Sambrook J, Fritsch EF, Maniatis T. Molecular cloning: a laboratory manual. Cold Spring Harbor Laboratory; Cold Spring Harbor, NY: 1989. [Google Scholar]
- 43.Sheng M, Tsaur ML, Jan YN, Jan LY. Contrasting subcellular localization of the Kv1.2 K+ channel subunit in different neurons of rat brain. J Neurosci. 1994;14:2408–2417. doi: 10.1523/JNEUROSCI.14-04-02408.1994. [DOI] [PMC free article] [PubMed] [Google Scholar]
- 44.Swanson R, Marshall J, Smith JS, Williams JB, Boyle MB, Folander K, Luneau CJ, Antanavage J, Oliva C, Buhrow SA, Bennett C, Stein RB, Kaczmarek LK. Cloning and expression of cDNA and genomic clones encoding three delayed rectifier potassium channels in rat brain. Neuron. 1990;4:929–939. doi: 10.1016/0896-6273(90)90146-7. [DOI] [PubMed] [Google Scholar]
- 45.Takimoto K, Gealy R, Levitan ES. Multiple protein kinases are required for basal Kv1.5 K+ channel gene expression in GH3 clonal pituitary cells. Biochim Biophys Acta. 1995;1265:22–28. doi: 10.1016/0167-4889(94)00205-s. [DOI] [PubMed] [Google Scholar]
- 46.Trimmer JS. Expression of Kv2.1 delayed rectifier K+ channel isoforms in the developing rat brain. FEBS Lett. 1993;324:205–210. doi: 10.1016/0014-5793(93)81394-f. [DOI] [PubMed] [Google Scholar]
- 47.Veh RW, Lichtinghagen R, Sewing S, Wunder F, Grumbach IM, Pongs O. Immunohistochemical localization of five members of the Kv1 channel subunits: contrasting subcellular locations and neuron-specific co-localizations in rat brain. Eur J Neurosci. 1995;7:2189–2205. doi: 10.1111/j.1460-9568.1995.tb00641.x. [DOI] [PubMed] [Google Scholar]
- 48.Wang H, Kunkel DD, Martin TM, Schwartzkroin PA, Tempel BL. Heteromultimeric K+ channels in terminal and juxtaparanodal regions of neurons. Nature. 1993;365:75–79. doi: 10.1038/365075a0. [DOI] [PubMed] [Google Scholar]
- 49.Woodward DJ, Hoffer BJ, Laphan LW. Correlative survey of electrophysiological, neuropharmacological and histochemical aspects of cerebellar maturation in rat. In: Llinas R, editor. Neurobiology of cerebellar evolution and development. Am Med Assn Educn Res Found; Chicago: 1969. pp. 725–741. [Google Scholar]
- 50.Yool AJ, Gruol DL. Development of spontaneous and glutamate-evoked activity is altered by chronic ethanol in cultured cerebellar Purkinje neurons. Brain Res. 1987;420:205–219. doi: 10.1016/0006-8993(87)91240-6. [DOI] [PubMed] [Google Scholar]
- 51.Yool AJ, Dionne VE, Gruol DL. Developmental changes in K+ selective channel activity during differentiation of the Purkinje neuron in culture. J Neurosci. 1988;8:1971–1980. doi: 10.1523/JNEUROSCI.08-06-01971.1988. [DOI] [PMC free article] [PubMed] [Google Scholar]
- 52.Yool AJ, Krieger RM, Gruol DL. Multiple ionic mechanisms are activated by the potent agonist quisqualate in cultured cerebellar Purkinje neurons. Brain Res. 1992;573:83–94. doi: 10.1016/0006-8993(92)90116-q. [DOI] [PubMed] [Google Scholar]
- 53.Zhao Y, Wein AJ, Levin RM. Assessment of stress gene mRNAs (HSP-27, 60 and 70) in obstructed rabbit urinary bladder using a semi-quantitative RT-PCR method. Mol Cell Biochem. 1995;148:1–7. doi: 10.1007/BF00929496. [DOI] [PubMed] [Google Scholar]