Abstract
Modulation of neuronal voltage-gated Ca channels has important implications for synaptic function. To investigate the mechanisms of Ca channel modulation, we compared the G-protein-dependent facilitation of three neuronal Ca channels. α1A, α1B, or α1E subunits were transiently coexpressed with α2–δb and β3 subunits in HEK293 cells, and whole-cell currents were recorded. After intracellular dialysis with GTPγS, strongly depolarized conditioning pulses facilitated currents mediated by each Ca channel type. The magnitude of facilitation depended on current density, with low-density currents being most strongly facilitated and high-density currents often lacking facilitation. Facilitating depolarizations speeded channel activation ∼1.7-fold for α1A and α1B and increased current amplitudes by the same proportion, demonstrating equivalent facilitation of G-protein-inhibited α1A and α1B channels. Inactivation typically obscured facilitation of α1E current amplitudes, but the activation kinetics of α1E currents showed consistent and pronounced G-protein-dependent facilitation. The onset and decay of facilitation had the same kinetics for α1A, α1B, and α1E, suggesting that Gβγ dimers dissociate from and reassociate with these Ca channels at very similar rates. To investigate the structural basis for N-type Ca channel modulation, we expressed a mutant of α1Bmissing large segments of the II–III loop and C terminus. This deletion mutant exhibited undiminished G-protein-dependent facilitation, demonstrating that a Gβγ interaction site recently identified within the C terminus of α1E is not required for modulation of α1B.
Keywords: Ca channel modulation, neuronal Ca channels, membrane-delimited pathway, G-protein-dependent Ca channel inhibition, presynaptic inhibition, signal transduction, neuronal integration, neuronal plasticity, molecular neuroscience, facilitation, α1A, α1B, α1C, α1E, neurosecretion, electrical excitability
Voltage-gated Ca channels play essential roles in neurosecretion and other neuronal functions (Dunlap et al., 1995). At least six different classes of Ca channel α1 subunits (α1A, α1B, α1C, α1D, α1E, and α1G) are expressed in neurons, in which they contribute to the formation of native P/Q-, N-, L-, R-, and T-type Ca channels, respectively (Hofmann et al., 1994; Perez-Reyes et al., 1998). The activities of N-type and P/Q-type channels are known to be modulated by G-protein-dependent pathways (Elmslie et al., 1990; Sah, 1990; Bernheim et al., 1991; Mintz and Bean, 1993), and such modulation is likely to have considerable physiological importance (cf. Kavalali et al., 1997; Koh and Hille, 1997; Wu and Saggau, 1997).
Previous studies in neurons have identified five G-protein-dependent pathways for N-type Ca channel inhibition (Hille, 1994). One pathway is membrane-delimited and may involve only Ca channels, heterotrimeric G-proteins, and neurotransmitter–hormone receptors. Ca channels inhibited via this pathway exhibit positive shifts in the voltage dependence of activation, slowed activation kinetics, and reduced macroscopic current amplitudes; such channels are described as being “reluctant” to open (Bean, 1989). Reluctant channels can be transiently reconverted into “willing” channels by strong or sustained depolarization (Bean, 1989; Elmslie et al., 1990; Ikeda, 1991); this reconversion is known as facilitation.
G-protein-dependent modulation has been extensively studied for native N-type Ca channels (cf. Jones and Elmslie, 1997), and modulation of cloned α1A and α1B Ca channels has been reconstituted in expression systems (Zhou et al., 1995; Zong et al., 1995; Patil et al., 1996; Brody et al., 1997; Herlitze et al., 1997;Page et al., 1997). Interestingly, when neurotransmitter receptors are used to activate G-proteins in a phasic manner, α1Bchannels are more strongly inhibited and more strongly facilitated than α1A channels (Zhang et al., 1996; Zamponi et al., 1997). To further examine the relative sensitivities of α1A and α1B to G-protein-mediated inhibition, we have compared modulation of these channels by G-proteins tonically activated with GTPγS. Under these conditions, α1A and α1B display very similar magnitudes and kinetics of facilitation, suggesting that other factors in addition to channel primary structure may influence Ca channel–G-protein interactions.
Membrane-delimited Ca channel modulation appears to be effected by Gβγ rather than Gα subunits (Herlitze et al., 1996; Ikeda, 1996;Shekter et al., 1997). It has been proposed that direct interaction with Gβγ occurs at the cytoplasmic I–II loop (De Waard et al., 1997; Zamponi et al., 1997), the C terminus (Qin et al., 1997), or a combination of the first transmembrane domain and the C terminus of the Ca channel α1 subunit (Zhang et al., 1996; Page et al., 1997). To investigate this issue, we have further studied facilitation of a deletion mutant of α1B. This N-type Ca channel, which lacks large segments of the II–III loop and C terminus, exhibits undiminished G-protein-dependent facilitation, demonstrating that a Gβγ interaction site recently identified within the C terminus of α1E (Qin et al., 1997) is not essential for modulation of α1B.
MATERIALS AND METHODS
Cell culture and transfection. Human embryonic kidney (HEK293) cells (CRL 1573) were obtained from the American Type Culture Collection (ATCC; Manassas, VA) and maintained at 37°C in a humidified atmosphere containing 5% CO2. The culture medium contained 90% DMEM (Life Technologies, Gaithersburg, MD; catalog #11995-065), 10% heat-inactivated horse serum (Life Technologies; catalog #26050-13), and 50 μg/ml gentamicin (Life Technologies; catalog #15710-015). Every 2–3 d, the cells were briefly trypsinized and replated at fourfold lower density. At the time of replating, 35 mm culture dishes (Falcon; catalog #3002) were seeded with ∼103 cells per dish. Approximately 16 hr later, these cells were transfected using the Ca-PO4precipitation technique (Pharmacia, Piscataway, NJ; Cell Phect Kit) with expression plasmids encoding α1A (rabbit brain; Mori et al., 1991), α1B (rabbit brain; Fujita et al., 1993), α1C (rabbit heart; Mikami et al., 1989), or α1E (BII-2, rabbit brain; Niidome et al., 1992) at 1 μg of each cDNA per dish. Cells were simultaneously cotransfected with expression plasmids encoding α2-δb (rat brain; Kim et al., 1992) and β3 (rabbit brain; Witcher et al., 1993) at 1 μg of each cDNA per dish and also with plasmid EBO-pCD-Leu2 encoding human CD8 protein (ATCC; catalog #59565) at 0.2 μg/dish. Cells expressing CD8 were visually identified by their ability to bind 4.5 μm diameter paramagnetic beads coated with anti-CD8 antibody (Dynal, Great Neck, NY). Decorated cells were selected for electrophysiological analysis (Jurman et al., 1994).
Expression plasmids. The amino acid compositions and construction of expression plasmids encoding α1A, α1B, and α1C have been described previously (Tanabe et al., 1990; Fujita et al., 1993; Adams et al., 1994). cDNAs encoding these α1 subunits were in the expression vector pKCRH2 (Mishina et al., 1984). The entire coding sequence of α1E was excised from pSPCBII-2 (Wakamori et al., 1994) using HindIII and EcoRI; the resulting ∼7.3 kb fragment was ligated into the corresponding sites of pcDNA3.1+ (Invitrogen, San Diego, CA). The construction of pKCRBIII-DD, encoding a double-deletion mutant of α1B (α1B-DD), has been previously described (Zhou et al., 1995). α1B-DD is missing amino acid residues 829–995 and 1877–2338 from the II–III loop and C terminus, respectively. The cDNA encoding α2-δb (Kim et al., 1992) was in pMT2. The cDNA encoding β3 was in pcDNA3.
Electrophysiology. Large-bore pipettes were pulled from 100 μl borosilicate micropipettes (VWR Scientific; catalog #53432-921) and filled with a solution containing (in mm:) 155 CsCl, 10 Cs2 EGTA, 4 Mg ATP, and 10 HEPES, pH 7.4, with CsOH. The pipette solution also contained Li-GTPγS (0.32 mm) or Li-GDPβS (0.30 mm) as noted. Aliquots of pipette solutions were stored at −80°C and kept on ice after thawing. Pipette solutions were filtered at 0.22 μm immediately before use. Pipette tips were coated with paraffin to reduce capacitance and then fire-polished; filled pipettes had DC resistances of 1.0–1.5 MΩ. The bath solution contained (in mm:) 145 NaCl, 40 CaCl2, and 10 HEPES, pH 7.4, with NaOH. Residual pipette capacitance was compensated in the cell-attached configuration using the negative capacitance circuit of the Axopatch 200A amplifier. No corrections were made for liquid junction potentials. Temperature (20–23°C) was continuously monitored using a miniature thermocouple placed in the bath.
Ca currents were recorded using the whole-cell patch-clamp technique (Hamill et al., 1981). The steady holding potential was normally −90 mV. In all experiments involving GTPγS, cells were dialyzed for ≥5 min before studying G-protein-dependent effects. Currents were filtered at 2–10 kHz using the built-in Bessel filter (four-pole low-pass) of the Axopatch 200A amplifier and sampled at 10–50 kHz using a Digidata 1200 analog-to-digital board installed in a Gateway 486-66V computer. The pCLAMP software programs Clampex and Clampfit (version 6.0.3) were used for data acquisition and analysis, respectively. Figures were made using Origin (version 4.1).
Linear cell capacitance (C) was determined by integrating the area under the whole-cell capacity transient, evoked by clamping from −90 to −80 mV with the whole-cell capacitance compensation circuit of the Axopatch 200A turned off. The average value of C was 22 ± 1 pF (n = 155 cells). Series resistance (RS) was calculated as (1/C) × τ, where τ is the time constant for decay of the whole-cell capacity transient. Cells exhibiting more than one τ were rejected. Because pipette resistances and cell capacitances were relatively small, τ was usually <100 μsec, andRS was <5 MΩ without using the series resistance compensation circuit of the amplifier; when required, this circuit was used to reduce τ and RS by 30–80%. The average values of τ and RS in the reported experiments (n = 155) were 71 ± 4 μsec and 3.3 ± 0.1 MΩ, respectively. Because maximal Ca currents were typically <1 nA, voltage errors were usually <5 mV. The DC resistance of the whole-cell configuration was routinely >1 GΩ. All illustrated and analyzed currents have been corrected for linear capacitance and leakage currents using the −P/6 method. Current densities (expressed in picoamperes per picofarad) were calculated as peak Ca current divided by C. Time constants for activation of Ca currents were estimated by fitting the activating phase of currents with a single exponential function.
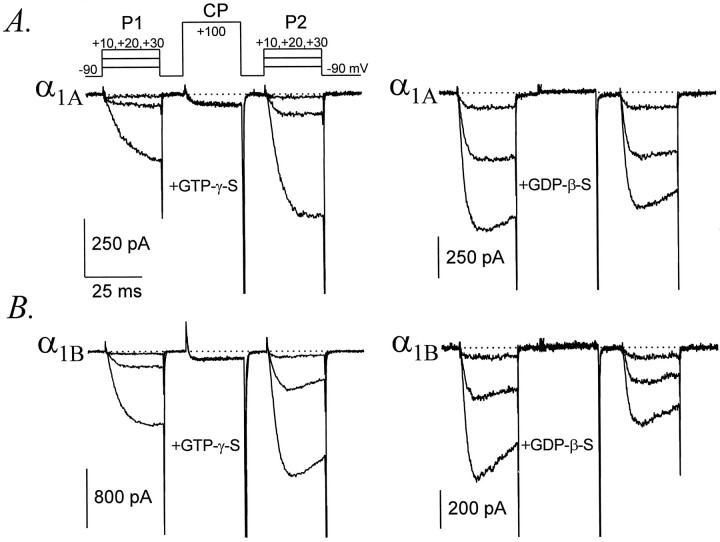
A standard “facilitation” voltage protocol was used, consisting of two identical test pulses (P1 and P2) separated by a conditioning pulse (CP) to +100 mV (Fig. 1). Unless otherwise noted P1, P2, and CP were each 25 msec long and separated by 10 msec repolarizations to −90 mV. This voltage protocol induced maximal facilitation (see Fig. 9). Successive episodes of the voltage protocol were separated by 10 sec intervals.
Fig. 1.
Representative whole-cell Ca currents recorded from HEK293 cells expressing α1A or α1Bchannels, illustrating G-protein-dependent facilitation. Currents were recorded after ≥5 min of intracellular dialysis with GTPγS or GDPβS, as indicated. The voltage protocol is diagrammed at top left. P1, P2, andCP were each 25 msec in duration and were separated by 10 msec intervals. A, α1A with GTPγS, data file 97425003; C = 20 pF;RS = 2.7 MΩ. α1A with GDPβS, data file 97D24008; C = 18 pF;RS = 3.2 MΩ. B, α1B with GTPγS, data file 97403026;C = 16 pF; RS = 4.8 MΩ. α1B with GDPβS, data file 97D19038;C = 23 pF; RS = 2.0 MΩ.
Fig. 9.
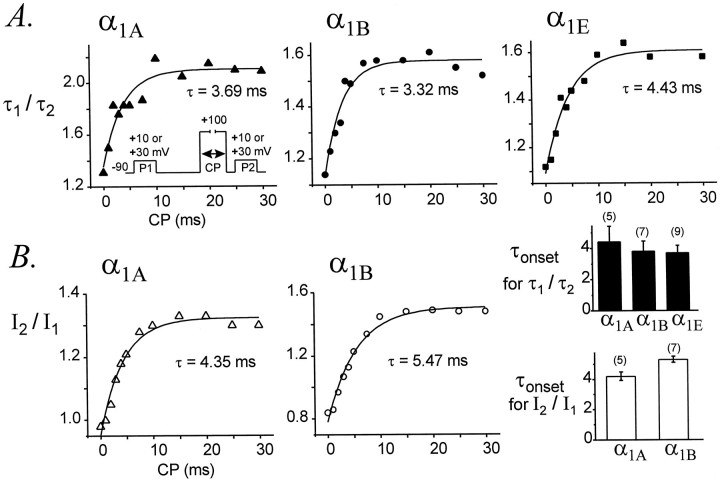
Facilitation develops with similar time course for α1A, α1B, and α1E channels. τ1/τ2ratios (A) andI2/I1ratios (B) are plotted as a function of the conditioning pulse (CP) duration for representative cells. Plots were fit by single exponential functions to yield time constants for the onset of facilitation (τonset). Average values of τonset determined using τ1/τ2 orI2/I1ratios are summarized graphically in the bottom right corner. The pipette solution contained GTPγS. α1A, Data file 98115076; C = 29 pF; RS = 2.4 MΩ. α1B, Data file 98129067; C = 27 pF; RS = 3.8 MΩ. α1E, Data file 98205005; C = 19 pF; RS = 3.2 MΩ. Data from cells expressing maximal current densities of 28 ± 5 pA/pF (α1A, n = 5), 21 ± 6 pA/pF (α1B, n = 7), and 38 ± 4 pA/pF (α1E,n = 9). Voltage protocol as in Figure 1, except that P1 and CP were separated by 50 msec at −90 mV. Each point is the average of two currents.
Statistical analysis. Groups of data were compared using one-way ANOVA or a two-tailed, unpaired t test, as appropriate. Averaged data are presented in the text and figures as mean ± SEM.
RESULTS
Facilitation of α1A and α1B
Figure 1 illustrates whole-cell Ca currents mediated by α1A or α1B Ca channels coexpressed with α2–δb and β3 subunits in HEK 293 cells. After dialyzing cells with GTPγS for several minutes, α1A and α1B currents exhibited slowed activation and reduced amplitudes, reflecting inhibition of the underlying Ca channels through a G-protein-dependent pathway. As expected, the inhibited α1A or α1B channels could be facilitated by a conditioning depolarization. Less pronounced facilitation was also observed with GTP instead of GTPγS in the pipette solution (data not shown). In contrast, facilitation was absent from cells dialyzed with GDPβS.
Ca current amplitudes decreased during dialysis with GTPγS. After ≥ 5 min of whole-cell recording, α1A currents had decreased to 59 ± 7% (n = 26 cells) of the initial amplitude (recorded within 60 sec of establishing the whole-cell configuration), and α1B currents had decreased to 56 ± 6% (n = 35). These decreases probably reflect the onset of G-protein-dependent inhibition combined with Ca channel run-down. By way of contrast, during ≥5 min dialysis with GDPβS, the amplitudes of α1A currents increased to 122 ± 7% (n = 9), and those of α1Bcurrents increased to 149 ± 7% (n = 10) of initial amplitudes. These increases likely result from Ca current run-up combined with removal of preexisting G-protein-dependent inhibition.
Facilitation of α1E
It is now well established that α1A and α1B are inhibited through G-protein-dependent pathways (Herlitze et al., 1996; Toth et al., 1996; Zhang et al., 1996; Zamponi et al., 1997). In contrast, whether α1E is also modulated by the same pathways has been unclear. Some previous studies have concluded that α1E is inhibited by G-proteins (Yassin et al., 1996; Mehrke et al., 1997; Qin et al., 1997; Shekter et al., 1997), whereas others have concluded that it is insensitive to G-protein inhibition (Bourinet et al., 1996; Toth et al., 1996; Page et al., 1997). To examine this issue further, we studied facilitation of α1E under the same experimental conditions as α1A and α1B.
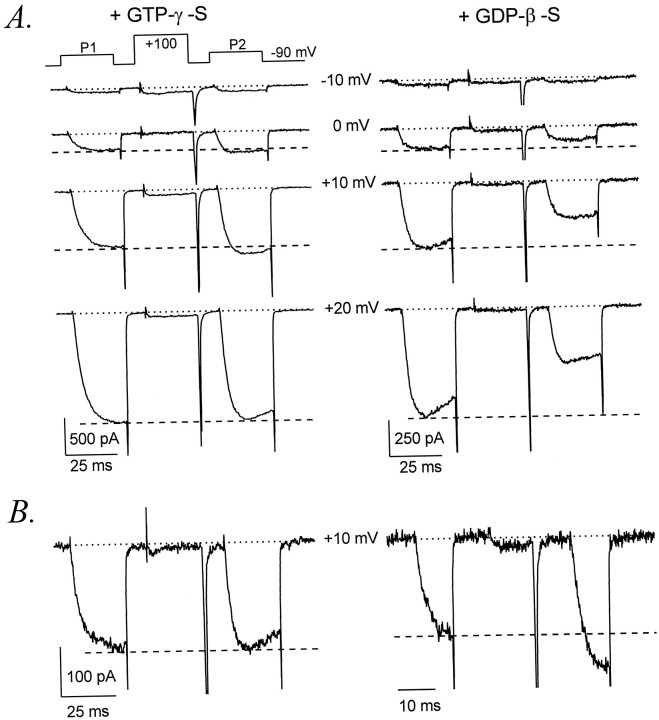
Dialysis with GTPγS decreased the amplitude of α1Ecurrents to 74 ± 1% (n = 18) of initial levels, suggesting the development of G-protein-mediated inhibition. Consistent with this interpretation, dialysis with GDPβS increased α1E current amplitudes to 151 ± 12% of initial levels (n = 7). α1E currents exhibited significant kinetic slowing (Diverse-Peirluissi et al., 1995), activating at +10 mV with an average time constant (τ1) of 4.4 ± 0.3 msec in the presence of intracellular GTPγS (n = 18) compared with 2.9 ± 0.5 msec (n = 7) with internal GDPβS. As illustrated in Figure 2, kinetic slowing of α1E currents could be reversed by a conditioning depolarization, consistent with inhibition of α1Echannels through a membrane-delimited pathway. Using the standard voltage protocol (as in Fig. 1), we observed a slight facilitation of α1E current amplitudes in some cells; one example is illustrated in Figure 2A. However, in most cells α1E current amplitudes were not facilitated. In contrast, nearly all cells dialyzed with GTPγS exhibited significant facilitation of activation kinetics. Facilitation of α1Eapparently requires G-protein activation, because it was absent from cells dialyzed with GDPβS.
Fig. 2.
G-protein-dependent facilitation of α1E. A, Facilitation of α1Ecurrent amplitudes and activation kinetics in a cell dialyzed with GTPγS (left) but not in a cell dialyzed with GDPβS (right). Voltage protocol as in Figure 1.Left, Data file 98403058; C = 32 pF;RS = 2.8 MΩ. Right, Data file 97602030; C = 31 pF;RS = 2.4 MΩ. B, Facilitation of α1E is greatly enhanced by shortening the conditioning and test pulses. Left, α1Ecurrents evoked by the standard voltage protocol in which P1, P2, and CP were each 25 msec in duration. Data file 98406202;C = 17 pF; RS = 3.5 MΩ. Right, α1E currents evoked in the same cell by a briefer protocol to the same voltages but with P1 and P2 reduced to 10 msec and CP reduced to 12 msec in duration. Data file 98406204; C = 17 pF; RS= 3.5 MΩ.
We also observed that pronounced facilitation of α1Ecurrent amplitudes could be produced by shortening the durations of the test and conditioning pulses (Fig. 2B). This observation suggests that inactivation of α1E channels in response to the standard voltage protocol usually obscured facilitation of macroscopic current amplitudes.
Facilitation is correlated with current density
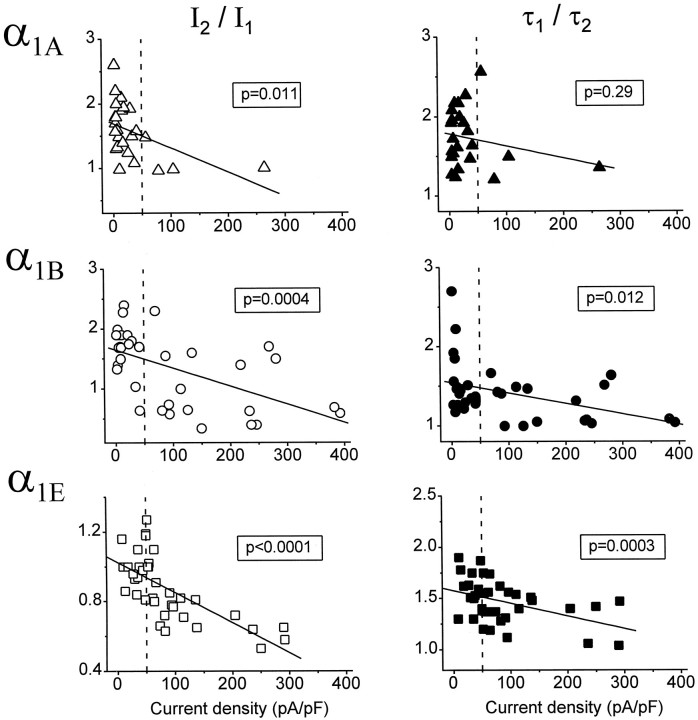
Cells transfected with α1A, α1B, or α1E expressed a wide range of Ca current densities (from unmeasurable to ∼400 pA/pF). To examine whether the expression level of Ca channels might influence their modulation by G-proteins, we plotted the magnitude of facilitation as a function of the maximal current density in each cell (Fig.3). Facilitation was quantified as the ratioI2/I1, in which I2 is the peak current evoked by P2, andI1 is the peak current evoked by P1 of the standard voltage protocol (Fig. 1). As an additional measure of facilitation we used the ratio τ1/τ2, where τ1is the time constant for activation ofI1, and τ2 is the time constant for activation of I2. The plots in Figure 3 reveal that facilitation of α1A, α1B, and α1E is negatively correlated with current density. Thus, low-density currents exhibited the most facilitation and high-density currents exhibited the least facilitation.
Fig. 3.
The magnitude of facilitation is negatively correlated with current density. The ratioI2/I1(left panels) or τ1/τ2 (right panels) is plotted as a function of maximal Ca current density for cells expressing α1A (n = 26), α1B (n = 35), or α1E(n = 37). I1 andI2 are the amplitudes measured at the time of peak inward Ca current evoked by P1 and P2, respectively, of the standard voltage protocol (Fig. 1). P1 and P2 were to +30 mV (for α1A and α1B) or +10 mV (for α1E); facilitation was maximal at these voltages (Figs. 4-6). The pipette solution contained GTPγS. For the plots shown, current densities were determined within 60 sec of establishing the whole-cell configuration, and facilitation was calculated for currents recorded after ≥5 min of whole-cell dialysis. Thelines are linear regressions; the p value listed in each plot indicates the statistical significance of the correlation coefficient. When current densities determined after >5 min of whole-cell dialysis were used as the independent variable, thep values were 0.0008, 0.0001, and 0.0003 forI2/I1ratios and 0.27, 0.012, and 0.036 for τ1/τ2 ratios of α1A, α1B, and α1E, respectively. All subsequent comparisons of α1A, α1B, and α1E used only currents having initial densities of ≤50 pA/pF (dashed vertical line).
Voltage dependence of facilitation
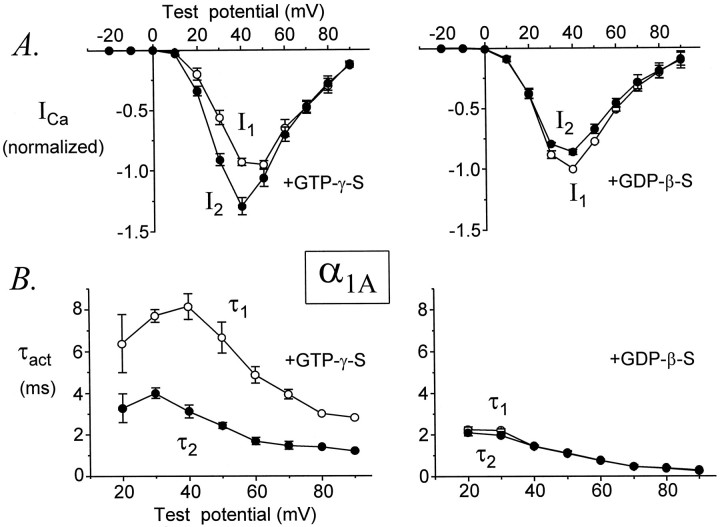
We next compared the voltage dependence of facilitation for α1A, α1B, and α1E Ca channels. To minimize variability attributable to differences in channel density, we restricted our analysis throughout this study to data from cells expressing α1A, α1B, or α1E currents at initial densities of ≤50 pA/pF (Fig. 3, vertical dashed lines). As shown in Figure4A, in cells dialyzed with GTPγS, the amplitudes of currents mediated by α1Awere significantly facilitated (i.e., I2exceeded I1) at test potentials of +20, +30, +40, and +50 mV, whereas at more positive test potentialsI2 and I1 were equal. In contrast, the activation rates of α1A currents were facilitated at all test potentials from +20 to +90 mV (Fig.4B). Thus, τ2 was significantly smaller than τ1 over the entire range of test potentials at which these time constants could be reliably determined. For comparison, in cells dialyzed with GDPβS no facilitation of current amplitudes or activation kinetics was observed at any test potential (Fig. 4).
Fig. 4.
Voltage dependence of facilitation for α1A. A, Current–voltage relationships with GTPγS or GDPβS in the pipette solution.I1 and I2 were normalized to the maximal I1 recorded in each cell and then averaged. B, Average values of τ1 and τ2; the time constants for activation of I1 andI2, respectively, are plotted as a function of test potential. Data are from seven (GTPγS) and four (GDPβS) cells. Voltage protocol as in Figure 1.
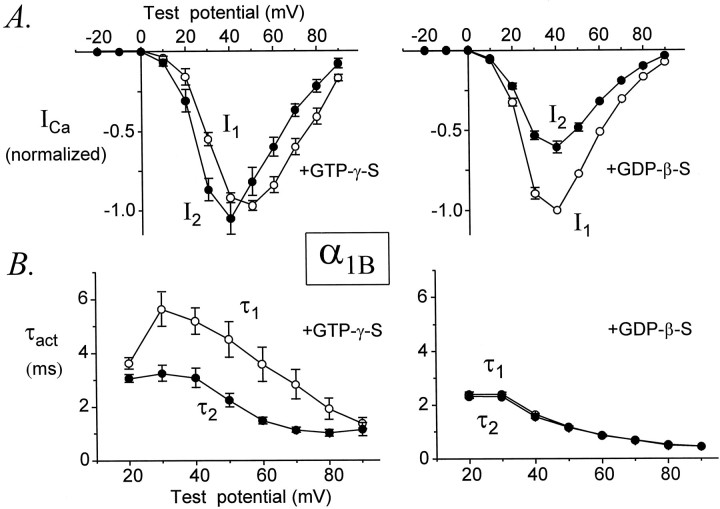
Similar results were obtained for α1B (Fig.5). However, a notable difference was that α1B current amplitudes were facilitated over a smaller range of test potentials (+20, +30, and +40 mV) than were found for α1A. Thus, I2 was smaller thanI1 at voltages above +40 mV, presumably because of inactivation of α1B channels in response to the standard voltage protocol. In contrast, the activation rates of α1B currents were facilitated at all test potentials from +20 to +80 mV. Thus, for both α1A and α1Bthe activation rates of currents were facilitated over a much wider range of test potentials than were current amplitudes.
Fig. 5.
Voltage dependence of facilitation for α1B. Data from six (GTPγS) and four (GDPβS) cells. Legend otherwise as in Figure 4.
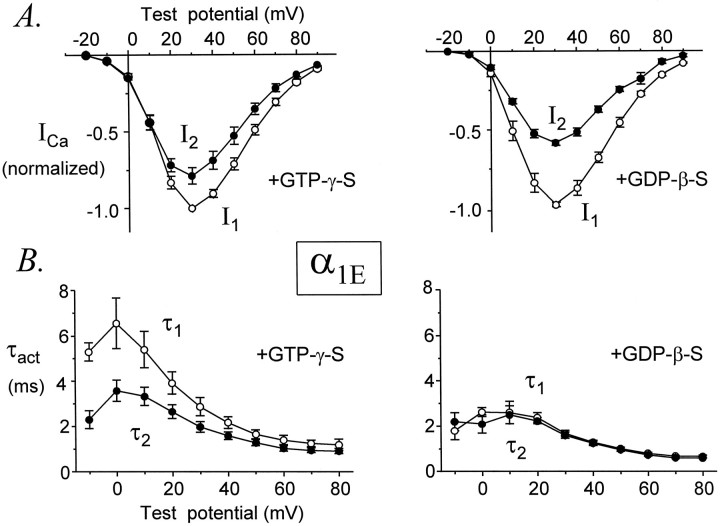
Using the standard voltage protocol, current amplitudes were facilitated in only ∼40% (7 of 18) of cells expressing α1E at initial current densities ≤50 pA/pF. Consequently, the average values of I2 did not exceed those of I1 (Fig.6A). Nonetheless, the average amplitudes of α1E currents clearly indicated the presence of G-protein-dependent modulation, because there was a much greater difference between I2 andI1 in cells dialyzed with GDPβS than in cells dialyzed with GTPγS (Fig. 6A). Furthermore, cells dialyzed with GTPγS exhibited kinetic slowing that was almost completely reversed the conditioning pulse (Fig. 6B). In contrast, kinetic slowing and facilitation were absent from cells dialyzed with GDPβS. Taken together with results presented in Figure2, these data demonstrate G-protein-dependent inhibition and facilitation of α1E Ca channels.
Fig. 6.
Voltage dependence of facilitation for α1E. Data from eight (GTPγS) and six (GDPβS) cells. Legend otherwise as in Figure 4.
No facilitation of α1C
In contrast to α1A, α1B, and α1E subunits, the cardiac α1C subunit was not affected by G-protein activation. In cells dialyzed with GTPγS, I2 was consistently smaller than I1, presumably because of Ca-dependent inactivation of α1C (Fig.7). Also in contrast to α1A, α1B, and α1E, the voltage dependences ofI1 and I2 were not appreciably different for α1C (Fig. 7B). Neither was activation of α1C currents speeded by a conditioning depolarization (Fig. 7C). Furthermore, the amplitudes of α1C currents decreased less than α1A and α1B currents during dialysis with GTPγS (to 82 ± 8% of initial levels; n = 11), and, unlike α1A, α1B, and α1E, the amplitudes of α1C currents did not increase significantly during dialysis with GDPβS (104 ± 5% of control, n = 4). In summary, we were unable to detect any significant differences between α1Ccurrents recorded with GTPγS and those recorded with GDPβS in the pipette solution. These results are consistent with previous studies (Bourinet et al., 1996; Toth et al., 1996; Zhang et al., 1996) reporting that α1C is not inhibited by G-proteins.
Fig. 7.
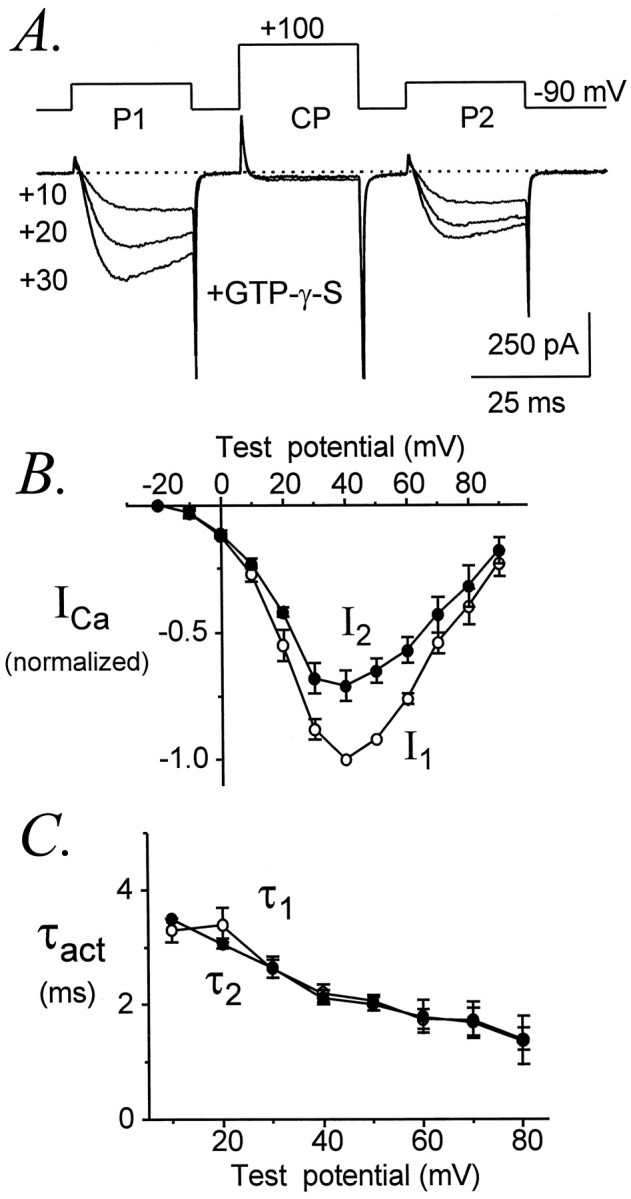
Absence of G-protein-dependent facilitation of α1C. A, Representative α1Ccurrents recorded from a cell dialyzed with GTPγS. Data file 97512011; C = 12 pF; RS= 3.5 MΩ. B, Average voltage dependence ofI1 and I2; data from three cells dialyzed with GTPγS.I1 and I2 were normalized by the maximal I1 in each cell.C, Average voltage dependence of τ1 and τ2; data from three cells dialyzed with GTPγS. Voltage protocol as in Figure 1.
α1A and α1B are facilitated to similar degrees
Previous studies have concluded that α1B is more strongly inhibited than α1A through G-protein-dependent pathways and also that G-protein-inhibited α1B channels are more strongly facilitated by a conditioning depolarization than α1A channels (Bourinet et al., 1996; Zhang et al., 1996;Zamponi et al., 1997). These studies have used neurotransmitter receptors to induce the phasic activation of G-proteins. To examine whether α1B is also more strongly facilitated in the presence of tonically activated G-proteins, we compared α1A and α1B currents in cells dialyzed with GTPγS. As shown in Figure8A, the averageI2/I1 ratios of α1A and α1B currents were identical, demonstrating that the amplitudes of α1A and α1B currents were facilitated to the same extent. Control experiments with intracellular GDPβS produced smallerI2/I1 ratios for α1B (0.63 ± 0.03; n = 10) than for α1A (0.95 ± 0.02; n = 9), suggesting that the voltage protocol caused greater inactivation of unmodulated α1B channels than of unmodulated α1A channels.
Fig. 8.
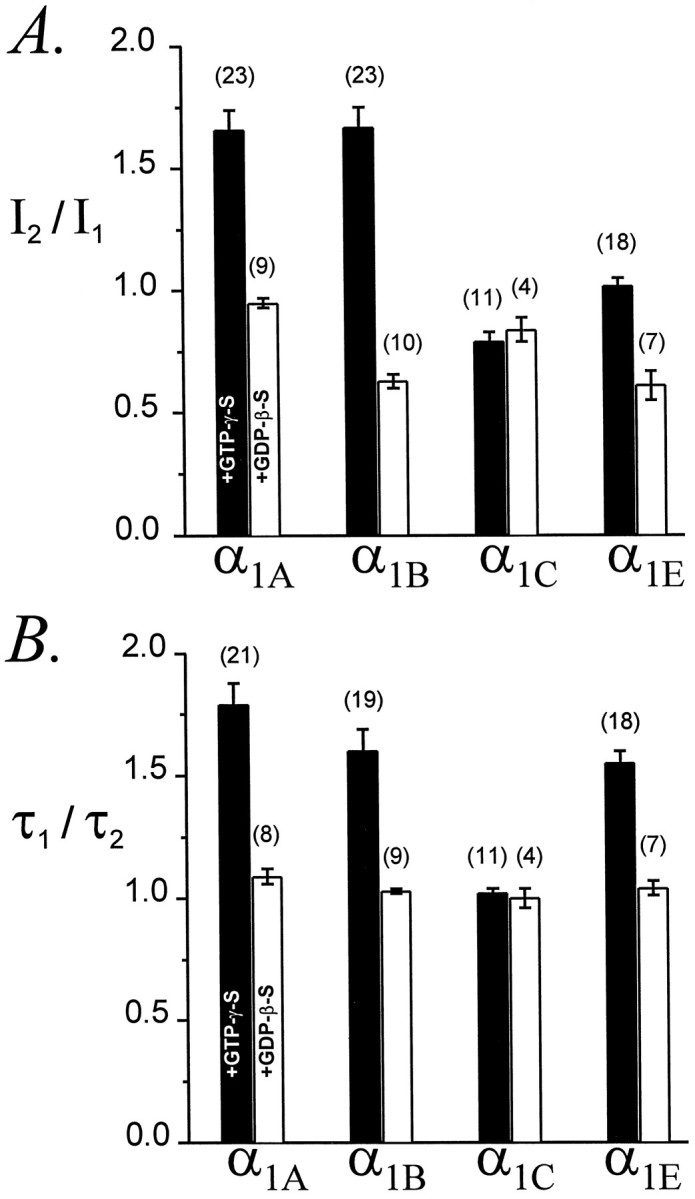
Comparative facilitation of α1A, α1B, α1C, and α1E Ca channels.A, AverageI2/I1ratios for currents recorded with GTPγS (filled bars) or GDPβS (unfilled bars) in the pipette. Voltage protocol as in Figure 1. P1 and P2 were to +30 mV (α1A, α1B, and α1C) or +10 mV (α1E).B, Average τ1/τ2ratios for the same currents. In cells dialysed with GTPγS, the maximal current densities were 16 ± 3 pA/pF (n = 23) for α1A, 15 ± 3 pA/pF (n = 23) for α1B, 16 ± 5 pA/pF (n = 11) for α1C, and 36 ± 4 pA/pF (n= 18) for α1E. In cells dialysed with GDPβS, the maximal current densities were 20 ± 4 pA/pF (n = 9) for α1A, 12 ± 4 pA/pF (n = 10) for α1B, 6 ± 1 pA/pF (n = 4) for α1C, and 28 ± 7 pA/pF (n = 7) for α1E.
Figure 8B compares the facilitation of α1A and α1B activation kinetics. The average τ1/τ2 ratios of α1A and α1B currents were not significantly different, indicating that the conditioning pulse speeded activation of α1A and α1B to the same degree. Thus, once α1A and α1B channels have been inhibited by tonically activated G-proteins, they are equally facilitated by a conditioning depolarization.
Figure 8 also presents data for α1E. With intracellular GTPγS, the averageI2/I1 ratio for α1E was 1.03 ± 0.03 (n = 18), whereas with intracellular GDPβS this ratio was only 0.61 ± 0.06 (n = 7), indicating a significant (p < 0.001) G-protein-dependent effect. Further evidence of modulation was provided by the substantial facilitation of α1E activation kinetics. In fact, the average τ1/τ2 ratios for α1Ecurrents were statistically indistinguishable from those of α1A and α1B currents (Fig.8B). Thus, with intracellular GTPγS these τ1/τ2 ratios were 1.79 ± 0.09 (n = 21), 1.60 ± 0.09 (n = 19), and 1.55 ± 0.05 (n = 8) for α1A, α1B, and α1E, respectively (p = 0.07). With intracellular GDPβS, these ratios were 1.09 ± 0.03 (n = 8), 1.03 ± 0.01 (n = 9), and 1.04 ± 0.03 (n = 7), respectively (p = 0.17). These comparisons further establish the ability of α1E to be modulated through a G-protein-dependent, presumably membrane-delimited pathway.
The kinetics of facilitation are very similar for α1A, α1B, and α1E
Facilitation is thought to reflect dissociation of Gβγ subunits from Ca channels. Facilitation is transient and decays with time after a conditioning depolarization because Gβγ subunits rebind to channels and reestablish inhibition at negative potentials. To further explore the relative modulation of neuronal Ca channels by tonically activated G-proteins, we compared both the onset and the decay of facilitation for α1A, α1B, and α1E.
The onset of facilitation was measured by plottingI2/I1 or τ1/τ2 ratios of α1Aand α1B currents as a function of conditioning pulse duration. For α1E we plotted only τ1/τ2 ratios. As shown in Figure9, the onset of facilitation could be approximated by a single exponential function, producing a time constant (τonset) to describe this process. As the duration of the conditioning pulse was increased from 0 to 30 msec, theI2/I1 ratio increased with a time constant of 4.18 ± 0.18 msec (n = 5) for α1A currents and 5.30 ± 0.20 msec (n = 7) for α1B currents. Although this difference is statistically significant (p = 0.003), it is quite small. Similarly, τ1/τ2 ratios increased with time constants of 4.48 ± 0.96 msec (n = 5) for α1A currents, 3.87 ± 0.58 msec (n = 7) for α1B currents, and 3.76 ± 0.42 msec (n = 9) for α1E currents; these time constants are not different (p = 0.72). Thus, facilitation develops with very similar kinetics for α1A, α1B, and α1E Ca channels.
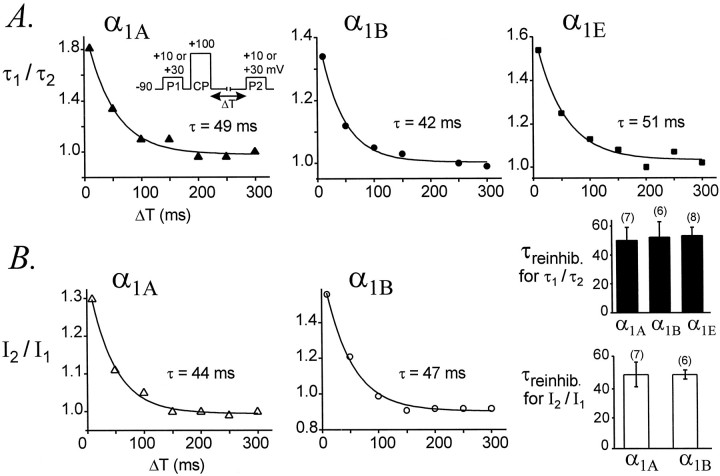
The decay of facilitation was monitored by plottingI2/I1 or τ1/τ2 ratios as a function of a variable interval (ΔT) between the conditioning pulse and the second test pulse (Fig. 10). Because the decay of facilitation varies with its magnitude (Golard and Siegelbaum, 1993;Elmslie and Jones, 1994), we only compared currents that were facilitated to similar degrees (I2/I1 ratios of 1.6 ± 0.1 for α1A and 1.7 ± 0.1 for α1B; and τ1/τ2ratios of 2.1 ± 0.2 for α1A, 1.8 ± 0.2 for α1B, and 1.6 ± 0.1 for α1E). The decays ofI2/I1 and τ1/τ2 were fit by single exponential functions, and time constants for reinhibition (τreinhib) were obtained.I2/I1 ratios decayed with an average time constant of 48 ± 8 msec (n = 7) for α1A currents and 48 ± 3 msec (n = 6) for α1B currents (p = 0.94). τ1/τ2 ratios decayed with an average time constant of 51 ± 8 msec (n = 7) for α1A currents, 53 ± 10 msec (n = 6) for α1B currents, and 55 ± 7 msec (n = 8) for α1E currents (p = 0.94). These results indicate that facilitation decays from α1A, α1B, and α1E Ca channels at very similar speeds.
Fig. 10.
Facilitation decays from α1A, α1B, and α1E Ca channels at the same rate. τ1/τ2 ratios (A) andI2/I1ratios (B) are plotted as a function of ΔT, the variable interval between CP and P2 for representative cells. Each plot was fit by a single exponential function to yield a time constant for reinhibition (τreinhib). Average values of τreinhib are summarized in the bar graphs (bottom right). The pipette solution contained GTPγS. α1A, Data file 97731092; C = 24 pF; RS = 2.9 MΩ. α1B, Data file 97729010; C = 21 pF; RS = 3.0 MΩ. α1E, Data file 97D24046; C = 16 pF; RS = 3.7 MΩ. Data from cells expressing maximal current densities of 16 ± 4 pA/pF (α1A, n = 7), 23 ± 6 pA/pF (α1B, n = 6), and 39 ± 6 pA/pF (α1E, n = 8).
The kinetics of modulation can be represented by the scheme (afterCurrie and Fox, 1997; Zhou et al., 1997):
During a facilitating depolarization to +100 mV, Gβγ subunits should dissociate from the channels. If Gβγ subunits do not also rebind channels during the depolarization, thenkoff can be approximated by 1/τonset. On repolarization to −90 mV, Gβγ subunits should rebind to channels at a rate equal to kon[Gβγ] + koff. If resting inhibition of Ca channels by Gβγ subunits is strong, as suggested by the absence of a separate, rapidly activating component of current (Fig. 1), thenkoff should be small, andkon [Gβγ] can be approximated by 1/τreinhib. Assuming that all three channel types experience similar concentrations of Gβγ subunits, our estimates of τonset and τreinhib suggest thatkoff and kon have very similar values for α1A, α1B, and α1E. Although this argument is not rigorous, it is consistent with the idea that Gβγ subunits dissociate from and reassociate with α1A, α1B, and α1E channels at very similar or identical rates.
Large segments of α1B are unnecessary for its modulation by G-protein
It was previously demonstrated by Zhou et al. (1995) that deleting large portions of the cytoplasmic II–III loop and C terminus from αlB (mutant αlB-DD) does not eliminate G-protein-dependent inhibition or facilitation. However, in their experiments αlB-DD was expressed in dysgenic myotubes, where the magnitude of facilitation was small and where kinetic slowing was not apparent in either wild-type αlBor mutant αlB-DD currents, raising the possibility that the native behavior of αlB might not be fully reproduced within the cellular environment of skeletal muscle. To further examine the functional importance of the II–III loop and C terminus in Ca channel modulation, we expressed αlB-DD in HEK293 cells and quantified its G-protein-dependent facilitation.
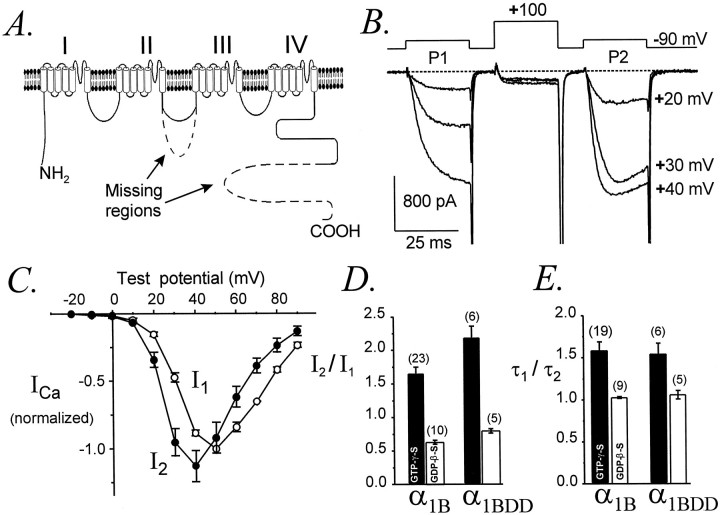
In αlB-DD, amino acids 829–995 have been deleted from the II–III loop, and residues 1877–2338 have been deleted from the C terminus (Fig.11A). As illustrated in Figure 11B, currents mediated by αlB-DD exhibited strong facilitation of activation rates and current amplitudes. The voltage dependences of inhibited and facilitated αlB-DD currents (I1and I2, respectively) were very similar (Fig. 11C) to currents mediated by the full-length αlB (Fig. 5), confirming that the basic voltage-dependent properties of αlB-DD were not appreciably changed by its deletions. During ≥5 min of intracellular dialysis with GTPγS, the amplitudes of αlB-DD currents decreased to 63 ± 13% (n = 6) of initial levels, comparable to the decrease observed for the full-length αlB (56 ± 6%, n = 35). Interestingly, with intracellular GTPγS theI2/I1 ratio for αlB-DD was significantly larger than for wild-type αlB (2.18 ± 0.15, n = 6; vs 1.67 ± 0.08, n = 23; p = 0.01), suggesting greater facilitation or perhaps less inactivation of the mutant, although the voltage dependence of I2suggests that inactivation of αlB-DD was unaltered.I2/I1 ratios (Fig.11D) were also slightly larger for αlB-DD than for αlB in the presence of intracellular GDPβS (0.86 ± 0.06, n = 5; vs 0.63 ± 0.03, n = 10; p = 0.001). However, the activation kinetics of αlB-DD and αlB currents were equally facilitated, and τ1/τ2 ratios were indistinguishable between wild-type and mutant channels (Fig. 11E). Activation rates of αlB-DD and αlB currents were also identical in the absence of G-protein stimulation. For example, with intracellular GDPβS and at a test potential of +30 mV, τ1 was 3.1 ± 0.3 msec (n = 5) for αlB-DD and 3.1 ± 0.2 msec (n = 10) for αlB. These results confirm that amino acids 829–995 and 1877–2338 are not required for modulation of αlB by G-proteins and further demonstrate that these channel regions are not needed for facilitation of current amplitudes or activation kinetics.
Fig. 11.
Undiminished G-protein-dependent modulation of α1B-DD. A, Diagrammatic representation of the mutant N-type Ca channel α1B-DD, which lacks amino acids 829–995 from the II–III loop and amino acids 1877–2338 from the C terminus. The deleted regions are indicated by dashed lines. B, Facilitation of α1B-DDcurrents, evoked using the standard voltage protocol. Data file 97321108; C = 43 pF; RS= 3.9 MΩ. C, Voltage dependence of inhibited (I1) and facilitated (I2) currents mediated by α1B-DD. I1 andI2 were normalized to the maximalI1 in each cell (n = 4). The standard voltage protocol was used. D, Facilitation of α1B-DD current amplitudes is slightly larger than for wild-type α1B. Standard voltage protocol, with P1 and P2 to +30 mV. The pipette contained GTPγS (filled bars) or GDPβS (unfilled bars).E, Facilitation of activation kinetics is identical for α1B-DD and α1B. With intracellular GTPγS, τ1/τ2 ratios were 1.60 ± 0.09 (n = 21) for α1B and 1.56 ± 0.11 (n = 6) for α1B-DD(p = 0.91). With intracellular GDPβS, τ1/τ2 ratios were 1.03 ± 0.01 (n = 5) for α1B and 1.06 ± 0.05 (n = 5) for α1B-DD(p = 0.41). D,E, Data from cells with maximal current densities of 15 ± 3 pA/pF (α1B,n = 23) and 18 ± 6 pA/pF (α1B-DD, n = 6) in the GTPγS experiments and 11 ± 5 pA/pF (α1B,n = 5) and 6 ± 1 pA/pF (α1B-DD, n = 5) in the GDPβS experiments.
DISCUSSION
The magnitude of G-protein-dependent facilitation correlates with Ca current density
Variations in channel density have previously been shown to correlate with significant differences in channel behavior (cf. Adams et al., 1996). In the present study we found that low-density α1A, α1B, and α1E currents exhibited the greatest amount of facilitation, whereas high-density currents often lacked facilitation (Fig. 3). This observation suggests that Ca channel density somehow influences the extent to which G-proteins are able to produce inhibition. A correlation between current density and extent of modulation might result if cells expressing a high density of Ca channel α1 subunits also expressed an excess of Ca channel β subunits, which are thought to antagonize G-protein-mediated Ca channel inhibition (Campbell et al., 1995) by competing with Gβγ for binding sites on the α1subunit (De Waard et al., 1997; Qin et al., 1997). Alternatively, cells expressing high densities of Ca channels might express insufficient G-proteins to inhibit all of the Ca channels, or the endogenous G-proteins of HEK293 cells may not have access to Ca channels expressed at high densities.
α1A and α1B exhibit similar modulation by tonically activated G-proteins
In our experiments, α1A and α1B showed the same amount of G-protein-dependent facilitation. Thus,I2/I1 ratios and τ1/τ2 ratios were equivalent between α1A and α1B channels (Fig. 8). Furthermore, our measurements of τonset and τreinhib(Fig. 9, 10) strongly suggest that G-proteins dissociate from and reassociate with α1A and α1B Ca channels at the same rates. Our findings that α1A and α1B are equally facilitated and also have the same kinetics of facilitation differ from the results of previous studies (Bourinet et al., 1996; Zhang et al., 1996; Currie and Fox, 1997;Zamponi et al., 1997). Our results may arise from our expression of a particular combination of Ca channel subunits, our consideration of Ca current density in the data analysis, or our use of GTPγS to produce tonically activated as opposed to phasically activated G-proteins (but see Currie and Fox, 1997 for differential effects of GTPγS on native P/Q- and N-type channels). As one possibility, α1Bchannels may be localized more closely to neurotransmitter receptors and/or G-proteins than α1A channels, such that α1B would experience a higher concentration of Gβγ subunits after receptor activation. In contrast, during tonic activation of G-proteins with GTPγS, the concentration of Gβγ may be relatively uniform throughout the cell, and differences between the localization of α1A and α1B might not affect their modulation. This possibility is in keeping with the conclusions of Wilding et al. (1995) and Zhou et al. (1997) that activated opioid receptors can only inhibit nearby Ca channels, suggesting that phasically activated G-proteins have a limited range. It is also possible that GTPγS does not activate as many G-proteins, or the same varieties of G-proteins, as activated neurotransmitter receptors.
α1E exhibits G-protein-dependent inhibition and facilitation
In previous studies, Bourinet et al. (1996), Toth et al., (1996), and Page et al. (1997) concluded that α1E was not significantly inhibited by G-proteins, whereas Yassin et al. (1996),Mehrke et al. (1997), Shekter et al. (1997), and Qin et al. (1997)concluded the opposite. Our present results confirm the latter view. Although the amplitudes of α1E currents were not always facilitated using the standard voltage protocol, we observed very consistent facilitation of α1E activation kinetics (Figs.2, 6, 8). In fact, the average τ1/τ2ratios of α1E currents were indistinguishable from those of α1A and α1B currents (Fig.8B), suggesting that the magnitude of G-protein-dependent facilitation is quite comparable among α1A, α1B, and α1E channels. Our results also indicate that voltage-dependent inactivation can obscure facilitation of α1E current amplitudes. Inactivation produced a similar, although less pronounced, effect on the facilitation of α1B current amplitudes (Fig. 5). Thus, activation kinetics appear to be more sensitive and more reliable than current amplitudes as an index of G-protein-dependent modulation, particularly for channels such as α1E that inactivate at relatively negative potentials.
On the macroscopic level, Ca channel facilitation can be manifested as increased current amplitudes, increased activation rates, or both. Inactivation of some Ca channels can prevent facilitation of macroscopic current amplitudes but should not prevent the facilitated opening (i.e., shorter first latency; Patil et al., 1996) of the remaining noninactivated channels. Thus, facilitation of activation kinetics should occur even if the facilitating depolarizations inactivate some channels. Under physiological conditions in which Ca channel activation and subsequent Ca influx is triggered by action potentials and other brief depolarizations, a facilitation of Ca channel activation kinetics may be more functionally significant than a facilitation of current amplitudes. Ca channels formed by α1E appear to be localized to neuronal cell bodies and dendrites (Yokoyama et al., 1995). The ability of α1E to undergo G-protein-mediated inhibition and facilitation may therefore be important for the integration and propagation of dendritic electrical signals and possibly also for gene transcription within neuronal cell nuclei.
α1C does not exhibit G-protein-dependent facilitation
The rabbit cardiac α1C subunit did not exhibit kinetic slowing or facilitation in the presence of tonically activated G-proteins. Our results thus agree with previous reports (Bourinet et al., 1994, 1996; Zhou et al., 1995; Zhang et al., 1996) that α1C is not modulated through a membrane-delimited, G-protein-dependent pathway. In our experiments α1C also did not exhibit voltage-dependent facilitation, in contrast to results obtained with the rat neuronal α1C expressed inXenopus oocytes (Bourinet et al., 1994; Cens et al., 1996). Voltage-dependent facilitation may be limited to particular splice variants of α1C, manifested only in certain expression systems, or may require longer conditioning depolarizations than used in the present study.
A Gβγ interaction site identified within the C terminus of α1E is not required for modulation of α1B
We quantified the G-protein-dependent facilitation of a deletion mutant of the N-type Ca channel (αlB-DD) that is missing amino acids 829–995 from the II–III loop and amino acids 1877–2338 from the C terminus (Fig. 11A). αlB-DD displayed the same magnitudes of kinetic slowing and facilitation of activation kinetics as the full-length, wild-type αlB subunit (Fig. 11D,E), demonstrating that the missing regions are not required for G-protein-dependent inhibition or facilitation of αlB. This result is particularly significant in view of the recent identification by Qin et al. (1997) of an ∼38 amino acid residue sequence within the C terminus of αlE that is required for its inhibition by Gβγ. The corresponding region of αlB, which was shown by Qin et al. (1997) to bind Gβγ in vitro, is not present within the α1B-DD mutant. Therefore, this region cannot also be essential for G-protein-dependent modulation of α1B. The results obtained with α1B-DD thus raise the intriguing possibility that different structural regions of α1B and α1E mediate their interactions with G-proteins.
Footnotes
This work was supported by National Institutes of Health Grant R01 NS34423 and a Basic Research Grant from the Muscular Dystrophy Association to B. Adams. U.M. was the recipient of a Consejo Nacional de Ciencia y Tecnologia Fellowship. We thank K. Campbell, Y. Mori, T. Snutch, and T. Tanabe for providing expression plasmids, T. Smith for technical assistance, and two anonymous reviewers for constructive criticisms.
Correspondence should be addressed to Dr. Brett Adams, Department of Physiology and Biophysics, 5–660 Bowen Science Building, University of Iowa College of Medicine, Iowa City, IA 52242-1109.
REFERENCES
- 1.Adams BA, Mori Y, Kim MS, Tanabe T, Beam KG. Heterologous expression of BI Ca2+ channels in dysgenic skeletal muscle. J Gen Physiol. 1994;104:985–996. doi: 10.1085/jgp.104.5.985. [DOI] [PMC free article] [PubMed] [Google Scholar]
- 2.Adams BA, Tanabe T, Beam KG. Ca2+ current activation rate correlates with α1 subunit density. Biophys J. 1996;71:156–162. doi: 10.1016/S0006-3495(96)79212-3. [DOI] [PMC free article] [PubMed] [Google Scholar]
- 3.Bean BP. Neurotransmitter inhibition of neuronal calcium currents by changes in channel voltage dependence. Nature. 1989;340:153–156. doi: 10.1038/340153a0. [DOI] [PubMed] [Google Scholar]
- 4.Bernheim L, Beech DJ, Hille B. A diffusible second messenger mediates one of the pathways coupling receptors to calcium channels in rat sympathetic neurons. Neuron. 1991;6:859–867. doi: 10.1016/0896-6273(91)90226-p. [DOI] [PubMed] [Google Scholar]
- 5.Bourinet E, Charnet P, Tomlinson WJ, Stea A, Snutch TP, Nargeot J. Voltage-dependent facilitation of a neuronal α1C L-type calcium channel. EMBO J. 1994;13:5032–5039. doi: 10.1002/j.1460-2075.1994.tb06832.x. [DOI] [PMC free article] [PubMed] [Google Scholar]
- 6.Bourinet E, Soong TW, Stea A, Snutch TP. Determinants of the G-protein-dependent opioid modulation of neuronal calcium channels. Proc Natl Acad Sci USA. 1996;93:1486–1491. doi: 10.1073/pnas.93.4.1486. [DOI] [PMC free article] [PubMed] [Google Scholar]
- 7.Brody DL, Patil PG, Mulle JG, Snutch TP, Yue DT. Bursts of action potential waveforms relieve G-protein inhibition of recombinant P/Q-type Ca2+ channels in HEK 293 cells. J Physiol (Lond) 1997;499:637–644. doi: 10.1113/jphysiol.1997.sp021956. [DOI] [PMC free article] [PubMed] [Google Scholar]
- 8.Campbell V, Berrow NS, Fitzgerald EM, Brickley K, Dolphin AC. Inhibition of the interaction of G-protein Go with calcium channels by the calcium channel β-subunit in rat neurones. J Physiol (Lond) 1995;485:365–372. doi: 10.1113/jphysiol.1995.sp020735. [DOI] [PMC free article] [PubMed] [Google Scholar]
- 9.Cens T, Mangoni ME, Richard S, Nargeot J, Charnet P. Coexpression of the β2 subunit does not induce voltage-dependent facilitation of the class C L-type Ca channel. Pflügers Arch. 1996;431:771–774. [PubMed] [Google Scholar]
- 10.Currie KPM, Fox AP. Comparison of N- and P/Q-type voltage-gated calcium channel current inhibition. J Neurosci. 1997;17:4570–4579. doi: 10.1523/JNEUROSCI.17-12-04570.1997. [DOI] [PMC free article] [PubMed] [Google Scholar]
- 11.De Waard M, Liu HY, Walker D, Scott VES, Gurnett CA, Campbell KP. Direct binding of G-protein βγ complex to voltage-dependent calcium channels. Nature. 1997;385:446–450. doi: 10.1038/385446a0. [DOI] [PubMed] [Google Scholar]
- 12.Diverse-Peirluissi M, Goldsmith PK, Dunlap K. Transmitter-mediated inhibition of N-type calcium channels in sensory neurons involves multiple GTP-binding proteins and subunits. Neuron. 1995;14:191–200. doi: 10.1016/0896-6273(95)90254-6. [DOI] [PubMed] [Google Scholar]
- 13.Dunlap K, Luebke JI, Turner TJ. Exocytotic Ca channels in mammalian central neurons. Trends Neurosci. 1995;18:89–98. [PubMed] [Google Scholar]
- 14.Elmslie KS, Jones SW. Concentration dependence of neurotransmitter effects on calcium current kinetics in frog sympathetic neurones. J Physiol (Lond) 1994;481:35–46. doi: 10.1113/jphysiol.1994.sp020417. [DOI] [PMC free article] [PubMed] [Google Scholar]
- 15.Elmslie KS, Zhou W, Jones SW. LHRH and GTP-γ-S modify calcium current activation in bullfrog sympathetic neurons. Neuron. 1990;6:75–80. doi: 10.1016/0896-6273(90)90035-e. [DOI] [PubMed] [Google Scholar]
- 16.Fujita Y, Mynlieff M, Dirksen RT, Kim MS, Niidome T, Nakai J, Friedrich T, Iwabe N, Miyata T, Furuichi T, Furutama D, Mikoshiba K, Mori Y, Beam KG. Primary structure and functional expression of the ω-Conotoxin-sensitive N-type calcium channel from rabbit brain. Neuron. 1993;10:585–598. doi: 10.1016/0896-6273(93)90162-k. [DOI] [PubMed] [Google Scholar]
- 17.Golard A, Siegelbaum SA. Kinetic basis for the voltage-dependent inhibition of N-type calcium current by somatostatin and norepinephrine in chick sympathetic neurons. J Neurosci. 1993;13:3884–38. doi: 10.1523/JNEUROSCI.13-09-03884.1993. [DOI] [PMC free article] [PubMed] [Google Scholar]
- 18.Hamill OP, Marty A, Neher E, Sakmann B, Sigworth FJ. Improved patch-clamp techniques for high-resolution current recording from cells and cell-free membrane patches. Pflügers Arch. 1981;319:85–100. doi: 10.1007/BF00656997. [DOI] [PubMed] [Google Scholar]
- 19.Herlitze S, Garcia DE, Mackie K, Hille B, Scheuer T, Catterall WA. Modulation of Ca2+ channels by G-protein βγ subunits. Nature. 1996;380:258–262. doi: 10.1038/380258a0. [DOI] [PubMed] [Google Scholar]
- 20.Herlitze S, Hockerman GH, Scheuer T, Catterall WA. Molecular determinants of inactivation and G-protein modulation in the intracellular loop connecting domains I and II of the calcium channel α1A subunit. Proc Natl Acad Sci USA. 1997;94:1512–1516. doi: 10.1073/pnas.94.4.1512. [DOI] [PMC free article] [PubMed] [Google Scholar]
- 21.Hille B. Modulation of ion-channel function by G-protein-coupled receptors. Trends Neurosci. 1994;17:531–536. doi: 10.1016/0166-2236(94)90157-0. [DOI] [PubMed] [Google Scholar]
- 22.Hofmann F, Biel M, Flockerzi V. Molecular basis for Ca2+ channel diversity. Annu Rev Neurosci. 1994;17:399–418. doi: 10.1146/annurev.ne.17.030194.002151. [DOI] [PubMed] [Google Scholar]
- 23.Ikeda SR. Double-pulse calcium channel current facilitation in adult rat sympathetic neurones. J Physiol (Lond) 1991;439:181–214. doi: 10.1113/jphysiol.1991.sp018663. [DOI] [PMC free article] [PubMed] [Google Scholar]
- 24.Ikeda SR. Voltage-dependent modulation of N-type calcium channels by G-protein βγ subunits. Nature. 1996;380:255–258. doi: 10.1038/380255a0. [DOI] [PubMed] [Google Scholar]
- 25.Jones SW, Elmslie KS. Transmitter modulation of neuronal calcium channels. J Membr Biol. 1997;155:1–10. doi: 10.1007/s002329900153. [DOI] [PubMed] [Google Scholar]
- 26.Jurman ME, Boland LM, Liu Y, Yellen G. Visual identification of individual transfected cells for electrophysiology using antibody coated beads. Biotechniques. 1994;17:876–881. [PubMed] [Google Scholar]
- 27.Kavalali ET, Zhuo M, Bito H, Tsien RW. Dendritic Ca channels characterized by recordings from isolated hippocampal dendritic segments. Neuron. 1997;18:651–663. doi: 10.1016/s0896-6273(00)80305-0. [DOI] [PubMed] [Google Scholar]
- 28.Kim HL, Kim H, Lee P, King RG, Chin H. Rat brain expresses an alternatively spliced form of the dihydropyridine-sensitive L-type calcium channel α2 subunit. Proc Natl Acad Sci USA. 1992;89:3251–3255. doi: 10.1073/pnas.89.8.3251. [DOI] [PMC free article] [PubMed] [Google Scholar]
- 29.Koh DS, Hille B. Modulation by neurotransmitters of catecholamine secretion from sympathetic ganglion neurons detected by amperometry. Proc Natl Acad Sci USA. 1997;94:1506–1511. doi: 10.1073/pnas.94.4.1506. [DOI] [PMC free article] [PubMed] [Google Scholar]
- 30.Mehrke G, Pereverzev A, Grabsch H, Hescheler J, Schneider T. Receptor-mediated modulation of recombinant neuronal class E calcium channels. FEBS Lett. 1997;408:261–270. doi: 10.1016/s0014-5793(97)00437-7. [DOI] [PubMed] [Google Scholar]
- 31.Mikami A, Imoto K, Tanabe T, Niidome T, Mori Y, Takeshima H, Narumiya S, Numa S. Primary structure and functional expression of the cardiac dihydropyridine-sensitive calcium channel. Nature. 1989;340:230–233. doi: 10.1038/340230a0. [DOI] [PubMed] [Google Scholar]
- 32.Mintz I, Bean BP. GABAB receptor inhibition of P-type Ca2+ channels in central neurons. Neuron. 1993;10:889–898. doi: 10.1016/0896-6273(93)90204-5. [DOI] [PubMed] [Google Scholar]
- 33.Mishina M, Kurosaki T, Tobimatsu T, Morimoto Y, Noda M, Yamamoto T, Terao M, Lindstrom J, Takahashi T, Kuno M, Numa S. Expression of functional acetylcholine receptor from cloned cDNAs. Nature. 1984;307:604–608. doi: 10.1038/307604a0. [DOI] [PubMed] [Google Scholar]
- 34.Mori Y, Friedrich T, Kim MS, Mikami A, Nakai J, Ruth P, Bosse E, Hofmann F, Flockerzi V, Furuichi T, Mikoshiba K, Imoto K, Tanabe T, Numa S. Primary structure and functional expression from complementary DNA of a brain calcium channel. Nature. 1991;350:489–402. doi: 10.1038/350398a0. [DOI] [PubMed] [Google Scholar]
- 35.Niidome T, Kim MS, Friedrich T, Mori Y. Molecular cloning and characterization of a novel calcium channel from rabbit brain. FEBS Lett. 1992;308:7–13. doi: 10.1016/0014-5793(92)81038-n. [DOI] [PubMed] [Google Scholar]
- 36.Page KM, Stephens GJ, Berrow NS, Dolphin AC. The intracellular loop between domains I and II of the B-type calcium channel confers aspects of G-protein sensitivity to the E-type calcium channel. J Neurosci. 1997;17:1330–1338. doi: 10.1523/JNEUROSCI.17-04-01330.1997. [DOI] [PMC free article] [PubMed] [Google Scholar]
- 37.Patil PG, De Leon M, Reed RR, Dubel S, Snutch TP, Yue DT. Elementary events underlying voltage-dependent G-protein inhibition of N-type calcium channels. Biophys J. 1996;71:2509–2521. doi: 10.1016/S0006-3495(96)79444-4. [DOI] [PMC free article] [PubMed] [Google Scholar]
- 38.Perez-Reyes E, Cribbs LL, Daud A, Lacerda AE, Barclay J, Williamson MP, Fox M, Rees M, Lee JH. Molecular characterization of a neuronal low-voltage-activated T-type calcium channel. Nature. 1998;391:896–900. doi: 10.1038/36110. [DOI] [PubMed] [Google Scholar]
- 39.Qin N, Platano D, Olcese R, Stefani E, Birnbaumer L. Direct interaction of Gβγ with a C-terminal Gβγ-binding domain of the Ca2+ channel α1 subunit is responsible for channel inhibition by G-protein-coupled receptors. Proc Natl Acad Sci USA. 1997;94:8866–8871. doi: 10.1073/pnas.94.16.8866. [DOI] [PMC free article] [PubMed] [Google Scholar]
- 40.Sah DWY. Neurotransmitter modulation of calcium current in rat spinal cord neurons. J Neurosci. 1990;10:136–141. doi: 10.1523/JNEUROSCI.10-01-00136.1990. [DOI] [PMC free article] [PubMed] [Google Scholar]
- 41.Shekter LR, Taussig R, Gillard SE, Miller RJ. Regulation of human neuronal calcium channels by G-protein βγ subunits expressed in human embryonic kidney 293 cells. Mol Pharmacol. 1997;52:282–291. doi: 10.1124/mol.52.2.282. [DOI] [PubMed] [Google Scholar]
- 42.Tanabe T, Beam KG, Adams BA, Niidome T, Numa S. Regions of the skeletal muscle dihydropyridine receptor critical for excitation-contraction coupling. Nature. 1990;346:567–569. doi: 10.1038/346567a0. [DOI] [PubMed] [Google Scholar]
- 43.Toth PT, Shekter LR, Ma GH, Philipson LR, Miller RJ. Selective G-protein regulation of neuronal calcium channels. J Neurosci. 1996;16:4617–4624. doi: 10.1523/JNEUROSCI.16-15-04617.1996. [DOI] [PMC free article] [PubMed] [Google Scholar]
- 44.Wakamori M, Niidome T, Furutama D, Furuichi T, Mikoshiba K, Fujita Y, Tanaka I, Katayama K, Yatani A, Schwartz A, Mori Y. Distinctive functional properties of the neuronal BII (class E) calcium channel. Receptors Channels. 1994;2:303–314. [PubMed] [Google Scholar]
- 45.Wilding TJ, Womack MD, McCleskey EW. Fast local signal transduction between the μ opioid receptor and Ca channels. J Neurosci. 1995;15:4124–4132. doi: 10.1523/JNEUROSCI.15-05-04124.1995. [DOI] [PMC free article] [PubMed] [Google Scholar]
- 46.Witcher DR, De Waard M, Sakamoto J, Franzini-Armstrong C, Pragnell M, Kahl SD, Campbell KP. Subunit identification and reconstitution of the N-type Ca channel complex purified from brain. Science. 1993;261:486–489. doi: 10.1126/science.8392754. [DOI] [PubMed] [Google Scholar]
- 47.Wu LG, Saggau P. Presynaptic inhibition of elicited neurotransmitter release. Trends Neurosci. 1997;20:204–212. doi: 10.1016/s0166-2236(96)01015-6. [DOI] [PubMed] [Google Scholar]
- 48.Yassin M, Zong SQ, Tanabe T. G-protein modulation of neuronal class E (α1E) calcium channel expressed in GH3 cells. Biochem Biophys Res Commun. 1996;220:453–458. doi: 10.1006/bbrc.1996.0426. [DOI] [PubMed] [Google Scholar]
- 49.Yokoyama CT, Westenbroek RE, Hell JW, Soong TW, Snutch TP, Catterall WA. Biochemical properties and subcellular distribution of the neuronal class E calcium channel α1 subunit. J Neurosci. 1995;15:6419–6432. doi: 10.1523/JNEUROSCI.15-10-06419.1995. [DOI] [PMC free article] [PubMed] [Google Scholar]
- 50.Zamponi GW, Bourinet E, Nelson D, Nargeot J, Snutch TP. Crosstalk between G-proteins and protein kinase C mediated by the calcium channel α1 subunit. Nature. 1997;385:442–446. doi: 10.1038/385442a0. [DOI] [PubMed] [Google Scholar]
- 51.Zhang JF, Ellinor PT, Aldrich RW, Tsien RW. Multiple structural elements in voltage-dependent Ca2+ channels support their inhibition by G-proteins. Neuron. 1996;17:991–1003. doi: 10.1016/s0896-6273(00)80229-9. [DOI] [PubMed] [Google Scholar]
- 52.Zhou J, Zong SQ, Tanabe T. Modulation of cloned neuronal calcium channels through membrane-delimited pathway. Biochem Biophys Res Commun. 1995;208:485–491. doi: 10.1006/bbrc.1995.1364. [DOI] [PubMed] [Google Scholar]
- 53.Zhou JY, Shapiro MS, Hille B. Speed of Ca2+ channel modulation by neurotransmitters in rat sympathetic neurons. J Neurophysiol. 1997;77:2040–2048. doi: 10.1152/jn.1997.77.4.2040. [DOI] [PubMed] [Google Scholar]
- 54.Zong SQ, Yassin M, Tanabe T. G-protein modulation of α1A (P/Q) type calcium channel expressed in GH3 cells. Biochem Biophys Res Commun. 1995;215:302–308. doi: 10.1006/bbrc.1995.2466. [DOI] [PubMed] [Google Scholar]


