Abstract
In primate striate cortex, geniculocortical afferents in layer IVc terminate in parallel stripes called ocular dominance columns. We propose that this segregation of ocular inputs generates a related but distinct columnar system of monocular core zones alternating with binocular border strips. Evidence for this functional parcellation was obtained by comparing the effects of enucleation, eyelid suture, and retinal laser lesions on cytochrome oxidase (CO) activity in eight macaques. Enucleation produced a high-contrast pattern of dark and light columns in layer IVc, corresponding precisely to the ocular dominance columns, whereas eyelid suture produced a low-contrast pattern of thin dark columns alternating with wide pale columns. [3H]Proline eye injection showed that the thin dark columns corresponded to the core zones of the open eye’s ocular dominance columns. The wide pale columns resulted from loss of CO activity in the sutured eye’s core zones and within both eyes’ border strips. Loss of CO activity within both eyes’ border strips suggested that these regions are binocular. To confirm our findings, we compared different CO patterns in the same cortex by making retinal laser lesions in four animals. They produced a CO pattern tantamount to “focal” enucleation, although contrast was low when laser damage was confined to the outer retina. CO levels in cortical scotomas remained severely depressed for months after retinal lesions, even when the other eye was enucleated. This observation provided little anatomical support for the notion of topographic plasticity after visual deafferentation. In a single human subject with macular degeneration, CO revealed a low-contrast pattern of ocular dominance columns, resembling the pattern in monkeys with laser-induced photoreceptor damage.
Keywords: cytochrome oxidase, ocular dominance column, striate cortex, core zone, border strip, binocularity, stereopsis, deprivation, laser lesion, zif268, scotoma, macular degeneration
Although the function of ocular dominance columns remains unknown, they must play an important role in fusion and stereopsis. These processes require integration of visual signals emanating from each eye. In primate striate cortex, geniculocortical afferents serving the eyes remain segregated in layer IVc, forming a pattern of alternating stripes. Binocular integration is thought to occur by subsequent convergence of projections from monocular cells in layer IVc, via one or more synapses, onto cells in other layers. As suggested by Hubel and Wiesel (1977, see their Fig. 12), cells outside layer IVc near the boundaries between ocular dominance columns are likely to be influenced equally by both eyes. By contrast, cells located in the middle of ocular dominance columns are apt to be dominated strongly by one eye. According to this model, ocular dominance will swing back and forth in a gradual manner as an electrode is advanced tangentially through striate cortex, except in layer IVc. Hubel and Wiesel (1977) did not contemplate the segregation of cells outside layer IVc into discrete monocular and binocular zones.
Wong-Riley’s (1979) introduction of cytochrome oxidase (CO) histochemistry for the mapping of functional brain activity revealed a regular array of patches (also known as “puffs” or “blobs”) in all layers except IVc and IVa (Hendrickson et al., 1981; Horton and Hubel, 1981; Wong-Riley and Carroll, 1984). The patches are organized like strands of pearls, with each strand running down the middle of an ocular dominance column. Because patches are centered within ocular dominance columns, one would expect their cells to have a strong monocular bias. This expectation has been borne out by four independent lines of evidence. First, enucleation causes loss of CO activity in every other row of patches, in register with pale columns in layer IVc (Horton and Hubel, 1981; Horton, 1984). Second, microelectrode recordings have shown that cells within patches tend to be monocular, whereas cells between patches are usually binocular (Livingstone and Hubel, 1984). Third, after transneuronal labeling with [3H]proline, radioactive tracer is confined largely to the injected eye’s CO patches (Horton and Hocking, 1996a). Therefore, in macaques the direct koniocellular geniculate input to the CO patches (Casagrande, 1994; Hendry and Yoshioka, 1994; Ding and Casagrande, 1997) is segregated by eye. Fourth, optical imaging has shown that patches represent highly monocular centers within ocular dominance columns (T’so et al., 1990).
Rows of CO patches span the cortex from white matter to pia, creating a central “core zone” within each ocular dominance column, which is predominately monocular. A sliver of tissue exists between the actual border of an ocular dominance column and its core zone, which we call a “border strip.” Although CO patches are invisible in IVc, there is anatomical evidence for border strips and core zones in this layer. With the Liesegang silver stain, LeVay et al. (1975) discovered a pattern of thin pale bands alternating with wide dark bands in layer IVc, as well as in layers V, IVb, and IVa. Yoshioka (1997) has recently shown a similar pattern by immunostaining for neurofilament triplet proteins. The thin pale bands straddle the borders between ocular dominance columns and correspond precisely to our proposed border strips. The wide dark Liesegang bands, which contain the rows of CO patches (Horton and Hocking, 1997a), match the core zones inside ocular dominance columns.
There is also functional evidence for the presence of monocular core zones and binocular border strips in layer IVc. In adult macaques, no CO pattern is visible in tangential sections through layer IVc, because enzyme levels are equal in border strips and core zones. In newborn macaques, however, CO activity is lower within border strips, resulting in a pattern resembling the Liesegang stain (Horton and Hocking, 1996a). The reduced level of CO activity in border strips may reflect the relative immaturity of binocular function at birth (Chino et al., 1997). Weak CO staining along border strips, producing a baby-like pattern in layer IVc, has also been observed in a single adult macaque with naturally occurring amblyopia (Horton et al., 1997). Loss of binocular function as a result of amblyopia may have reduced CO activity in this animal’s border strips. Finally, we have observed thin pale CO stripes in layer IVc along the borders between ocular dominance columns in macaques with alternating exotropia induced by disinsertion of the medial recti (J. C. Horton and D. R. Hocking, unpublished observations). Presumably, disruption of binocularity has affected CO activity within border strips.
The goal of this study is to explore further the subdivision of striate cortex into monocular core zones and binocular border strips by comparing patterns of CO activity produced by monocular enucleation and eyelid suture. The CO method suffers from the drawback that variability in staining from animal to animal can obscure real differences in the patterns produced by various experimental manipulations. To overcome this problem, in some animals we combined enucleation or eyelid suture with a focal retinal laser lesion. By flat-mounting striate cortex to expose a broad expanse of tissue, CO patterns resulting from different manipulations could then be compared in the same tissue section. This approach has provided new evidence in support of our proposed subdivision of striate cortex into monocular and binocular compartments. It has also shed new light on the phenomenon of “fill-in” of “cortical scotomas” reported after focal retinal laser lesions (Gilbert et al., 1990; Kaas et al., 1990; Heinen and Skavenski, 1991). In these studies, microelectrode recordings have suggested a remarkable recovery of responsiveness within regions of cortex initially silenced by retinal lesions. However, our present experiments show that weak CO staining persists within these cortical scotomas, casting some doubt on the notion that substantial recovery of function occurs after retinal lesions.
MATERIALS AND METHODS
Experimental animals. Experiments were performed on five unrelated Macaca mulatta bred at the California Regional Primate Research Center (Davis, CA) and three M. fascicularis from Mauritius obtained commercially. Before use each animal underwent a complete examination, including cycloplegic refraction and indirect ophthalmoscopy, to exclude any pre-existing eye disease. All procedures adhered to protocols approved by the Committees on Animal Research at University of California Davis and University of California San Francisco. Table 1summarizes the sequence of experimental steps in each animal. Often, more than one procedure was performed in the same animal to compare directly the effects of enucleation, eyelid suture, or retinal laser lesions. Three animals were used in previous experiments, in the context of other projects performed by our laboratory (Horton and Hocking, 1996b, 1997b). Specific details are given in the appropriate figure legends.
Table 1.
Summary of experiments
| Subject | Species | Sex | Age at beginning of experiment | Experimental procedure1-a | Time until next procedure (or perfusion) | Techniques | Figures |
|---|---|---|---|---|---|---|---|
| Monkey 1 | M. fascicularis | Male | 11 years | 1. OD—enucleated | 15 weeks | CO | 3 |
| OS—normal | |||||||
| Monkey 2 | M. mulatta | Female | 15 years | 1. OD—sutured | 29 weeks | CO | 4, 7, 8, 9 |
| 2. OS—focal laser lesion, temporal retina | 9 weeks | ||||||
| Monkey 3 | M. mulatta | Male | 12 weeks | 1. OD—sutured | 12 months | CO, autoradiography | 5 |
| 2. OS—normal, [3H]proline injection | 9 d | ||||||
| Monkey 4 | M. mulatta | Female | 5 weeks | 1. OD—sutured 2. OS—normal, [3H]proline injection | 24 months 9 d | CO, autoradiography, Luxol fast blue, Nissl | 6 |
| Monkey 5 | M. mulatta | Female | 3 weeks | 1. OD—sutured 2. OS—normal, [3H]proline injection | 24 months 9 d | CO, autoradiography, Luxol fast blue, Nissl | Not illustrated |
| Monkey 6 | M. mulatta | Female | 9 years | 1. OD—sutured | 33 weeks | CO, anti-Zif268 | Not illustrated |
| 2. OS—focal laser lesion, temporal retina | 6 weeks | ||||||
| Monkey 7 | M. fascicularis | Male | 10 years | 1. OS—focal laser lesion, temporal retina | 7 weeks | CO, anti-Zif268 | 10–12 |
| 2. OD—enucleated | 4 hr | ||||||
| Monkey 8 | M. fascicularis | Male | 8 years | 1. OD—enucleated | 11 months | CO, autoradiography | 13–16 |
| 2. OS—focal laser lesion, temporal retina | 14 weeks | ||||||
| 3. OS—focal laser lesion, nasal retina | 3 weeks | ||||||
| 4. OS—[3H]proline injection | 9 d | ||||||
| Human subject | Male | 67 years | OD—normal | 4 years | CO | 17–19 | |
| OS—macular degeneration | |||||||
OD, Right eye; OS, left eye.
Monocular enucleation was performed in three animals (Table 1) under general anesthesia with ketamine HCl (20 mg/kg, i.m.) combined with retrobulbar injection of 2 ml of 0.75% bupivicaine HCl plus epinephrine (1:100,000). After surgery, buprenorphine HCl (0.02 mg/kg, i.m.) was administered every 8 hr for 2 d to ensure analgesia. Monocular eyelid suture was performed in five animals under general anesthesia with ketamine HCl (10 mg/kg, i.m.) combined with local infiltration of the eyelids using 0.5% lidocaine plus epinephrine (1:200,000). The eyelid margins were trimmed, and the tarsal plates were fused with 6–0 Vicryl interrupted horizontal mattress sutures. Afterward, the animals were examined daily for 1 week to verify that the eyelids had sealed without a pinhole.
Focal retinal lesions were made in the left eye of four animals (Table1) under general anesthesia with ketamine HCl (10 mg/kg, i.m.). The pupil was dilated with 1% tropicamide and 10% phenylephrine HCl. The animal was placed at a slit lamp to view the ocular fundus through a plano-concave contact lens. Lesions were made with a Coherent Novus 2000 blue–green (488–515 nm) argon laser using a spot size of 500 μm applied for a duration of 0.2 sec. The energy level and number of spots were varied to produce lesions of varying severity. Afterward, pictures were taken with a Topcon (Tokyo, Japan) fundus camera.
In three animals (Table 1) the ocular dominance columns were labeled by [3H]proline transneuronal autoradiography. The tracer was prepared by reconstituting 2 mCi ofl-[2,3,4,5-3H]proline, specific activity, 102–106 Ci/mmol (Amersham, Arlington Heights, IL), in 20 μl of sterile balanced salt solution. It was injected into the mid-vitreous of the left eye under anesthesia with ketamine HCl (10 mg/kg, i.m.) and topical proparacaine HCl. Immediately afterward, the fundus was checked with an indirect ophthalmoscope to ensure that no injury had occurred. The survival time for transport of the label was 7–10 d.
Histological procedures. After receiving a lethal injection of sodium pentobarbital into the peritoneal cavity, each monkey was perfused through the left ventricle with 1 l of normal saline followed by 1 l of 2% paraformaldehyde in 0.1 mphosphate buffer. Striate cortex from each occipital lobe was unfolded, removed from the white matter, and sandwiched overnight under gentle pressure between a glass slide and a sheet of soft foam in a solution of 1% paraformaldehyde plus 30% sucrose (Horton and Hocking, 1996b). Flat-mounts of striate cortex were cut at 30 μm with a freezing microtome, mounted on slides, and air-dried. In two animals, alternate sections were placed into 0.1 m phosphate buffer and processed free-floating for Zif268 (also known as EGR-1 or Krox24) immunohistochemistry using an antibody provided by Bravo (Herdegen et al., 1990). Control sections, which omitted the primary antibody, were also examined.
In each animal, every other section of visual cortex was reacted for CO activity (Wong-Riley, 1979). To ensure identical processing, sections from any given hemisphere were loaded into the same boat of slides, incubated together, and removed from the CO bath simultaneously. The reaction was terminated after 8–12 hr, when sections were judged by eye to have achieved the best separation of optical densities. Alternate sections were processed for a variety of techniques, listed in Table 1. For Nissl substance, defatted sections were stained with 0.5% cresyl violet. For autoradiography, sections were coated with NTB-2 emulsion (Eastman Kodak, Rochester, NY), exposed for 10 weeks, and developed with D19 developer (Eastman Kodak) (Wiesel et al., 1974). For myelin staining, defatted sections were reacted using the Luxol fast blue method of Klüver-Barrera (Luna, 1968).
Eyes with laser lesions were examined by cutting serial horizontal paraffin sections at 10 μm through each retinal lesion site. Sections stained with hematoxylin and eosin were examined in the light microscope. The extent of destruction from each laser lesion was reconstructed with the aid of a camera lucida. The lateral geniculate bodies were sectioned at 50 μm with a freezing microtome, and alternate sections were reacted for CO or Nissl substance. In some animals (Table 1), every third section was dipped in autoradiographic emulsion and exposed for 2 weeks.
Data analysis. Two methods were used to analyze CO data. The first approach was used to obtain quantitative optical density measurements of CO reaction product. Each CO section was imaged at 300 dots per inch (dpi) on an Agfa Arcus II flatbed scanner fitted with a transparency adapter. The gamma curve value was set to 1.0. This setting results in equal input and output densities. A series of neutral density filters (Fig. 1) (Lee Filters, Andover, England) was placed on the scanner and imaged concurrently with each CO section. Images were then transferred to Scion ImagePC (Scion Corp., Frederick, MD) for measurements of optical density. Accurate optical density readings were ensured by using the neutral density filters to calibrate Scion ImagePC for each section. This method of processing the data guaranteed that settings for brightness and contrast remained constant from one CO section to the next. It also allowed comparison of the absolute intensity and contrast of CO reaction product between animals. All images analyzed in this manner display a series of neutral density filters as a calibration bar in the top right corner of the figure. Scion ImagePC was also used to measure column widths.
Fig. 1.
This series of neutral density filters was scanned with each tissue section and used in Scion ImagePC to calibrate optical density (OD) measurements of CO activity. The percent transmittance (T) was derived from the relationship OD = log 1/T. Using the flatbed scanner to digitize images from CO sections allowed easy, direct measurement of optical density. The calibration bar guaranteed that optical density measurements remained accurate from one CO section to the next. All CO images processed in this manner display a calibration bar.
For some animals, complete montages were prepared of layer IVc from tangential CO sections using Photoshop 4.0 (Adobe Systems, San Jose, CA), as described previously (Horton and Hocking, 1996b, 1997b). Images were not retouched to hide seams or blemishes, nor were any adjustments made in brightness or contrast. They were printed on a Fujix 3000 Pictography printer (Fuji Corp., Tokyo, Japan).
The second method of analyzing CO sections used traditional photographic methods. This approach was used for comparison of CO patterns at high power, when resolution was more important than absolute brightness or contrast. Sections were photographed through a Zeiss Axioskop microscope using Plus-X pan film (Eastman Kodak) and processed with Microdol-X developer (Eastman Kodak). Pictures were printed on grade 4 Agfa Rapitone paper using a conventional darkroom enlarger.
Autoradiographs were photographed in dark-field using Technical Pan film (Eastman Kodak) and developed with Technidol developer (Eastman Kodak). Negatives were scanned into the computer with a Microtek (Redondo Beach, CA) Scanmaker 35t scanner. Montages of the ocular dominance columns in layer IVcβ were prepared from autoradiographs of alternate sections using Photoshop 4.0. Nissl, Luxol fast blue, and Zif268 sections were photographed with Plus-X pan film and developed with Microdol-X.
RESULTS
Monkey 1 (adult monocular enucleation)
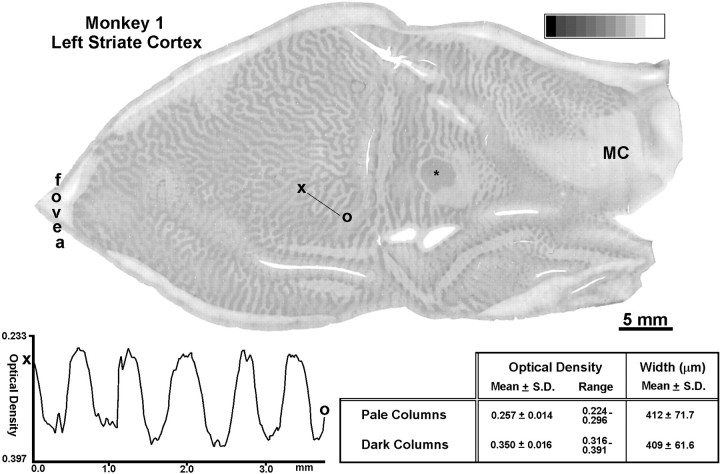
This normal adult M. fascicularis was chosen to illustrate the effect of monocular enucleation on CO activity in striate cortex. The right eye was removed 15 weeks before perfusion. This manipulation produced a pattern of light and dark columns in layer IVc (Fig. 2). The light CO columns correspond precisely to the ocular dominance colums of the missing eye, as shown previously by combining [3H]proline autoradiography with monocular enucleation in the same animal (Horton, 1984). In the opercular cortex, representing the central 8° of the visual hemifield, the ocular dominance columns serving each eye are nearly equal in width (Hubel and Wiesel, 1977; LeVay et al., 1985). This was verified in Monkey 1 by measuring the width of 50 light columns and 50 dark columns, selected arbitrarily from the opercular cortex. The average widths were 409 μm for the dark columns and 412 μm for the light columns. One-dimensional plots of optical density sampled at high resolution (2400 dpi) confirmed that the light and dark columns were equal in width. An example graphed across five sets of ocular dominance columns is shown in Figure 2. The peaks of the light columns and the troughs of the dark columns were spaced evenly. Note that the optical density of the tissue oscillated up and down in a gradual manner. In drawings, ocular dominance columns are often depicted as black-and-white stripes, implying a square-wave step in optical density across column boundaries. In fact, the transition between columns measured by optical density is quite gradual.
Fig. 2.
Monkey 1 (adult monocular enucleation). Single CO section of a flat-mount showing the ocular dominance columns in layer IVc 15 weeks after removal of the right eye. Measurements showed that the pale columns (right eye) and dark columns (left eye) in opercular cortex (left half of the tissue section) were virtually equal in width (see table). This was confirmed by a linear density profile, sampled across five sets of ocular dominance columns from X to O, which showed equal spacing in the peaks of optical density. For this plot the section was imaged at 2400 dpi to achieve a resolution of 10.58 μm/pixel. The mean optical density of the dark and light columns differed by 0.093. The complete montage of the ocular dominance columns in this animal has been published (Horton and Hocking 1996b, Monkey 2). *Blind spot representation of the right eye; MC, monocular crescent.
The contrast of the ocular dominance columns labeled by CO was highest in layer IVcβ. To quantify their contrast in this layer, we measured the mean optical density of the tissue within a 3 × 3 pixel box (254 × 254 μm), situated in the middle of either a light column or a dark column. Boxes were placed in 50 light columns and 50 dark columns, chosen randomly. The light columns had a mean optical density of 0.257, and the dark columns had a mean optical density of 0.350. These values corresponded approximately to a 10% difference in transmittance (Fig. 1).
Monkey 2 (adult monocular suture)
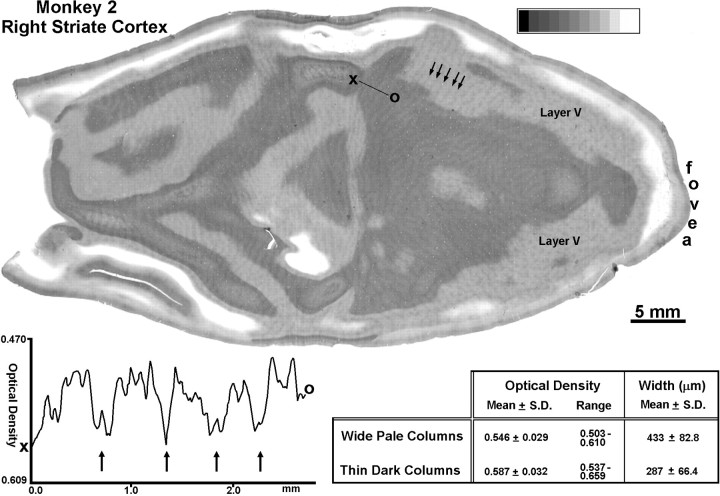
To compare the effects of monocular lid suture with those induced by enucleation, this normal adult M. mulatta underwent closure of the right eyelids at age 15 years. Flat-mounts of striate cortex were prepared 38 weeks later (a laser lesion was also made, to be discussed later). In layer IVc, a faint pattern of thin dark columns alternating with wide pale columns was present (Fig.3). Outside layer IV, alternating rows of dark and light patches were visible. Each dark row of patches fit in perfect register with a thin dark column in layer IVc. This match could be appreciated best by observing how each beaded row of patches merged with a thin dark column of identical width at the layer V–layer IVc boundary (Fig. 3).
Fig. 3.
Monkey 2 (adult monocular suture). Single CO section showing a faint pattern of dark columns alternating with pale columns in layer IVc, induced by suture of the right eye for 9 months. The dark columns were thinner than the pale columns (seetable). Note that the thin dark columns in layer IVcβ were continuous with the nearly confluent rows of dark patches in layer V (arrows). The light rows of patches were too faint to be seen clearly in layer V. The graph shows a linear plot, sampling at 10.58 μm/pixel, of optical density fromX to O. It confirms that the dark columns (arrows) are thinner than the pale columns. The columns seen after suture are much lower in contrast than those induced by enucleation, accounting for the expanded scale of they-axis compared with the graph in Figure 2.
Measurement of 50 dark columns and 50 light columns in layer IVcβ yielded mean widths of 287 and 433 μm, respectively. Linear plots of optical density confirmed that the dark columns were thinner than the light columns (Fig. 3). Comparing Figures 2 and 3, it is evident that monocular suture produces a completely different CO pattern in layer IVc than monocular enucleation. The latter manipulation results in columns, equal in width, that correspond precisely to the distribution of geniculocortical afferents in layer IVc. Monocular suture, on the other hand, produces a system of columns that cannot be congruent with the ocular dominance columns, because they are so unequal in width. We propose that the thin dark columns induced by suture represent the core zones of the open eye’s ocular dominance columns. The wide pale columns comprise the core zones of the sutured eye’s ocular dominance columns plus the border strips on either side. Given the column dimensions reported above, in this animal the core zones measured 287 μm, and a pair of border strips measured 73 μm (yielding, for a single wide pale column, 73 + 287 + 73 μm = 433 μm). These dimensions are likely to vary from animal to animal, because there is considerable intrinsic variability in the periodicity of ocular dominance columns (Horton and Hocking, 1996b).
Comparing Figures 2 and 3, it is also apparent that the columns produced by lid suture are much lower in contrast than the columns induced by enucleation. The optical density of the section in Figure 3was sampled by placing 3 × 3 pixel boxes in the middle of 50 light columns and 50 dark columns. The mean optical density was 0.587 for the dark columns and 0.546 for the light columns, corresponding to only a 2–3% difference in transmittance.
Monkey 3 (12 week monocular suture)
In the preceding experiment, the assignment of the thin dark columns to the open eye’s core zones was inferred by their alignment with dark rows of CO patches. Obviously, it would be preferable to establish this relationship by using a second anatomical label. To accomplish this objective, the right eye of Monkey 3 was sutured at 12 weeks, an age coinciding with the end of the critical period for plasticity of ocular dominance columns (LeVay et al., 1980; Horton and Hocking, 1997b). A year later the left eye was injected with [3H]proline. The ocular dominance columns were visible in autoradiographs passing through layer IVc (Fig.4A). Because suture was done after the critical period, labeled and unlabeled columns were approximately equal in width, at least on the operculum. In an adjacent section (Fig. 4B), the CO stain showed the same pattern of thin dark columns alternating with wide pale columns seen in the previous animal. Comparison at high power demonstrated that the thin dark CO columns, as expected, matched the labeled ocular dominance columns of the normal left eye (Figs. 4C–E). However, the thin dark CO columns were slightly narrower than the proline columns. This difference was subtle, because it amounted only to the slender border strips within each proline column. A border strip—the tissue between a core zone and the actual boundary of an ocular dominance column—is only ∼30–45 μm wide. Our interpretation of this experiment is summarized in Figure 4F.
Fig. 4.
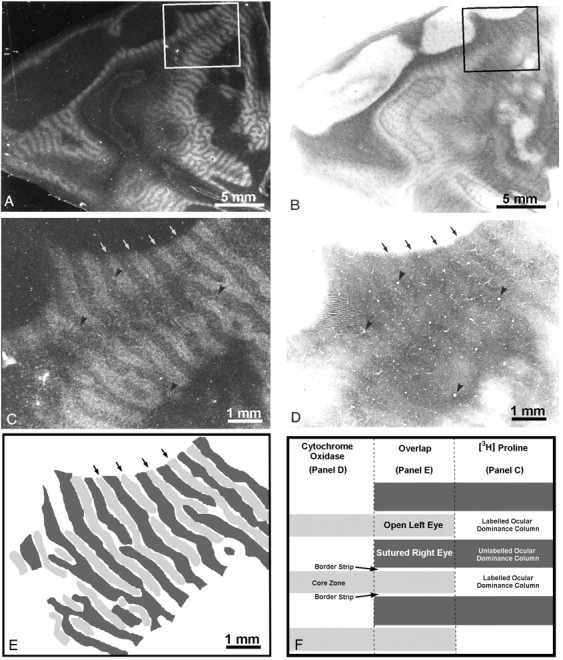
Monkey 3 (12 week monocular suture).A, Autoradiograph through the left operculum showing the ocular dominance columns in layer IVc after injection of the left eye at age 15 months. Labeled and unlabeled columns are equal in width.B, Adjacent CO section showing faint columns in layer IVc. Note that the dark columns are much thinner than the pale columns.C, Box in A, showing the ocular dominance columns (arrows) at higher power.D, Box in B, showing matching CO columns (arrows) at higher power.Arrowheads mark blood vessels used for section alignment. E, Drawing comparing the CO section with the autoradiograph. The unlabeled proline columns in C areblack. The dark CO columns in D aregray. Note that the dark CO columns fit in register with the proline columns labeled from the open left eye. However, they are slightly narrower, resulting in a white gap between thegray and black columns in this diagram.F, Diagram summarizing the findings in this animal. Thewhite gap between each gray andblack column in E corresponds to the border strip of the open eye’s (proline-labeled) ocular dominance columns. It measures only ∼30–45 μm. The complete montage of ocular dominance columns in this monkey has been published (Horton and Hocking, 1997b, monkey 8).
Monkey 4 (5 week monocular suture)
In the previous two experiments, we showed that eyelid suture after the critical period induces a CO pattern of thin dark columns alternating with wide pale columns. Next, we inquired what CO pattern develops when eyelid suture is performed during the critical period. Figure 5A shows an autoradiograph grazing layer IVcβ from a macaque that underwent suture of the right eye at age 5 weeks. The left eye received an injection of [3H]proline 25 months later. As expected, the unlabeled ocular dominance columns of the deprived right eye were shrunken. An adjacent CO section showed a pattern of thin dark columns alternating with wide pale columns (Fig. 5B). It resembled the pattern induced by eyelid suture after the critical period. The thin dark CO columns were centered within the expanded, labeled ocular dominance columns of the normal left eye but much narrower. Expansion of the left eye’s columns exaggerated the discrepancy noted in Monkey 3 between the width of the ocular dominance columns (defined by proline labeling) and the width of the thin dark CO columns.
Fig. 5.
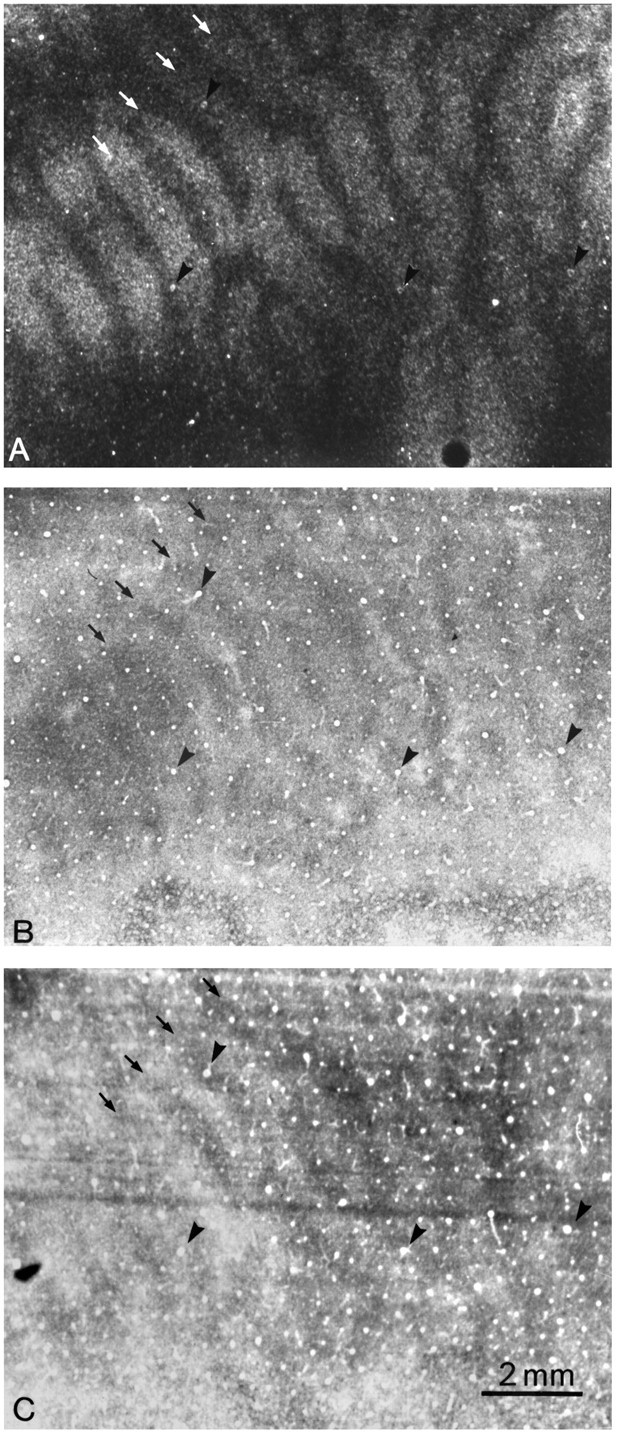
Monkey 4 (5 week monocular suture).A, Autoradiograph through the left operculum after injection of the left eye with [3H]proline at age 26 months, showing expanded ocular dominance columns (white arrows). The shrunken dark gaps correspond to the columns of the right eye, which was sutured at age 5 weeks. B, Adjacent section showing the characteristic CO suture pattern of thin dark columns alternating with wide pale columns. The thin dark columns (black arrows) are centered within the labeled ocular dominance columns in A but are much narrower. Their difference in width is made obvious by the fact that inA the proline-labeled columns are wider than the unlabeled columns, whereas inB the dark CO columns are narrower than the pale CO columns. C, Adjacent Luxol fast blue section showing dark columns (arrows), slightly wider than the corresponding columns in B. The presence of these columns suggests that cortical myelin content is altered by early visual deprivation. The complete column mosaic in this animal has been published (Horton and Hocking, 1997b, monkey 5).
It is worth pointing out that if in Figure 5A andB were inadvertently misaligned, by half a column cycle, one might conclude: (1) that the thin CO columns match perfectly the shrunken, unlabeled ocular dominance columns; and (2) that CO activity increases in the deprived eye’s ocular dominance columns. In fact, neither conclusion would be correct. After lid suture (at any age), the resulting CO pattern does not reflect faithfully the actual boundaries of the ocular dominance columns, and CO activity decreases in the deprived eye’s columns. To visualize the ocular dominance columns with CO in lid-sutured animals, one eye must be silenced by subsequent enucleation (Horton and Stryker, 1993).
An adjacent section processed for myelin using the Luxol fast blue stain showed columns in layer IVc (Fig. 5C). The pale Luxol columns fit in register with the pale CO columns. This finding suggests that early monocular suture reduces myelin content within deprived ocular dominance columns. However, patterns of Luxol fast blue staining produced by visual deprivation should be interpreted cautiously, because they may not reflect myelin content accurately (Horton and Hocking, 1997a). Finally, sections through layer IVcβ were processed for Nissl substance. They showed columns that were too faint to illustrate satisfactorily. The dark Nissl columns matched the deprived eye’s ocular dominance columns. This finding has been reported after monocular enucleation in adults and may reflect denser packing of neurons induced by cortical atrophy within deprived columns (Haseltine et al., 1979; Horton, 1984).
Monkey 5 (3 week monocular suture)
This monkey was raised with monocular deprivation by suturing the lids of the right eye at age 3 weeks. At age 25 months the left eye was injected with [3H]proline. The findings are not illustrated, because they were similar to those in Monkey 4. Thin dark CO columns fit inside expanded proline columns serving the left eye.
We have shown previously that CO staining appears completely homogeneous in layer IVcβ after eyelid suture at age 1 week (Horton and Stryker, 1993; Horton and Hocking, 1997b). It is unknown why suture at 1 week produces no CO pattern in layer IVcβ. We now show that later suture—at ages 3, 5, and 12 weeks, or even 15 years—produces a stereotypic CO pattern of thin dark columns alternating with wide pale columns, which is not congruent with the boundaries of ocular dominance columns. This pattern develops regardless of whether the underlying ocular dominance columns are shrunken or normal.
Monkey 2, revisited (laser vs suture)
The brightness and contrast of CO staining fluctuates from animal to animal for a host of reasons. Tissue fixation, section thickness, and incubation time can all vary, confounding the comparison of data from different experiments. For example, CO staining in Monkey 2 was darker than in Monkey 1 (compare Figs. 2 and 3). A skeptic might wonder whether the columns in Monkey 2 appeared thinner and fainter because the sections were reacted longer, rather than because of any real difference in the effects of suture and enucleation. Admittedly, if sections are over-reacted, their contrast is poor and patterns appear murky.
To circumvent the limitation imposed by interanimal variation, we made a full-thickness retinal laser lesion in the open left eye of Monkey 2. The goal was to create a focal lesion tantamount to a “local enucleation,” so that we could compare the effects of eyelid suture (right eye) and “enucleation” (left eye) in the same cortex. The lesion was made along the horizontal fiber raphe in the temporal retina by applying 12 laser spots at 450 mW (Fig.6A,B). This site was chosen to avoid damage to fibers sweeping across the inner retinal surface from more peripheral fundus (Hoyt and Luis, 1962). Parenthetically, we note that if a truly full-thickness lesion is made anywhere in the primate retina, except on the temporal fiber raphe, damage to arcuate fibers of passage will result in a cortical scotoma with a “comet’s tail.”
Fig. 6.
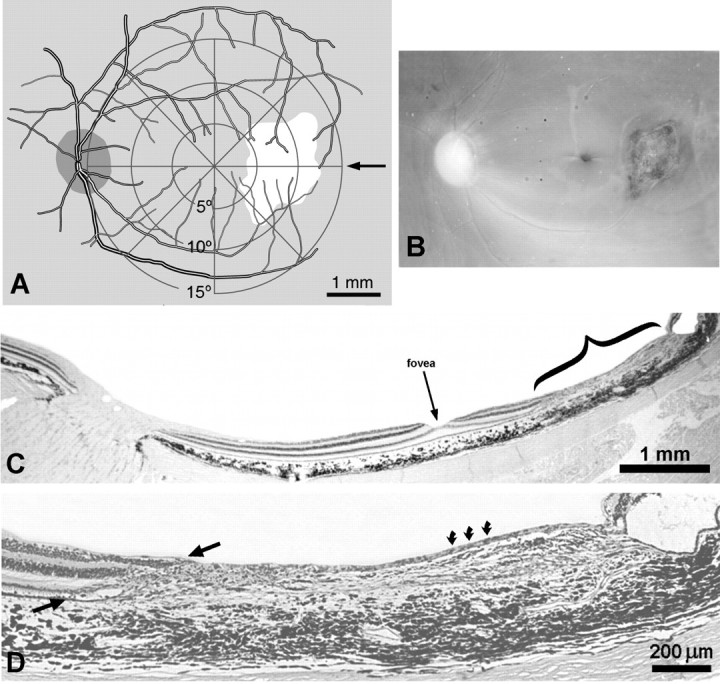
Monkey 2 (adult monocular suture vs laser).A, Drawing of the left retina made right after performing the laser lesion. A visuoscope target was projected onto the fundus to provide the retinotopic coordinates. The lesion extended from 4 to 13° along the horizontal meridian. B, Picture of the perfused retina, taken by cutting off the cornea, removing the lens, and aiming a 35 mm camera at the fundus. The fovea appears as adark dimple between the optic disk (nasal retina) and the laser burn (mottled scar, temporal retina). C, Retinal section along the horizontal meridian of the retina (arrow in A), passing through the optic disk, fovea (arrow), and lesion (bracket). D, Magnified view of the lesion, showing destruction of nearly all retinal layers, although occasional ganglion cells survived (curved arrows). Note the sloping edge to the laser lesion (between arrows), with more damage to the photoreceptor layer.
Nine weeks later the retina was examined histologically (Fig.6C). We intended to destroy all layers, but careful scrutiny revealed a few surviving ganglion cells in each serial section (Fig.6D). The lesion had a sloping edge, giving rise to a 300–400 μm penumbra of partially damaged retina. This occurred because the laser’s energy was absorbed by the pigment epithelium (Marshall et al., 1975; Apple et al., 1976; Smiddy et al., 1984), causing wider destruction in the photoreceptor layer than in the ganglion cell layer.
In the middle of the left cortex there was a cortical “scotoma” containing ocular dominance columns (Fig.7A). We consulted retinotopic maps of striate cortex (Daniel and Whitteridge, 1961; Van Essen et al., 1984; Tootell et al., 1988) to determine the size and location of the cortical scotoma expected from the retinal lesion illustrated in Figure6. Although these maps are not in perfect agreement, it was clear that the boundaries of the expected scotoma and the actual scotoma coincided within ∼1°, indicating that no significant fill-in had occurred by 9 weeks after the laser lesion. The cortical scotoma included the edge of the right eye’s optic disk representation. This was helpful for two reasons. It confirmed the precise retinotopic match between the laser lesion and the cortical scotoma. It also allowed unambiguous assignment of the pale columns to the lesioned left eye (because the optic disk representation appeared pale, and only the left eye projects to it). Therefore, the dark columns belonged to the sutured right eye.
Fig. 7.
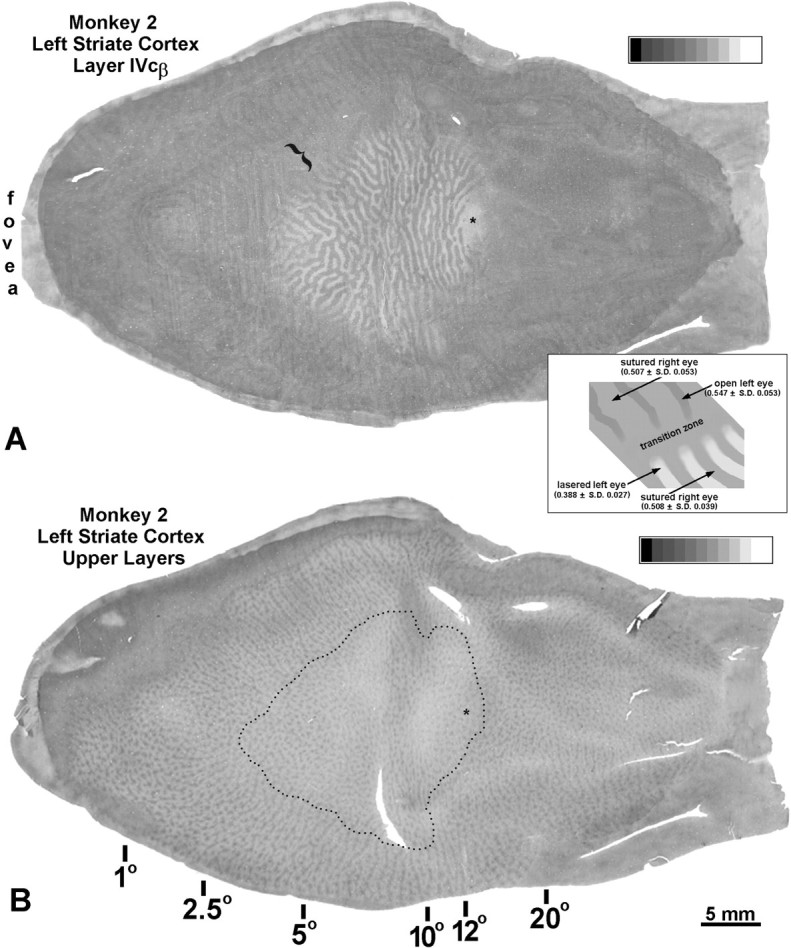
Monkey 2 (adult monocular suture vs laser).A, CO montage showing the cortical scotoma coinciding with the retinal lesion illustrated in Figure 6. Within the scotoma, dark ocular dominance columns (sutured right eye) alternate with pale ocular dominance columns (lesioned left eye). The scotoma includes the edge of the right eye’s optic disk representation (asterisk). It has the size and location that one would expect from the retinal lesion, suggesting that no fill-in occurred after a survival time of 9 weeks. Surrounding the scotoma, there is a faint pattern of thin dark columns (open left eye’s core zones) alternating with wide pale columns (sutured right eye’s ocular dominance columns plus the left eye’s border strips). Between both patterns, there is a variable transition zone of ambiguous staining (bracket). Inset, Diagram summarizing the pattern in layer IVc, with numbers inparentheses referring to optical density. The high-contrast CO pattern (bottom right) corresponds to ocular dominance columns within the cortical scotoma. The low-contrast CO suture pattern (top left) outside the scotoma is not equivalent to the ocular dominance columns. It consists of thin dark columns (core zones of the open left eye) alternating with wide pale columns. Note that there are three densities of CO activity in the cortex: open left eye (0.547), sutured right eye (0.507–0.508), and lasered left eye (0.388). This experiment establishes (1) that suture has less drastic effects on CO activity than enucleation, and (2) that suture reduces CO activity within the border strips of the open eye’s ocular dominance columns (explaining why the left eye’s dark columns are so thin outside the scotoma).B, Single section through the supragranular layers, showing alternating rows of dark (open left eye) and light (sutured right eye) patches outside the scotoma. Inside the scotoma (dotted line), this alternating pattern was lost. The boundaries of the ocular dominance columns in A were projected onto B to identify patches belonging to either the left or right eye. A sample of 50 left eye and 50 right eye patches yielded nearly the same mean optical density (0.383 and 0.384, respectively), indicating that enucleation (actually, focal retinal destruction) and suture have equal effects on metabolic activity in the upper layers of striate cortex, although they have quite different effects in layer IVc, as evinced by the striking pattern of ocular dominance columns in A.
Striate cortex surrounding the scotoma contained a faint CO pattern of thin dark columns alternating with wide pale columns, matching the pattern seen in the other hemisphere (Fig. 3). Based on the double-label experiment in Monkey 3 (Fig. 4), we know that the thin dark columns represent the core zones of the open left eye. The centers of the wide pale columns (outside the cortical scotoma) and the dark columns (inside the cortical scotoma) ought to have similar optical densities, because both regions serve the sutured right eye. This was confirmed by placing 3 × 3 pixel boxes at 50 random sites within both sets of columns. Mean optical densities of 0.507 and 0.508 were recorded, respectively. CO reaction product was densest (0.547) in the core zones of the open left eye (outside the scotoma) and lightest (0.388) in the ocular dominance columns of the lesioned left eye (inside the scotoma).
In this experiment, it was not possible to pinpoint where the dark columns switched from left eye to right eye as they crossed into the cortical scotoma. The transition was blurred by a thin zone of ambiguous CO staining sandwiched between the “suture” pattern and the “laser lesion” pattern (Fig. 7A). We assume this zone reflected the combined effects of the cortical point-spread function (McIlwain, 1986; Grinvald et al., 1994) and the sloping edge to the retinal laser lesion. At the outer edge of the transition zone, the sutured right eye competed with damage to only photoreceptor outer segments. At the inner edge, it competed with damage to the entire retina.
In the upper layers, outside the cortical scotoma, dark (normal left eye) alternating with light (sutured right eye) rows of CO patches were visible (Fig. 7B). Within the cortical scotoma, this alternating pattern was lost. This result was surprising, given the striking contrast of the light and dark columns below in layer IVc. Optical density measurements yielded a mean value of 0.383 for the patches overlying pale columns and 0.384 for the patches over dark columns. Evidently, CO activity in patches is reduced the same amount by focal retinal destruction (nearly equivalent to enucleation) and eyelid suture. There are several possible explanations for this finding. The konio input to the patches may be more resistant to the effects of enucleation than the parvo and magno inputs to layer IVc. It is also possible, in view of the relative sparseness of the direct konio projection, that activity in the patches is dominated by parvo and magno inputs arising from layer IV (Edwards et al., 1995). Once these inputs have been filtered across several synapses, from layer IVc to layers II and III (Fitzpatrick et al., 1985; Lachica et al., 1992; Yoshioka et al., 1994), the effects of suture and enucleation on metabolic activity may become equivalent.
To summarize this rather complicated experiment, we captured the suture pattern and the enucleation pattern in the same cortex by closing the right eye and lesioning the left eye focally with a laser. This strategy eliminated the problem of interanimal variation in CO reactivity and allowed us to establish firmly that suture and enucleation produce different CO patterns in layer IVc of striate cortex. Unexpectedly, outside layer IV these manipulations had equivalent effects on CO activity.
Monkey 6 (laser vs suture)
We followed the same procedures in this experiment to confirm the findings in Monkey 2 (Table 1). The results are not illustrated, because they were similar. The experiment differed in only one respect: we double-labeled the ocular dominance columns by reacting alternate sections for the transcription factor Zif268 (Herdegen et al., 1990). Outside the cortical scotoma, Zif268 immunostaining was homogenous in layer IVc, despite suture of the right eye for 9 months. Within the cortical scotoma, Zif268 revealed ocular dominance columns clearly. The pale Zif268 columns matched the pale CO columns of the lesioned left eye.
Chaudhuri et al. (1995) have reported Zif268 columns after 3 d of monocular suture. Our finding of no Zif268 columns after 9 months suggests that such columns eventually fade after prolonged suture. By contrast, we observed persistence of nice Zif268 columns many weeks after focal retinal destruction (despite suture of the intact eye). These results highlight another difference between the effects of lid suture and enucleation (actually, focal retinal laser ablation).
Monkey 7 (laser vs normal)
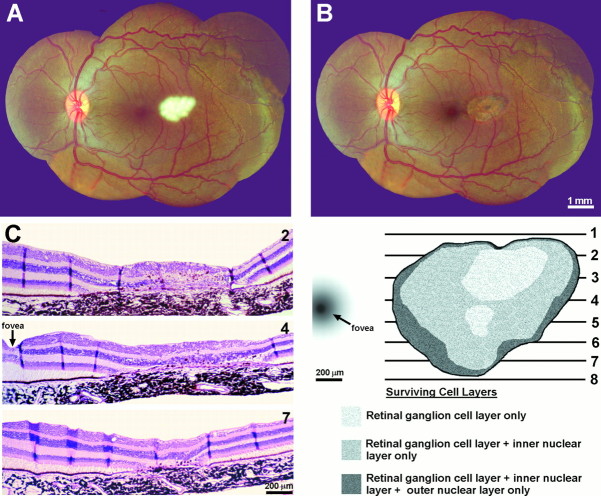
In the two previous animals we showed that a focal laser lesion, causing nearly complete destruction of all retinal layers, produced a CO pattern resembling “local” enucleation. We asked next whether a milder retinal burn, damaging photoreceptors but not ganglion cells, would produce a CO pattern resembling enucleation or eyelid suture. A lesion was made in the left eye of a normal adult macaque, in the temporal retina along the horizontal meridian, with half the energy used to create a full-thickness retinal burn (Fig.8A,B). After a survival time of 7 weeks, we used CO and Zif268 immunohistochemistry to double-label the ocular dominance columns. The monkey was dark-adapted for 10 hr to enhance anti-Zif268 staining. The right eye was then enucleated under ketamine anesthesia in complete darkness using night vision goggles (Horton and Hocking, 1996a). To ensure the animal’s comfort, the right orbit was infiltrated thoroughly with 0.75% bupivicaine HCl, a local anesthetic with prolonged action. Once the enucleation was complete, the room lights were turned on and the monkey was reawakened. It received 4 hr of natural visual stimulation through the remaining left eye before perfusion. These measures were designed to produce robust anti-Zif268 staining in the left eye’s ocular dominance columns but not to affect CO levels, which require more time to change (Wong-Riley, 1994).
Fig. 8.
Monkey 7 (laser vs normal). A, Left retina with a fresh laser lesion, extending from 4 to 10° temporal to the fovea, made by applying 20 spots at 200 mW. The lesion appearswhite from acute coagulation necrosis. B, Healed scar, 7 weeks later, after resorption of the edema.C, Retinal sections, cut at the levels indicated in the diagram. Although the injury is limited mostly to photoreceptor cell bodies and outer segments, there is some inner nuclear layer damage.Dark lines, running across the retinal layers, are folds in the paraffin sections.
The laser produced a complex lesion in the left eye, consisting of concentric rings of increasing retinal damage (Fig. 8C). Injury was confined predominately to photoreceptor outer segments and the outer nuclear layer, but the inner nuclear layer was also partially damaged. In the cortex, CO revealed a scotoma that corresponded closely to the coordinates of the retinal lesion (Fig.9A). Within the scotoma, an enucleation pattern was visible, rather than a suture pattern. Outside the scotoma, CO staining was homogeneous, because metabolic activity was equal in the normal right retina and the unlesioned left retina. A random sample of 100 3 × 3 pixel boxes gave a mean optical density of 0.465 ± 0.068 (SD). Within the scotoma, the dark ocular dominance columns (normal right eye) had an optical density of 0.435 ± 0.032 (SD), measured by sampling 50 3 × 3 pixel boxes. The same sampling approach yielded an optical density of 0.351 ± 0.034 (SD) for the light ocular dominance columns (lesioned left eye). ANOVA (F = 3.95; df = 148;p < 0.001) confirmed significant loss of CO activity in the light ocular dominance columns compared with enzyme levels outside the scotoma. More interestingly, the modest difference between the optical density of CO reaction product outside the scotoma (0.465) and in the dark ocular dominance columns (0.435) was also significant (F = 4.55; df = 148; p < 0.01). This finding provided further evidence for binocular interaction in layer IVc, corroborating the suture experiments in Monkeys 2, 3, and 6. It was also consistent with a report by DeYoe et al. (1995) that tetrodotoxin blockage reduces background spike rates in layer IVc of ocular dominance columns belonging to both the injected eye (by 72%) and the normal eye (by 39%).
Fig. 9.
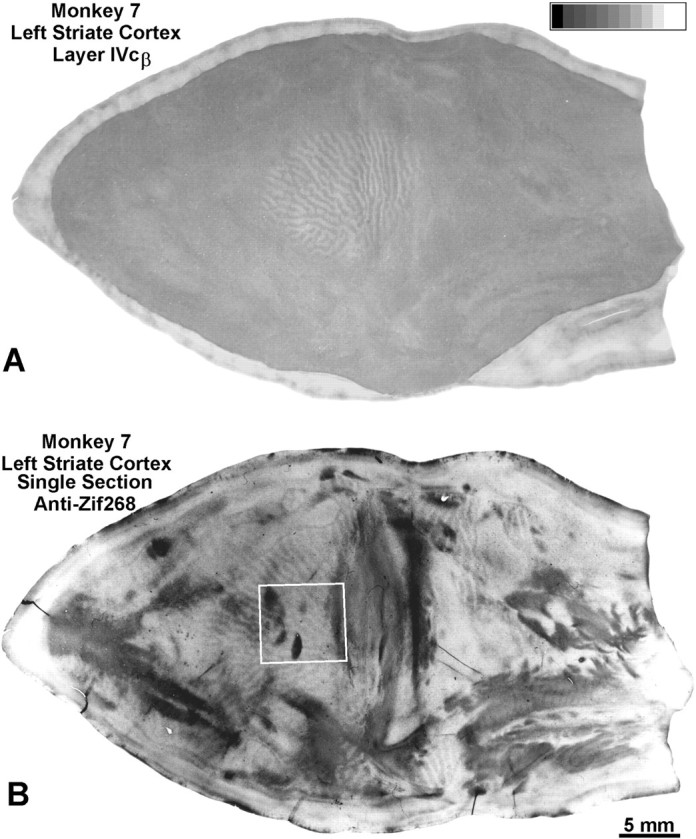
Monkey 7 (laser vs normal). A, Montage showing the scotoma induced by the laser lesion in Figure 8. Within the scotoma, the CO pattern resembles ocular dominance columns, proving that retinal damage sparing the ganglion cell layer still produces a CO pattern tantamount to enucleation. Measurements confirmed significant loss of CO activity, within both the lasered left eye’s ocular dominance columns (optical density, 0.351) and the intact right eye’s ocular dominance columns (optical density, 0.435), compared with CO activity outside the scotoma (optical density, 0.465). Outside the scotoma, CO staining was essentially homogeneous, because both retinas were normal, although there was some irregular fluctuation in density. This occurs as an artifact of montaging, because CO staining intensity varies slightly with section depth in layer IVcβ. B, Single Zif268 section showing ocular dominance columns in layer IVc. Outside the cortical scotoma, the dark Zif268 columns correspond to the intact left eye’s ocular dominance columns (Chaudhuri et al., 1995). Within the cortical scotoma, the dark Zif268 columns match the dark CO columns serving the freshly enucleated right eye. This is shown for theboxed region in Figure 10.
Zif268 immunohistochemistry showed ocular dominance columns throughout V1 (Fig. 9B). Outside the scotoma, the pale Zif268 columns were assumed to match the ocular dominance columns of the freshly enucleated right eye, based on work by Chaudhuri et al. (1995). Inside the scotoma, the dark Zif268 columns were found to match the dark CO columns belonging to the right eye (Fig.10). Therefore, Zif268 levels inside the scotoma remained greater in the right eye’s columns, even after 10 hr of darkness and enucleation of the right eye. This experiment demonstrates that Zif268 patterns can linger long after stimulus conditions change, mandating caution when using Zif268 to assign CO columns to one eye or the other, especially in complex experiments involving a series of manipulations to each eye.
Fig. 10.
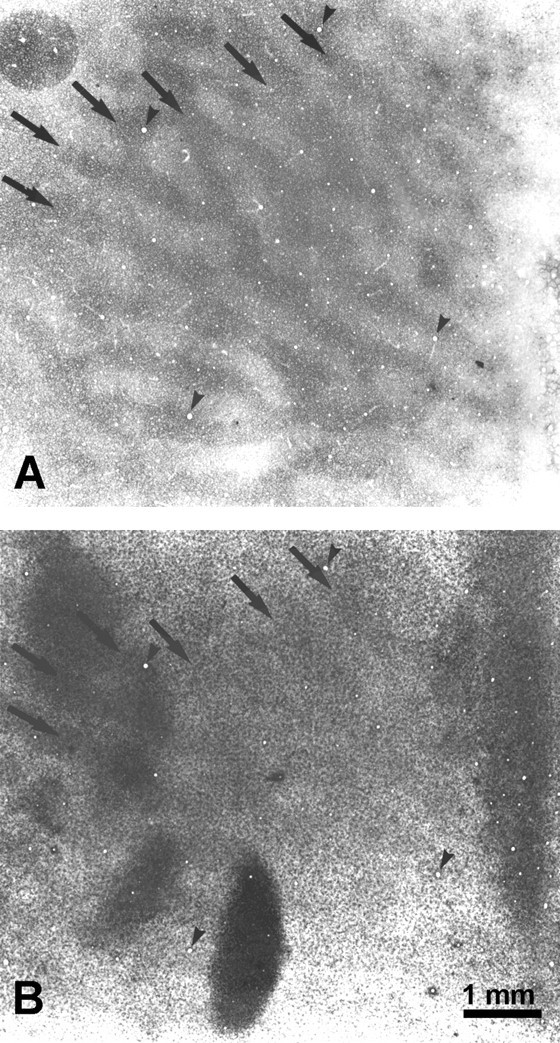
Monkey 7 (laser vs normal). Boxed region from Figure 9, comparing the CO (A) and Zif268 (B) patterns inside the cortical scotoma. The dark columns match (arrows), indicating that higher Zif268 levels persisted in the right eye’s ocular dominance columns, despite 10 hr of dark adaptation, enucleation of the right eye, and 4 hr of stimulation of the left eye. Presumably the laser lesion prevented visual stimulation of the left eye from inducing greater Zif268 levels in its ocular dominance columns. The section contains some blotchy artifact, perhaps from tissue manipulation during flat mounting.
Monkey 8 (laser vs enucleation)
The previous experiment showed that an enucleation CO pattern is induced by laser lesions, even when ganglion cells are spared. In this next experiment, we asked whether sparing of ganglion cells results in milder loss of CO activity. To provide a benchmark for comparison in the same cortex, we enucleated the right eye of a normal adult macaque. Eleven months later, a lesion was made in the temporal retina of the left eye using a setting of 220 mW (see journal front cover). Fourteen weeks later, concerned that the lesion might have damaged ganglion cells, we decided to make another, less intense, lesion in the same eye. Accordingly, a smaller lesion was made nasal to the fovea using an energy setting of only 180 mW (Fig. 11A). Three weeks later [3H]proline was injected into the eye to assay ganglion cell integrity by examining the density of transneuronal labeling in the cortex. One week later the animal was perfused.
Fig. 11.
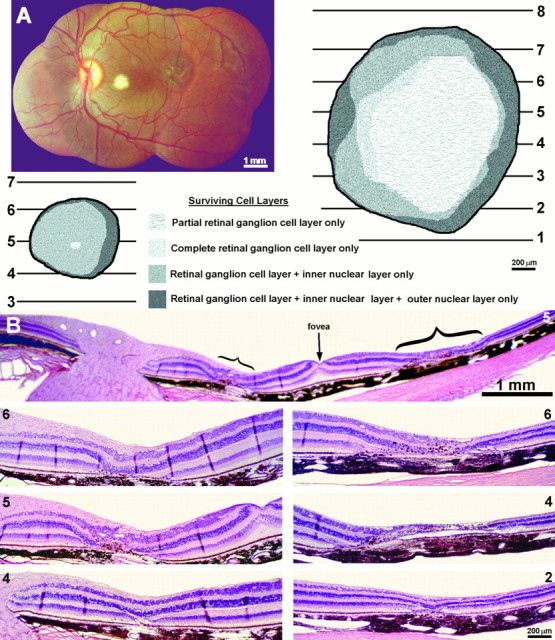
Monkey 8 (laser vs enucleation).A, Montage of the left retina, prepared from photos taken immediately after applying 15 laser spots at a setting of 180 mW to create a 0.5 mm lesion 6–9° nasal to the fovea. The 1.5 mm lesion, 6–12° temporal to the fovea, was made 14 weeks earlier by applying 25 spots at 220 mW. Note the dramatic difference in the appearance of the fresh lesion and the old lesion. Thediagrams show the extent of retinal damage from the two lesions, compiled from serial paraffin sections. B, Sample histological sections show the damage from the smaller nasal (bottom left) and larger temporal (bottom right) laser lesions. The temporal lesion caused more severe inner retinal damage and had more sloping borders. Both these features were reflected in the cortical findings illustrated in Figure 12.
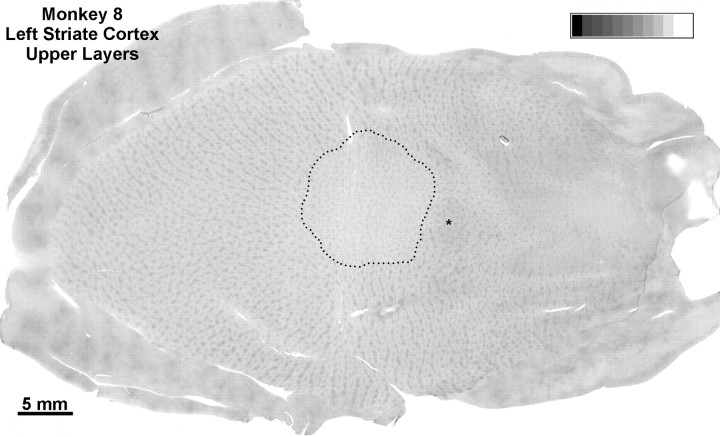
The larger, 18-week-old laser lesion caused some ganglion cell destruction, as we feared (Fig. 11B). Surrounding a central zone of partial ganglion cell injury, there were concentric rings of damage limited to more outer retina. In the left cortex, CO revealed a 10 mm scotoma in layer IVc, surrounded by ocular dominance columns induced by enucleation of the right eye (Fig.12A). The size and location of the scotoma closely matched the retinotopic coordinates of the laser lesion, as in the previous cases. There was a steady decline in CO content within the left eye’s columns, from the edge to the center of the scotoma. Consequently, the ocular dominance columns were quite distinct near the periphery of the scotoma but nearly erased in the center. From this distribution of CO activity, one would expect more robust single-cell responses from the lesioned eye at the edge of the scotoma than at the center, as reported by Schmid et al. (1996). The gradient in CO loss was mirrored by the density of autoradiographic labeling (Fig. 12B). It fell off toward the center of the cortical scotoma, reflecting greater ganglion cell damage (Fig.11). The parallel fading of [3H]proline label and CO activity implied that sparing of ganglion cells spares CO activity. The scotoma extended through all cortical layers, matching perfectly the scotoma in layer IVc. Inside the scotoma, all CO patches appeared faint, and alternating dark and light rows were absent (Fig.13).
Fig. 12.
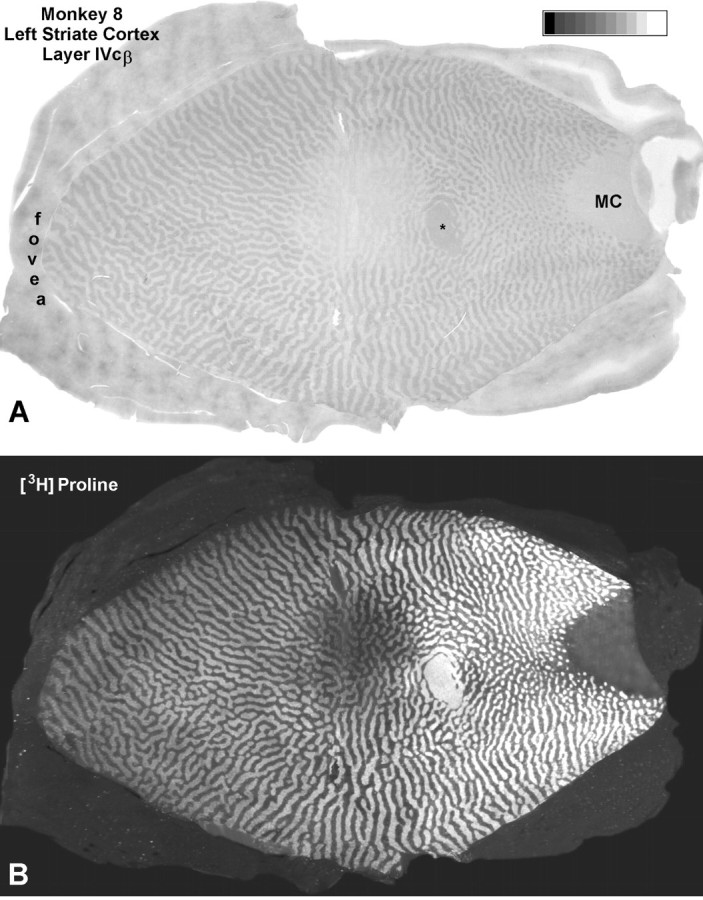
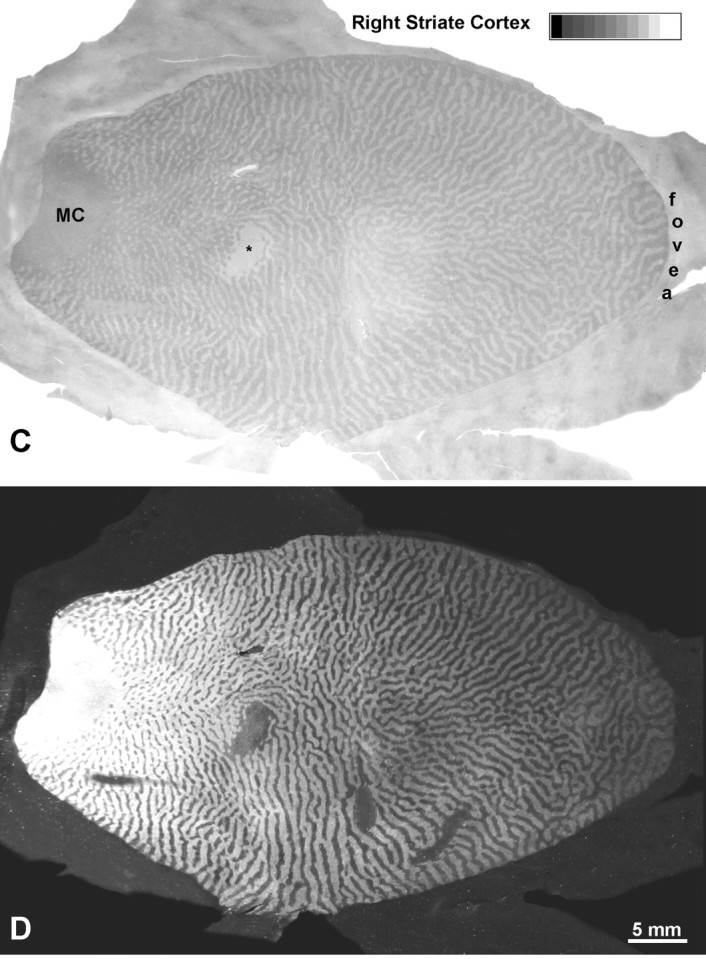
Monkey 8 (laser vs enucleation).A, CO montage showing the cortical scotoma induced by the laser lesion temporal to the fovea in Figure 11, silhouetted against a backdrop of ocular dominance columns induced by enucleation of the right eye. Note the gradual loss of CO activity from the periphery to the center of the scotoma. Even in the center, CO activity is slightly greater in the ocular dominance columns of the lesioned eye than in those of the enucleated eye. MC, Monocular crescent; *blind spot. B, Hole in the autoradiographic montage caused by laser injury to ganglion cells. It also has sloping edges but appears shallower than the metabolic hole inA, because columns are still seen clearly throughout.C, Montage of the scotoma resulting from the laser lesion nasal to the fovea. Because the laser damage was less severe and more evenly distributed, the loss of CO activity is milder and lacks a periphery-to-center gradient. D, Sparing of ganglion cells was confirmed by 3[H]proline labeling within the CO scotoma, which remained nearly normal. This experiment shows that outer retinal damage reduces cortical CO activity, but less than inner retinal damage or enucleation.
Fig. 13.
Monkey 8 (laser vs enucleation). A single section through the upper layers from the cortex illustrated in Figure12A is shown. Dots mark the perimeter of the CO scotoma. Outside the scotoma, alternating light and dark rows of patches were visible everywhere, except in the monocular crescent (where they were rendered almost invisible by enucleation of the right eye) and in the blind spot representation (*). Inside the scotoma, all the patches appeared equally pale, indicating that enucleation and partial retinal damage have comparable effects on CO activity outside layer IV. Similar findings were present in the upper layers of the right visual cortex.
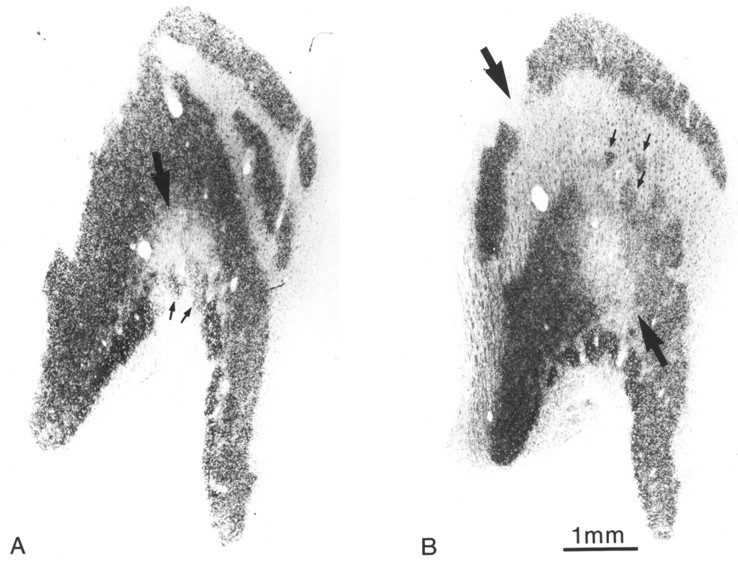
In the lateral geniculate body, a gap in [3H]proline label within laminae 2, 3, and 5 was induced by ganglion cell destruction (Fig.14). Even after consulting a detailed atlas (Malpeli and Baker, 1975), we could not decide whether the gap in the lateral geniculate body corresponded exactly to the gap in the cortex. The correlation was hard to assess, because the gap extended across 10 sections and had a different configuration in each section. The gap would have been difficult to map physiologically, because its borders were so scattered and indistinct. In the [3H]proline gap, CO activity and Nissl staining were both reduced.
Fig. 14.
Monkey 8 (laser vs enucleation).A, Autoradiograph of the left lateral geniculate body, showing a gap in laminae 2 and 3 from retinal ganglion cell destruction (large arrow). The gap has fuzzy edges and contains fragments of label (small arrows). B, Another section, 300 μm more caudal, showing migration of the gap dorsally into laminae 3 and 5 (large arrows). Again, the label is fragmented (small arrows). To map this complex scotoma precisely in three dimensions would be a daunting task, requiring dozens of electrode penetrations and arbitrary decisions about boundaries.
The smaller, 4-week-old laser lesion produced damage confined almost entirely to photoreceptor cell bodies and outer segments (Fig.11B). Predictably, CO activity in the cortical scotoma was affected less severely than in the other hemisphere (Fig.12, compare A, C), and autoradiographic input remained essentially intact (Fig. 12D). CO columns serving the lasered left eye did not fade from the edge to the center of the cortical scotoma, as on the other side, reflecting more even distribution of retinal damage. The fact that CO columns remained easily visible within the cortical scotoma confirmed that outer retinal damage affects cortical CO levels less than inner retinal damage or enucleation. However, the survival time after the second, smaller laser lesion was only 4 weeks. A longer survival would have been better, to guarantee that CO levels had sufficient time to reach their nadir. Ideally, the enucleation and the laser lesions should also have been performed simultaneously.
Human subject C.E.C. (macular degeneration vs normal)
This 67-year-old man lost vision in his left eye from a subretinal neovascular membrane that developed from macular degeneration (Fig.15A). It resulted in a large central scotoma (Fig. 15B) and an acuity of only counting fingers at 2 feet. The right eye was normal. Four years later he died of lung cancer. In the macula there was a thick fibrovascular membrane beneath the retina, which caused total destruction of the photoreceptors (Fig. 15C,D). The inner nuclear layer was split by a large cyst. The ganglion cell layer showed only mild atrophy and cell loss.
Fig. 15.
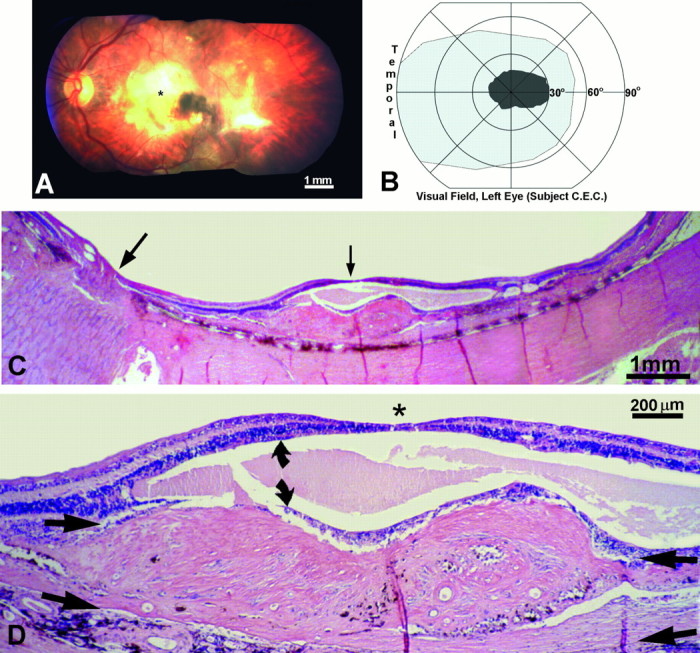
Human subject (C.E.C.). A, Left fundus, showing a macular scar (yellow area) from a fibrovascular membrane, which detached the retina locally and destroyed the photoreceptors. *Approximate location of the fovea.B, The macular scar caused a central scotoma, mapped on a Goldmann perimeter, which extended ∼30° into the nasal visual field. Within the scotoma the subject could not see a 1000 apostilb light spot 64 mm2 against a 31.5 apostilb background. C, Paraffin section cut along the horizontal meridian of the left retina, through the optic nerve (large arrow) and macula (small arrow), stained with hematoxylin and eosin. The retina was detached by a thick fibrovascular membrane. D, Magnified view, cut through the fovea (*), showing the fibrovascular membrane between the choroid and inner nuclear layer (arrow pairs). The photoreceptors were destroyed. The inner nuclear layer (curved arrows) was split by a large cyst, but the ganglion cell layer was relatively spared.
Figure 16 shows a CO reconstruction of the left visual cortex. Ocular dominance columns were visible nearly to the monocular crescent representation, reflecting the huge cortical magnification of the central 30° of vision. The columns were low in contrast, which we attribute to relative sparing of the ganglion cells. The findings in this subject confirmed the results in Monkeys 7 and 8, that damage concentrated in the outer retinal layers is sufficient to label ocular dominance columns with CO. However, the columns were fainter than those seen after enucleation.
Fig. 16.
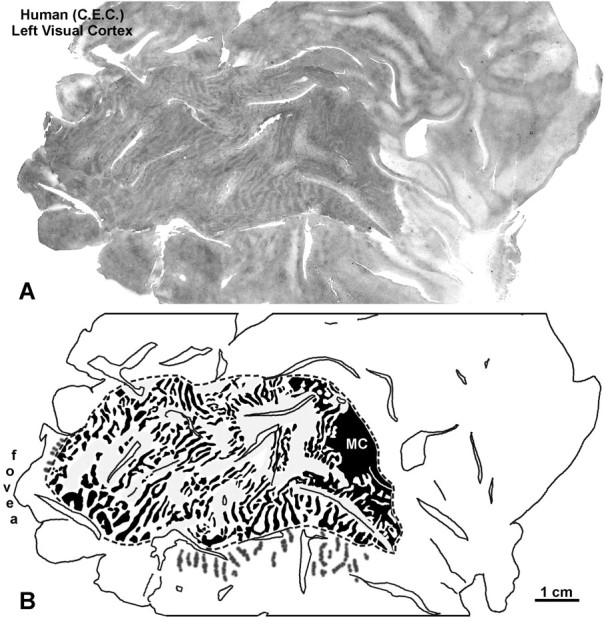
Human subject (C.E.C.). A, CO montage of the flat-mounted medial surface of the left occipital lobe, revealing ocular dominance columns from the retinal lesion in the left eye. The columns were low in contrast, compared with those seen after monocular enucleation. B, Drawing of the columns inA. They could not be seen clearly in the regions shadedgray. Because central vision is highly magnified, columns were visible throughout striate cortex, except anteriorly in the immediate vicinity of the monocular crescent (MC) representation.
DISCUSSION
Monocular core zones versus binocular border strips
The main point of this paper is to highlight the difference between the effects of enucleation and eyelid suture on CO activity in striate cortex. This difference is noteworthy because it provides a clue to the organization of monocular and binocular zones in the cortex. Enucleation produces a high-contrast pattern of light and dark columns precisely equivalent to the distribution of geniculocortical afferents in layer IVc, as they might be revealed by intraocular injection of [3H]proline (Fig.17). The same pattern has been described after tetrodotoxin blockade (Wong-Riley and Carroll, 1984). Eyelid suture, on the other hand, produces a novel pattern of thin dark columns alternating with wide pale columns (Horton, 1984; Hendry and Jones, 1986; Crawford et al., 1989; Trusk et al., 1990, Tigges et al., 1992). Lens removal (Tigges et al., 1992) and atropine instillation (Hendrickson et al., 1987) also produce this pattern. It has nothing to do with the shrinkage and expansion of ocular dominance columns reported after early visual deprivation (Hubel et al., 1977), because (1) it occurs from eyelid suture even in adult animals (whose ocular dominance columns are frozen); and (2) the thin columns are in register with the ocular dominance columns of the openeye, not the deprived eye. This was proven in Monkey 3 by injecting the open eye with [3H]proline (Fig. 4). The thin CO columns fit inside the columns of proline label.
Fig. 17.
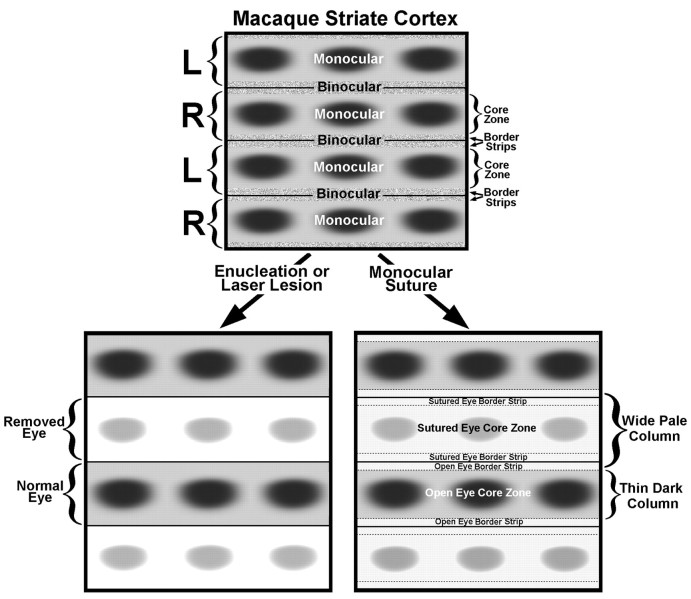
Schematic diagram of normal macaque striate cortex (top), looking through the cortical layers from the pial surface. On the left, bracketsmark the boundaries of the geniculocortical afferents serving each eye (R, right; L, left) in layer IVc. Each ocular dominance column contains a row of CO patches within a central, predominately monocular, core zone. The core zone of each ocular dominance column is flanked by a thin border strip. Together, the border strips from each ocular dominance column create a binocular compartment straddling the boundary between ocular dominance columns. Note that our subdivision of striate cortex into border strips and core zones is not equivalent to the well established “blob–interblob” dichotomy, because interblob tissue is located in both core zones and border strips. After enucleation or a laser lesion, CO activity in layer IVc is lost in the core zones and border strips of the affected eye’s ocular dominance columns, giving rise to a high-contrast pattern of dark and light columns, which corresponds exactly to the ocular columns seen after [3H]proline eye injection. After lid suture, CO activity drops in the core zones and border strips of the closed eye’s ocular dominance columns and in the border strips of the open eye’s columns, creating a pattern of thin dark columns alternating with wide pale columns. The columns are low in contrast, because suture has a less drastic effect on CO activity than enucleation.
The crucial point is that the dark CO columns are narrower than the open eye’s ocular dominance columns. They coincide with the open eye’s monocular core zones, containing the CO patches (Fig. 17). Figure 3 captures this relationship in a single section by showing rows of patches merging with thin dark CO columns as they enter layer IVc. The intervening pale CO columns are wider than the closed eye’s ocular dominance columns. This can occur, of course, only if eyelid suture affects CO levels inside the open eye’s ocular dominance columns. Loss of CO activity occurs within the open eye’s border strips, the thin leaflets of tissue situated between the core zones and the actual column boundaries. The border strips are binocular, by definition, because their CO content is affected by suture of either eye.
Our observation that border strips lose CO activity—regardless of which eye is sutured—implies that they contain binocular units. After suture of either eye, such units presumably fire at a lower rate, and hence their CO content declines. In newborn monkeys, LeVay et al. (1980) found many binocular cells straddling the boundaries of ocular dominance columns in layer IVc. They emphasized the presence of these units to support their contention that ocular dominance columns in baby monkeys are not yet fully segregated. Even in older monkeys, however, they remarked that, “the changeover between the two eyes occurred over a distance of not more than 100 μm. Such very narrow zones of overlap are seen in normal adults and may represent an actual mixing of left- and right-eye activity at the border or, more likely, may mainly reflect the size of the uninsulated electrode tip.” Their report of a 100 μm overlap was prescient, because 100 μm corresponds closely to a pair of border strips. In view of the observations of LeVay et al. (1980), further recordings are warranted in search of binocular units in layer IVc. Recordings in awake monkeys have suggested that binocular interactions occur in all cortical layers, including IVcβ (Creutzfeldt et al., 1987; Snodderly and Gur, 1995). The substrate for such interactions might be provided by local cortical circuits, which often cross column boundaries (Katz et al., 1989; Anderson et al., 1993; Wiser and Callaway, 1996). In particular, layer VI pyramidal neurons send a massive projection to layer IVc, which usually is not confined to the “home” column (Wiser and Callaway, 1997).
The loss of CO activity in border strips of both eyes, induced by suture of only one eye, might also be explained by physiological changes occurring outside layer IVc. Border strips and core zones are vertical slabs extending through all cortical layers, just like ocular dominance columns. The border strips of each eye, united together, encompass the territory between each row of CO patches. Cells driven well by either eye (ocular dominance groups 3–5) are concentrated in these regions. In cat striate cortex, LeVay and Voigt (1988) have shown that horopter-encoding stereo cells are located between ocular dominance columns, as predicted by Ferster (1981). In macaque striate cortex, the functional architecture for stereo-sensitive units has not been explored, but it seems likely that cells with tuned disparity selectivity will be found in border strips (Poggio, 1995). The division of striate cortex into core zones and border strips may, therefore, represent a columnar system for stereo cells. Eyelid suture reduces CO in both eyes’ border strips, because they are rich in stereo cells, and in the closed eye’s core zones. As a result, CO staining remains robust only within rows of patches serving the open eye, enhancing their stripe-like appearance (see Fig. 7B, outside the scotoma). This pattern may become visible in layer IVc via transmission through intrinsic cortical circuits, e.g., by changes in the CO content of axons and dendrites passing vertically through layer IVc.
It is natural to inquire why enucleation and lid suture produce different CO patterns in layer IV but not in other layers (Fig.7A,B, compare CO within the scotomas). Enucleation (and tetrodotoxin) both silence geniculocortical afferents. This causes a drastic reduction in CO levels in geniculocortical axon terminals and in postsynaptic cells in layer IVc, giving rise to a high-contrast columnar pattern identical to the ocular dominance columns. The modest loss of CO activity in the normal eye’s border strips is obscured (although optical density measurements in Fig. 9A showed it). By distinction, after eyelid suture (and lens removal or atropine administration), vigorous levels of spontaneous activity are maintained by geniculocortical afferents. In fact, responses can be evoked by light stimulation through the closed eyelids (Horton, 1984). CO levels remain normal within geniculate cell bodies (Horton, 1984) and probably within their cortical afferents. Under these circumstances, what emerges is a low-contrast CO pattern in layer IVc, reflecting loss of physiologically driven activity in neurons and circuits intrinsic to the cortex.
The striking difference between the suture and the enucleation CO patterns has not been appreciated clearly by previous observers, perhaps because variation in enzyme staining has made it hard to compare data from different experiments involving different types of deprivation. We standardized our measurements of optical density (Fig.1), thereby preserving the absolute intensity and contrast of CO reaction product in our sections. We also combined suture with a focal lesion (Sherman et al., 1974) to produce both patterns in the same cortex (Fig. 7A). This approach provided the strongest evidence that the two patterns are truly distinct. Trusk and Wong-Riley (1990) have reported, in abstract form, that retinal laser lesions produce a CO pattern in macaque striate cortex similar to enucleation. Our results are in agreement. It is easy to understand why laser destruction of ganglion cells produces a local CO pattern resembling enucleation. It is more surprising that damage to the outer retina is sufficient to produce such a pattern (albeit lower in contrast; see Figs. 9A, 12C). Nothing is known about spontaneous activity of ganglion cells after photoreceptor ablation. It is probably diminished if our reasoning in the preceding paragraph is correct.
Fill-in of cortical scotomas after focal retinal laser lesions
After focal retinal laser lesions, single-cell responses are silenced in corresponding regions of the lateral geniculate body and the visual cortex (Eysel et al., 1980; Eysel, 1982; Gilbert et al., 1990; Kaas et al., 1990; Heinen and Skavenski, 1991). Eventually, these scotomas seem to fill in with responses driven by retina just outside the laser lesion (Chino et al., 1992; Gilbert and Wiesel, 1992;Darian-Smith and Gilbert, 1994, 1995; Das and Gilbert, 1995; Rosa et al., 1995; Schmid et al., 1996). The cortical scotomas produced by retinal laser lesions have not been mapped previously using CO. Our five laser lesions showed—fill-in phenomenon or not—that a hole in CO activity remains in the cortex months after a laser lesion. This is true whether or not the other eye is enucleated (see Figs. 7, 9, 12). The hole corresponds retinotopically to the laser lesion visible in the fundus. Although our findings do not exclude topographic plasticity, the persistence of a large CO hole in the cortex tells us that neuronal activity remains profoundly depressed after a retinal lesion.
Some investigators have reported that the fill-in phenomenon occurs after ganglion cell destruction (Chino et al., 1995), whereas others have emphasized that fill-in does not require their elimination (Gilbert and Wiesel, 1992; Schmid et al., 1996). In our experience, retinal laser burns can be untidy lesions. In one animal, we tried to destroy all ganglion cells but failed (Fig. 6). In another animal, we tried to spare ganglion cells but damaged them anyway (Fig. 11, large lesion). The edges of laser lesions tend to slope, especially near the fovea, but they can be sharp. Apple et al. (1976) conducted a histological study of retinal damage in monkeys after experimental laser photocoagulation. They observed that, “in spite of the precise delivery capacity of the instrument, one can never be entirely assured of the degree of damage inflicted on the retina,” because of variation in beam focus, retinal thickness, and pigment density. Unfortunately, most investigators (with the exception of Chino et al., 1995) have provided only a casual description, if any, of the damage from each laser lesion.
The argument that cortical “plasticity” or “reorganization” occurs after focal retinal laser lesions hinges on the crucial observation that the cortex is initially silent and then regains responsiveness. Undoubtedly many factors contribute to the fill-in phenomenon, but the most obvious explanation is that the retina partially recovers from the acute effects of the laser lesion. The thermal injury appears initially as a glowing white blotch from acute retinal swelling, opacification, and coagulation necrosis. As the retina heals over a few weeks, it regains transparency (Fig. 8, compareA, B). After retinal recuperation, surviving ganglion cells may resume firing, accounting in turn for resumption of cortical activity. If a few spared ganglion cells receive input from photoreceptors outside the laser lesion, they may be able to drive occasional cortical neurons inside the scotoma, which appear to have displaced, enlarged receptive fields. Parvicellular giant ganglion cells, with dendritic fields ranging from 250 to 850 μm (Rodieck and Watanabe, 1993), could easily receive input from outside large retinal lesions. Ganglion cells with smaller dendritic fields, located just inside retinal lesions, are likely to get input from intact photoreceptors. This is especially true in the primate, where photoreceptors in the macula are laterally displaced hundreds of micrometers from the ganglion cells they supply. To explain the fill-in of cortical scotomas, we plainly need to learn more about the functional recovery of partially damaged retina.
In a clever experiment, Schmid et al. (1995) made local serous retinal detachments by overloading animals with intravenous fluids. In these animals the retina was spared significant thermal injury. Under these conditions, the cortical fill-in effect occurred immediately. This finding supports our contention that delayed cortical recovery after laser lesions is related to retinal healing. A simple control experiment could clarify this point. After documenting cortical fill-in months after a retinal lesion, one could then re-laser the same patch of retina. If the fill-in effect promptly disappeared, it would be retinal in origin.
Footnotes
This work was supported by the National Eye Institute, That Man May See, and Research to Prevent Blindness. We thank Robin Troyer for her assistance with these experiments. We also thank the California Regional Primate Research Center (especially Dr. Celia Valverde, Jenny Short, and David Robb) for their help. The California Primate Center is supported by National Institutes of Health Base Grant RR00169. The Zif268 antibody was a gift from Rodrigo Bravo. Julie L. Schnapf, Sharif A. Taha, Christian F. Wehrhahn, and Marcello G. P. Rosa provided valuable comments on this manuscript.
Correspondence should be addressed to Dr. Jonathan C. Horton, Beckman Vision Center, 10 Kirkham Street, University of California San Franscico, San Francisco, CA 94143-0730.
REFERENCES
- 1.Anderson JC, Martin KAC, Whitteridge D. Form, function, and intracortical projections of neurons in the striate cortex of the monkey, Macaca nemestrinus. Cereb Cortex. 1993;3:412–420. doi: 10.1093/cercor/3.5.412. [DOI] [PubMed] [Google Scholar]
- 2.Apple DJ, Wyhinny GJ, Goldberg MF, Polley EH, Bizzell JW. Experimental argon laser photocoagulation. Arch Ophthalmol. 1976;94:137–144. doi: 10.1001/archopht.1976.03910030071017. [DOI] [PubMed] [Google Scholar]
- 3.Casagrande VA. A third parallel visual pathway to primate area V1. Trends Neurosci. 1994;17:305–310. doi: 10.1016/0166-2236(94)90065-5. [DOI] [PubMed] [Google Scholar]
- 4.Chaudhuri A, Matsubara JA, Cynader MS. Neuronal activity in primate visual cortex assessed by immunostaining for the transcription factor Zif268. Vis Neurosci. 1995;12:35–50. doi: 10.1017/s095252380000729x. [DOI] [PubMed] [Google Scholar]
- 5.Chino YM, Kaas JH, Smith EL, III, Langston AL, Cheng H. Rapid reorganization of cortical maps in adult cats following restricted deafferentation in retina. Vision Res. 1992;32:789–796. doi: 10.1016/0042-6989(92)90021-a. [DOI] [PubMed] [Google Scholar]
- 6.Chino YM, Smith EL, III, Kaas JH, Sasaki Y, Cheng H. Receptive-field properties of deafferentated visual cortical neurons after topographic map reorganization in adult cats. J Neurosci. 1995;15:2417–2433. doi: 10.1523/JNEUROSCI.15-03-02417.1995. [DOI] [PMC free article] [PubMed] [Google Scholar]
- 7.Chino YM, Smith EL, III, Hatta S, Cheng H. Postnatal development of binocular disparity sensitivity in neurons of the primate visual cortex. J Neurosci. 1997;17:296–307. doi: 10.1523/JNEUROSCI.17-01-00296.1997. [DOI] [PMC free article] [PubMed] [Google Scholar]
- 8.Crawford MLJ, de Faber J-T, Harwerth RS, Smith EL, III, von Noorden GK. The effects of reverse monocular deprivation in monkeys II. Electrophysiological and anatomical studies. Exp Brain Res. 1989;74:338–347. doi: 10.1007/BF00248867. [DOI] [PubMed] [Google Scholar]
- 9.Creutzfeldt OD, Weber H, Tanaka M, Lee BB. Neuronal representation of spectral and spatial stimulus aspects in foveal and parafoveal area 17 of the awake monkey. Exp Brain Res. 1987;68:541–564. doi: 10.1007/BF00249798. [DOI] [PubMed] [Google Scholar]
- 10.Daniel PM, Whitteridge D. The representation of the visual field on the cerebral cortex in monkeys. J Physiol (Lond) 1961;159:203–221. doi: 10.1113/jphysiol.1961.sp006803. [DOI] [PMC free article] [PubMed] [Google Scholar]
- 11.Darian-Smith C, Gilbert CD. Axonal sprouting accompanies functional reorganization in adult cat striate cortex. Nature. 1994;368:737–740. doi: 10.1038/368737a0. [DOI] [PubMed] [Google Scholar]
- 12.Darian-Smith C, Gilbert CD. Topographic reorganization in the striate cortex of the adult cat and monkey is cortically mediated. J Neurosci. 1995;15:1631–1647. doi: 10.1523/JNEUROSCI.15-03-01631.1995. [DOI] [PMC free article] [PubMed] [Google Scholar]
- 13.Das A, Gilbert CD. Long-range horizontal connections and their role in cortical reorganization revealed by optical recording of cat primary visual cortex. Nature. 1995;375:780–784. doi: 10.1038/375780a0. [DOI] [PubMed] [Google Scholar]
- 14.DeYoe EA, Trusk TC, Wong-Riley MTT. Activity correlates of cytochrome oxidase-defined compartments in granular and supragranular layers of primary visual cortex of the macaque monkey. Vis Neurosci. 1995;12:629–639. doi: 10.1017/s0952523800008920. [DOI] [PubMed] [Google Scholar]
- 15.Ding Y, Casagrande VA. The distribution and morphology of LGN K pathway axons within the layers and CO blobs of owl monkey V1. Vis Neurosci. 1997;14:691–704. doi: 10.1017/s0952523800012657. [DOI] [PubMed] [Google Scholar]
- 16.Edwards DP, Purpura KP, Kaplan E. Contrast sensitivity and spatial frequency response of primate cortical neurons in and around the cytochrome oxidase blobs. Vision Res. 1995;35:1501–1523. doi: 10.1016/0042-6989(94)00253-i. [DOI] [PubMed] [Google Scholar]
- 17.Eysel UT. Functional reconnections without new axonal growth in a partially denervated visual relay nucleus. Nature. 1982;299:442–444. doi: 10.1038/299442a0. [DOI] [PubMed] [Google Scholar]
- 18.Eysel UT, Gonzalez-Aguilar F, Mayer U. A functional sign of reorganization in the visual system of adult cats: lateral geniculate neurons with displaced receptive fields after lesions of the nasal retina. Brain Res. 1980;181:285–300. doi: 10.1016/0006-8993(80)90613-7. [DOI] [PubMed] [Google Scholar]
- 19.Ferster D. A comparison of binocular depth mechanisms in areas 17 and 18 of the cat visual cortex. J Physiol (Lond) 1981;311:623–655. doi: 10.1113/jphysiol.1981.sp013608. [DOI] [PMC free article] [PubMed] [Google Scholar]
- 20.Fitzpatrick D, Lund JS, Blasdel GG. Intrinsic connections of macaque striate cortex: afferent and efferent connections of lamina 4C. J Neurosci. 1985;5:3329–3349. doi: 10.1523/JNEUROSCI.05-12-03329.1985. [DOI] [PMC free article] [PubMed] [Google Scholar]
- 21.Gilbert CD, Wiesel TN. Receptive field dynamics in adult primary visual cortex. Nature. 1992;356:150–152. doi: 10.1038/356150a0. [DOI] [PubMed] [Google Scholar]
- 22.Gilbert CD, Hirsch JA, Wiesel TN. Lateral interactions in visual cortex. Cold Spring Harb Symp Quant Biol. 1990;55:663–677. doi: 10.1101/sqb.1990.055.01.063. [DOI] [PubMed] [Google Scholar]
- 23.Grinvald A, Lieke EE, Frostig RD, Hildesheim R. Cortical point-spread function and long-range lateral interactions revealed by real-time optical imaging of macaque monkey primary visual cortex. J Neurosci. 1994;14:2545–2568. doi: 10.1523/JNEUROSCI.14-05-02545.1994. [DOI] [PMC free article] [PubMed] [Google Scholar]
- 24.Haseltine EC, DeBruyn EJ, Casagrande VA. Demonstration of ocular dominance columns in Nissl-stained sections of monkey visual cortex following enucleation. Brain Res. 1979;176:153–158. doi: 10.1016/0006-8993(79)90878-3. [DOI] [PubMed] [Google Scholar]
- 25.Heinen SJ, Skavenski AA. Recovery of visual responses in foveal V1 neurons following bilateral foveal lesions in adult monkey. Exp Brain Res. 1991;83:670–674. doi: 10.1007/BF00229845. [DOI] [PubMed] [Google Scholar]
- 26.Hendrickson AE, Hunt SP, Wu JY. Immunocytochemical localization of glutamic acid decarboxylase in monkey striate cortex. Nature. 1981;292:605–607. doi: 10.1038/292605a0. [DOI] [PubMed] [Google Scholar]
- 27.Hendrickson AE, Movshon JA, Eggers HM, Gizzi MS, Boothe RG, Kiorpes L. Effects of early unilateral blur on the macaque’s visual system. II. Anatomical observations. J Neurosci. 1987;7:1327–1339. doi: 10.1523/JNEUROSCI.07-05-01327.1987. [DOI] [PMC free article] [PubMed] [Google Scholar]
- 28.Hendry SHC, Jones EG. Reduction in number of immunostained GABAergic neurones in deprived-eye dominance columns of monkey area 17. Nature. 1986;320:750–753. doi: 10.1038/320750a0. [DOI] [PubMed] [Google Scholar]
- 29.Hendry SHC, Yoshioka T. A neurochemically distinct third channel in the macaque dorsal lateral geniculate nucleus. Science. 1994;264:575–577. doi: 10.1126/science.8160015. [DOI] [PubMed] [Google Scholar]
- 30.Herdegen T, Walker T, Leah JD, Bravo R, Zimmermann M. The KROX-24 protein, a new transcription regulating factor: expression in the rat central nervous system following afferent somatosensory stimulation. Neurosci Lett. 1990;120:21–24. doi: 10.1016/0304-3940(90)90158-6. [DOI] [PubMed] [Google Scholar]
- 31.Horton JC. Cytochrome oxidase patches: a new cytoarchitectonic feature of monkey visual cortex. Philos Trans R Soc Lond B Biol Sci. 1984;304:199–253. doi: 10.1098/rstb.1984.0021. [DOI] [PubMed] [Google Scholar]
- 32.Horton JC, Hocking DR. An adult-like pattern of ocular dominance columns in striate cortex of newborn monkeys prior to visual experience. J Neurosci. 1996a;16:1791–1807. doi: 10.1523/JNEUROSCI.16-05-01791.1996. [DOI] [PMC free article] [PubMed] [Google Scholar]
- 33.Horton JC, Hocking DR. Intrinsic variability of ocular dominance column periodicity in normal macaque monkeys. J Neurosci. 1996b;16:7228–7239. doi: 10.1523/JNEUROSCI.16-22-07228.1996. [DOI] [PMC free article] [PubMed] [Google Scholar]
- 34.Horton JC, Hocking DR. Myelin patterns in V1 and V2 of normal and monocularly enucleated monkeys. Cereb Cortex. 1997a;7:166–177. doi: 10.1093/cercor/7.2.166. [DOI] [PubMed] [Google Scholar]
- 35.Horton JC, Hocking DR. Timing of the critical period for plasticity of ocular dominance columns in macaque striate cortex. J Neurosci. 1997b;17:3684–3709. doi: 10.1523/JNEUROSCI.17-10-03684.1997. [DOI] [PMC free article] [PubMed] [Google Scholar]
- 36.Horton JC, Hubel DH. Regular patchy distribution of cytochrome oxidase staining in primary visual cortex of macaque monkey. Nature. 1981;292:762–764. doi: 10.1038/292762a0. [DOI] [PubMed] [Google Scholar]
- 37.Horton JC, Stryker MP. Amblyopia induced by anisometropia without shrinkage of ocular dominance columns in human striate cortex. Proc Natl Acad Sci USA. 1993;90:5494–5498. doi: 10.1073/pnas.90.12.5494. [DOI] [PMC free article] [PubMed] [Google Scholar]
- 38.Horton JC, Hocking DR, Kiorpes L. Pattern of ocular dominance columns and cytochrome oxidase activity in a macaque monkey with naturally occurring anisometropic amblyopia. Vis Neurosci. 1997;14:681–689. doi: 10.1017/s0952523800012645. [DOI] [PubMed] [Google Scholar]
- 39.Hoyt WF, Luis O. Visual fiber anatomy in the infrageniculate pathway of the primate. Arch Ophthalmol. 1962;68:124–136. doi: 10.1001/archopht.1962.00960030098018. [DOI] [PubMed] [Google Scholar]
- 40.Hubel DH, Wiesel TN. Functional architecture of macaque monkey visual cortex. Proc R Soc Lond B Biol Sci. 1977;198:1–59. doi: 10.1098/rspb.1977.0085. [DOI] [PubMed] [Google Scholar]
- 41.Hubel DH, Wiesel TN, LeVay S. Plasticity of ocular dominance columns in monkey striate cortex. Philos Trans R Soc Lond B Biol Sci. 1977;278:377–409. doi: 10.1098/rstb.1977.0050. [DOI] [PubMed] [Google Scholar]
- 42.Kaas JH, Krubitzer LA, Chino YM, Langston AL, Polley EH, Blair N. Reorganization of retinotopic cortical maps in adult mammals after lesions of the retina. Science. 1990;248:229–231. doi: 10.1126/science.2326637. [DOI] [PubMed] [Google Scholar]
- 43.Katz LC, Gilbert CD, Wiesel TN. Local circuits and ocular dominance columns in monkey striate cortex. J Neurosci. 1989;9:1389–1399. doi: 10.1523/JNEUROSCI.09-04-01389.1989. [DOI] [PMC free article] [PubMed] [Google Scholar]
- 44.Lachica EA, Beck PD, Casagrande VA. Parallel pathways in macaque monkey striate cortex: anatomically defined columns in layer III. Proc Natl Acad Sci USA. 1992;89:3566–3570. doi: 10.1073/pnas.89.8.3566. [DOI] [PMC free article] [PubMed] [Google Scholar]
- 45.LeVay S, Voight T. Ocular dominance and disparity coding in cat visual cortex. Vis Neurosci. 1988;1:395–414. doi: 10.1017/s0952523800004168. [DOI] [PubMed] [Google Scholar]
- 46.LeVay S, Hubel DH, Wiesel TN. The pattern of ocular dominance columns in macaque visual cortex revealed by a reduced silver stain. J Comp Neurol. 1975;159:559–575. doi: 10.1002/cne.901590408. [DOI] [PubMed] [Google Scholar]
- 47.LeVay S, Wiesel TN, Hubel DH. The development of ocular dominance columns in normal and visually deprived monkeys. J Comp Neurol. 1980;191:1–51. doi: 10.1002/cne.901910102. [DOI] [PubMed] [Google Scholar]
- 48.LeVay S, Connolly M, Houde J, Van Essen DC. The complete pattern of ocular dominance stripes in the striate cortex and visual field of the macaque monkey. J Neurosci. 1985;5:486–501. doi: 10.1523/JNEUROSCI.05-02-00486.1985. [DOI] [PMC free article] [PubMed] [Google Scholar]
- 49.Livingstone MS, Hubel DH. Anatomy and physiology of a color system in the primate visual cortex. J Neurosci. 1984;4:309–356. doi: 10.1523/JNEUROSCI.04-01-00309.1984. [DOI] [PMC free article] [PubMed] [Google Scholar]
- 50.Luna LG. Manual of histologic staining methods of the Armed Forces Institute of Pathology, p 203. McGraw-Hill; New York: 1968. [Google Scholar]
- 51.Malpeli JG, Baker FH. The representation of the visual field in the lateral geniculate nucleus of Macaca mulatta. J Comp Neurol. 1975;161:569–594. doi: 10.1002/cne.901610407. [DOI] [PubMed] [Google Scholar]
- 52.Marshall J, Hamilton AM, Bird AC. Histopathology of ruby and argon laser lesions in monkey and human retina. Br J Ophthalmol. 1975;59:610–630. doi: 10.1136/bjo.59.11.610. [DOI] [PMC free article] [PubMed] [Google Scholar]
- 53.McIlwain JT. Point images in the visual system: new interest in an old idea. Trends Neurosci. 1986;9:354–358. [Google Scholar]
- 54.Poggio GF. Mechanisms of stereopsis in monkey visual cortex. Cereb Cortex. 1995;3:193–204. doi: 10.1093/cercor/5.3.193. [DOI] [PubMed] [Google Scholar]
- 55.Rodieck RW, Watanabe M. Survey of the morphology of macaque retinal ganglion cells that project to the pretectum, superior colliculus, and parvicellular laminae of the lateral geniculate nucleus. J Comp Neurol. 1993;338:289–303. doi: 10.1002/cne.903380211. [DOI] [PubMed] [Google Scholar]
- 56.Rosa MGP, Schmid LM, Calford MG. Responsiveness of cat area 17 after monocular inactivation: limitation of topographic plasticity in adult cortex. J Physiol (Lond) 1995;482:589–608. doi: 10.1113/jphysiol.1995.sp020543. [DOI] [PMC free article] [PubMed] [Google Scholar]
- 57.Schmid LM, Rosa MGP, Calford MB. Retinal detachment induces massive immediate reorganization in visual cortex. NeuroReport. 1995;6:1349–1353. doi: 10.1097/00001756-199506090-00030. [DOI] [PubMed] [Google Scholar]
- 58.Schmid LM, Rosa MGP, Calford MB, Ambler JS. Visuotopic reorganization in the primary visual cortex of adult cats following monocular and binocular retinal lesions. Cereb Cortex. 1996;6:388–405. doi: 10.1093/cercor/6.3.388. [DOI] [PubMed] [Google Scholar]
- 59.Sherman SM, Guillery RW, Kaas JH, Sanderson KJ. Behavioral, electrophysiological and morphological studies of binocular competition in the development of the geniculo-cortical pathways of cats. J Comp Neurol. 1974;158:1–18. doi: 10.1002/cne.901580102. [DOI] [PubMed] [Google Scholar]
- 60.Smiddy WE, Fine SL, Quigley HA, Hohman RM, Addicks EA. Comparison of krypton and argon laser photocoagulation. Arch Ophthalmol. 1984;102:1086–1092. doi: 10.1001/archopht.1984.01040030880039. [DOI] [PubMed] [Google Scholar]
- 61.Snodderly DM, Gur M. Organization of striate cortex of alert, trained monkeys (Macaca fascicularis): ongoing activity, stimulus selectivity, and widths of receptive field activating regions. J Neurophysiol. 1995;74:2100–2125. doi: 10.1152/jn.1995.74.5.2100. [DOI] [PubMed] [Google Scholar]
- 62.Tigges M, Boothe RG, Tigges J, Wilson JR. Competition between an aphakic and an occluded eye for territory in striate cortex of developing rhesus monkeys: cytochrome oxidase histochemistry in layer 4C. J Comp Neurol. 1992;316:173–186. doi: 10.1002/cne.903160204. [DOI] [PubMed] [Google Scholar]
- 63.Tootell RBH, Switkes E, Silverman MS, Hamilton SL. Functional anatomy of macaque striate cortex. II. Retinotopic organization. J Neurosci. 1988;8:1531–1568. doi: 10.1523/JNEUROSCI.08-05-01531.1988. [DOI] [PMC free article] [PubMed] [Google Scholar]
- 64.Trusk TC, Wong-Riley MTT. Focal laser retinal lesions reveal differential cytochrome oxidase reactivity in four isoeccentric regions of the macaque striate cortex. Soc Neurosci Abstr. 1990;16:708. [Google Scholar]
- 65.Trusk TC, Kaboord WS, Wong-Riley MTT. Effects of monocular enucleation, tetrodotoxin, and lid suture on cytochrome-oxidase reactivity in supragranular puffs of adult macaque striate cortex. Vis Neurosci. 1990;4:185–204. doi: 10.1017/s0952523800003345. [DOI] [PubMed] [Google Scholar]
- 66.T’so DY, Frostig RD, Lieke EE, Grinvald A. Functional organization of primate visual cortex revealed by high resolution optical imaging. Science. 1990;249:417–420. doi: 10.1126/science.2165630. [DOI] [PubMed] [Google Scholar]
- 67.Van Essen DC, Newsome WT, Maunsell JHR. The visual field representation in striate cortex of the macaque monkey: asymmetries, anisotropies, and individual variability. Vision Res. 1984;24:429–448. doi: 10.1016/0042-6989(84)90041-5. [DOI] [PubMed] [Google Scholar]
- 68.Wiesel TN, Hubel DH, Lam DMK. Autoradiographic demonstration of ocular-dominance columns in the monkey striate cortex by means of transneuronal transport. Brain Res. 1974;79:273–279. doi: 10.1016/0006-8993(74)90416-8. [DOI] [PubMed] [Google Scholar]
- 69.Wiser AK, Callaway EM. Contributions of individual layer 6 pyramidal neurons to local circuitry in macaque primary visual cortex. J Neurosci. 1996;16:2724–2739. doi: 10.1523/JNEUROSCI.16-08-02724.1996. [DOI] [PMC free article] [PubMed] [Google Scholar]
- 70.Wiser AK, Callaway EM. Ocular dominance columns and local projections of layer 6 pyramidal neurons in macaque primary visual cortex. Vis Neurosci. 1997;14:241–251. doi: 10.1017/s095252380001138x. [DOI] [PubMed] [Google Scholar]
- 71.Wong-Riley MTT. Changes in the visual system of monocularly sutured or enucleated kittens demonstrable with cytochrome oxidase histochemistry. Brain Res. 1979;171:11–28. doi: 10.1016/0006-8993(79)90728-5. [DOI] [PubMed] [Google Scholar]
- 72.Wong-Riley MTT. Primate visual cortex: dynamic metabolic organization and plasticity revealed by cytochrome oxidase. In: Peters A, Rockland KS, editors. Cerebral cortex. Plenum; New York: 1994. pp. 141–200. [Google Scholar]
- 73.Wong-Riley MTT, Carroll EW. Effect of impulse blockage on cytochrome oxidase activity in monkey visual system. Nature. 1984;307:262–264. doi: 10.1038/307262a0. [DOI] [PubMed] [Google Scholar]
- 74.Yoshioka T. Differential regulation of neurofilament triplet proteins under monocular deprivation in adult macaque. Soc Neurosci Abstr. 1997;23:649.1. [Google Scholar]
- 75.Yoshioka T, Levitt JB, Lund JS. Independence and merger of thalamocortical channels within macaque monkey primary visual cortex: anatomy of interlaminar projections. Vis Neurosci. 1994;11:467–489. doi: 10.1017/s0952523800002406. [DOI] [PubMed] [Google Scholar]


