

Abstract
Recently, two members of a new family of Ca2+channel α1 subunits, α1G (or CavT.1) and α1H (or CavT.2), have been cloned and expressed. These α1 subunits generate Ba2+ currents similar to the T-type Ca2+ currents present in sensory neurons. Here, we use three methods to investigate whether the T currents of nodosus ganglion neurons are encoded by members of the CavT family. PCR detected the presence of mRNA encoding both α1G and α1H, as well as a third highly related sequence, α1I. In situ hybridizations performed on nodosus ganglia demonstrate a high expression of α1H subunit RNAs. Transfection of nodosus ganglion neurons with a generic antisense oligonucleotide against this new α1 subunit family selectively suppresses the low-voltage-activated Ca2+ current. The antisense oligonucleotide effect increased with time after transfection and reached a maximum 3 d after treatment, indicating a 2–3 d turnover for the α1 proteins. Taken together, these results suggest that the T-type current present in the sensory neurons is mainly attributable to α1H channels. In addition, taking advantage of the high specificity of the antisense ON to the cloned channels, we showed that T-type currents greatly slowed the repolarization occurring during an action potential and were responsible for up to 51% of the Ca2+ entry during spikes. Therefore, the antisense strategy clearly demonstrates the role of low-voltage-activated Ca2+ current in affecting the afterpotential properties and influencing the cell excitability. Such tools should be beneficial to further studies investigating physiological roles of T-type Ca2+ currents.
Keywords: low-threshold/T-type calcium channels, antisense oligonucleotides, PCR, in situ hybridization, action potentials, sensory neurons, nodosus ganglion
The existence of a neuronal Ca2+ current elicited just above the resting potential was first established in primary sensory neurons (Carbone and Lux, 1984a; Bossu et al., 1985; Fedulova et al., 1985; Nowycky et al., 1985). Consequently, many properties of the low-voltage-activated (LVA) or T-type Ca2+ currents have been described in this cell type. Briefly, LVA channels have a 8–10 pS conductance in either 20 mm Ca2+ (Carbone and Lux, 1984a) or 100 mm Ba2+ (Fox et al., 1987b). Resulting whole-cell currents are transient, activating approximately −60 mV, with complete steady-state inactivation above −50 mV (Nowycky et al., 1985; Bossu and Feltz, 1986; Carbone and Lux, 1987; Fox et al., 1987a,b). In contrast to high-voltage-activated (HVA) Ca2+ currents, T-type currents display slow deactivation (Carbone and Lux, 1984b; Armstrong and Matteson, 1985;Matteson and Armstrong, 1986). Despite the fact that detailed studies are greatly impeded by the lack of a specific pharmacology, the unique properties of LVA currents implicate these channels in many physiological functions. More specifically, in neurons they have been suggested to be responsible for repetitive firing activity, intrinsic neuronal oscillations, and Ca2+ entry during spikes (for review, see Huguenard, 1996).
Many efforts have been devoted to the molecular characterization of LVA channels. Until recently, no cloned Ca2+ channel α1 subunit was shown to generate current with properties similar to the LVA currents. However, this year two studies have offered a distinct hypothesis to account for the molecular counterpart of the T-type current. Meir and Dolphin (1998) have reported in COS7 cells that expressed α1B, α1C, and α1E subunits (Snutch et al., 1990;Soong et al., 1993; Schneider et al., 1994), which classically generate HVA currents, can also form small conductance channels with properties similar to native T-type channels. On the other hand, the Perez-Reyes laboratory has reported cloning and characterization of a new α1 subunit family, called CavT (Cribbs et al., 1998;Perez-Reyes et al., 1998a). The two members of the family expressed so far, the α1G (or CavT.1) and α1H (or CavT.2) subunits, encode currents displaying biophysical properties similar to the LVA Ca2+current of sensory neurons. In a first attempt to clarify the molecular counterpart of the LVA Ca2+ channel in situ, we have shown previously, using an antisense oligonucleotide (ON) strategy, that depletion of the Ca2+ channel auxiliary β subunit specifically affects HVA current properties without modifying LVA current properties in nodosus ganglion neurons (Lambert et al., 1997). However, this observation does not make it possible to choose which α1 family encodes T-type channels in sensory neurons. Indeed, small-conductance HVA channel properties are not sensitive to coexpression of the β subunit (Meir and Dolphin, 1998), and CavT subunits have low sequence homology (∼30% similarity) with other Ca2+ channel subunits, lacking the AID sequence (Perez-Reyes et al., 1998a) in the intracellular loop I–II where β subunits bind with high affinity (Pragnell et al., 1994). Therefore, we have extended our in situ studies to finally identify the α1 subunit underlying T-type current in sensory neurons. We show here that an antisense ON designed against the CavT subunit family (Perez-Reyes et al., 1998b) suppresses the T-type current in nodosus ganglion neurons. In addition, using this highly specific tool to selectively remove the LVA component of the Ca2+ current, we emphasize the role of T-type channels in shaping the action potential and determining the amount of Ca2+ flowing into cranial sensory neurons during a spike.
MATERIALS AND METHODS
Cell culture and transfection. Culture method of rat nodosus ganglion neurons has been described previously in detail inBossu et al. (1985) and briefly reported in Lambert et al. (1997). Three days after plating, cells were transfected using polyethylenimine (50 kDa; Sigma, St. Louis, MO) as transfecting agent (Lambert et al., 1996). Cells were exposed for 4 hr to 300 nm5′-fluorescent antisense ON or 5′-fluorescent scrambled ON (see Table1 for sequences). Antisense ONs were designed against the motif NMFVGVVE of DIIISVI, using the nucleotide sequences of α1G [Perez-Reyes et al. (1998a); GenBank AF027984], α1H [Cribbs et al. (1998); GenBank AF051946], and α1I (GenBankAL008716). ON had phosphorothioate linkages in all positions.
Table 1.
List of the selected oligonucleotide sequences
| Sequence | |
|---|---|
| Antisense ON1-a | 5′-TCCACCACCACGCCCACAAACATGTT-3′ |
| Scrambled ON1-a | 5′-TCACCCACGACCCCCAACACATAGTT-3′ |
| Forward primer1-b | 5′-GGCGT(G/C)GT(G/C)GT(G/C)GAGAACTT-3′ |
| Reverse primer1-b | 5′-GATGATGGTGGG(A/G)TTGAT-3′ |
| α1G1-c | 5′-CCAGCCCGCACGCCTATAGCCCTAGAGACCTGG-3′ |
| 5′-TCCGATGGGCATCTGGGAGGGGGTGCCTGGCAA-3′ | |
| 5′-TGTCGCCGCCGGCTGTGGGGATCCCGGAGGTCA-3′ | |
| α1H1-c | 5′-ATGCCGTACATCCTGGGTAAACTCATAGACTCC-3′ |
| 5′-AGCCCCTTGGGTCGTGAGCTGGTGCCACCTTTG-3′ | |
| 5′-ATCCCTCCTGGTTGTGAGGCCTTCCGCAGTGGT-3′ | |
| α1I1-c | 5′-AGCCACCAGAACCTGAGCCTTCCTGGCCTGAGT-3′ |
| 5′-TCGCGCCACACATCCCCACACAGTCGGGCTGCC-3′ |
ON sequences used for transfection.
ON sequences for RT-PCR.
ON sequences for in situhybridization.
Reverse transcription-PCR. Fragments of cDNA were amplified by the PCR after reverse transcription (RT-PCR) [reverse transcriptase from Life Technologies (Gaithersburg, MD)] of poly(A+) RNA from cultured nodosus ganglion cells and NIE-115 neuroblastoma cells. First-strand cDNA was synthesized in the presence of 0.3 μg poly(A+) RNA. The amplification procedure was as follows: 1 cycle at 94°C for 30 sec; 10 cycles composed of 30 sec at 94°C, 30 sec at 58°C, and 30 sec at 71°C; and 23 cycles composed of 20 sec at 94°C, 30 sec at 58°C, and 30 sec at 71°C. See Table 1 for primer sequences.
In situ hybridization. Sprague Dawley rats of different postnatal ages (P0, P7, and adult) were anesthetized either by hypothermia (P0) or by using a mixture of ketamine and xylazine (≥P7). Nodosus ganglia were removed, and 10 μm sections were thaw-mounted onto glass slides. Antisense ON 33 bases in length were labeled with α[33P] dATP using terminal deoxynucleotidyl transferase (Life Technologies). Prehybridization, hybridization, and wash conditions were identical to those described previously (Talley et al., 1997).
We used multiple ON probes corresponding to the region of the three genes that encodes the I–II intracellular loop of the channels. The sequences of the antisense probes are given in Table 1. Each probe was tested separately on rat brain sections (data not shown); after this initial characterization the probes for each gene were hybridized to nodosus ganglia as a mixture, resulting in an enhanced signal. Specificity of the probes was affirmed by virtue of two separate findings. First, each probe individually exhibited a restricted CNS distribution that was identical to that shown by the other probes to that same gene and, at the same time, distinctly different from the distributions obtained with probes to the other two genes (our unpublished observations). Second, concurrent incubation of the sections with 500- to 1000-fold excess unlabeled oligonucleotide (1 μm) in a competition experiment resulted in complete elimination of hybridization signal. Five animals were used for each age group. Hybridized sections were apposed to autoradiographic film and also dipped in liquid emulsion (NTB2, Kodak).
Antisense experiments in Xenopus oocytes. The rat brain α1G cDNA (Perez-Reyes et al., 1998a) was subcloned into pGEM-HEA (a gift from Kenton Swartz, National Institutes of Health), which contains the 5′ and 3′ untranslated regions fromXenopus β globin (Liman et al., 1992). Capped cRNA was synthesized from plasmid linearized with AflII using the T7 mMessage mMachine kit (Ambion, Austin, TX). Cloning and expression of the human α1E cDNA has been described previously (Schneider et al., 1995). Oocytes were prepared from Xenopus laevis (NASCO, Ft. Atkinson, WI) using standard techniques (Bernal et al., 1997). Each oocyte was injected with 10 ng of cRNA in a volume of 50 nl. Oligonucleotides were mixed with the cRNA to achieve a final concentration of 10 μm. Oocytes were incubated at 18°C for at least 5 d before recording. The ON had no significant effect on cell viability.
Oocytes were voltage-clamped using a two-microelectrode voltage-clamp amplifier (OC-725B, Warner Instrument, Hamden, CT). The bath solution contained the following (in mm): 10 Ba(OH)2, 80 NaOH, 1 KOH, and 5 HEPES, adjusted to pH 7.4 with methanesulfonate. Voltage and current electrodes (1.5–1.8 MΩ tip resistance) were filled with 3 m KCl. Data were acquired at 4 kHz using the pCLAMP system [Digidata 1200 and pCLAMP 6.0, Axon Instruments (Foster City, CA)] and filtered at 1 kHz.
Electrophysiology of nodosus ganglion neurons. Transfected cells were identified by their nuclear fluorescence using conventional fluorescence microscopy. Currents/voltages were recorded using an Axopatch 200A amplifier and pClamp6 software (Axon Instruments) in the whole-cell configuration of the patch-clamp technique. A minimal 75% compensation of series resistance (typically 10 MΩ) and capacity current was achieved. Leak currents were removed by use of a hyperpolarized P/4 substraction protocol.
Estimation of Ca2+ current density.Current traces were recorded using a sampling frequency of 10 kHz and analyzed after filtering at 1 kHz with a digital Gaussian filter. Ca2+ currents were recorded in isolation by the use of bath and pipette solutions that maximally reduced the Na+, K+, and Cl− currents. The bath solution contained (in mm): 10 CaCl2, 110 trichloroacetate, 10 HEPES, 10 tetraethylammonium chloride, and 10 glucose, adjusted to pH 7.4 with Tris-base. Tetrodotoxin (TTX) was added at a concentration of 1 μm to the extracellular medium to eliminate any contamination of current flowing through Na+channels. The pipette solution contained (in mm): 95 HEPES, 3 CaCl2, 30 EGTA, 5 NaCl, 1 MgATP, and 0.2 GTP, adjusted to pH 7.2 with CsOH. Cell capacitance was estimated from the time constant of the decay phase of a transient (sampled at 100 kHz, low-pass-filtered at 10 kHz) elicited by a 5 mV hyperpolarizing step from a holding potential of −80 mV. In each cell, current density was measured by constructing several I–V curves with successive 200 msec depolarizing steps ranging from −60 to 50 mV (5 mV increments) from a holding potential of −80 mV.
Generation of spikes. Spikes were recorded at a sampling frequency of 100 kHz (low-pass filter: 10 kHz) and generated by a 1 msec current injection. In this condition, action potential developed a few milliseconds after the end of the initial depolarization induced by the current injection, therefore with minimal alteration of the spike waveform induced by the current injection. The extracellular solution contained (in mm): 137 NaCl, 2.7 KCl, 2 MgCl2, 2.8 CaCl2, 10 HEPES, and 5.6 glucose; pH was adjusted to 7.4 with TrisOH. The pipette solution contained in (mm): 125 potassium methylsulfate, 10 sodium methanesulfonate, 4 KCl, 1 MgCl2, 1 EGTA/KOH, 10 HEPES, 1 MgATP, and 0.5 GTP; pH was adjusted to 7.2 with TrisOH.
Ca2+ entry during action potential. To estimate Ca2+ entry during the spike, stereotypical template action-potential waveforms were generated by averaging recorded spikes synchronized at time of peak amplitude. These templates were used to evoke Ca2+ currents recorded at 100 kHz (low-pass filter: 10 kHz). The intracellular medium was identical to the one used to estimate Ca2+ current density, but the extracellular medium was modified to impose a more physiological Ca2+ concentration. The bath solution contained (in mm): 2.8 CaCl2, 120 trichloroacetate, 10 HEPES, 10 tetraethylammonium chloride, 10 glucose; adjusted to pH 7.4 with Tris-base. TTX was added at a concentration of 1 μm.
Data reported are mean ± SEM.
RESULTS
CavT subunits are expressed in nodosus ganglion neurons
The RT-PCR technique was used to confirm the presence of CavT subunit RNAs in nodosus ganglion neurons. RNA fragments ∼490 bp long were amplified (Fig.1), which correspond to α1G (492 bp long), α1H (489 bp long), and α1I (474 bp long) subunit RNAs. Individual clones from RT-PCR products were sequenced and at least one clone from each gene was found.
Fig. 1.
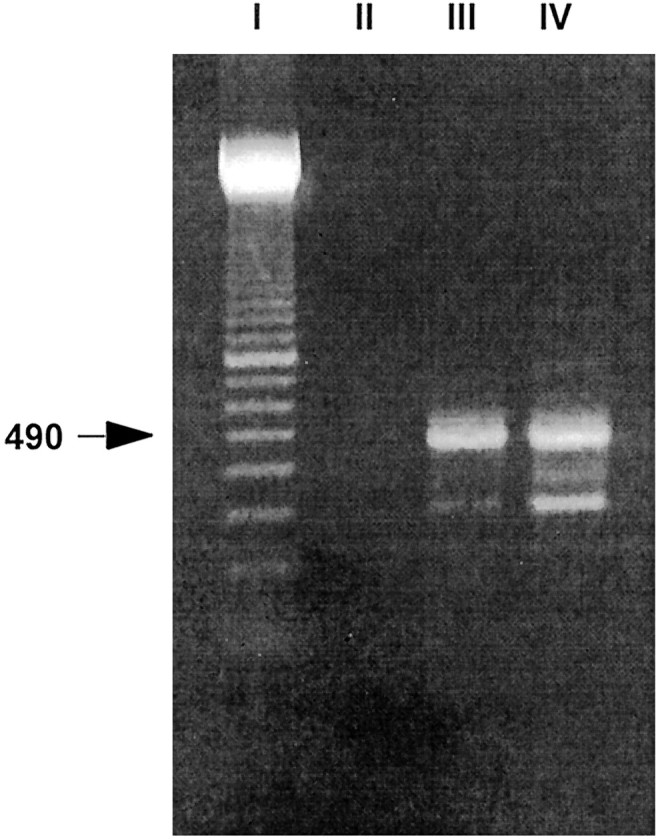
CavT RNAs are transcribed in nodosus sensory neurons. Fragments ∼490 bp long can be amplified from nodosus ganglion cells neurons (lane III; poly(A+) RNA 0.3 μg) using PCR primers specific for the newly cloned family of Ca2+ channel α1 subunits (see Table 1). The same size of PCR products could be amplified approximately to the same extent from undifferentiated NIE-115 neuroblastoma cells (lane IV; poly(A+) RNA 0.3 μg), which display prominent T-type currents (Perez-Reyes et al., 1998a). Lane I is the 100 bp size marker. Lane II is a negative control obtained when omitting the reverse transcriptase.
Antisense ON knock-out of T-type channels in nodosus ganglion neurons
To investigate further the possible involvement of this family of α1 subunits in generating LVA currents in sensory neurons, an antisense ON strategy was performed using a generic antisense ON sequence directed against the DIIISVI domain of the CavT channels. The ability of the antisense ON to block channel protein expression was first tested using theXenopus laevis system. As reported previously (Perez-Reyes et al., 1998a), T-type currents can be readily measured from oocytes injected with α1G cRNA. Channel expression was almost completely blocked by coinjection of α1G cRNA with the antisense ON (Fig.2). Small T-type currents (−13 nA) were detected in 2 of 28 oocytes. In contrast, the scrambled ON did not block expression of T-type currents. The specificity of the antisense ON was tested by coinjecting it with α1E cRNA into oocytes. Typical high-voltage-activated currents were measured from both oocytes injected with either α1E or α1E plus antisense ON (data not shown;n = 6).
Fig. 2.

Antisense, but not scrambled ON block expression of α1G in Xenopus oocytes. Oocytes were injected with either α1G (n = 14), α1G plus antisense ON (n = 28), or α1G plus scrambled ON (n = 20). The results were obtained from oocytes from three frogs. Currents were recorded during test pulses to −20 mV from a holding potential of −90 mV.
The same antisense and scrambled ON were further used in nodosus ganglion neuron cultures. In antisense and scrambled ON-transfected neurons, Ca2+ currents were recorded using 10 mm Ca2+ as the ion charge carrier to maximally separate low- and high-voltage-activated currents. Transfected cells were distinguished by the use of fluorescein-conjugated ON, whose intracellular presence induced a strong staining of the cell nucleus [for details, see Lambert et al. (1996)]. To avoid culture-to-culture and transfection-to-transfection variability, and to assess any nonspecific effect of ON transfection on the membrane properties of the cells, scrambled ON-transfected neurons were recorded in each experiment as controls. Using this methodology, we observed that depletion of the CavT subunits induced a dramatic decrease in LVA current amplitude (Fig.3A). Comparison of mean current densities measured 3 d after treatment in both groups of neurons indicated that almost no LVA Ca2+ current could be evoked in antisense ON-transfected cells. By contrast, no effect on the HVA current density was observed (Fig. 3B). To confirm the absence of antisense ON effect on HVA currents, Boltzmann functions (I = G (V −Erev)/(1 + exp[−(V −V0.5)/k])) were fitted toI–V curves constructed from the amplitude of the Ca2+ currents measured at the end of 200 msec depolarizing steps (data not shown). The fast inactivation properties of T-type channels ensure that such Ca2+ currents are attributable solely to the activation of HVA channels. This procedure was used to describe the characteristics of the mixed population of HVA channels, with no difference being observed in mean parameter values of the Boltzmann fits: G = 0.54 ± 0.07 and 0.49 ± 0.05 pS/pF; V0.5 = 17.4 ± 0.7 and 16.0 ± 0.6 mV; k = 5.7 ± 0.2 and 5.4 ± 0.3; Erev = 77.0 ± 1.5 and 73.3 ± 1.4 mV in antisense (n = 11) and scrambled (n = 14) ON-transfected cells, respectively.
Fig. 3.

Antisense ON reduces the LVA Ca2+ current with no effect on HVA currents.A and B show typical currents recorded in antisense (A) and in scrambled (B) ON-treated cells depolarized with 200 msec steps either to −20 mV (top trace) or +30 mV (bottom trace) from −80 mV holding potential. Note that the antisense ON-treated cell displayed almost no LVA current. Cells were from the same culture and recorded 3 d after transfection. InC, current density–voltage relationships of peak current show a dramatic reduction of LVA current 3 d after transfection in antisense ON-treated cells when compared with scrambled ON-transfected cells.
To characterize the progression of the antisense ON effect, a systematic study of Ca2+ current densities was performed every day after transfection. Maximal T-type current densities were measured at −20 mV, thus allowing LVA currents to be recorded in isolation. Maximal HVA current densities were estimated from current amplitude obtained at the end of 200 msec depolarizing steps. The antisense ON effect was detectable the first day after treatment and increased thereafter (Fig.4A). A maximum decrease of 78.7 ± 2.2% (n = 11) in LVA current density was achieved 3 d after transfection, suggesting a turnover time of 2–3 d for these α1 subunits (Fig. 4B).
Fig. 4.
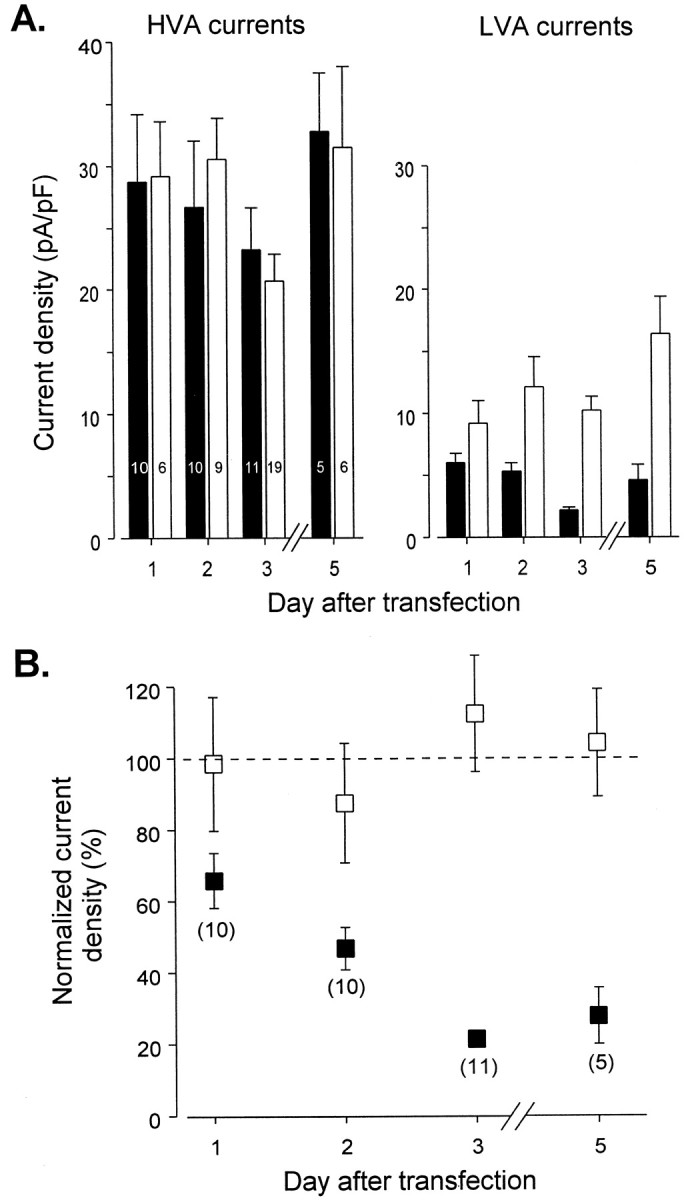
T-type and HVA current densities as a function of time after transfection. In A, right andleft histograms refer to HVA and LVA mean current densities, respectively. HVA current densities were estimated from maximal current obtained after 200-msec-long depolarizations. Peak current amplitudes observed at −20 mV were used to calculate T-type current densities. Averaged data from antisense ON-transfected neurons are shown in black bars. Averaged data obtained from scrambled ON-transfected neurons are shown in white bars. Numbers of cells are indicated inside each bar in the HVA mean current density histogram (left histogram). Note that the current densities of the HVA channels are similar in both groups and that the T-type current is reduced in cells treated with antisense ON as compared with cells treated with scrambled ON. InB, current densities observed in antisense ON-transfected cells were expressed as percentage of the mean current densities calculated for scrambled ON-treated neurons. Antisense ON effects on HVA (■) and LVA (▪) current densities were reported as a function of the time after transfection. Numbers of cells are indicated in brackets.
In conclusion, this study clearly demonstrates that the newly cloned family of α1 subunits is responsible for the T-type currents in nodosus ganglion sensory neurons.
Expression of genes encoding T-type calcium channels in nodosus ganglion neurons
To determine which member of the CavT subunit family is responsible for the LVA Ca2+ current, in situ hybridization was used to identify the α1 subunit RNAs present in nodosus ganglion neurons. We hybridized a mixture of [33P]-labeled ON corresponding to each of the three known members of the CavT family of genes. At each of the different ages tested (P0, P7, and adult), an intense signal was generated by probes specific to the α1H gene, whereas probes specific to the α1G and α1I genes generated signals that were much weaker (Fig. 5). Visualization of silver grains from emulsion-dipped slides revealed that mRNA for α1G was present at low levels in many neurons, with scattered neurons exhibiting a moderate signal. On the other hand, labeling for α1I was detectable above background [as assessed in competition experiments using excess amounts of unlabeled ON (data not shown)] in only a few neurons.
Fig. 5.
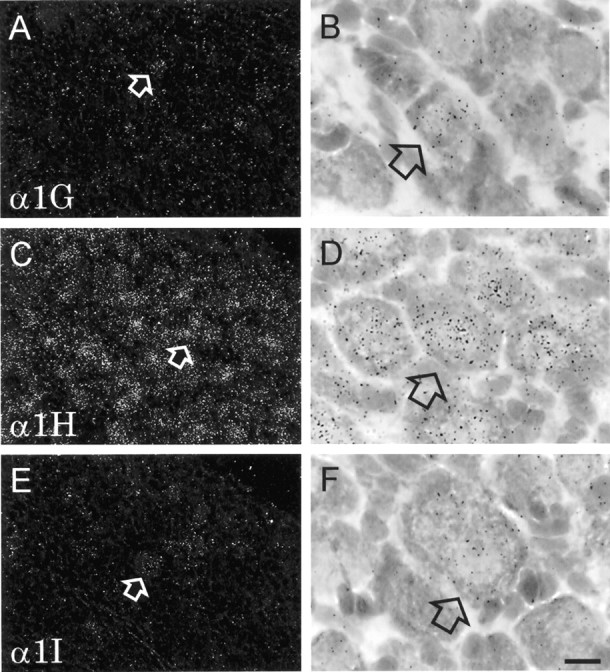
In situ hybridization reveals expression of α1G, α1H, and α1I Ca2+ channel subunits in nodosus ganglion neurons. Ganglia were dissected from 7-d-old rats, hybridized with 33P-labeled oligonucleotides, and exposed to autoradiographic emulsion. Low-power dark-field images are shown on the left (A, C, andE); high-power bright-field images are shown on theright (B, D, andF). In each pair of micrographs, the same labeled neuron is indicated by arrows. Uniformly high expression was seen for the α1H subunit (C, D). α1G expression also was uniform, but the intensity of the labeling was much lower (A, B), with the exception of scattered neurons that were moderately labeled (arrows). Labeling for the α1I subunit was detectable only in a few neurons (E, F,arrows). Scale bar (shown in F):A, C, E, 40 μm; B, D, F, 10 μm.
Effect of T-type channel depletion on action-potential waveform
Given that a very specific suppression of LVA current could be obtained by antisense ON treatment, we applied this technique to study the role(s) of LVA Ca2+ currents in sensory neurons. Because the conductance and activation–deactivation properties of T-type currents suggest that they may contribute to Ca2+ entry during the action potential, we first compared spikes generated in either antisense or scrambled ON-treated neurons using extra and intracellular solutions close to physiological conditions [mainly 137 mm NaCl and 2.8 mmCa2+ in the extracellular medium (see Materials and Methods)]. Averaged action-potential waveforms obtained 3 d after transfection show a slower repolarization when T-type channels are expressed [scrambled ON-treated neurons (Fig.6)] compared with cells devoid of LVA channels (antisense ON-transfected neurons). Because LVA currents can be fully activated from hyperpolarized potentials, the slowing of the repolarization phase was observed only in spikes generated from −80 mV holding potential (compared with −60 mV holding potential), which confirms the role of T-type current in this phenomenon. Under these conditions, T-type currents induced a final long-lasting depolarizing component (Fig. 6, star in bottom traces) in addition to a broadening of the waveform.
Fig. 6.

Role of the T-type current in shaping the action-potential waveform. Spikes were generated in antisense (bold traces) and scrambled (faint traces) ON-treated neurons. Traces show averaged waveforms obtained at two potentials: −60 mV (top traces) and −80 mV (bottom traces). The −60 mV potential is close to resting potential and results in partial steady-state inactivation of the T-type current. Note that in this case antisense and scrambled ON-treated cells generate almost identical waveforms. At −80 mV, full activation of T-type current is made possible. In this latter condition, spikes recorded in scrambled ON-treated cells were slower and further prolonged by a depolarizing tail potential absent in antisense ON-treated cells. Student’s t test was performed on values obtained at time indicated by thestar. Difference is significant with p < 0.008.
Role of T-type currents in Ca2+ entry during spikes
The average action-potential waveform obtained in scrambled ON-transfected neurons was used as a template to depolarize the cells and evoke Ca2+ current in voltage-clamp protocols. In these experiments, Ca2+ currents were recorded with a more physiological extracellular Ca2+concentration of 2.8 mm, equal to the one used when recording spikes. The reduced divalent ion concentration, as compared with the 10 mm concentration used previously during description of the antisense ON effect, decreased the T-type current amplitude. Three days after transfection, mean current density evaluated at −20 mV in scrambled ON-treated cells was 4.8 ± 1.7 pA/pF (n = 6) in 2.8 mmCa2+ and 10.2 ± 1.1 pA/pF (n = 19) in 10 mm Ca2+. The decrease in extracellular Ca2+ induced a 13 mV hyperpolarizing shift in the activation potential of the HVA currents (in 2.8 mm Ca2+, Boltzmann fit parameters wereG = 0.39 ± 0.22 pS/pF;V0.5 = 4.4 ± 2.5 mV; k = 5.7 ± 1.4; and Erev = 59.1 ± 5.1 mV;n = 9). In these conditions, Ca2+entry during spikes could be compared between neurons transfected with antisense ON (consequently displaying no T-type current) and neurons treated with scrambled ON. As illustrated in Figure7, the presence of LVA channels dramatically modifies Ca2+ currents recorded during the template action potentials. T-type channel activation induces a late Ca2+ current clearly distinguishable from the HVA currents and is responsible for half of the Ca2+entry during spikes. Indeed, by subtracting and integrating averaged traces obtained 3 d after transfection in neurons treated with antisense or scrambled ON (Fig.8A), it was calculated that ∼50.8% of the Ca2+ entry was attributable to LVA current in scrambled ON-transfected cells. Finally, Ca2+ tail currents were generated at different times during the spike to measure the level of Ca2+channel activation, which otherwise cannot be directly estimated from the Ca2+ current traces because of continuous variation of the driving force. A series of templates designed to depolarize neurons for different time intervals of the action-potential waveform were applied to scrambled and antisense ON-transfected cells (Fig. 8B). The tail current amplitudes observed at different times during spikes indicate that T-type channel activation is not evident early in the action potential. On the other hand, slower kinetics of tail currents recorded in scrambled ON-treated cells clearly reflect the presence of LVA channels. Surprisingly, in both groups of neurons, the activation of the Ca2+channels is maximal around the peak of the spike. This suggests that although significant Ca2+ entry occurs during spike repolarization, the Ca2+ channels may participate in spike depolarization by increasing the membrane conductance.
Fig. 7.

Ca2+ entries during spikes. Waveforms obtained by averaging spikes generated in scrambled ON-treated cells were used to depolarize scrambled (A) and antisense (B) ON-treated neurons. Top traces show the voltage template and bottom traces show the Ca2+current at −60 and −80 mV resting potentials, respectively.Insets illustrate the presence of T-type currents in the scrambled ON-transfected neuron and its absence in the antisense ON-treated neuron. Note in this latter case the absence of late Ca2+ current during spike. In contrast, a late Ca2+ component is observed inA.
Fig. 8.

Mean Ca2+ current and tail currents during an action potential. In A, averaged Ca2+ currents were recorded by depolarizing scrambled (thin trace, n = 6) and antisense (thick trace, n = 7) ON-transfected neurons from −80 mV holding potential using a spike template (top trace). Note the late Ca2+ entry present in scrambled ON-treated neurons. Student’s t test was performed on values obtained at time indicated by the star. The difference is significant with p < 0.005. Billustrates traces obtained when depolarizing either an antisense ON (bottom traces) or scrambled ON (middle traces)-transfected neurons with successive spike templates repolarized to −80 mV at an increasing time interval (top traces). Note in both cells the similar pattern of tail current amplitudes at the beginning of the spike, with clear differences only in the late component of the action potential. However, a slow component in the tail kinetics, attributable to the slow deactivation of T-type channels, can be seen in scrambled ON-treated cells. Note also that Ca2+ channels are opened very early during the spike (depolarizing phase), although a Ca2+entry occurred mainly during the repolarizing phase.
In conclusion, specific knock-out of T-type channels with antisense ON emphasizes the major role of this LVA current in both shaping the action-potential waveform and determining the amount of Ca2+ flowing into sensory neurons during a spike.
DISCUSSION
Properties of the recently cloned pore forming α1G [or CavT.1 (Perez-Reyes et al., 1998a)] and α1H [or CavT.2 (Cribbs et al., 1998)] subunits make these proteins good candidates for the T-type channels in primary sensory neurons. We presently show that a generic antisense ON sequence designed against a motif of the DIIISVI segment common to all the CavT channels family actually abolishes T-type current in this cell type. A more precise identification of the α1 subunit responsible for the LVA Ca2+ current in sensory neurons will be possible when specific antibodies become available. However, a partial answer to this question was obtained by carrying out in situhybridization.
The fact that the hybridization signal corresponding to α1H was seen at a much higher intensity relative to that of α1G and α1I prompts the interpretation that this transcript may be present in greater abundance than the other two species of mRNA. It is important to point out, however, that in situ hybridization is only semi-quantitative, and factors other than expression levels (such as hybridization efficiency of the individual probes) can influence signal intensity. Nevertheless, for each transcript, multiple probes (of identical length and similar GC content) individually generated signal intensities that were consistent across all of the brain regions examined (our unpublished observations). This consistency between probes recognizing the same transcript suggests that the influence of factors such as differences in hybridization efficiency are minor and that variations in signal intensity primarily reflect mRNA accumulation. Therefore, given that the hybridization signal for α1H is far more intense than the signal for α1G or for α1I, it is likely that α1H indeed represents the most prevalent transcript in nodosus neurons.
Reciprocally, when considering data obtained by functional expression of α1G and α1H subunits in Xenopus oocytes (Perez-Reyes et al., 1998a) and HEK293 cells (Cribbs et al., 1998), respectively, it is clear that the biophysical properties of the resulting currents are close to that of the T-type current in sensory neurons (voltage dependence, current kinetics, conductance). In addition, both α1G and α1H subunits have no AID motif for β subunit binding (Pragnell et al., 1994; Perez-Reyes et al., 1998a), and in contrast to other Ca2+ channel α1 subunits (HVA subunits), a high expression of α1 subunit proteins is obtained in absence of any auxiliary subunit. This is in agreement with our previous observation that T-type channels in nodosus ganglion neurons are not affected by β subunit depletion [Lambert et al. (1997), but see Lacerda et al. (1994)]. However, to complete the full comparison between α1G/H subunits and LVA Ca2+ channels in sensory neurons, other criteria such as the blocking effect of divalent ions (Carbone and Lux, 1987; Fox et al., 1987a) and the sensitivity to amiloride (Tang et al., 1988) have to be examined.
In the final part of our work we have exploited the selective knock-out of T-currents to examine their contribution to the shaping of the spike waveform and the control of Ca2+ entry during action potentials. Previously, taking advantage of the relatively specific effect of amiloride on T-type currents in dorsal root ganglion neurons,McCobb and Beam (1991) and Scroggs and Fox (1992) examined the contribution of LVA and HVA channels to Ca2+ influx during a spike. Indeed, the direct knock-out of T-type channels in the cells used in the present study yields similar estimates. In the presence of 2 mm extracellular Ca2+ and when the holding potential is fixed to −80 mV to maximally recruit T-type channels, LVA current accounts for half of the Ca2+ entry during the time of a spike, with HVA currents accounting for the other half. In addition, we also examined the timing of the openings of the various Ca2+channels and the influence of the T-type current on the shaping of the action-potential waveform. The amplitude of the tail currents obtained after stepping back to −80 mV at various times along the spike waveform yields an estimate of the number of channels that are opened. Interestingly, in all cases (antisense and scrambled ON-treated cells), the largest conductance changes occur during the peak of the spike, which suggests that not only Na+ but also Ca2+ channels contribute to the peak depolarization. However, in terms of Ca2+ influx, the maximal contribution of Ca2+ channels occurs during the repolarizing phase of the action potential as a consequence of the increased driving force. During repolarization, the shoulder in the action-potential waveform is directly related to Ca2+ inward currents. Because half of the current can be of T-type origin in the present conditions (close to the physiological conditions for Ca2+ currents), it is clear that T-type channels contribute to spike prolongation when they are activatable. In addition, in cells expressing LVA channels, a pure T-type current component prolongs the spike after membrane has repolarized below −60 mV and further contributes to the Ca2+ entry over the following 10 msec. The Ca2+-induced permeabilities specific to this cell type therefore will affect the afterpotential properties and influence the cell excitability.
In a previous work (Lambert et al., 1997), we have shown that in nodosus ganglion cells, large T-type current densities are confined to a subset of large-diameter neurons. This suggests that LVA channels are likely to have an important role in carrying signals through the ganglion cells that give rise to the Aδ/Aβ fibers. Our understanding of temperature or arterial pressure perception and of the origin of pain (for review, see Scott, 1992) will rely partly on the identification of the parameters that modulate the contribution of T-type channels in spike generation.
Footnotes
This work was supported by grants from the National Institute of Heart, Lung and Blood, HL 57828 (E.P.-R.), National Institutes of Health, NS 33583 (D.A.B.), and the American Heart Association, 96010950 (D.A.B.). F.M. has an Eli Lilly postdoctoral fellowship.
Correspondence should be addressed to Dr. Régis C. Lambert, Laboratoire de Neurobiologie Cellulaire, UPR 9009-Centre National de la Recherche Scientifique, 5 rue B. Pascal, F-67084, Strasbourg, France.
REFERENCES
- 1.Armstrong CM, Matteson DR. Two distinct populations of calcium channels in a clonal line of pituitary cells. Science. 1985;227:65–67. doi: 10.1126/science.2578071. [DOI] [PubMed] [Google Scholar]
- 2.Bernal J, Lee JH, Cribbs LL, Perez-Reyes E. Full reversal of Pb2+ block of L-type Ca2+ channels requires treatment with heavy metal antidotes. J Pharmacol Exp Ther. 1997;282:172–180. [PubMed] [Google Scholar]
- 3.Bossu JL, Feltz A. Inactivation of the low-threshold transient calcium current in rat sensory neurons, evidence for a dual process. J Physiol (Lond) 1986;376:341–357. doi: 10.1113/jphysiol.1986.sp016157. [DOI] [PMC free article] [PubMed] [Google Scholar]
- 4.Bossu JL, Feltz A, Thomann JM. Depolarization elicits two distinct calcium currents in vertebrate sensory neurones. Pflügers Arch. 1985;403:360–368. doi: 10.1007/BF00589247. [DOI] [PubMed] [Google Scholar]
- 5.Carbone E, Lux HD. A low voltage-activated, fully inactivating Ca channel in vertebrate sensory neurones. Nature. 1984a;310:501–502. doi: 10.1038/310501a0. [DOI] [PubMed] [Google Scholar]
- 6.Carbone E, Lux HD. Low voltage-activated calcium conductance in embryonic chick sensory neurons. Biophys J. 1984b;46:413–418. doi: 10.1016/S0006-3495(84)84037-0. [DOI] [PMC free article] [PubMed] [Google Scholar]
- 7.Carbone E, Lux HD. Kinetics and selectivity of a low-voltage-activated calcium current in chick and rat sensory neurones. J Physiol (Lond) 1987;386:547–570. doi: 10.1113/jphysiol.1987.sp016551. [DOI] [PMC free article] [PubMed] [Google Scholar]
- 8.Cribbs LL, Lee JH, Yang J, Satin J, Zhang Y, Daud A, Barclay J, Williamson MP, Fox M, Rees M, Perez-Reyes E 1998 Cloning and characterization of α1H from human heart, a member of the T-type calcium channel gene family. Circ Res, in press. [DOI] [PubMed]
- 9.Fedulova SA, Kostyuk PG, Veselovsky NS. Two types of calcium channels in the somatic membrane of new-born rat dorsal root ganglion neurones. J Physiol (Lond) 1985;359:431–446. doi: 10.1113/jphysiol.1985.sp015594. [DOI] [PMC free article] [PubMed] [Google Scholar]
- 10.Fox AP, Nowycky MC, Tsien RW. Kinetic and pharmacological properties distinguishing three types of calcium currents in chick sensory neurones. J Physiol (Lond) 1987a;394:149–172. doi: 10.1113/jphysiol.1987.sp016864. [DOI] [PMC free article] [PubMed] [Google Scholar]
- 11.Fox AP, Nowycky MC, Tsien RW. Single channel recordings of three types of calcium channels in chick sensory neurones. J Physiol (Lond) 1987b;394:173–200. doi: 10.1113/jphysiol.1987.sp016865. [DOI] [PMC free article] [PubMed] [Google Scholar]
- 12.Huguenard JR. Low-threshold calcium currents in central nervous system neurons. Annu Rev Physiol. 1996;58:329–348. doi: 10.1146/annurev.ph.58.030196.001553. [DOI] [PubMed] [Google Scholar]
- 13.Lacerda AE, Perez-Reyes E, Wei X, Castellano A, Brown AM. T-type and N-type calcium channels of Xenopus oocytes: evidence for specific interactions with β subunits. Biophys J. 1994;66:1833–1843. doi: 10.1016/S0006-3495(94)80977-4. [DOI] [PMC free article] [PubMed] [Google Scholar]
- 14.Lambert RC, Maulet Y, Dupont JL, Mykita S, Craig P, Volsen S, Feltz A. Polyethylenimine-mediated DNA transfection of peripheral and central neurons in primary culture: probing Ca2+ channel structure and function with antisense oligonucleotides. Mol Cell Neurosci. 1996;7:239–246. doi: 10.1006/mcne.1996.0018. [DOI] [PubMed] [Google Scholar]
- 15.Lambert RC, Maulet Y, Mouton J, Beattie R, Volsen S, De Waard M, Feltz A. T-type Ca2+ current properties are not modified by Ca2+ channel β subunit depletion in nodosus ganglion neurons. J Neurosci. 1997;17:6621–6628. doi: 10.1523/JNEUROSCI.17-17-06621.1997. [DOI] [PMC free article] [PubMed] [Google Scholar]
- 16.Liman ER, Tytgat J, Hess P. Subunit stoichiometry of a mammalian K+ channel determined by construction of multimeric cDNAs. Neuron. 1992;9:861–871. doi: 10.1016/0896-6273(92)90239-a. [DOI] [PubMed] [Google Scholar]
- 17.Matteson DR, Armstrong CM. Properties of two types of calcium channels in clonal pituitary cells. J Gen Physiol. 1986;87:161–182. doi: 10.1085/jgp.87.1.161. [DOI] [PMC free article] [PubMed] [Google Scholar]
- 18.McCobb DP, Beam KG. Action potential waveform voltage-clamp commands reveal striking differences in calcium entry via low and high voltage-activated calcium channels. Neuron. 1991;7:119–127. doi: 10.1016/0896-6273(91)90080-j. [DOI] [PubMed] [Google Scholar]
- 19.Meir A, Dolphin AC. Known calcium channel α1 subunits can form low-threshold small conductance channels with similarities to native T-type channels. Neuron. 1998;20:341–351. doi: 10.1016/s0896-6273(00)80461-4. [DOI] [PubMed] [Google Scholar]
- 20.Nowycky MB, Fox AP, Tsien RW. Three types of neuronal calcium channel with different calcium agonist sensitivity. Nature. 1985;316:440–446. doi: 10.1038/316440a0. [DOI] [PubMed] [Google Scholar]
- 21.Perez-Reyes E, Cribbs LL, Daud A, Lacerda AE, Barclay J, Williamson MP, Fox M, Rees M, Lee JH. Molecular characterization of a neuronal low-voltage-activated T-type calcium channel. Nature. 1998a;391:896–900. doi: 10.1038/36110. [DOI] [PubMed] [Google Scholar]
- 22.Perez-Reyes E, Cribbs LL, Daud A, Yang J, Lacerda AE, Barclay J, Williamson MP, Fox M, Rees M, Lee JH. Molecular characterization of T-type calcium channels. In: Nargeot J, Clozel J-P, Tsien RW, editors. T-type calcium channels. Adis Press; Chester, UK: 1998b. pp. 290–305. [DOI] [PubMed] [Google Scholar]
- 23.Pragnell M, De Waard M, Mori Y, Tanabe T, Snutch TP, Campbell KP. Calcium channel β-subunit binds to a conserved motif in the I-II cytoplasmic linker of the α1-subunit. Nature. 1994;368:67–70. doi: 10.1038/368067a0. [DOI] [PubMed] [Google Scholar]
- 24.Schneider T, Wei X, Olcese R, Costantin JL, Neely A, Palade P, Perez-Reyes E, Qin N, Zhou J, Crawford GD, Smith RG, Appel SH, Stefani E, Birnbaumer L. Molecular analysis and functional expression of the human type E neuronal Ca2+ channel α1 subunit. Receptors Channels. 1994;2:255–270. [PubMed] [Google Scholar]
- 25.Schneider T, Perez-Reyes E, Nyormoi O, Wei X, Crawford GD, Smith RG, Appel SH, Birnbaumer L. Alpha-1 subunits of voltage gated Ca2+ channels in the mesencephalon x neuroblastoma hybrid cell line MES23.5. Neuroscience. 1995;68:479–485. doi: 10.1016/0306-4522(95)00147-b. [DOI] [PubMed] [Google Scholar]
- 26.Scott SA. Sensory neurons: diversity, development, and plasticity. Oxford UP; New York: 1992. [Google Scholar]
- 27.Scroggs RS, Fox AP. Multiple Ca2+ currents elicited by action potential waveforms in acutely isolated adult rat dorsal root ganglion neurons. J Neurosci. 1992;12:1789–1801. doi: 10.1523/JNEUROSCI.12-05-01789.1992. [DOI] [PMC free article] [PubMed] [Google Scholar]
- 28.Snutch TP, Leonard JP, Gilbert MM, Lester HA, Davidson N. Rat brain expresses a heterogenous family of calcium channels. Proc Natl Acad Sci USA. 1990;87:3391–3395. doi: 10.1073/pnas.87.9.3391. [DOI] [PMC free article] [PubMed] [Google Scholar]
- 29.Soong TW, Stea A, Hodson CD, Dubel SJ, Vincent SR, Snutch TP. Structure and functional expression of a member of the low voltage-activated calcium channel family. Science. 1993;260:1133–1135. doi: 10.1126/science.8388125. [DOI] [PubMed] [Google Scholar]
- 30.Talley EM, Sadr NN, Bayliss DA. Postnatal development of serotonergic innervation, 5-HT1A receptor expression, and 5-HT responses in rat motoneurons. J Neurosci. 1997;17:4473–4485. doi: 10.1523/JNEUROSCI.17-11-04473.1997. [DOI] [PMC free article] [PubMed] [Google Scholar]
- 31.Tang C-M, Presser F, Morad M. Amiloride selectively blocks the low threshold (T) calcium channel. Science. 1988;240:213–215. doi: 10.1126/science.2451291. [DOI] [PubMed] [Google Scholar]