Abstract
Optical methods were used to study the Ca2+dependence of vesicle cycling in bipolar cells isolated from goldfish retinas. Uniformly raising the Ca2+ concentration to between 0.8 and 20 μm produced a continuous vesicle cycle of balanced exocytosis and endocytosis with a maximum rate equivalent to the turnover of the entire surface membrane of a terminal every 2 min (or ∼900 vesicles sec−1). Increasing the Ca2+ concentration above 20 μminhibited continuous vesicle cycling. In contrast, influx of Ca2+ through voltage-gated channels produced a transient burst of exocytosis that increased the surface area of a terminal by a maximum of 12% (equivalent to the addition of 13,000 vesicles). Endocytosis was delayed until after Ca2+influx stopped and the average Ca2+ concentration in the terminal declined. Hence, a single terminal has mechanisms for both continuous and transient vesicle cycling.
Keywords: exocytosis, endocytosis, vesicle cycling, synaptic vesicle, bipolar cell, retina
Ca2+ influx has long been known to be an effective trigger for regulated exocytosis (Katz and Miledi, 1967). The coupling between Ca2+and fusion has been studied extensively in neuroendocrine cells. Most studies have demonstrated that Ca2+ concentrations above a few micromolar are sufficient to trigger exocytosis (see, for example, Jankowski et al., 1992). Less is known about vesicle cycling in presynaptic nerve endings, which are usually small and consequently have been experimentally inaccessible. Only recently have the Ca2+ dependence and kinetics of vesicle cycling been studied in large synaptic terminals containing ribbon synapses. A change in membrane capacitance has been used to monitor vesicle fusion in retinal bipolar and photoreceptor cells. Surprisingly, two different views have emerged. Goldfish bipolar cells (Heidelberger et al., 1994;von Gersdorff and Matthews, 1994a) transiently released vesicles when the Ca2+ concentration exceeded 20 μm. In contrast, salamander rod photoreceptors (Rieke and Schwartz, 1996) sustained a continuous vesicle cycle when the Ca2+concentration rose above 1 μm. A similar conclusion was reached after staining goldfish bipolar cells with a fluorescent dye and following the fate of tagged vesicles (Lagnado et al., 1996) (however, see the ). Thus, the experiments paint pictures of synaptic vesicle cycling that differ in two important respects. First, the Ca2+ concentrations required for release differ >20-fold. Second, the entire process of release and vesicle resupply is either transient or continuous.
We have now reconciled these divergent views. Vesicle cycling was observed after bipolar cell membranes were stained with FM1–43 or FM4–64. Relatively low Ca2+ concentrations (0.8–20 μm) stimulated exocytosis and sustained a continuous vesicle cycle with maximal rates sufficient to replace the entire surface of a terminal every 2 min. Higher concentrations (>20 μm) inhibited continuous cycling. Large increases in the local concentration near voltage-gated channels produced a transient burst of exocytosis. A rapid wave of compensatory endocytosis was initiated after Ca2+ influx stopped and the average Ca2+ concentration declined.
MATERIALS AND METHODS
Cell isolation. Goldfish (Carassius auratus) were killed by severing the cervical spinal cord and pithing the brain, following guidelines of the University of Chicago Institutional Animal Care and Use Committee. The procedure for dissociating a retina and maintaining solitary cells was similar to that described by Bader et al. (1982). Solitary bipolar cells were identified by their characteristic morphology (Fig.1).
Fig. 1.
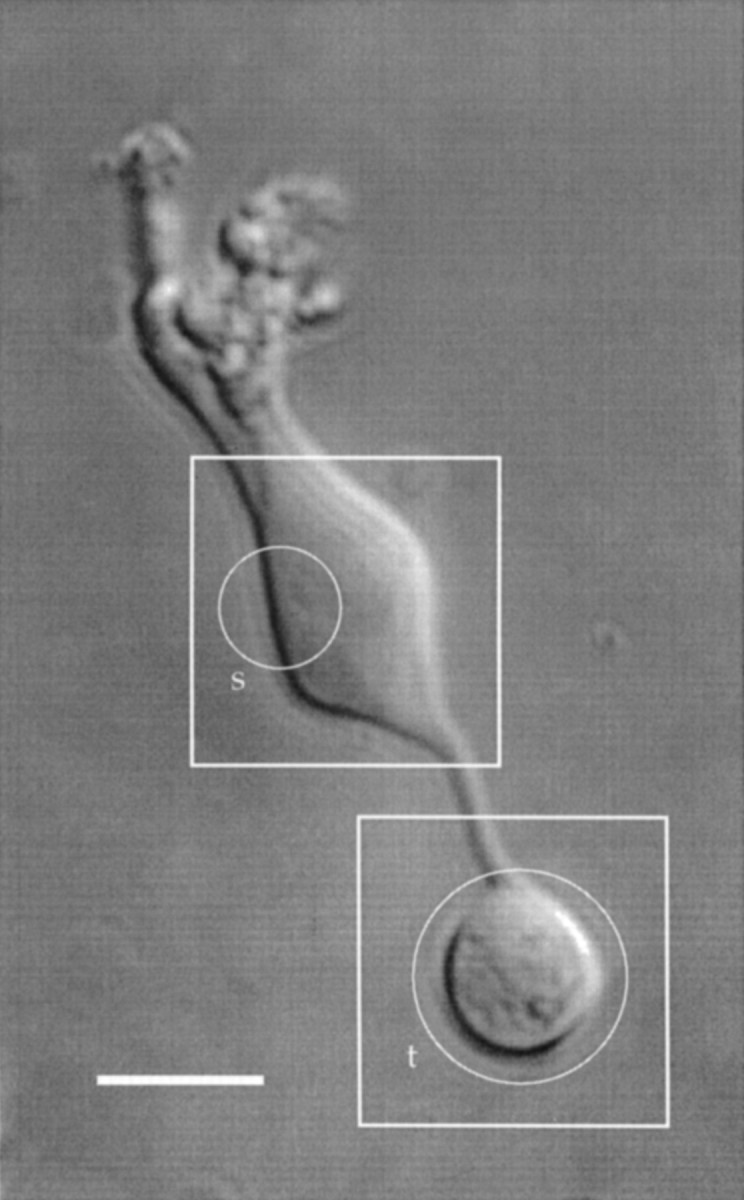
Hoffman modulation micrograph of a solitary bipolar cell. The squares indicate regions of interest that were saved during an experiment. The circlesindicate areas in which the total fluorescence was measured (see text). Scale bar, 10 μm.
In our initial experiments, dissociated cells were plated into dishes whose bottom was a glass coverslip. A styryl dye stained cells and adsorbed to the glass coverslip. Unbinding of the dye from the coverslip was very slow. Quantitative measurement of vesicle cycling was difficult when images were contaminated by a large background signal. Fortunately, unbinding of the dye was much faster when cells were plated onto a coverslip that had been coated with a thin layer of silicone plastic (Sylgard 184; Dow Corning, Midland, MI). Cells adhered to the silicone plastic if it was first covered with 0.25 mg ml−1 concanavalin A in 1 m NaCl for 20 min, rinsed with distilled water, and air dried.
The extracellular saline contained (in mm): NaCl, 120; KCl, 2.5; CaCl2, 0.2; MgCl2, 1; Na-pyruvate, 2; Na-lactate, 2; glucose, 10; and HEPES, 10; the pH was adjusted to 7.4 with NaOH, and the saline was supplemented with vitamins (1:100) and amino acids (1:100) formulated for Eagle’s minimum essential medium (Life Technologies, Gaithersburg, MD). The osmolality was ∼260 mOsm kg−1. Cells were loaded with fura-2 by incubating in normal extracellular saline supplemented with 2 μm fura-2 AM plus 16 μm pluronic acid for 1 hr. For some experiments (see Fig.4), cells were loaded with mag-fura-5 and fluo-3 by incubating in 1 μm mag-fura-5 AM, 1 μm fluo-3 AM, plus 16 μm pluronic acid for 1 hr. Experiments were performed at 20–23°C.
Fig. 4.
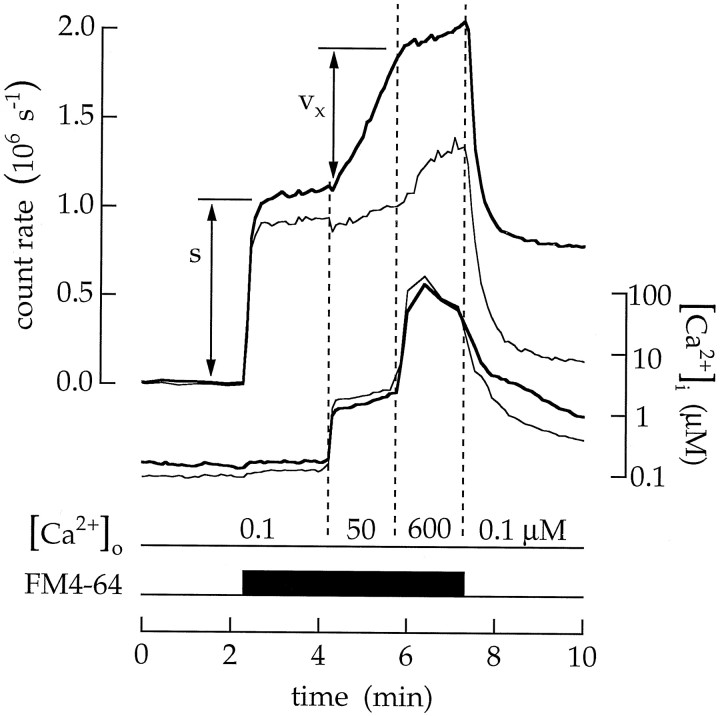
Continuous exocytosis is stimulated by a low Ca2+ concentration and inhibited by a high Ca2+ concentration. Cells were continuously superfused with salines containing 10 μm ionomycin. The fluorescence intensity produced by 20 μm FM4–64 is plotted by the upper set of traces; the intracellular Ca2+ concentration is plotted by thelower set of traces. Thick traces in this and the following figures were measured in the terminal; thin traces were measured in the soma. Continuous exocytosis was measured as Cx = ρvx/s Δt. Salines containing 100 nm, 50 μm, and 600 μm extracellular Ca2+ were applied as indicated by the dashed vertical lines. Ca2+ concentrations below 10 μm were reported by fluo-3; concentrations above 10 μm were reported by mag-fura-5. Increasing the intracellular Ca2+ from 0.09 to 1.7 μm increasedCx to 0.33 MEq min−1. A further rise in the intracellular Ca2+ to between 50 and 140 μm reduced Cx to 0.06 MEq min−1.
Optical system and image analysis. Light from a 75 W Xe short arc lamp was used to excite dye fluorescence. Excitation wavelength was selected with a filter changer (Lambda 10–2; Sutter Instruments, Novato, CA) containing narrow-band (15 nm) interference filters with transmission maxima at 331, 380, and 485 nm. The filtered light was reflected into a microscope with a 510 nm dichroic mirror and was imaged by an objective (Fluar 40x/1.3; Carl Zeiss) to a 150-μm-diameter spot centered in the field of view. The maximum intensity within this spot was 1.4 W m−2 at 331 nm, 5.6 W m−2 at 380 nm, and 180 W m−2 at 485 nm. Fluorescent light collected by the objective passed through a second filter changer containing a 520–580 nm bandpass filter or an RG630 Schott glass long-pass filter before being imaged onto a CCD camera (model AT200; Photometrics, Tucson, AZ). Each pixel imaged a 0.16 μm × 0.16 μm region in the plane of focus. The operation of shutters and filter wheels was controlled by a computer. Because of overlap in both their excitation and emission spectra, fluo-3 and FM1–43 were not used together in the same experiment. Control experiments demonstrated that the combinations of wavelengths, light intensities, and dye concentrations actually used in the experiments allowed the interleaved measurement of Ca2+ concentration and either FM1–43 or FM4–64 fluorescence without crossover between the signals. In some experiments we used both FM1–43 and FM4–64. In these experiments, we corrected for the crossover of light emitted by FM1–43 in the FM4–64 detection band (see Fig. 3).
Fig. 3.
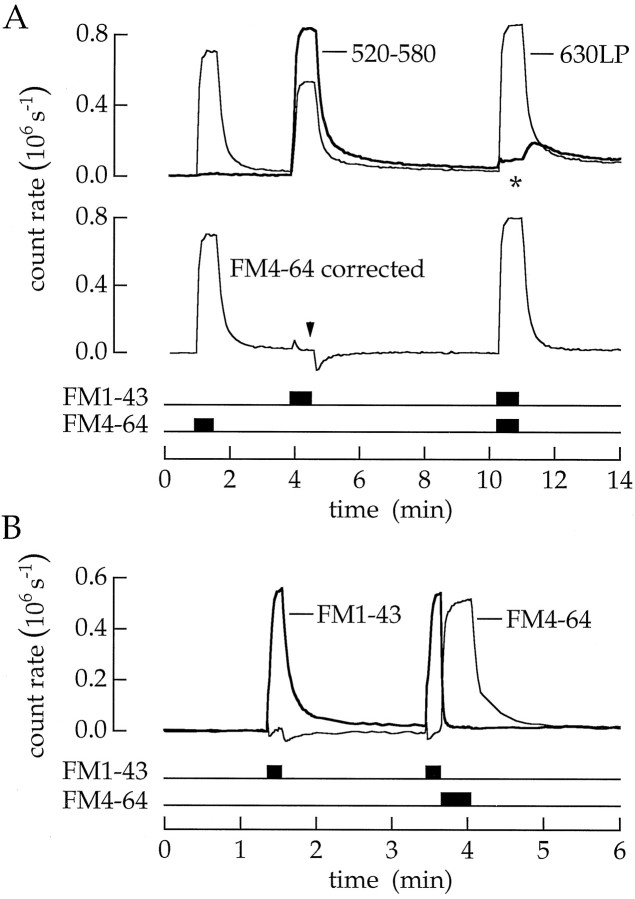
FM4–64 quenched FM1–43 fluorescence. Bipolar cells were superfused with 20 μm FM1–43, 20 μm FM4–64, or both dyes together as indicated (superfusions in this and the following figures indicated byhorizontal bars). A, Theupper pair of superimposed traces is the fluorescence measured in the two detection channels. The thick trace is the fluorescence detected between 520 and 580 nm; thethin trace is the fluorescence detected with a 630 nm long-pass filter. When the two dyes are given together, the fluorescence of FM1–43 (asterisk) was less than that when FM1–43 was delivered alone. FM4–64 fluorescence, estimated by subtracting the crossover of FM1–43 fluorescence into the 630 nm channel, is plotted in the lower trace. The small glitches in the corrected trace (arrowhead) are produced because two spectral components of FM1–43 fluorescence leave the membrane at different rates. The time constants for FM1–43 destaining are 6.7 sec (thick trace) and 3.5 sec (thin trace). B, FM4–64 can be used to improve the resolution of membrane destaining. The thick trace is the intensity for emission between 520 and 580 nm. When FM1–43 was delivered alone, the time constant of membrane destaining was 6.7 sec. When FM1–43 was followed by a pulse of FM4–64, fluorescence of FM1–43 in the surface membrane disappeared in <1.4 sec.
At the beginning of each experiment, a Hoffman interference image of the entire cell was recorded (Fig. 1), and two regions of interest ∼20 μm square were selected (Fig. 1, outlined bysquares). One region included the synaptic terminal; the other region included a portion of the soma. Fluorescent images of the two regions produced by 100 msec exposures were collected for the required filter combinations and saved for later analysis.
Normally, several movies were made after an experiment was completed. For example, the measurement of Ca2+ concentration and FM1–43 fluorescence required six movies. One movie (produced by 485 nm exciting light) imaged FM1–43 fluorescence in the terminal. Second (produced by 331 nm light) and third (produced by 380 nm light) movies imaged fura-2 fluorescence in the terminal and were used to calculate the average, cytoplasmic Ca2+concentration. A similar set of three movies imaged FM1–43 and fura-2 fluorescence in the soma. The ability to identify potential problems was greatly facilitated by recording a movie of fluorescent images instead of integrating all of the light in a microscope field with a photomultiplier tube. Preliminary experiments demonstrated that bright 331 and 380 nm lights adversely affected the morphology of stained cells. Consequently, light intensity and repetition rate for fura-2 and mag-fura-5 measurements were minimized. We rejected the rare experiments in which a cell significantly changed shape.
The total fluorescence in the terminal was measured by summing the intensities in pixels within a circular area slightly larger than the terminal (Fig. 1, circle designated t). The fluorescence in the soma was measured by summing the intensities of pixels within a circular subregion ∼8 μm in diameter over a portion of the soma (Fig. 1, circle designated s). Background fluorescence of FM1–43 and FM4–64, measured in a region ∼5 μm distant from a cell, was subtracted from each pixel. For the calcium indicator dyes, background fluorescence measured away from the cell was negligible.
We assumed that the fluorescence of dye molecules was unchanged during endocytosis. Results (see Figs. 5, 10) indicate that vesicles quickly diffused throughout a terminal. Because vesicles appeared to be uniformly distributed, we were able to use the fluorescence in an optical section to calculate the total amount of endocytosed membrane distributed throughout a terminal. A microscope objective collects light from an image depth of 4λ/(NA)2, where λ is the wavelength of light and NA is the numerical aperture of the objective. Hence the thickness of an optical section was 1.4–1.6 μm for experiments that imaged FM1–43 or FM4–64. Because these values are much less than the 10 μm diameter of a terminal, the geometry can be described as a plane intersecting a sphere. If κp is the ratio of the area of a circular disk to the length of its perimeter and κs is the ratio of the volume of a sphere to its surface area, then we can measure κp and estimate κs after multiplying by a geometrical correction factor, ρ = κs/κp = 2/3. Because bipolar cell somata are not spherical, a similar procedure is not appropriate. Instead, results from somata are in arbitrary units and have been scaled to facilitate a qualitative comparison.
Fig. 5.
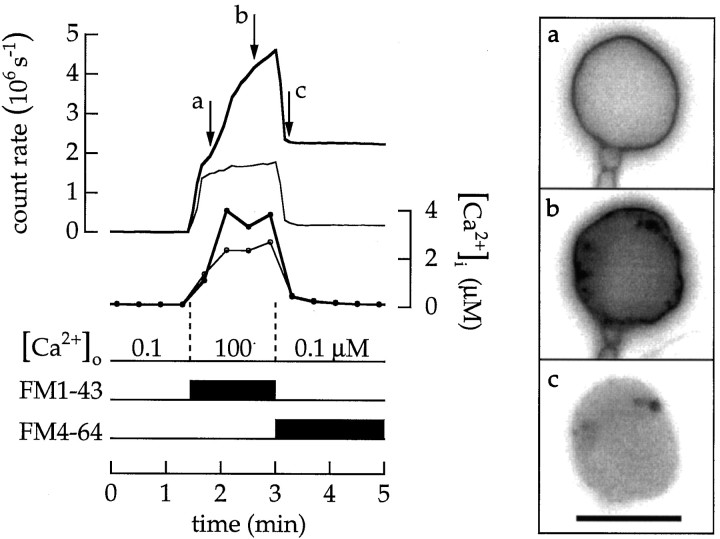
Endocytosed vesicles quickly diffuse throughout the terminal. Cells were superfused with 10 μm ionomycin and Ca2+ buffers. a–c, Images recorded at the times marked by the arrows are at theright. Intracellular Ca2+concentration in this and the following figures was reported by fura-2 fluorescence. The cell was superfused first with 100 nmCa2+, then with 20 μm FM1–43 in a saline containing 100 μm Ca2+, and finally with 20 μm FM4–64 in a saline containing 100 nm Ca2+. Scale bar, 10 μm.
Fig. 10.
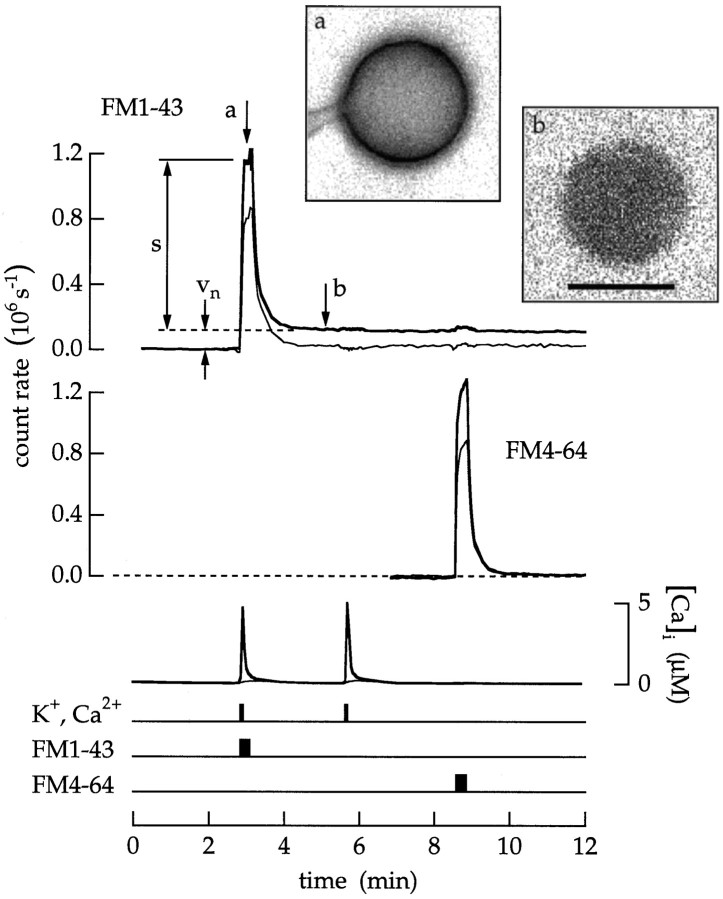
Endocytosis was induced by depolarization and Ca2+ influx. A bipolar cell was superfused with an extracellular saline containing 100 nmCa2+. Timing traces indicate an 18 sec application of 20 μm FM1–43, an 18 sec application of 20 μm FM4–64, and 6 sec applications of a high Ca2+ and K+ saline.s is the fluorescence intensity of the surface membrane.vn is the fluorescence of endocytosed vesicles that remain trapped in the cytoplasm. Transient endocytosis was measured as Tn = ρvn/s. After superfusion with the high Ca2+ and K+ saline,Tn was 0.08 MEq. Insets, Images of the terminal taken at the times marked a andb are shown. The gain in b is eight times the gain in a. Scale bar, 10 μm.
Calcium measurement. The fluorescence of fura-2 or mag-fura-5 was excited by light of 331 and 380 nm. Emission was detected between 520 and 580 nm. Intracellular Ca2+concentration was calculated from the relation (Grynkiewicz et al., 1985): [Ca2+] = kβ (R− Rmin)/(Rmax −R), where R is the ratio of the fluorescence intensity excited at 331 nm divided by the intensity excited at 380 nm,Rmax is the ratio produced by a saturating Ca2+ concentration, Rmin is the ratio produced by a minimum concentration, β is the ratio of emission intensity stimulated at 380 nm in the absence of Ca2+ to that in the presence of an excess of Ca2+, and k is an apparent affinity constant. Affinity constants were determined by superfusing 20 cells with either 10 μm ionomycin or 10 μmA23187 and a series of Ca2+ concentrations set with Ca2+ buffers (see below). Each concentration was superfused until a steady state was achieved. The affinity constant was 237 nm for fura-2 and 10 μm for mag-fura-5. Rmin,Rmax, and β were measured for each cell. Rmin was estimated at the beginning of each experiment while a cell was superfused with a low Ca2+ concentration; Rmax and β were measured by superfusing at the end of each experiment with saline containing 10 μm ionomycin, 4 mmCa2+, 40 mm K+, and 1 μm BayK8466.
The 485 nm light excited fluo-3. Emission was detected between 520 and 580 nm. The Ca2+ concentration was calculated from the relation (Grynkiewicz et al., 1985): [Ca2+] =k(F −Fmin)/(Fmax −F), where F is the fluorescence intensity,Fmin is produced by a minimum Ca2+ concentration, Fmax is produced by a saturating Ca2+ concentration, andk is the apparent affinity constant. Minimum and maximum fluorescence were measured as described above for the ratiometric dyes. The affinity constant for fluo-3, also measured as described above, was 0.9 μm (see also Rieke and Schwartz, 1996).
Solutions and control of Ca2+concentration. During an experiment, a cell was continuously superfused with solutions ejected from a four-barrelled pipette. Each barrel ended in a ∼50 μm square opening. Each barrel was connected to a reservoir and pressure head through a solenoid valve. Solution changes were made by simultaneously opening and closing valves. Control experiments with fluorescent dyes demonstrated that solution changes were 95% complete in <100 msec. When an experiment required five different solutions, an additional single-barrelled pipette was used.
The superfused solutions were similar to the extracellular saline described above. Ca2+ concentrations were set with Ca2+ buffers; 1 mmbis(2-aminophenoxy)ethane-N,N,N′,N′-tetra-acetic acid (BAPTA) was used for free Ca2+ concentrations between 0.1 and 2 μm, and 1 mmN-(2-acetamido)-2-iminodiacetic acid (ADA) was used for concentrations between 10 and 200 μm. Concentrations above 200 μm were unbuffered. Salines containing ionomycin and ADA lacked Mg2+. A high Ca2+ and K+ saline contained (in mm): NaCl, 82.5; KCl, 40; CaCl2, 4; and MgCl2, 1; pyruvate, lactate, glucose, and HEPES levels were as in the normal saline. Experiments were conducted on only one cell in a dish.
The concentration of BAPTA or ADA in stock solutions used to make Ca2+ buffers was determined by titrating with 1.0N CaCl2 (BDH Laboratory Supplies) and measuring the free Ca2+ concentration with a Ca2+electrode. After the concentration of each stock solution was known, salines with a specific free Ca2+ concentration were made according to recipes calculated with the computer program MAXC v1.70 (Bers et al., 1994).
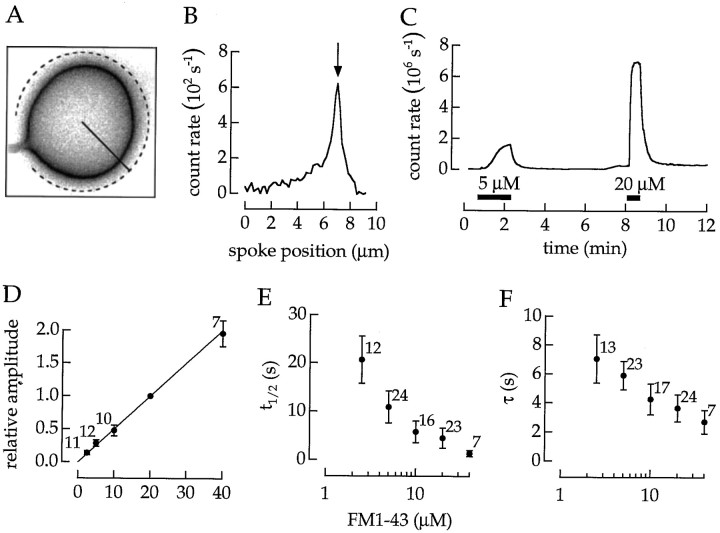
Kinetics of membrane staining. The kinetics of membrane staining depended on the dye concentration. Our procedure for measuring the kinetics is explained in Figure 2. An image of a stained terminal is shown in Figure 2A. The intensity of pixels along the radial solid line is plotted in Figure 2B. The maximum intensity occurs at the surface membrane (Fig. 2B, arrow). To increase the accuracy with which the intensity of membrane fluorescence is measured, we rotated the inclination of the radial line and integrated the membrane signal around the terminal circumference excluding the segment containing the axon (as indicated by thedotted line in Fig. 2A). The intensity of membrane fluorescence was measured in a sequence of images and plotted as a function of time (Fig. 2C). The cell was exposed to two concentrations of FM1–43, first 5 and then 20 μm. When the dye was applied, the membrane stained with a nonexponential time course. When the dye was removed, the membrane destained with an approximately exponential time course.
Fig. 2.
Kinetics of membrane staining depended on dye concentration. A, Image of a terminal stained with 20 μm FM1–43. B, The intensity of pixels along the solid line in A plotted as a function of radial distance. The arrow indicates the location of the surface membrane. C, The intensity in the surface membrane plotted as a function of time. The cell was superfused with two concentrations of FM1–43 as indicated by thehorizontal bars. The peak intensity along a radial spoke (see B) was integrated around the circumference, except for the region from which the axon arose (as indicated by thedotted line in A). D, Intensity of membrane staining as a function of dye concentration.E, The t1/2 for the onset of staining as a function of dye concentration. F, Apparent exponential time constant for destaining as a function of dye concentration.
The procedure illustrated in Figure 2, A–C, was used to obtain the data in Figure 2, D–F. In each experiment, a cell was exposed to two dye concentrations. To compare experiments, we normalized the steady state fluorescence to the intensity produced by 20 μm FM1–43. The intensity of membrane staining was proportional to dye concentration (Fig. 2D). The time to the half-maximum amplitude t1/2 decreased approximately in inverse proportion to the concentration (Fig.2E). Destaining was approximately described by a single exponential with a time constant that also depended on concentration (Fig. 2F).
A linear relation between dye concentration and fluorescence intensity indicates that the number of dye molecules in the membrane is not limited by a small and fixed number of binding sites. A simple model would describe the movement of dye into the membrane as the partitioning between an aqueous and lipid phase accomplished in a single kinetic step. However, in this case, staining and destaining would have exponential time courses that are independent of concentration. This was not the case. The nonexponential time course for staining and a change in kinetics with dye concentration indicate that dye molecules equilibrate in a series of states.
The time course of membrane staining and destaining will obviously limit the time resolution for measurements of vesicle cycling. A concentration of 20 μm provided a reasonable resolution for membrane staining. However, to observe membrane destaining with a resolution finer than several tens of seconds, we needed an additional technique.
Resonance energy transfer. We have discovered an easy method to increase the time resolution of membrane destaining. FM4–64 rapidly quenched the fluorescence of FM1–43. An example is shown in Figure3A. A bipolar cell was superfused first with FM4–64, next with FM1–43, and finally with both dyes together. The emission intensities in the two detection channels are superimposed in Figure 3A (upper traces). Crossover from FM1–43 into the FM4–64 detection channel (Fig.3A, thin upper trace) was measured, and the corrected trace is plotted below. The essential observation came when the two dyes were applied together. Now, the fluorescence of FM1–43 was strongly quenched (Fig. 3A, asterisk). Dye intensity was reduced 94%. In addition, there was an apparent 14% increase in FM4–64 fluorescence. This behavior suggested the procedure in Figure 3B. First, a cell was superfused with a pulse of FM1–43. When the dye was removed, fluorescence in the FM1–43 channel (Fig. 3B, thick trace) declined with a time constant of 6.7 sec. Next, a pulse of FM1–43 was immediately followed by a pulse of FM4–64. Now, FM1–43 fluorescence was quickly quenched. The fluorescence in the surface membrane disappeared in <1.4 sec.
Sources and abbreviations. Ionomycin, FM1–43, FM4–64, fluo-3 AM, fura-2 AM, and mag-fura-5 AM were obtained from Molecular Probes (Eugene, OR). Papain was purchased from Worthington (Freehold, NJ). All other chemicals were obtained from Sigma (St. Louis, MO)..
RESULTS
FM1–43 is a lipophilic dye that partitions into cell membranes. The dye has little fluorescence in aqueous solution and is much more fluorescent in a membrane environment. Positive charges are believed to prevent dye molecules from flipping between the outer and the inner membrane leaflet. Consequently, extracellular FM1–43 has been used to tag the outer leaflet of the surface membrane and then to visualize the bits that are pulled into the cytoplasm by endocytosis (Betz et al., 1992, 1996). However, as described in the , the ability of dye to cross the cell membrane can complicate its use as a membrane tag. We designed experiments to minimize this problem.
Ca2+ dependence of continuous vesicle cycling
To explore the relation between Ca2+concentration and vesicle cycling, we adopted two strategies to produce a nearly uniform change in intracellular Ca2+concentration. The first procedure relied on a Ca2+ionophore, ionomycin, and the entry of Ca2+ from the extracellular saline. The second procedure relied on a proton ionophore, monensin, and the release of Ca2+ from intracellular, acidic organelles. Both procedures were able to raise the cytoplasmic Ca2+ concentration.
For the first procedure, cells were superfused with ionomycin (10 μm) and a Ca2+ buffer. Changing the free Ca2+ concentration in the extracellular saline was followed by a change in the intracellular concentration. During a typical 1–3 min application, the intracellular concentration reached 3–25% of the extracellular concentration. An example is illustrated in Figure 4. The cell was first superfused with ionomycin and 100 nmCa2+. The addition of FM4–64 (Vida and Emr, 1995) stained the surface membrane and produced a fluorescence change (labeled s). Next, when the extracellular Ca2+ concentration was increased to 50 μm, the intracellular concentration followed with a rise to ∼1.7 μm. At the same time, the fluorescence of FM4–64 increased (labeled vx). We believe that the increase in fluorescence is produced as exocytosis adds vesicle membrane to the surface membrane. The rate of continuous exocytosis Cx was calculated asCx = ρvx/s Δt, where ρ is a geometrical constant (see Materials and Methods) and Δt is the time interval in whichvx was measured.Cx has units of membrane equivalents (abbreviated MEq) per unit time. Raising the intracellular concentration from 0.09 to 1.7 μm increasedCx from 0.01 to 0.33 MEq min−1. At the same time, there was little change in the fluorescence imaged from the soma.
We expected the rate of vesicle cycling to increase with the Ca2+ concentration. Surprisingly, when the experiment was continued by increasing the extracellular Ca2+ concentration to 600 μm, the intracellular concentration rose to between 50 and 140 μm, and the rate of FM4–64 fluorescence change actually declined. In this experiment Cx was reduced from 0.33 to 0.06 MEq min−1. A similar result was observed in 21 experiments.
Images acquired during an experiment provide information about the fate of membrane added to the surface by exocytosis. The following experiment used the ability of FM4–64 to quench the fluorescence of FM1–43 in the surface membrane (see Materials and Methods; Fig. 3). Afterward, we quickly observed the distribution of FM1–43–labeled vesicles in the cytoplasm (Fig. 5). Imagea was recorded 24 sec after the terminal was stained with FM1–43. At this moment the Ca2+ concentration was ∼1 μm. The profile of the terminal is nearly round and smooth. Image b was taken 68 sec later, when the intracellular Ca2+ concentration had increased to 4 μm. Small patches of fluorescence are located immediately beneath the surface membrane, the surface contour itself is slightly irregular with sites of local expansion or dilation, and the interior of the terminal has a uniform weak fluorescence. Finally, imagec was taken 15 sec after the fluorescence in the surface membrane was quenched so that only the fluorescence of FM1–43 in endocytosed vesicles was detected. The fluorescence of FM1–43 was almost uniformly distributed, indicating that endocytosed vesicles quickly diffused throughout the cytoplasm.
The rate of steady endocytosis was estimated by first raising the intracellular Ca2+ concentration and then measuring the amount of FM1–43 accumulated during a 12 sec test pulse (Fig.6). The rate of continuous endocytosisCn was calculated asCn = ρvn/s Δt, wherevn is defined in the figure. For the two measurements in Figure 6, the Ca2+ concentration was 1.3 μm, and Cn was 0.33 and 0.22 MEq min−1.
Fig. 6.
Continuous endocytosis is stimulated by a low Ca2+ concentration. A bipolar cell was continuously superfused with salines containing 10 μm ionomycin. Thetiming bars indicate 12 sec applications of 20 μm FM1–43. The cell was superfused first with a saline containing 100 nm Ca2+ and then with 30 μm Ca2+ as indicated. sis the fluorescence intensity of the surface membrane;vn is the fluorescence that remains trapped in the cytoplasm and is attributed to endocytosis. The rate of continuous endocytosis Cn was measured asCn = ρvn/s Δt. For the two measurements, Cn was 0.33 and 0.22 MEq min−1.
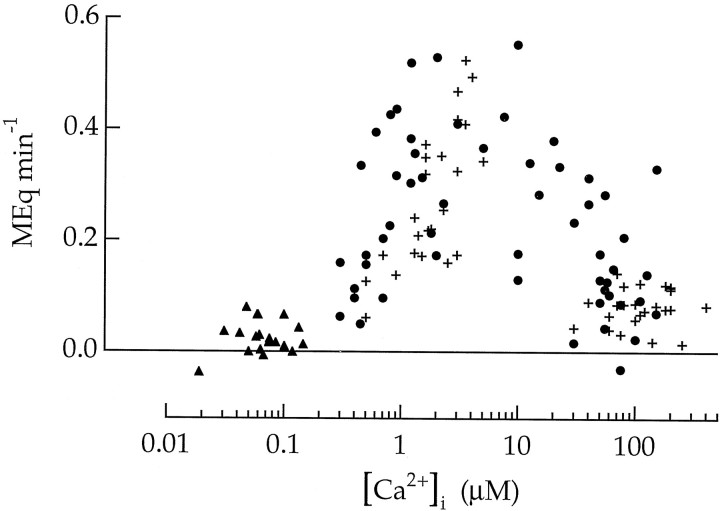
Figures 4 and 6 provide two methods for measuring rates of continuous vesicle cycling. A summary of 102 experiments is presented in Figure7. Crosses were measured by the procedure in Figure 4; closed symbols were measured by the procedure in Figure 6. Vesicle cycling in the terminal was not observed at Ca2+ concentrations below 0.8 μm. A high rate of cycling was sustained at Ca2+ concentrations between 0.8 and 20 μm. Increasing the Ca2+ concentration above 20 μm decreased the rate of cycling. The maximum rate of vesicle cycling in Figure 7 was ∼0.5 MEq min−1. Because the membrane surface area of a terminal (with a diameter of 10 μm) is 110,000 times the surface area of a 30 nm synaptic vesicle, this corresponds to a rate of 900 vesicles sec−1.
Fig. 7.
Rate of continuous vesicle cycling in bipolar cell terminals plotted as a function of the intracellular Ca2+ concentration. Circles are for measurements of endocytosis from 60 cells permeabilized with ionomycin as described in Figure 6. Triangles are for 18 unpermeabilized cells measured during the resting state by the same procedure. Crosses are for measurements of exocytosis from 24 cells measured by the procedure illustrated in Figure 4.
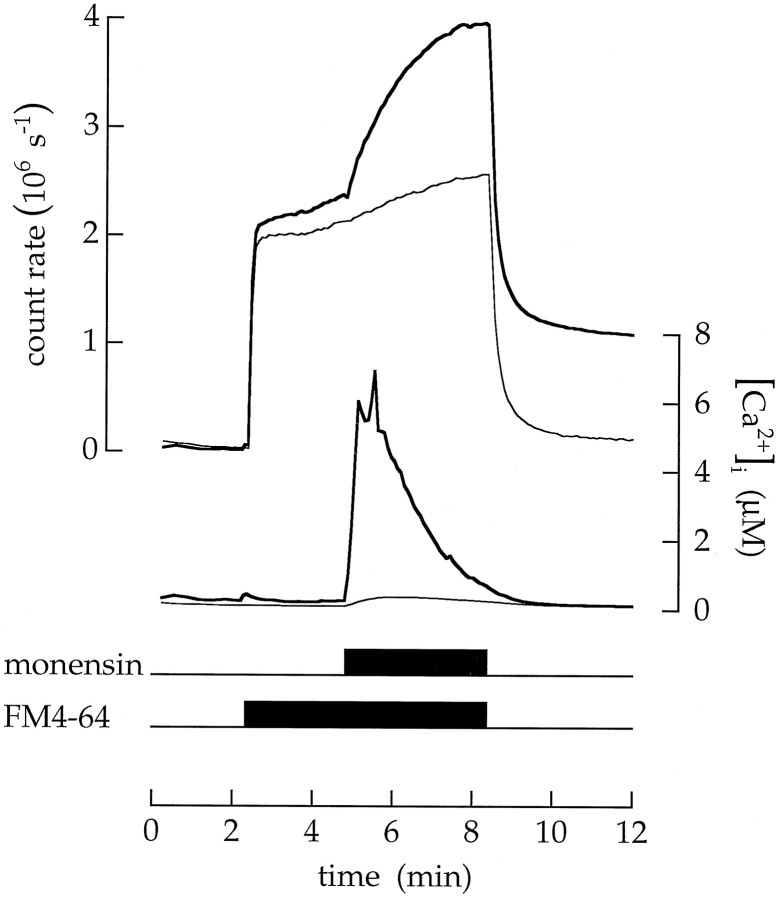
Ionomycin allowed Ca2+ to enter the cytoplasm from the extracellular saline. An alternative procedure was to raise intracellular Ca2+ without a change in extracellular Ca2+ concentration. For this purpose we used monensin, an ionophore that disrupts the pH-dependent accumulation of Ca2+ in intracellular organelles (Fasolato et al., 1991). The subsequent release of Ca2+ raises cytoplasmic Ca2+ concentration. The procedure is illustrated in Figure 8. The cell was continuously superfused with an extracellular saline containing 100 nm Ca2+ (and no ionomycin). When 2 μm monensin was added, the Ca2+concentration in the terminal cytoplasm increased transiently to nearly 6 μm. This increase in Ca2+concentration was not produced by an influx from the extracellular saline (where the Ca2+ concentration was only 100 nm) but was instead produced by the release of Ca2+ from intracellular organelles. The rise in Ca2+ concentration was accompanied by an increase in FM4–64 fluorescence. A similar result was observed in eight experiments.
Fig. 8.
The release of Ca2+ from intracellular organelles raises the cytoplasmic Ca2+concentration and stimulates exocytosis. The cell was continuously superfused with an extracellular saline buffered to contain 100 nm free Ca2+. The lower timing trace indicates the application of 20 μm FM4–64. The upper timing trace indicates the addition of 2 μm monensin.
Both the experiments with ionomycin and monensin demonstrate that a rise in intraterminal Ca2+ concentration to between 0.8 and 20 μm produced a continuous cycle of vesicle exocytosis and endocytosis. The maximum rate was sufficient to turn over the surface membrane of a terminal every 2 min.
Transient vesicle cycling initiated by Ca2+entry through voltage-gated channels
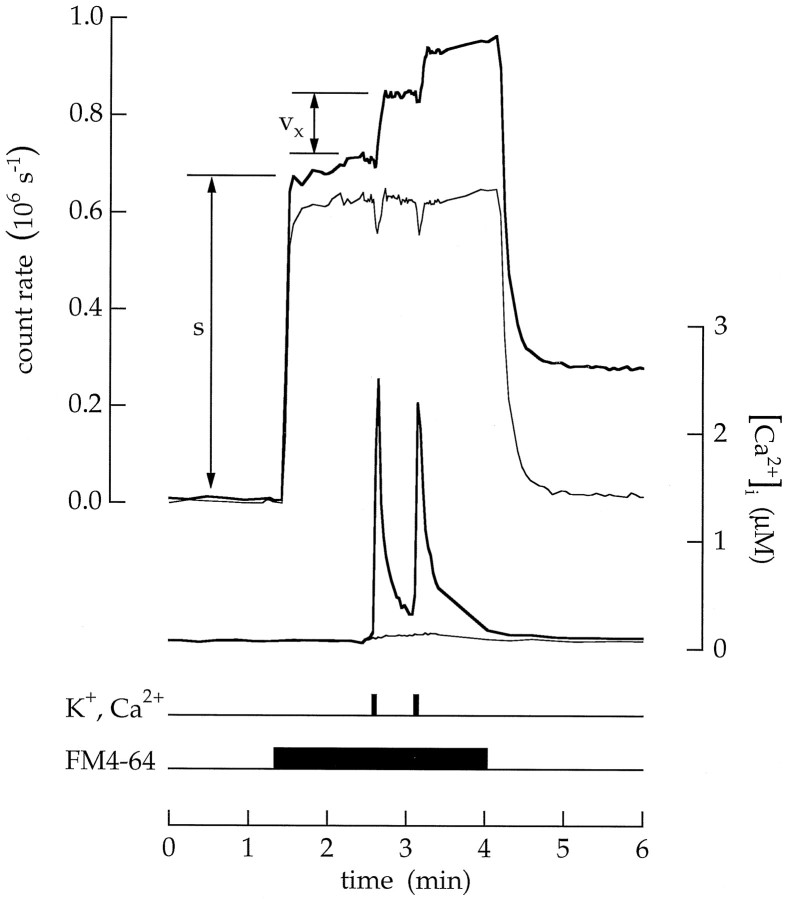
Normally, fusion is triggered when Ca2+ enters through voltage-gated channels. Ca2+ first accumulates at the cytoplasmic end of each open channel and then diffuses into the cytoplasm. The result is many small domains of high Ca2+ concentration that quickly dissolve. The following experiments investigated vesicle cycling triggered by depolarization and Ca2+ influx. In each experiment, cells were initially superfused with a saline containing 100 nm Ca2+ (to minimize premature Ca2+ entry during a control period). Exocytosis was triggered by superfusion with a saline containing 4 mmCa2+ and 40 mmK+.
Exocytosis induced by depolarization and Ca2+ influx is illustrated in Figure 9. First, FM4–64 stained the surface membrane (labeled s). Next, a 4 sec exposure to the high Ca2+ and K+ saline depolarized, increased the average Ca2+ concentration in the terminal, and produced a step increase in FM4–64 fluorescence (labeledvx). We assume that the abrupt increase in the fluorescence of the terminal was proportional to the membrane added to the surface by exocytosis. The amount of exocytosisTx was calculated asTx = ρvx/s. In Figure 9,Tx was 0.13 and 0.08 MEq. In contrast, depolarization did not increase fluorescence in the soma (Fig. 9,thin trace). In 25 experimentsTx varied from being barely detectable to ∼0.13 MEq.
Fig. 9.
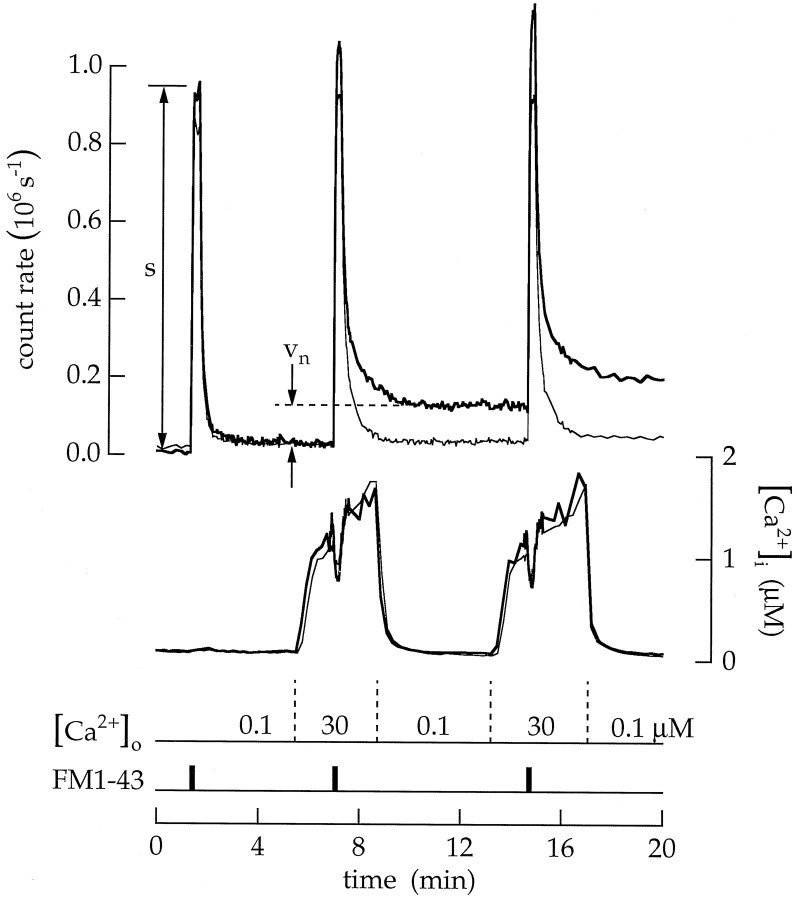
Exocytosis was induced by depolarization and Ca2+ influx. A bipolar cell was superfused with an extracellular saline containing 100 nmCa2+. The lower timing traceindicates the application of 20 μm FM4–64. Theupper timing trace indicates 4 sec applications of a high Ca2+ and K+ saline (4 mm Ca2+ and 40 mmK+). vx is the intensity increase produced by vesicle exocytosis. Transient exocytosisTx was measured asTx = ρvx/s. For the two applications of high Ca2+ and K+saline, Tx was 0.13 and 0.08 MEq.
The previous measurements were confirmed by observing endocytosis. Cells were first superfused with a saline containing 100 nmCa2+ to minimize Ca2+ entry and to prevent Ca2+-triggered vesicle cycling. An 18 sec exposure to FM1–43 stained the surface membrane of the terminal (Fig.10, thick upper trace). As expected, a 6 sec exposure to high Ca2+ and K+ saline produced a Ca2+ influx and raised the average cytoplasmic Ca2+concentration (thick lower trace). After FM1–43 was removed from the extracellular saline, the surface membrane destained, and fluorescence remained trapped in the cytoplasm of the terminal (labeledvn). The amount of endocytosisTn was measured asTn = ρvn/s. In this case,Tn was 0.08 MEq. In contrast, little or no dye was trapped in the soma (Fig. 10, thin upper trace). In addition, no endocytosis occurred when FM4–64 was applied as a control at the end of the experiment (Fig. 10, middle traces). In 22 experiments Tn was 0.049 ± 0.030 MEq (equal to 5500 vesicles). The largest values were ∼0.12 MEq (equal to 13,000 vesicles).
Images of the terminal are shown in two insets in Figure 10. Image a was taken during the time the membrane was stained with FM1–43. Image b was taken after the dye was removed and the membrane destained. There is no evidence of localization of newly endocytosed vesicles beneath the surface membrane. Instead, stained vesicles appear to be uniformly distributed throughout the interior of the terminal.
A second application of high Ca2+ and K+ saline without dye did not release a significant fraction of the labeled vesicles. We were never able to label vesicles, destain the surface membrane, and then release the accumulated dye in a second bout of vesicle cycling. Of course, this is not surprising if newly endocytosed vesicles diffuse rapidly and mix with the entire intraterminal vesicle population. A single burst of exocytosis typically labeled ∼10,000 vesicles. For comparison, a terminal contains 5–10 × 105 vesicles (see von Gersdorff et al., 1996). Thus, only 1–2% would be labeled, and a decrease in fluorescence by a second bout of exocytosis would be difficult to measure.
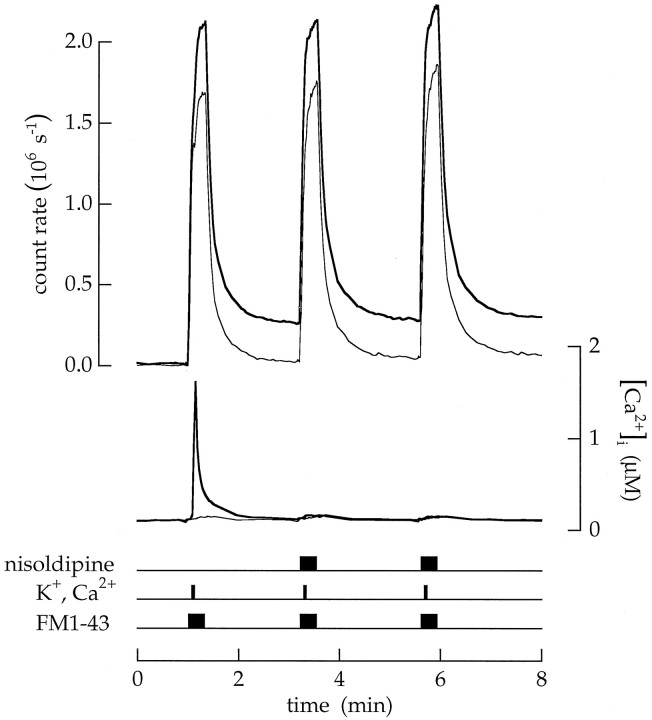
Vesicle cycling induced by depolarization depended on Ca2+ entry through voltage-gated Ca2+ channels and stopped when Ca2+ channels were blocked. An example is shown in Figure 11. The cell was exposed to high Ca2+ and K+ saline three times. The first exposure produced a bout of endocytosis withTn = 0.08 MEq. Afterward, 50 μm nisoldipine was added to the solutions containing FM1–43 to block voltage-gated channels (see Heidelberger and Matthews, 1992). The subsequent application of high Ca2+ and K+ saline plus nisoldipine produced a much smaller change in the average intraterminal Ca2+concentration. Evidently, most Ca2+ channels were blocked. At the same time, there was little endocytosis, andTn = 0.006 MEq (or a reduction of 92%). A repeated application of high Ca2+ and K+ saline plus nisoldipine produced a similar, barely detectable increase in the average Ca2+concentration and Tn = 0.003 MEq. Increasing the extracellular concentrations of K+and Ca2+ while pharmacologically blocking Ca2+ influx did not produce vesicle cycling. The same result was observed in 11 experiments. Depolarization stimulated vesicle cycling only when Ca2+ was able to influx through voltage-gated channels.
Fig. 11.
Pharmacologically blocking voltage-gated Ca2+ channels blocked Ca2+ influx and endocytosis. A bipolar cell was superfused first with an extracellular saline containing 100 nmCa2+ and then three times with FM1–43 and high Ca2+ and K+ saline. Each application was a sequence of 20 μm FM1–43 in control saline for 4 sec, FM1–43 in high Ca2+ and K+ saline for 4 sec, and finally FM1–43 in control saline for 12 sec. Nisoldipine (50 μm) was added to the extracellular salines during the second and third applications.Tn (measured as illustrated in Fig. 10) for the three sequential applications was 0.08, 0.006, and 0.003 MEq.
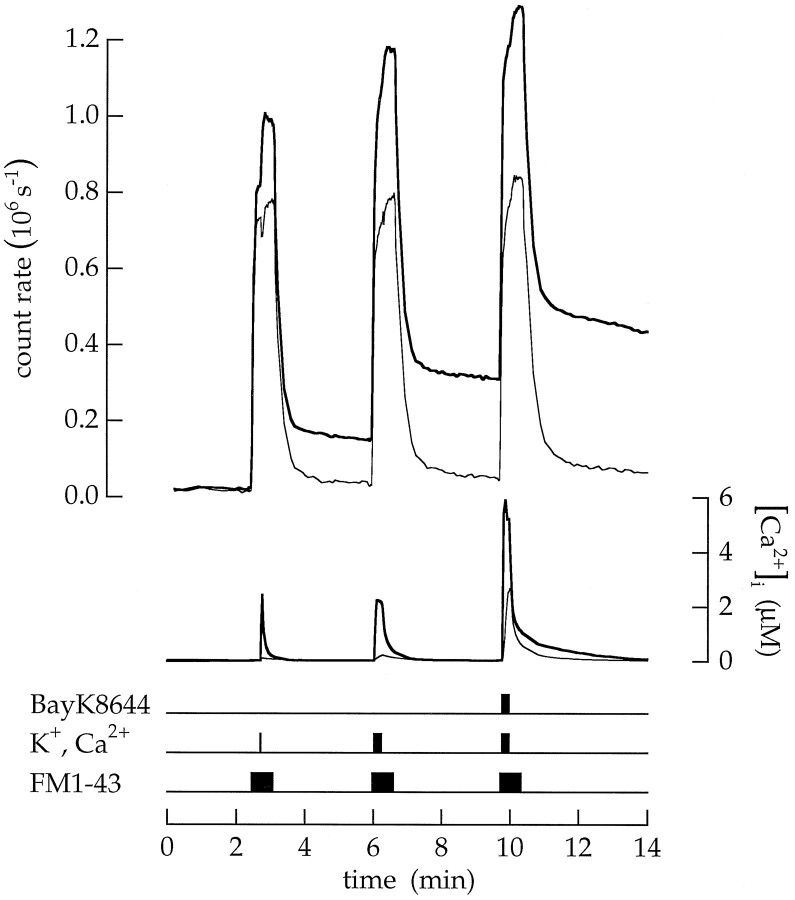
We were next interested to know whether Ca2+ influx through voltage-gated channels produced a relatively steady rate of vesicle cycling or a burst of cycling that developed quickly and soon subsided. Long and short episodes of Ca2+ entry were promoted by superfusing with a saline containing high Ca2+ and K+. An example is shown in Figure 12. After a 3 sec exposure to high Ca2+ and K+ saline,Tn(3) was 0.11 MEq. Lengthening the depolarization to 15 sec produced a very similar value;Tn(15) = 0.12 MEq. Finally, the 15 sec exposure was repeated with 1 μm BayK8466 added to the high Ca2+ and K+ saline to prolong the open time of Ca2+ channels (seeHeidelberger and Matthews, 1992). As expected, the average cytoplasmic Ca2+ concentration rose to a higher level, butTn was still 0.11 MEq. In 15 experiments the ratioTn(3)/Tn(15) was 1.06 ± 0.49. Each pulse of high Ca2+ and K+ produced an approximately equal increment in dye accumulation. An experiment described above (see Fig. 10) demonstrates that labeled vesicles quickly mixed with a 100× larger vesicle pool. Consequently, only ∼1% of the vesicles labeled during one bout of cycling were released in a subsequent bout of cycling, and each increment represents labeled vesicles added in a new round of exocytosis with little loss of previously accumulated vesicles. Thus, equal steps of accumulation indicate that the majority of exocytosis initiated by superfusion with a high Ca2+ and K+ saline is completed in a single, transient burst.
Fig. 12.
Vesicle cycling triggered by Ca2+ influx was transient. The cell was superfused three times with a 30 sec pulse of 20 μm FM1–43. Transient endocytosis Tn was measured as shown in Figure 10. The first application included a 3 sec pulse of high Ca2+ and K+;Tn = 0.11 MEq. The second application included a 15 sec pulse of high Ca2+ and K+; Tn = 0.12 MEq. The third application was similar but added 1 μm BayK8466 to the high Ca2+ and K+ saline to prolong the open time of Ca2+ channels;Tn = 0.11 MEq. Increasing the duration or amount of Ca2+ entry did not alter transient exocytosis. The control saline contained 100 nmCa2+. Each pulse of FM1–43 extended 12 sec beyond the end of the high Ca2+ and K+application.
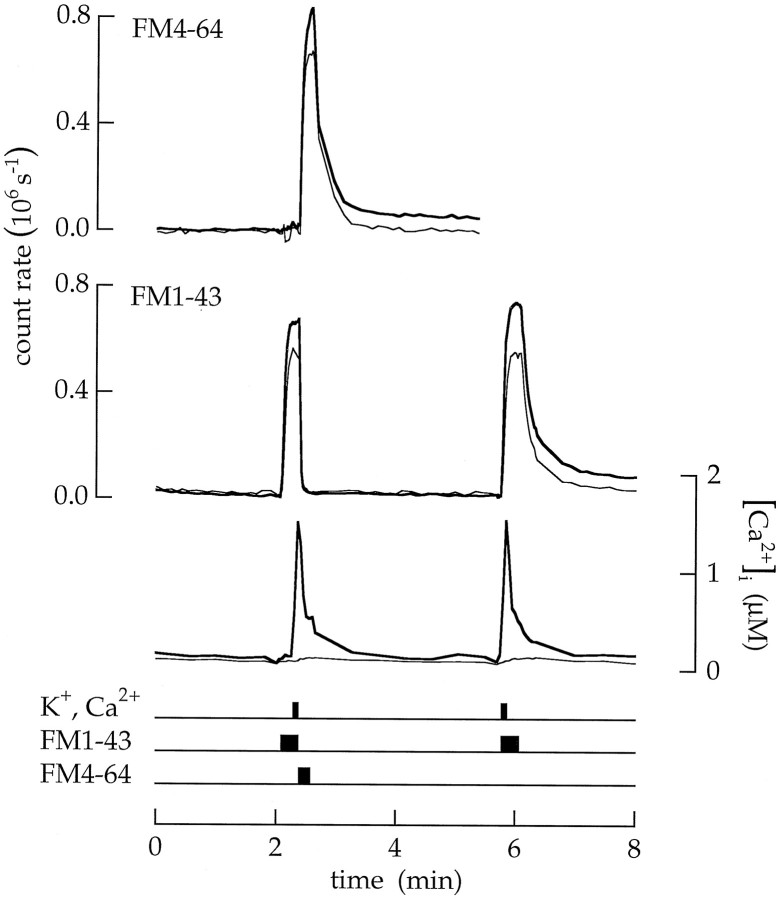
Capacitance measurements by von Gersdorff and Matthews (1994b) indicate that endocytosis does not occur while the Ca2+concentration is elevated. The following experiment (Fig.13) provides additional insight. A cell was exposed to two pulses of high Ca2+ and K+ saline. The first application was used to identify the amounts of endocytosis that occurred first during and then after Ca2+ entry. At the end of the first application, the exposure to FM1–43 and the high Ca2+ and K+ saline ended together, and FM1–43 fluorescence in the surface membrane was quenched with FM4–64. Vesicles endocytosed during exposure to high Ca2+ and K+ saline should be labeled with FM1–43, but vesicles endocytosed after the return to the low Ca2+ saline should be labeled with FM4–64.Tn measured by the FM1–43 pulse was only 0.004 MEq. Tn measured by the FM4–64 pulse was 0.05 MEq. The second application of FM1–43 was used to measure the total amount of endocytosis. Exposure to FM1–43 continued 12 sec beyond the 6 sec pulse of high Ca2+ and K+ saline. Consequently, vesicles endocytosed both during and after the pulse of Ca2+ and K+ saline were labeled with FM1–43. In this caseTn was 0.07 MEq. The entire experiment indicates that little endocytosis occurred during superfusion with high Ca2+ and K+ saline but that a significant amount occurred after return to the control saline.
Fig. 13.
Endocytosis was delayed until after Ca2+ influx stopped. The timing of endocytosis was measured with 18 sec applications of 20 μm FM1–43 combined with 6 sec pulses of high Ca2+ and K+ saline. The first applications of FM1–43 and high Ca2+ and K+ saline ended together and were immediately followed by a pulse of 20 μm FM4–64 in a saline containing 100 nmCa2+. The FM4–64 quenched the fluorescence of FM1–43 in the surface membrane (see Fig. 3) but not in vesicles trapped in the cytoplasm. Tn measured (as shown in Fig. 10) with FM1–43 was 0.004 MEq and indicated that little endocytosis occurred during superfusion with the high Ca2+ and K+ saline.Tn measured with FM4–64 was 0.05 MEq and indicated that significant endocytosis occurred after return to the control saline. The second application of FM1–43 measured the total amount of endocytosis; Tn = 0.07 MEq.
DISCUSSION
Electrical and optical experiments now provide different perspectives of synaptic vesicle cycling. Both methods have been used to study ribbon synapses in the large synaptic endings of goldfish bipolar cells. Capacitance measurements are best suited to detect rapid events. Heidelberger et al. (1994) have measured the change in electrical capacitance produced when a jump in Ca2+concentration promotes the rapid fusion of a limited number of vesicles. In contrast, fluorescence from styryl dyes cannot resolve rapid events but is best suited to detect slow, continuous, or maintained changes. As we explain below, the two methods provide complementary views of synaptic vesicle dynamics.
The electrical measurements reveal that a rapid, saturating increase in the intracellular Ca2+ concentration triggers the fusion of ∼3000 vesicles with a time constant of 0.35 msec (Heidelberger et al., 1994), too short for an individual fusion site to be used more than once. Consequently, all 3000 vesicles must be predocked and ready for release. The rate constant for the last step in vesicle fusion accelerates from 1 sec−1 when the Ca2+ concentration is ∼10 μm to 1000 sec−1 when the concentration reaches 200 μm [see Heidelberger et al. (1994), their Fig. 3a]. The optical measurements reported here demonstrate that a Ca2+ concentration between 0.8 and 20 μm can maintain a continuous cycle of balanced exocytosis and endocytosis with a maximal rate of 900 vesicles sec−1 (Fig. 7) or ∼0.3 vesicle sec−1 at each release site. The continuous cycle slows when the Ca2+ concentration rises above 20 μm. Both the electrophysiological and optical measurements demonstrate that Ca2+ influx through voltage-gated channels produces a burst of exocytosis but little or no endocytosis until the average Ca2+ concentration falls. Moreover, the maximum number of vesicles released appears to be greater than the number of fusion sites (i.e., 10,000 vesicles vs 3,000 fusion sites), implying that several vesicles fuse at each site before cycling stops.
Our results differ from those of Lagnado et al. (1996). We have observed that (1) depolarization by high K+produces a transient burst of vesicle cycling, (2) newly endocytosed vesicles rapidly diffuse and mix with the total intraterminal vesicle population, and (3) a high rate of continuous cycling is sustained at concentrations between 0.8 and 20 μm intracellular Ca2+ and stops at higher concentrations. Lagnado et al. (1996) claim that (1) depolarization by high K+produces continuous vesicle cycling, (2) newly endocytosed vesicles accumulate beneath the surface membrane, and (3) continuous cycling is sustained at all Ca2+ concentrations above 0.3 μm Ca2+. We cannot explain these differences.
We expect the function of fusion sites to depend critically on the location of Ca2+ channels and illustrate our view with two examples. One extreme behavior would occur in a “synapse” with only one Ca2+ channel and an immediately adjacent fusion site. In this case, the Ca2+concentration in a microdomain at the cytoplasmic end of the channel will tightly control vesicle cycling. In contrast, another extreme behavior would occur in a “synapse” with a Ca2+channel far from a fusion site. In this case, release would be controlled by the average Ca2+ concentration in the cytoplasm. Many channel openings would raise the average cytoplasmic Ca2+ concentration and sustain a continuous cycle of repeated exocytosis and endocytosis. Of course, these idealized synapses illustrate extreme behaviors. But the examples indicate how dynamic behavior may depend on the number and relative spatial distribution of channels and fusion sites. Many central synapses have only one, or a few, fusion sites (see Redman, 1990; Korn and Faber, 1991; Ryan et al., 1997) and consequently may approach either of the two extreme behaviors described above. However, cells with ribbon synapses have many fusion sites (Raviola and Gilula, 1975; von Gersdorff et al., 1996) and, combining the behavior of both models, should mediate both transient and continuous release.
Bipolar cells, like rod photoreceptors (Rieke and Schwartz, 1996), sustain high rates of vesicle cycling at relatively low (0.8–20 μm) Ca2+ concentrations. This is the result of having many release sites that operate in parallel. Although the rate of turnover at an individual release site is estimated as only 0.3 vesicle sec−1, the net effect of simultaneously maintaining release at a large number of sites is an enormous membrane flux, equal in a bipolar cell to the replacement of the entire surface area of a terminal every 2 min. Neurons with ribbon synapses—photoreceptors, hair cells, and retinal bipolar cells—appear to be specialized for the massive, parallel release of many vesicles.
An endocytosed vesicle passes through an uncertain number of intermediate steps before being ready for a new round of fusion. If newly endocytosed vesicles had to be immediately reused, then continuous release would be limited by the time required to produce a mature, fusion-competent vesicle. Significantly, endocytosed vesicles are not immobilized near release sites but quickly diffuse throughout the terminal (Figs. 5, 10). A total of 5–10 × 105 vesicles (von Gersdorff et al., 1996) is equal to ∼500–1000 vesicles per release site. Hence, vesicles may continuously move to docking sites from an abundant reserve. A large number of release sites and a surfeit of vesicles are required to maintain a high rate of continuous release.
: FM DYES CROSS THE SURFACE MEMBRANE
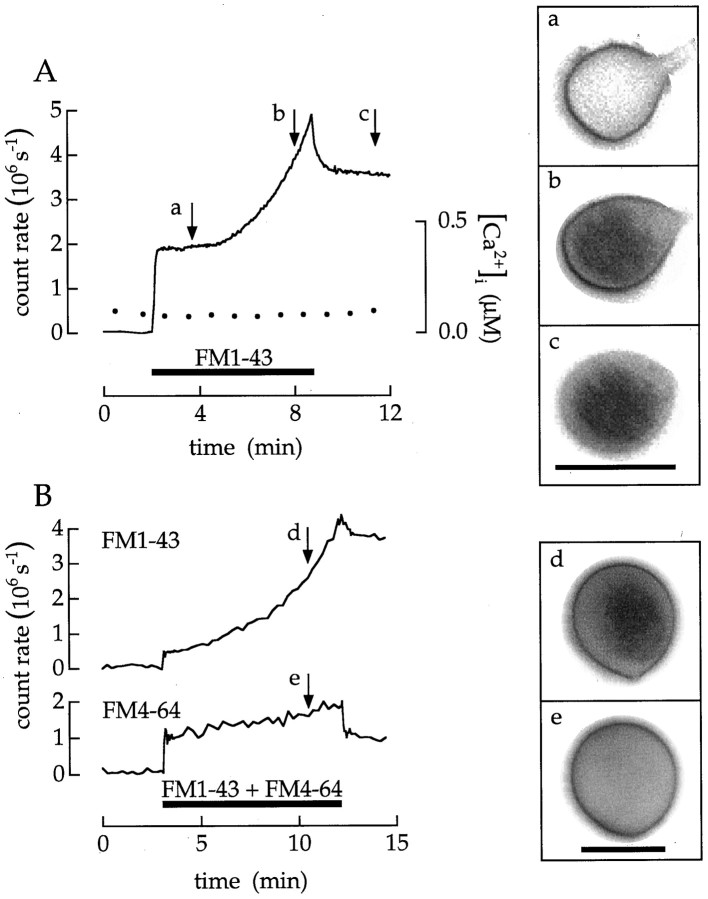
When a bipolar cell was superfused with FM1–43 for several minutes, dye sometimes accumulated in the cytoplasm even without stimulation or a change in experimental condition. For example, in Figure 14A, a cell was permeabilized with a Ca2+ ionophore (10 μm ionomycin) and continuously superfused with 100 nm Ca2+. The intracellular Ca2+ concentration remained constant at ∼100 nm throughout the experiment. Nonetheless, FM1–43 initially stained the surface membrane and then, after a significant delay, entered the cytoplasm.
Fig. 14.
Spontaneous entry of FM1–43. A, The cell was continuously superfused with 10 μm ionomycin and 100 nm Ca2+. Intracellular Ca2+ concentration was measured by fura-2 fluorescence (closed circles). The application of 20 μm FM1–43 is indicated by the horizontal timing bar. a–c, The three images at theright were taken at the times indicated byarrows. B, Dye crosses the membrane of a fixed terminal. The cell was fixed with 2% formaldehyde for 1 hr. The application of 15 μm FM1–43 plus 15 μmFM4–64 is indicated by the horizontal timing bar.d, e, The two images were taken at the time indicated by the arrows. Data were corrected for crossover of FM1–43 fluorescence into the FM4–64 detection band. FM1–43 and FM4–64 accumulated in the cytoplasm with different time courses. Scale bars in c and e, 10 μm.
The spontaneous entry of dye did not depend on vesicle cycling. Instead, the following experiment demonstrates that it was produced by dye molecules crossing the surface membrane. Cells were first fixed with 2% formaldehyde for 1 hr and afterward superfused with a saline containing both FM1–43 and FM4–64. The result is shown in Figure14B. There are two essential observations. First, FM1–43 accumulated in the cytoplasm of a fixed cell. Thus, spontaneous entry did not require vesicle cycling. This conclusion is reinforced by the second observation; FM1–43 accumulated in the cytoplasm with a different time course than did FM4–64. Of course, the two dyes would be accumulated with the same time course if the two dyes tagged the surface membrane and were internalized together in the membrane of endocytosed vesicles. Instead, the accumulation of FM4–64 was much slower. The results are easily explained if FM1–43 molecules cross the lipid bilayer and the other dye, FM4–64, crosses more slowly.
Images recorded during spontaneous dye entry (Fig. 14) differed in two ways from images recorded during vesicle cycling (Fig. 5). First, fluorescent foci did not develop beneath the surface membrane, and the surface contour did not become irregular. Second, dye preferentially accumulated in the center of a terminal and formed a fluorescent spot occupying perhaps half the internal cross-sectional area. A similar central spot developed when FM1–43 was applied to cells that had been permeabilized by a brief exposure to 20 μm digitonin (data not shown). Thus, the central spot was a region that avidly stained when free dye was available in the cytoplasm.
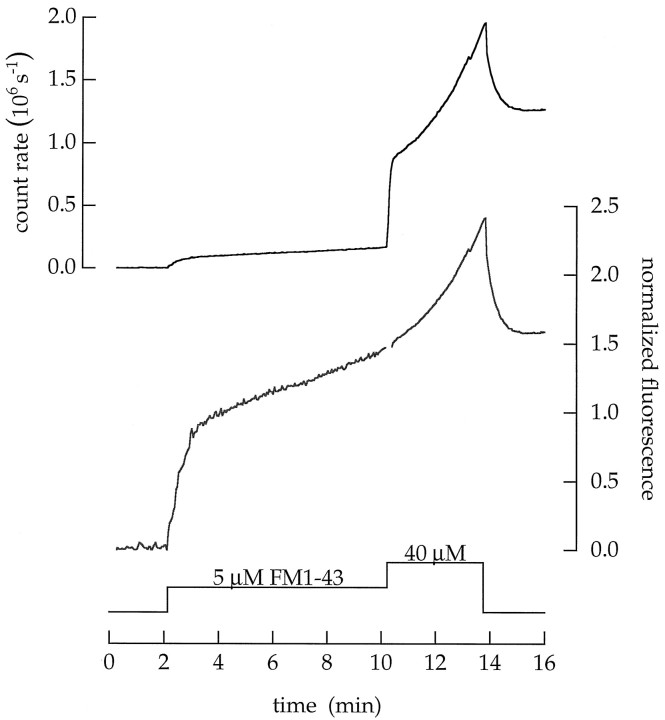
Several observations indicate that styryl dyes form a series of states when they partition into membranes. The complex kinetics of membrane staining and destaining observed in Figure 2 indicates that the dye has more than one state in a membrane. In addition, the glitches seen in Figure 3 (at the arrowhead) are produced because spectral components of FM1–43 fluorescence leave the membrane at different rates. The correlation of spectral and kinetic components indicates distinct states. Finally, the ability of FM4–64 to quench FM1–43 indicates that dye molecules can be closely packed (see Stryer, 1978). Hence, dyes may aggregate. Thus, we were not surprised to find that FM1–43 facilitated its own entry. For example, Figure15 shows the result from a cell superfused with two concentrations of FM1–43. When the cell was first superfused for several minutes with 5 μm FM1–43, there was a steady, slow rate of cytoplasmic accumulation (Fig. 15,lower trace). Next, when the concentration was increased to 40 μm, the rate of entry (normalized by the dye concentration) increased fivefold (viz., from 0.074 to 0.38 MEq min−1).
Fig. 15.
Increasing the FM1–43 concentration facilitates spontaneous entry. A cell was permeabilized with ionomycin and superfused with a saline buffered to contain 100 nmCa2+. After a control period, 5 and then 40 μm FM1–43 were added. Upper trace, Total fluorescence measured in sequential images of the terminal plotted as a function of time. Lower trace, Normalized fluorescence plotted as a function of time. The fluorescence in the surface membrane and that in the cytoplasm (multiplied by the geometric factor ρ) were summed, normalized by the dye concentration, and then scaled so that the normalized fluorescence in the surface membrane had a value of 1.
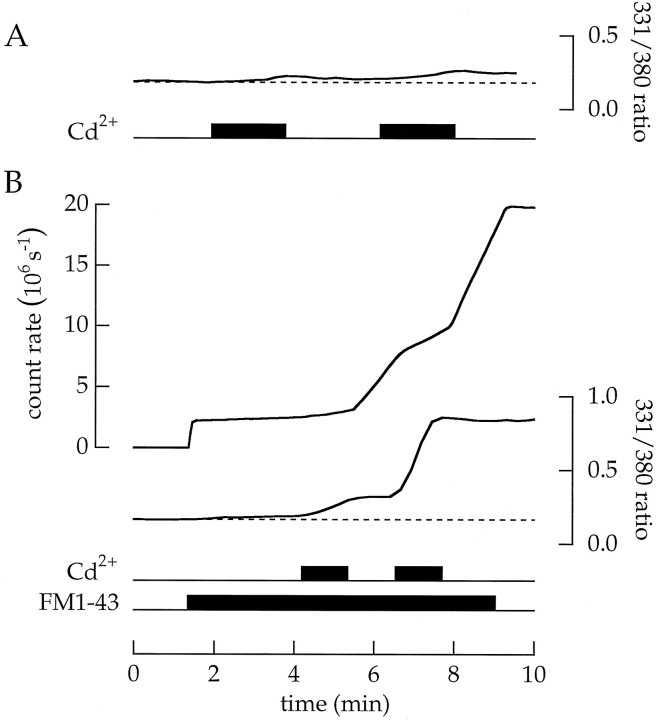
We believe that dye molecules equilibrate between a series of states. Some of these transitions may be fast and others quite slow. Moreover, some states may depend on or be nucleated by specific membrane molecules. Eventually, dye molecules might cross the surface membrane either by flipping from the outer to the inner leaflet or by interacting with the lipids that surround channels, opening channels, and then passing through the open pore. The experiments in Figure16, A and B, provide a hint for the mechanism of dye entry. Cells were loaded with fura-2 AM and superfused alternately with salines that contained either 2 mm Mg2+ or 2 mmCd2+. Fura-2 was used to detect the entry of Cd2+. Normally, the permeability of Cd2+ is low. Thus, in each of seven control experiments, there was only a small change in the ratio of fura-2 fluorescence elicited by 331 and 380 nm light (Fig.16A). In contrast, a different picture was observed in eight experiments when a cell was also superfused with FM1–43 (Fig.16B). Now, fura-2 fluorescence reported a significant increase in intracellular divalent ion concentration each time the cell was exposed to Cd2+. Because the extracellular saline lacked Ca2+, the change in fura-2 fluorescence is attributed to the entry of Cd2+. Thus, continuous exposure to FM1–43 increased the membrane permeability of Cd2+. In addition, each exposure to Cd2+ decreased the simultaneous entry of FM1–43 and, after the removal of Cd2+, increased the subsequent entry of FM1–43. Although Cd2+ and FM1–43 interacted in a complex manner, the results imply that both cooperate to increase membrane permeability, most likely by opening a channel.
Fig. 16.
The combination of Cd2+ and FM1–43 increased membrane permeability to both Cd2+and FM1–43. Cells were loaded with fura-2. A, Cd2+ does not normally enter a terminal. The cell was superfused alternately with an extracellular saline containing 2 mm Mg2+ (no added Ca2+) and a saline containing 2 mmCd2+. There was little change in the ratio of fura-2 fluorescence produced by 331 and 380 nm light, indicating that Cd2+ did not enter. B, Cd2+ enters a terminal stained with FM1–43. The cell was superfused with an extracellular saline containing 2 mm Mg2+ (no added Ca2+). FM1–43 (20 μm) was added to the saline. When Mg2+ was replaced by Cd2+, fura-2 fluorescence indicted an increase in intracellular, divalent ions. After returning to the Mg2+-rich saline, the rate of FM1–43 entry increased.
Experiments on vesicle cycling can be contaminated by spontaneous dye entry. The characteristic delay before rapid intracellular staining was variable. Rapid entry could be triggered by a brief exposure to Cd2+ (Fig. 16), and we have the impression that the transition may sometimes be initiated in the absence of Cd2+ by bright light or exposure to a hydrophobic drug. Once dye entry started, it was not reversible. Therefore, our strategy was (1) to use FM1–43 only for short exposures (<120 sec in Fig. 5 and <30 sec in all other experiments) and FM4–64, which appeared to permeate more slowly (Fig. 14B), for longer exposures, (2) to record images of the terminal in every experiment and to reject an experiment if a bright fluorescent spot formed in the center of the terminal (as in Fig. 14), and (3) to elicit multiple periods of vesicle cycling and to include controls to be certain that all measurements were repeatable.
Footnotes
This work was supported by a grant from the National Institutes of Health.
Correspondence should be addressed to Dr. Eric Schwartz, Department of Pharmacological and Physiological Sciences, The University of Chicago, 947 East 58th Street, Chicago, IL 60637.
REFERENCES
- 1.Bader CR, Bertrand D, Schwartz EA. Voltage-activated and calcium-activated currents studied in solitary rod inner-segments from the salamander retina. J Physiol (Lond) 1982;331:253–284. doi: 10.1113/jphysiol.1982.sp014372. [DOI] [PMC free article] [PubMed] [Google Scholar]
- 2.Bers DM, Patton CW, Nuceitelli R. A practical guide to the preparation of Ca2+ buffers. Methods Cell Biol. 1994;40:3–29. doi: 10.1016/s0091-679x(08)61108-5. [DOI] [PubMed] [Google Scholar]
- 3.Betz WJ, Mao F, Bewick GS. Activity-dependent fluorescent staining and destaining of living vertebrate motor nerve terminals. J Neurosci. 1992;12:363–375. doi: 10.1523/JNEUROSCI.12-02-00363.1992. [DOI] [PMC free article] [PubMed] [Google Scholar]
- 4.Betz WJ, Mao F, Smith CB. Imaging exocytosis and endocytosis. Curr Opin Neurobiol. 1996;6:365–371. doi: 10.1016/s0959-4388(96)80121-8. [DOI] [PubMed] [Google Scholar]
- 5.Fasolato C, Zottini M, Clementi E, Zacchetti D, Meldolesi J, Pozzan T. Intracellular Ca2+ pools in PC12 cells. Three intracellular pools are distinguished by their turnover and mechanisms of Ca2+ accumulation, storage, and release. J Biol Chem. 1991;266:20159–20167. [PubMed] [Google Scholar]
- 6.Grynkiewicz G, Poenie M, Tsien RY. A new generation of Ca2+ indicators with greatly improved fluorescence properties. J Biol Chem. 1985;260:3440–3450. [PubMed] [Google Scholar]
- 7.Heidelberger R, Matthews G. Calcium influx and calcium current in single synaptic terminals of goldfish retinal bipolar neurons. J Physiol (Lond) 1992;447:235–256. doi: 10.1113/jphysiol.1992.sp019000. [DOI] [PMC free article] [PubMed] [Google Scholar]
- 8.Heidelberger R, Heinemann C, Neher E, Matthews G. Calcium dependence of the rate of exocytosis in a synaptic terminal. Nature. 1994;371:513–515. doi: 10.1038/371513a0. [DOI] [PubMed] [Google Scholar]
- 9.Jankowski JA, Schroeder TJ, Holz RW, Wightman RM. Quantal secretion of catecholamines measured from individual bovine adrenal medullary cells permeabilized with digitonin. J Biol Chem. 1992;267:18329–18335. doi: 10.21236/ada251716. [DOI] [PubMed] [Google Scholar]
- 10.Katz B, Miledi R. A study of synaptic transmission in the absence of nerve impulses. J Physiol (Lond) 1967;192:407–436. doi: 10.1113/jphysiol.1967.sp008307. [DOI] [PMC free article] [PubMed] [Google Scholar]
- 11.Korn H, Faber DS. Quantal analysis and synaptic efficacy in the CNS. Trends Neurosci. 1991;14:439–445. doi: 10.1016/0166-2236(91)90042-s. [DOI] [PubMed] [Google Scholar]
- 12.Lagnado L, Gomis A, Job C. Continuous vesicle cycling in the synaptic terminal of retinal bipolar cells. Neuron. 1996;17:957–967. doi: 10.1016/s0896-6273(00)80226-3. [DOI] [PubMed] [Google Scholar]
- 13.Raviola E, Gilula NB. Intramembrane organization of specialized contacts in the outer plexiform layer of the retina. A freeze-fracture study in monkeys and rabbits. J Cell Biol. 1975;65:192–222. doi: 10.1083/jcb.65.1.192. [DOI] [PMC free article] [PubMed] [Google Scholar]
- 14.Redman S. Quantal analysis of synaptic potentials in neurons of the central nervous system. Physiol Rev. 1990;70:165–198. doi: 10.1152/physrev.1990.70.1.165. [DOI] [PubMed] [Google Scholar]
- 15.Rieke F, Schwartz EA. Asynchronous transmitter release: control of exocytosis and endocytosis at the salamander rod synapse. J Physiol (Lond) 1996;493:1–8. doi: 10.1113/jphysiol.1996.sp021360. [DOI] [PMC free article] [PubMed] [Google Scholar]
- 16.Ryan TA, Reuter H, Smith SJ. Optical detection of a quantal presynaptic membrane turnover. Nature. 1997;388:478–482. doi: 10.1038/41335. [DOI] [PubMed] [Google Scholar]
- 17.Stryer L. Fluorescence energy transfer as a spectroscopic ruler. Annu Rev Biochem. 1978;47:819–846. doi: 10.1146/annurev.bi.47.070178.004131. [DOI] [PubMed] [Google Scholar]
- 18.Vida TA, Emr SD. A new vital stain for visualizing vacuolar membrane dynamics and endocytosis in yeast. J Cell Biol. 1995;128:779–792. doi: 10.1083/jcb.128.5.779. [DOI] [PMC free article] [PubMed] [Google Scholar]
- 19.von Gersdorff H, Matthews G. Dynamics of synaptic vesicle fusion and membrane retrieval in synaptic terminals. Nature. 1994a;367:735–739. doi: 10.1038/367735a0. [DOI] [PubMed] [Google Scholar]
- 20.von Gersdorff H, Matthews G. Inhibition of endocytosis by elevated internal calcium in a synaptic terminal. Nature. 1994b;370:652–655. doi: 10.1038/370652a0. [DOI] [PubMed] [Google Scholar]
- 21.von Gersdorff H, Vardi E, Matthews G, Sterling P. Evidence that vesicles on the synaptic ribbon of retinal bipolar neurons can be rapidly released. Neuron. 1996;16:1221–1227. doi: 10.1016/s0896-6273(00)80148-8. [DOI] [PubMed] [Google Scholar]


