

Abstract
Current evidence suggests that the adaptation motor of mechanoelectrical transduction in vertebrate hair cells is myosin-Iβ. Previously, confocal and electron microscopy of bullfrog saccular hair cells using an anti-myosin-Iβ antibody labeled the tips of stereocilia. We have now done quantitative immunoelectron microscopy to test whether myosin-Iβ is enriched at or near the side plaques of tip links, the proposed sites of adaptation, using hair bundles that were serially sectioned parallel to the macular surface. The highest particle density occurred at stereocilia bases, close to the cuticular plate. Also, stereocilia of differing lengths had approximately the same number of total particles, suggesting equal targeting of myosin-Iβ to all stereocilia. Finally, particles tended to clump in clusters of two to five particles in the distal two-thirds of stereocilia, suggesting a tendency for self-assembly of myosin-Iβ.
As expected from fluorescence microscopy, particle density was high in the distal 1 μm of stereocilia. If myosin-Iβ is the adaptation motor, a difference should exist in particle density between regions containing the side plaque and those excluding it. Averaging of particle distributions revealed two regions with approximately twice the average density: at the upper ends of tip links in a 700-nm-long region centered ∼100 nm above the side plaque, and at the lower ends of tip links within the tip plaques. Controls demonstrated no such increase. The shortest stereocilia, which lack side plaques, showed no concentration rise on their sides. Thus, the specific localization of myosin-Iβ at both ends of tip links supports its role as the adaptation motor.
Keywords: hair cell, myosin-Iβ, adaptation, auditory, vestibular, electron microscopy
Sensory hair cells adapt to prolonged deflections of their hair bundles so that the open probability of the transduction channels returns within tens of milliseconds to near the resting value of 5–15% (Eatock et al., 1987; for review, see Gillespie and Corey, 1997). At least part of adaptation in vertebrate hair cells results from a mechanical adjustment (Howard and Hudspeth, 1988; Assad and Corey, 1992) that modulates tension in the tip links, the 200 nm filaments that connect the tips of stereocilia to the sides of their taller neighbors (Pickles et al., 1984). It has been proposed that motor molecules reside in or near the electron-dense “side plaques” that mark the upper insertion of each tip link. This structure and the transduction channel(s) associated with them can move along the stereocilia during adaptation (Howard and Hudspeth, 1987). Ultrastructural measurements of side-plaque position before and after adaptation, or before and after cutting tip links, supports the idea that side plaques can move (Shepherd et al., 1991).
Current evidence implicates a myosin as the main mechanoenzyme. The core of a stereocilium is a bundle of cross-linked actin filaments; myosin molecules are the only motor proteins known to move on actin. Actin in stereocilia is oriented such that the myosin power stroke would pull in the direction necessary to provide resting tension on the tip link (Flock et al., 1981). Unloaded muscle myosin moves along stereocilia at 1–2 μm/sec, a speed similar to that of the adaptation motor (Assad and Corey, 1992).
An effort to identify myosins expressed in the bullfrog saccular macula produced 13 different candidate myosin transcripts from 10 different genes (Solc et al., 1994). Of these, myosin-Iβ has the properties necessary for an adaptation motor (Gillespie et al., 1996). First, myosin-Iβ is found in the stereocilia (Gillespie et al., 1993; Hasson et al., 1997). Second, it exhibits Ca2+-regulated actin-activated ATPase activity (Barylko et al., 1992; Burlacu et al., 1997). Third, the physical compactness of myosin-Iβ would allow adequate numbers to insert themselves in or near the side plaque (Solc et al., 1994). Fourth, antibodies directed against cow or frog myosin-Iβ labeled the tips of frog stereocilia (Gillespie et al., 1993; Hasson et al., 1997). However, the limited resolution of confocal microscopy used in those studies (∼1 μm) could not adequately localize myosin-Iβ at or near the ends of tip links.
Preliminary studies using immunoelectron microscopy (Hasson et al., 1997; Metcalf, 1998) revealed clusters of gold particles near the side and tip plaques, but these did not present a statistically significant sample. Here, we extend those findings on the distribution of myosin-Iβ within the saccular sensory epithelium. Using preembedding immunoelectron microscopy combined with statistical analysis of gold particle labeling within ultrathin serial sections, we show that myosin-Iβ distribution is quantitatively enriched in both tip and side plaques relative to the rest of the stereociliary bundle. The localization of myosin-Iβ to the side plaque supports its role as the adaptation motor in bullfrog saccular hair cells.
Some of these results have appeared in preliminary form (García et al., 1997).
MATERIALS AND METHODS
Dissection. Sacculi from adult American bullfrogs (Rana catesbeiana) were rapidly dissected into an oxygenated saline solution [containing (in mm): 120 NaCl, 2 KCl, 0.1 CaCl2, 3 dextrose, 5 HEPES, and 0.02% phenol red] and cleaned of extraneous tissue (Assad and Corey, 1992). The pH was adjusted to 7.23 with NaOH, and the final osmolarity was 250 mOsm/kg. Otolithic membranes overlying saccular epithelia were removed in fresh saline solution with fine forceps after incubation of the tissue in 75 μg/ml of subtilisin (Type XXVIII; Sigma, St. Louis, MO) for 20 min.
Immunohistochemistry. Tissues were fixed for 18 min in 4% formaldehyde in 80 mm sodium cacodylate buffer with 4 mm CaCl2, pH 7.35, at room temperature with gentle agitation. After fixation, tissues were rinsed (one time for 5 min) in 80 mm sodium cacodylate buffer without CaCl2 and (three times for 5 min each) in PBS (Life Technologies, Grand Island, NY) diluted to ∼250 mOsm, pH 7.4. This and all subsequent steps used PBS adjusted to 250 mOsm. Tissues were permeabilized with 1% Triton X-100 (25 min), washed (one time for 15 min) in PBS, and blocked for 45 min with PBS containing 5% bovine serum albumin (BSA) (A-6793; Sigma) and 1% normal goat serum (Jackson ImmunoResearch, West Grove, PA). After the blocking step, tissues were rinsed briefly with PBS and were incubated for 5 hr in anti-myosin-Iβ antibody (80 μg/ml) in PBS containing 0.5% BSA and 0.5% normal goat serum with gentle agitation and washed (three times for 10 min each) with PBS containing 0.5% BSA (PBS–BSA). The myosin-Iβ antibody was raised against a fusion protein containing the C-terminal 15 kDa of frog myosin-Iβ tail, was affinity purified, and was tested for specificity in immunoblots of frog tissues as described previously (Hasson et al., 1997). The myosin-VI antibody, used at 5–10 μg/ml, was raised against the tail of pig myosin-VI (Hasson and Mooseker, 1994); it recognizes frog myosin-VI as well (Hasson et al., 1997). Control sacculi were processed normally but without primary antibody. Tissues were incubated overnight at 4°C with protein A coupled to 5-nm-gold particles (J. Slot, University of Utrecht, The Netherlands) in PBS–BSA.
Additional sacculi were processed in parallel for fluorescence microscopy using Cy3 goat anti-rabbit (Jackson ImmunoResearch) at a 1:150 dilution to monitor myosin-Iβ immunoreactivity before processing for electron microscopy. Tissues were rinsed (three times for 10 min each) with PBS–BSA. Cy3-labeled sacculi were mounted on glass slides in Citifluor (University of Kent, Canterbury, UK) and viewed with a rhodamine filter on a Zeiss (Oberkochen, Germany) Axioscope upright microscope.
Individual saccular hair cells were isolated into a saline solution (Assad and Corey, 1992) over glass slides coated with Cell Tak (Collaborative Research, Bedford, MA). The slides were incubated at room temperature (one time for 5 min) to allow attachment of the cells to the substrate. The cells were fixed for 10 min in 4% formaldehyde and rinsed (four times for 5 min each) in PBS. The cells were permeabilized with 1% Triton X-100 (one time for 10 min) and rinsed (two times for 5 min each) in PBS and then blocked and incubated in anti-myosin-Iβ antibody (10 μg/ml) as described above for the entire saccule. The cells were incubated for 1 hr at room temperature or overnight at 4°C with a FITC-conjugated goat anti-rabbit at 1:150 (Jackson ImmunoResearch). The labeled cells were rinsed (three times for 5 min each) with PBS and mounted on glass coverslips in Citifluor to prevent photobleaching. A stack of confocal images comprising the center 2 μm of a hair bundle were captured using a BioRad (Hercules, CA) MRC-1000 confocal microscope. The stack of confocal images was summed using MetaMorph 2.5 (Universal Imaging Corporation, West Chester, PA).
Electron microscopy. After protein A gold labeling, sacculi were briefly rinsed in PBS, and the immunohistochemical reaction was stabilized with 2.5% glutaraldehyde in PBS for 1 hr, followed by multiple rinses in PBS. This and all subsequent steps were performed at room temperature. Sacculi were post-fixed with 2% osmium tetroxide in 1.5% potassium ferrocyanide for 1 hr, rinsed (four times for 5 min each) with 100 mm sodium cacodylate buffer, and then stained en bloc with 2% uranyl acetate in maleate buffer, pH 6.0, for 1.5 hr. After dehydration in an ethanol series, the tissue was rinsed briefly in 100% propylene oxide and flat-embedded (1:1) in EMbed812/Araldite 6005 (Electron Microscopy Sciences, Fort Washington, PA) and cured for 48 hr at 60°C.
Vertical thin sections were collected from the center of the sensory epithelium along the axis running parallel to the eighth nerve fibers and perpendicular to the macular surface using a Reichert Ultramicrotome E. When vertical sections indicated an optimal region, sacculi were cut from an epon block and reembedded in the proper orientation for horizontal serial sections. Thin sections (silver–gold, ∼70 nm) were collected serially, 40–50 at a time, from near the top of the hair bundle down to the cuticular plate, and divided into four or five sections per slotted grid. The sections were suspended within slotted copper grids (Electron Microscopy Sciences) via a water droplet, and the grids were placed onto floating formvar sheets. The formvar sheets were collected using a peg loop (Ernest F. Fullam, Inc., Latham, NY) and dried overnight. Each grid was individually poststained with 2% uranyl acetate and Reynold’s lead citrate. The location of each hair bundle was mapped within a section, followed serially, and photographed with a JEOL 100CX electron microscope.
Data analysis. Each section of a bundle was individually photographed, and the negatives were printed at 8 × 10 inches. An entire hair bundle typically consisted of ∼80–90 serial thin sections. In all cases, bundle polarity was unequivocally determined using two criteria. First, the 9 + 2 microtubule arrangement of the kinocilium was conspicuous in the majority of sections. Second, the staircase arrangement of stereocilia from top to bottom indicated the tallest stereocilia. The tip plaque was readily apparent in the highest section of each stereocilium. In longitudinal sections of well fixed bundles, the side plaques are consistently located ∼200 nm (after correcting for shrinkage) above the lower adjacent stereocilium along the axis of the hair bundle (Shepherd et al., 1991). In transverse sections of antibody-labeled tissue, we often could detect side plaques. When visible, 64% of these occurred two sections up from the tip of the shorter adjacent stereocilium. The remaining 36% of side plaques occurred just one section immediately above (9%) or below (17%) this point. For much of the analysis, therefore, we assumed that the side plaques occurred two sections up from the adjacent tips, whether or not the plaques were visible.
Each stereocilium was followed serially. For each section, the gold particles located on its circumference were counted and recorded in two groups. One sector contained of the stereocilium’s circumference on the negative side (opposite the kinocilium), and the other sector contained the remaining . Gold particle counts from each sector were entered into a spreadsheet program for analysis. Because the apical surface of a hair cell is not perfectly flat, the bases of stereocilia were not all in the same section. In mature hair bundles of the bullfrog saccule, moreover, stereocilia range in height from ∼4 to 9 μm. In the spreadsheet, therefore, we shifted columns of counts to align the bases of stereocilia before averaging and separately shifted the counts to align the tips. A total of 165,025 gold particles in 10 hair bundles were counted for this study.
RESULTS
Immunofluorescent localization of myosin-Iβ
The myosin-Iβ antibody, detected with a fluorescent secondary antibody, labeled the cytoplasm of frog saccular hair cells, with reduced labeling in the nucleus and cuticular plate (Fig.1B). Label was particularly high in the pericuticular necklace, a vesicle-rich zone between the cuticular plate and the apical circumferential actin band, which is thought to be a region of membrane trafficking (Hasson et al., 1997; Kachar et al., 1997; Richardson et al., 1997). Within a hair bundle, label was nearly absent from the lowest (proximal) third of each stereocilium and increased distally, with highest concentration at the tips of stereocilia (Fig. 1B). Label also appeared in the bulb of the kinocilium. Specific labeling of the tips of the stereocilia is similar to that reported previously for this antibody (Hasson et al., 1997), for a monoclonal antibody raised against bovine myosin-Iβ (Gillespie et al., 1993), and for anti-peptide antisera raised against frog myosin-Iβ (Metcalf, 1998).
Fig. 1.
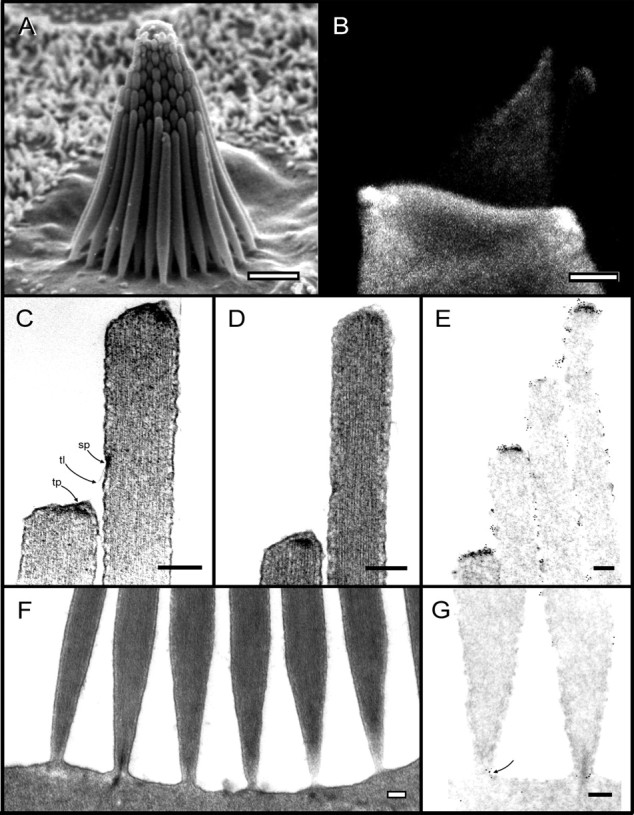
Morphology of bullfrog saccular hair bundles and labeling with antibody to myosin-Iβ. A, A saccular bundle typical of those in this study contains ∼60 stereocilia in nine columns. Lengths vary from ∼4 μm at the shorter (negative) edge to ∼8 μm at the taller (positive) edge. B, Labeling of a dissociated hair cell with an antibody to myosin-Iβ. The secondary antibody was labeled with Cy3; the image is a summation of a stack of confocal images through the middle 2 μm of the cell.C, D, Two examples of the tip link (tl) and the osmiophilic densities marking the tip-insertion plaque (tp) and side-insertion plaque (sp). E, Immunogold labeling of the tips of stereocilia with the myosin-Iβ antibody. Gold particles are present along the sides of stereocilia but appear more concentrated at the tip plaques and in a region near the side plaques.F, Example of the basal tapers of stereocilia and their insertions into the cuticular plate. Stereocilia are ∼150 nm in diameter where their rootlets insert into the cuticular plate, thicken to a maximum diameter of ∼550 nm ∼2 μm above the cuticular plate, and then narrow to a diameter of 300–400 nm at their distal tips.G, Immunogold labeling of the bases of stereocilia. Particles appear around the rootlet at the narrowest part of the taper where the rootlet enters the cuticular plate (arrow) but are otherwise scarce in the taper region. Scale bars: A,B, 2 μm; C–G, 200 nm. (PanelA was copyrighted by J. A. Assad and D. P. Corey and was reproduced with permission.)
Immunogold localization of myosin-Iβ
The actin within stereocilia is polarized such that myosins would tend to move upward, from proximal to distal, if allowed to move freely on stereocilia. Thus, any myosin isoform might naturally be expected to accumulate at the tips of stereocilia. If myosin-Iβ has a specific role in anchoring ion channels to the actin cores of stereocilia and in maintaining tip-link tension, it should appear more specifically at either end of the tip links.
For ultrastructural localization of myosin-Iβ, we labeled formaldehyde-fixed Triton-permeabilized sacculi with the myosin-Iβ antibody, followed by protein A coupled to 5-nm-gold particles. The tissue was then post-fixed with glutaraldehyde and osmium and sectioned for electron microscopy. Although the procedure produced good labeling of stereocilia (Fig. 1E), tip links were not visible, and the electron dense structures marking tip-link insertions were less apparent than in bundles rapidly fixed in glutaraldehyde (Fig.1C,D). In these sections, however, the position of each side plaque marking the upper end of each tip link can be inferred from the position of the shorter adjacent stereocilium. Tip links are uniformly ∼200 nm in length (before shrinkage) (Shepherd et al., 1991) so the side plaque is expected to occur ∼200 nm higher than the tip of the shorter adjacent stereocilium, at least when a tip link exists between two stereocilia.
In longitudinal sections of stereocilia, gold particles appeared along the sides of all stereocilia (Fig. 1E). Particles were not observed within the actin cores but occurred between the cores and the membranes. In the hair bundle, they were especially concentrated in two regions: at the tips of stereocilia, and on the sides in a region 200–500 nm up from the tip of the shorter adjacent stereocilium. These are generally the regions expected to contain the lower and upper insertions of tip links.
As expected from immunofluorescence localization, gold particles were nearly absent from the basal regions of stereocilia, especially in the region in which stereocilia taper toward their insertions into the cuticular plate (Fig. 1G). One striking exception was a ring of particles around each rootlet at the point where it enters the apical surface of the hair cell. In this region, particles did appear to be located within the actin cores; however, the stereocilium diameter at this point is not much greater than the thickness of a section so that particles encircling the core might appear to be within it. Indeed, in cross sections of rootlets (Fig.2B), it is clear that particles were around the cores.
Fig. 2.
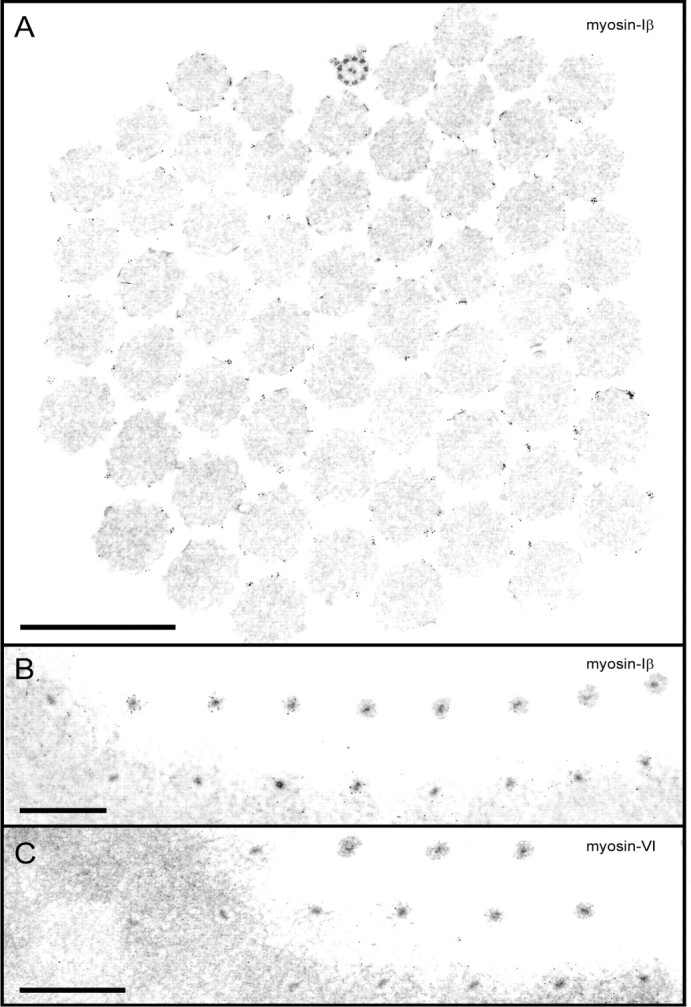
Immunogold labeling of stereocilia, sectioned horizontally. A, Myosin-Iβ antibody; section ∼2 μm above the cuticular plate. The orientation is provided by the conspicuous kinocilium at the top of the image so thattop is positive, bottom is negative, and tip links would run among stereocilia in a vertical column. Membranes were removed by detergent before labeling with primary antibody. Gold particles are visible around the actin cores of stereocilia but not within the cores. In sections of this height and higher, they often occur in clusters of two to six particles. B, Myosin-Iβ antibody; grazing section at the level of the cuticular plate. Rootlets are apparent as dense cores within stereocilia and are ringed with gold particles. Particles are concentrated but not clustered. Particles are not present a bit higher (top right) or a bit lower (bottom left) than the level of the apical surface. C, Myosin-VI antibody; grazing section at the level of the cuticular plate. Particles also appear concentrated around the stereocilia at the apical surface but do not ring the rootlet as tightly as for myosin-Iβ. Scale bars, 1 μm.
At the antibody concentration used (80 μg/ml), nonspecific binding might produce excessive background. This seems unlikely to be a problem, because nonspecific sites, if present, would also have to be absent in the taper region and because we observed a qualitatively similar distribution of particles with an antibody concentration of 10 μg/ml in preliminary studies.
Longitudinal distribution of myosin-Iβ within stereocilia
Because the gold particles marking myosin-Iβ immunoreactivity occurred throughout stereocilia, single images, such as Figure1E, are not sufficient to demonstrate a preferential concentration of myosin-Iβ at the insertions of tip links. To test the statistical significance of the concentration at insertions, we sectioned immunolabeled bundles transversely, perpendicular to the long axis. Serial sections were collected along the lengths of six bundles labeled with myosin-Iβ antibodies; two bundles labeled with anti-myosin-VI, and two bundles labeled with no primary antibody. We then counted the gold particles around each stereocilium of each cross section and recorded them in a spreadsheet for analysis. A typical section, taken ∼2 μm up from the basal ends of stereocilia, is shown in Figure 2A. Clusters of gold particles were observed around most stereocilia and were usually unambiguously associated with one or another stereocilium. The polarity of the bundle was identified by the microtubule-containing kinocilium (Fig. 2A, top) so the positions of tip links could be inferred, running among vertical columns of stereocilia. This bundle, for instance, contained nine columns of four to seven stereocilia each.
A grazing section at the level of the cuticular plate from the same bundle is shown in Figure 2B. Particles were observed within the cuticular plate and were seen in highest concentration around the rootlets at the point where they emerged from the plate.
To understand the longitudinal distribution of myosin-Iβ in stereocilia, we averaged the particle counts for all stereocilia in six bundles (see Materials and Methods). Averages, shown in Figure3, confirm the qualitative impression of myosin-Iβ distribution. There is a peak of six to seven particles per section in the section in which the stereocilia meet the cuticular plate (Fig. 3A) but otherwise very little label in the lower taper region (sections 2–10). The number of particles per section rises to a fairly constant value by the thickest part of the stereocilium, 20–30 sections from the base, and stays near that level as the sections approach the tips.
Fig. 3.
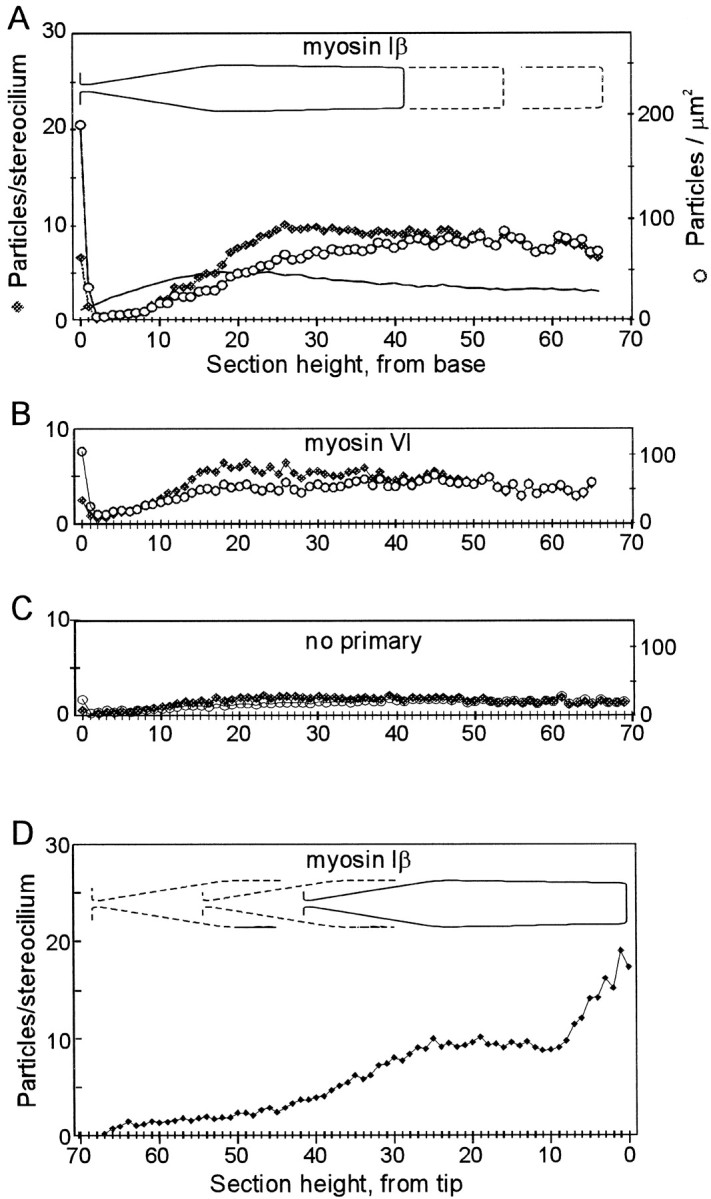
Distribution of gold particles along the lengths of stereocilia with stereocilia aligned by their bases (A–C) or by their tips (D). A, Myosin-Iβ antibody.Filled diamonds indicate the average number of gold particles per stereocilium in each section, averaged over all the stereocilia of six bundles. Open symbols indicate the density of particles per square micrometer of membrane, after correction for the taper of the stereocilia. The solid line shows the average diameter of stereocilia as a function of height, used for the area correction, with five on theleft axis representing 0.5 μm diameter.B, Myosin-VI antibody. Filled andopen symbols represent particles per section or per square micrometer for all stereocilia of one bundle. C, No primary antibody; two bundles. D, Myosin-Iβ antibody; average of six bundles with all stereocilia aligned by distal tips. Particle counts on the left half (sections 30–70 from the tip) are not particularly meaningful, because different regions of tapers were averaged together.
Are there fewer particles in the taper region simply because the area per section is less? To determine particles per unit area, we measured the diameters of 10 stereocilia from three bundles as a function of height. Most stereocilia are slightly club-shaped, as is apparent in Figure 1A, rising to a maximum diameter at the top of the basal taper and then thinning by ∼30% near the tips. Assuming that each section represents ∼100 nm of tissue thickness before shrinkage, we could calculate the particle density per square micrometer of membrane area. Plotted this way, the concentration at the lowest section is strikingly higher than elsewhere, and the absence of particles in the lower taper is still apparent (Fig. 3A). The concentration per unit area then rises monotonically toward the tips of stereocilia.
We performed a similar analysis on stereocilia aligned by their bases for an antibody raised against myosin-VI (Hasson and Mooseker, 1994) and for no primary antibody. The no primary control should reflect nonspecific binding of the protein A gold (Fig. 3C). Myosin-VI and myosin-VIIa are also present in stereocilia of the frog saccule (Hasson et al., 1997) but should have different distributions from myosin-Iβ if they have different functions. Myosin-VI also appeared highest at the level of the cuticular plate (Fig.3B) but is not so tightly grouped around each rootlet (Fig.2C) as is myosin-Iβ (Fig. 2B). The elevated concentration at this site is consistent with immunofluorescence observations but may be a consequence of the higher concentration of myosin-VI throughout the cuticular plate (Hasson et al., 1997). Elsewhere in the stereocilia, however, myosin-VI is at nearly uniform concentration when normalized for surface area.
When the stereocilia are aligned by their tips (Fig. 3D), it is apparent that the particle density was highest in the top 0.6–0.8 μm, as expected from fluorescence images such as Figure1B. In the shaft region, 1–3 μm down from the tip, the particle density was fairly constant at ∼10 particles per section. The drop in concentration further down (3–7 μm from the tip) probably reflects the low concentration in the tapered regions, because stereocilia of different lengths were averaged together. Thus, the meaningful region of this plot is restricted to the top 30 sections in which the diameters are nearly constant. The marked increase in myosin-Iβ immunoreactivity in the tips of stereocilia was not observed for myosin-VI or for the no primary control (see below). Thus, the high myosin-Iβ immunoreactivity at the tips of stereocilia is most likely related to its function within stereocilia.
Distribution of myosin-Iβ among stereocilia
We noticed that the density of particles in the shorter stereocilia seemed to be higher than in longer stereocilia. If myosin-Iβ is regulated to maintain a certain concentration in stereocilia, we would expect the density at equivalent points in different stereocilia to be similar. On the other hand, if each stereocilium has a certain amount of myosin-Iβ, then the concentration should be higher for shorter stereocilia. To test these hypotheses, we counted the total number of particles in each stereocilium and plotted it against the overall length of the stereocilium, measured in sections (Fig.4). Although there is considerable variability among stereocilia, there is no tendency for longer stereocilia to have more myosin-Iβ immunoreactivity (Fig.4A). Thus, the mechanism for targeting myosin-Iβ to stereocilia seems to put approximately the same amount in each stereocilium. Because all stereocilia have few particles in the basal taper region, the shortest stereocilia (with only ∼2 μm in length above the taper region) tend to have a much higher concentration in the upper part than do longer stereocilia.
Fig. 4.

Number of particles in each stereocilium as a function of stereocilium length. A, Myosin-Iβ antibody. The line is a least-squares fit to the data and indicates no significant correlation of particle number with length; long stereocilia do not seem to have more myosin-Iβ than short stereocilia. B, Myosin-VI antibody. A least-squares fit indicates a significant correlation with length at the p < 10−15 level.
A different result was seen for myosin-VI. Longer stereocilia tended to have proportionately more myosin-VI immunoreactivity than shorter stereocilia (Fig. 4B), suggesting that myosin-VI is distributed to maintain a certain concentration.
Clustering of myosin-Iβ
In Figure 2A, which shows a section taken ∼2 μm from the base of the bundle, gold particles often appear to occur in clusters. Clustering might result from clumping of protein A gold, from clumping of the primary antibody, from multiple antibodies in the antiserum binding to different epitopes on a single myosin-Iβ molecule, or from clustering of myosin-Iβ molecules themselves. At the level of the cuticular plate, however, gold particles occurred in clusters less frequently (Fig. 2B), suggesting that the clustering is not caused by clumping of protein A, clumping of the primary antibody, or by multiple epitopes. To determine whether the clustering was statistically significant, we counted the number of particles in a cluster at different heights: for 21 stereocilia labeled with myosin-Iβ antibody, for 27 stereocilia labeled with myosin-VI antibody, and for 21 stereocilia with no primary antibody. Particles were considered to be in a cluster if they were separated by less than two particle diameters (∼10 nm). For statistical analysis, we combined data from ten sections so that data were placed into seven groups, each representing increments in height of ∼1 μm.
Figure 5 shows histograms for three representative groups containing data from the first, third, and fifth micrometer of stereocilium height and a histogram derived from a theory that assumes random distribution of particles. Each histogram in Figure5 shows the clustering in two ways: the striped bar is the proportion of clusters of a certain size, and the solid bar is the proportion of particles that occurs in a cluster of a certain size. The second method tends to reveal large clusters, because a cluster of six particles, for instance, would be counted once by the first method and six times by the second.
Fig. 5.

Clustering of gold particles at different heights. In each panel, the striped bar indicates the proportion of clusters containing the indicated numbers of particles, and the solid bar indicates the proportion of particles in a cluster of a certain size. A, Myosin-Iβ antibody; sections 1–10, counting from stereocilia bases.B, Sections 21–30. C, Sections 41–50.D, Apparent clustering assuming random juxtaposition of particles expected from the average density in sections 41–50 (from Fig. 3A). The clustering observed in Band C is apparently not random. E–H, Myosin-VI antibody; clusters scored at the same height. Clustering observed in F and G is not substantially different from that occurring at random.
The histograms confirm the impression of clustering higher in the bundle. In the first micrometer, more than two-thirds of particles occurred as isolated particles (Fig. 5A), whereas fewer than a third were isolated particles in the third or fifth micrometers (Fig.5B,C). Conversely, in the first micrometer, <7% occurred in clusters of four or more, whereas 24 and 32% were in clusters of four or more in the third or fifth micrometers, respectively. Groups above the second micrometer appeared similar in their extent of clustering.
Is the apparent clustering a consequence of higher number of particles in the upper regions of stereocilia so that particles are more likely to fall randomly near another particle? We compared the results to a simple theory in which 10 particles (the average density in upper sections) fall randomly on the perimeter of a stereocilium and are scored for clustering by our criteria. The probabilities are shown in Figure 5D. The theory predicts that nearly two-thirds of particles would be scored as singles if they were truly independent, and <1% would randomly occur in clusters of four or more. We also looked for clustering of myosin-VI immunoreactivity by this method (Fig. 5E–H). In contrast to myosin-Iβ, myosin-VI antibodies did not seem to show significant clustering above that expected from random distribution at any height in the stereocilia. Thus, particles associated with the myosin-Iβ antibody cluster significantly in the upper part but not the lower part of stereocilia, suggesting that myosin-Iβ molecules are more aggregated above the taper region.
Localization at tip-link insertions
The marked increase in immunogold label we observed in the distal 0.8 μm of the stereocilia is not sufficient to identify myosin-Iβ as the adaptation motor. If myosin-Iβ anchors transduction channels to the actin cores of stereocilia and serves to regulate tip-link tension, it should be located specifically near either end of tip links. We would then expect a difference in myosin-Iβ density between the positive side of a stereocilium, from which a tip link rises to the next taller stereocilium, and the negative side, which receives a tip link from the next shorter stereocilium, somewhat down from the tip.
To detect such a difference, each stereocilium was divided into two sectors: one encompassing of the diameter on the negative side, which would contain the side plaque, and one encompassing the remaining of the diameter, which would contain the tip plaque. Particles were counted separately for the two sectors and normalized for surface area. Because we could reliably infer the position of the side plaque as approximately two sections from the tip of the shorter adjacent stereocilium (see Materials and Methods), sections could be aligned by either tips or side plaques. These alignments are shown in Figure 6.
Fig. 6.

Distribution of gold particles along the lengths of stereocilia, with stereocilia aligned by the inferred position of the side-insertion plaques (A–D) or by the tips (E–H). Data for the negative side section ( ) are connected by dashed lines; those for the positive side section ( ) are connected by solid lines. Sections are illustrated in cross-section inA (left). Particles per stereocilium were calculated for each sector of each section, and sections were normalized to full circumference; thus, 10 particles per stereocilia per section corresponds to a surface density of ∼90 particles/μm2. A, Illustration of alignment by side plaques. Stereocilia ended about six sections above the side plaque, on average. B, Antibody to myosin-Iβ. At each height, the density of particles in the negative side section was 60–90% higher than in the remaining circumference, over a length of ∼700 nm around the side plaques. C, Antibody to myosin-VI. D, No primary antibody. Distribution of protein A gold apparently reflects surface area. E, Illustration of alignment by tips. Inferred positions of side plaques are plotted in F and indicated by the filled circles. F, Antibody to myosin-Iβ. The density on the positive side rose abruptly in the most distal two sections and fell on the negative side. G, Antibody to myosin-VI.H, No primary antibody. No such dichotomy was observed for myosin-VI. Error bars represent the maximum mean ± SE for each sector.
When the sections were aligned by side plaques for averaging (Fig.6A), the density of particles was generally constant and similar for both sectors until the distal micrometer of the stereocilia. Then, for a 700 nm region centered approximately one section above the inferred side-plaque position, the density on the negative rose to nearly twice that of the positive (Fig. 6B). No such rise was observed for stereocilia labeled with myosin-VI antiserum (Fig. 6C) or with no primary antibody (Fig. 6D). Closer to the tips, the concentration on the negative side fell, whereas that on the positive side rose.
Because the distance from the side plaques to the tip of a stereocilium is somewhat variable, alignment by side plaques does not properly illustrate the concentrations at the very tips. Thus, we also aligned the particle counts by the tips of stereocilia for averaging (Fig.6E). Again, counts were similar between sectors until the distal micrometer. In this plot (Fig. 6F), the particle density in the positive sector is seen to rise most dramatically in the final two sections (∼200 nm), and the density in the negative sector is seen to fall in the same region. The inferred positions of side plaques are shown in Figure 6F; they occur, on average, six sections down from the tip. Again, no such rise was observed for stereocilia labeled with myosin-VI antiserum (Fig. 6G) or with no primary antibody (Fig.6H).
We have also analyzed two bundles in which the stereocilia were divided into six sectors of each. In these, the variability in density was larger, because we had fewer bundles divided into more sectors, but the trend was the same. In particular, the density at the very tip was highest in the sixth at the positive edge (where the tip link inserts) and less in the sixths at the sides (data not shown).
[The shape of stereocilia tips creates a possible artifact for one point in Figure 6, right plots. Although some tips are relatively square (Fig. 1C), others are slanted or rounded such that the positive side is taller than the negative side (Fig.1D). The slant is not caused simply by the nipple of membrane seen at the lower end of tight tip links but includes a slanted actin core as well. Thus, a section passing through the very tip might include material in the positive sector but nothing in the negative . A lack of particles in the negative could reflect a lack of stereocilium rather than a lack of myosin-Iβ. Thus, the top-most point on the negative side is less reliable than others and was not plotted. On the other hand, longitudinal sections (Fig. 1E) also showed a similar lack of particles at the very tip of the negative side.]
In general, the quantitative differences between locations in stereocilia expected to contain upper and lower tip-link insertions are consistent with a specific localization of myosin-Iβ at either end of the tip link. A graphical summary of the data are shown in Figure7 in which the concentration of myosin-Iβ immunoreactivity is shown as density of shading. A transmission electron micrograph is reproduced at the same scale for comparison. The concentration is highest in two locations: on the negative side in a fairly broad region centered around the side plaque, and on the positive side at the very tip, near the tip plaque.
Fig. 7.
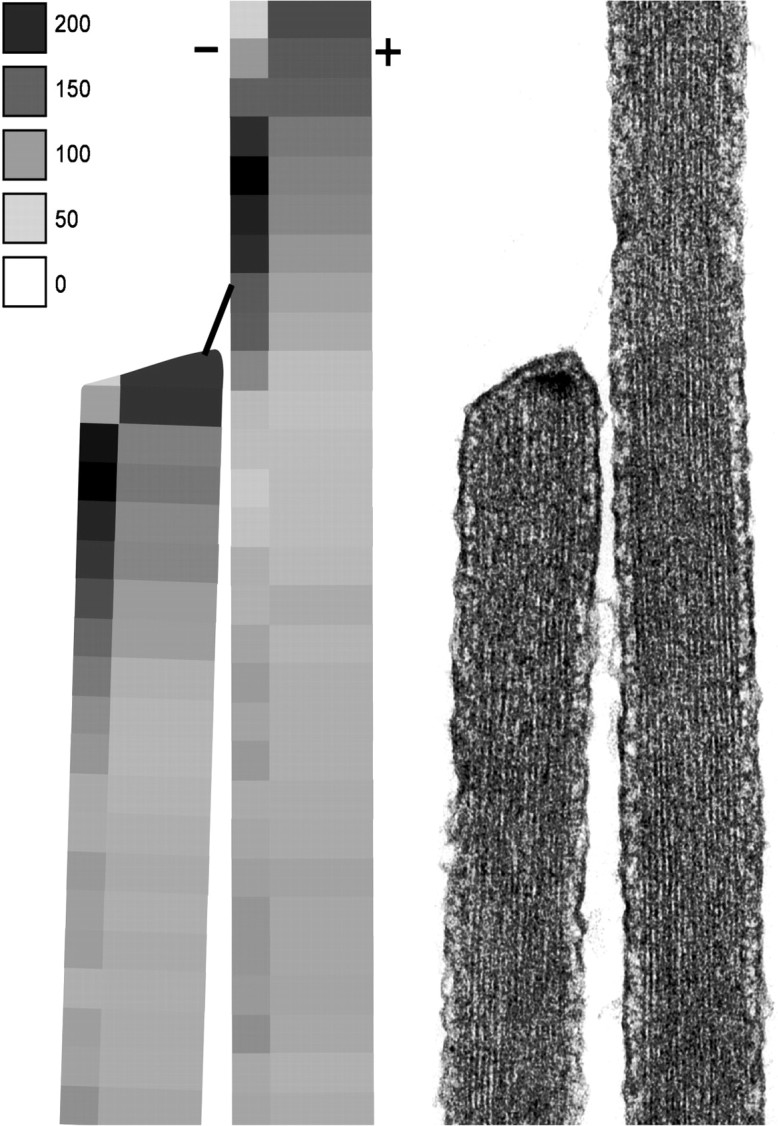
Summary of the data from Figure 6 for myosin-Iβ immunoreactivity. The intensity scale indicates particles per square micrometer.
Testing the localization of myosin 1β at side plaques
Because the electron-dense structure marking the side insertion is typically 30–50 nm across, it is surprising to find myosin-Iβ immunoreactivity in a band extending almost 700 nm along the negative side of each stereocilium. It is possible that our estimation of side insertion position is inaccurate and that the alignment by insertion smeared the true distribution. However, when plaques were clearly visible, they always occurred within one section of the inferred position. It is also possible that only some tip links are intact and that motors broken loose from a transduction complex tend to accumulate several hundred nanometers closer to the tips. Finally, it is possible that the adaptation motor is a more broadly distributed structure and that the specific electron density only reflects one element of the motor. In any case, we sought to test further the association of myosin-Iβ immunoreactivity with motor function.
The data in Figure 6 are averages of stereocilia both with and without visible side plaques, and perhaps some of those not clearly visible were missing altogether. We therefore asked whether the particle density would be higher at clearly identified side plaques. Comparisons were made in two ways. In one test, we compared negative and positive sectors for three bundles (Fig.8A) and found that the density of particles at visible side plaques (negative sectors) was almost 300% higher than positive sectors of the same sections. In the averages of all stereocilia (Fig. 6B), the density at inferred side plaques was only 70% higher. In another test, we compared negative sectors for stereocilia with and without visible side plaques for two bundles. Stereocilia that contained a visible side plaque had a 71 ± 14% higher density of particles within 150 nm of the side plaque than at the equivalent location in stereocilia without a visible plaque (data not shown).
Fig. 8.

Tests of the specificity of myosin-Iβ immunoreactivity. A, Density of particles at morphologically identified side-insertion plaques. Filled bars represent the negative sector; open bars represent the positive sector. Particles were counted in one section each of 19 stereocilia of three bundles. The particle density at identified side plaques is higher than for all stereocilia averaged. B, Particle density for the shortest stereocilia, aligned by tips. The shortest stereocilium of each column (n = 53 from about nine columns in each of six bundles) was selected for averaging and analyzed as for Figure6. Whereas the positive sector showed a rise in density at the very tips that matched that of all stereocilia, the negative sector (which would not contain a side plaque) was not significantly different from the positive sector over most of the length. Both sectors showed a decline in the taper region, as expected from Figure 3. Error bars represent the maximum mean ± SE for each sector.
Finally, we reasoned that the shortest stereocilia of each bundle should differ from all others, because they have no tip link inserting into a side density and might have no special concentration of particles along the negative side. Thus, we identified all the shortest stereocilia in six bundles and averaged their distributions separately. Figure 8B shows the concentrations, with the sections aligned by tips. (These stereocilia, of course, could not be aligned by side inserts.) Two features of the distribution are striking. Like all other stereocilia, the concentration on the positive side rises at the very tips where we would expect the lower insertion of a tip link extending to the next taller stereocilium. On the other hand, the negative side shows a concentration not significantly different from the positive side, in the region in which other stereocilia have their highest concentration and most conspicuous difference. Thus, the high concentration of myosin-Iβ immunoreactivity is associated with a tip-link insertion.
DISCUSSION
Myosin-Iβ immunoreactivity is high at both ends of tip links
Where exactly should we expect to find myosin-Iβ? A myosin-mediating adaptation may serve two functions. First, it would be the force-producing protein of the adaptation motor. If the major constituents of the motor are incorporated within the side plaque, myosin-Iβ should be in or near the plaque. Second, and more generally, myosin-Iβ should help anchor the transduction channels to the actin cores of stereocilia to prevent tip-link tension from pulling channels out of the plasma membrane. Transduction channels are likely to be placed at both ends of tip links (Denk et al., 1995), so we might expect myosin-Iβ to anchor the channels at the lower ends of the tip links where they insert into the tips of stereocilia, and thus to be present in the tip plaques as well.
We found that the density of myosin-Iβ immunoreactivity is highest at the distal 0.8 μm of stereocilia, consistent with studies using fluorescence microscopy and a variety of antibodies to myosin-Iβ (Gillespie et al., 1993; Hasson et al., 1997; Metcalf, 1998). Electron microscopy revealed that the density is not homogeneous around the circumference of the tips. On the positive side of each stereocilium, the density is highest in the top 0.2 μm, near the lower insertion of a tip link (Fig. 7). On the negative side, the highest density occurs in a band of about seven sections (∼700 nm), with the center of the band approximately coincident with the inferred positions of the side plaques marking the upper insertion of tip links. Additional tests support the idea that myosin-Iβ immunoreactivity is specifically associated with the side plaques, which is consistent with the proposal that myosin-Iβ is the motor protein of the adaptation apparatus.
If myosin-Iβ is associated with the motor, why is its distribution broader than the size of the side plaque? It may be that the motor apparatus is somewhat diffuse; myosin-Iβ might attach to a tether or harness protein, and these proteins might attach to the osmiophilic plaque. Thus, the plaque might represent only the most condensed part of the motor. If all myosin molecules in the side-plaque region are active components of the motor, we might expect them to be mostly above the side plaque, because they would all be attempting to climb upward and would be restrained only by the tethers. The observed distribution is consistent with this idea. Alternatively, myosin-Iβ might collect in the vicinity of the motor and there might be some equilibrium association with the active motor that is contained entirely within the plaque. Previous experiments indicating that only about half of the tip links are intact in this preparation of bullfrog saccule (Assad et al., 1991; Denk et al., 1995) and that intentionally cut tip links of chicken hair cells can regenerate in 10–15 hr (Zhao et al., 1996) suggest a dynamic assembly and disassembly of the channel–motor complex. Similarly, myosin-Iβ molecules above the side plaque might have been part of a motor complex that climbed and dispersed after loss of its tip link.
Myosin-Iβ is also concentrated at the rootlet
Although our focus was primarily directed at the tips of stereocilia, we found also a particular concentration of gold particles at the very bases of stereocilia, exactly where the narrow rootlet enters the apical surface of the hair cell. At one section above or below this point, the concentration dropped to near zero. Adjusted for surface area, the concentration at this point was as high or higher than at the tip-link insertion plaques. We can only speculate about the function of this small group of myosin-Iβ molecules. They may constitute a barrier that prevents excessive myosin-Iβ or other myosin isozymes in the cell body from ascending the actin filaments of the stereocilia. They may provide structural support, linking the rootlets to the actin of the cuticular plates. Finally, they may represent a reserve of myosin-Iβ involved in normal turnover of the adaptation complex.
Myosin-Iβ clusters in more distal regions of stereocilia
In cross-sections of hair bundles above the taper region, gold particles labeling the myosin-Iβ antibody clearly tended to cluster (Fig. 2). The clustering was statistically significant above the taper region but not significantly different from random in the lowest 1 μm of the stereocilia. This argues against clustering that results from clumping of protein A gold, from clumping of the myosin-Iβ antibody, or from the polyclonal antibodies binding to multiple epitopes of a single myosin-Iβ molecule. Instead, it suggests that myosin-Iβ itself tends to self-associate and does so as it ascends a stereocilium. Indeed, the recombinant tail of myosin-Iβ has been shown to aggregate in vitro (R.A. Dumont and P.G. Gillespie, unpublished data). Such aggregation might play a role in assembly of the motor complex.
Myosin-Iβ is uniformly allocated among stereocilia but inhomogeneously distributed within them
The number of gold particles per stereocilium varied considerably among stereocilia but did not demonstrate any significant correlation with length; that is, short stereocilia had as much total myosin-Iβ immunoreactivity as long stereocilia, on average. If stereocilia have a certain number of myosin-Iβ binding sites per unit length (for instance, actin monomers) and the cell inserts enough myosin to fill those sites, taller stereocilia should have had more myosin-Iβ. In contrast to myosin-Iβ, total myosin-VI immunoreactivity did show a correlation with length. It appears, therefore, that a cell puts a certain amount of myosin-Iβ into each stereocilium, and the distribution within the stereocilium then depends on factors secondary to the allocation mechanism. Allocation of myosin-VI may follow a different mechanism.
Within a stereocilium, the myosin-Iβ immunoreactivity (normalized for surface area) rises uniformly from the taper region to a height of 4–5 μm and then plateaus. Even apart from the density at insertion plaques, myosin-Iβ is not randomly distributed within a stereocilium. It may be that the normal motor activity of myosin-Iβ and the polarity of the actin causes accumulation toward the tips. Alternatively, binding sites on actin filaments may be more exposed toward the tips; for instance, myosin-Iβ might not bind the pointed ends of actin in the taper region but might bind or accumulate at the barbed ends of actin filaments that occur as stereocilia decrease in diameter distally. Finally, the distribution of myosin-Iβ may not represent static binding sites so much as its dynamic turnover in the stereocilium.
Insertion plaques are associated with dozens of myosin-Iβ molecules
The amount of myosin-Iβ has been estimated by biochemical methods at ∼500 molecules per stereocilium (Gillespie et al., 1993). The particle counts described here suggest that the amount may be higher. We observed ∼400 particles per stereocilium. The cluster analysis, specifically the lack of clustering in the taper region, provides evidence that an individual myosin-Iβ molecule is not associated with more than one protein A gold particle. Because it is unlikely that every myosin-Iβ molecule had an antibody bound to it, the number of myosin-Iβ molecules per stereocilium is probably several-fold higher than 400. Of these particles, ∼40 were broadly associated with the insertion densities. With adjustment for labeling efficiency, it appears that there are at least several dozen myosin-Iβ molecules associated with the adaptation motor. This estimate fits well with those in previous studies (Hudspeth and Gillespie, 1994).
Footnotes
This work was supported by a National Institute of Neurological Disorders and Stroke Minority Predoctoral National Research Service Award (to J.A.G.) and by National Institutes of Health Grants DC00304 (to D.P.C.) and DC02368 (to P.G.G.). D.P.C. is an Investigator of the Howard Hughes Medical Institute. We especially thank Abigail Peterson for counting gold particles and appreciate comments on this manuscript from Eunice Cheung and Drs. Jaime García-Añoveros, Jeffrey R. Holt, and Emily R. Liman. We thank Dr. Tama Hasson (Yale University) for the gift of the myosin-VI antibody.
Correspondence should be addressed to David P. Corey, WEL414, Massachusetts General Hospital, Boston, MA 02114.
REFERENCES
- 1.Assad JA, Corey DP. An active motor model for adaptation by vertebrate hair cells. J Neurosci. 1992;12:3291–3309. doi: 10.1523/JNEUROSCI.12-09-03291.1992. [DOI] [PMC free article] [PubMed] [Google Scholar]
- 2.Assad JA, Shepherd GMG, Corey DP. Tip-link integrity and mechanical transduction in vertebrate hair cells. Neuron. 1991;7:985–994. doi: 10.1016/0896-6273(91)90343-x. [DOI] [PubMed] [Google Scholar]
- 3.Barylko B, Wagner MC, Reizes O, Albanesi JP. Purification and characterization of a mammalian myosin I. Proc Natl Acad Sci USA. 1992;89:490–494. doi: 10.1073/pnas.89.2.490. [DOI] [PMC free article] [PubMed] [Google Scholar]
- 4.Burlacu S, Tap WD, Lumpkin EA, Hudspeth AJ. ATPase activity of myosin in hair bundles of the bullfrog’s sacculus. Biophys J. 1997;72:263–271. doi: 10.1016/S0006-3495(97)78665-X. [DOI] [PMC free article] [PubMed] [Google Scholar]
- 5.Denk W, Holt JR, Shepherd GMG, Corey DP. Calcium imaging of single stereocilia in hair cells: localization of transduction channels at both ends of tip links. Neuron. 1995;15:1311–1321. doi: 10.1016/0896-6273(95)90010-1. [DOI] [PubMed] [Google Scholar]
- 6.Eatock RA, Corey DP, Hudspeth AJ. Adaptation of mechanoelectrical transduction in hair cells of the bullfrog’s sacculus. J Neurosci. 1987;7:2821–2836. doi: 10.1523/JNEUROSCI.07-09-02821.1987. [DOI] [PMC free article] [PubMed] [Google Scholar]
- 7.Flock A, Cheung HC, Flock B, Utter G. Three sets of actin filaments in sensory cells of the inner ear: identification and functional orientation determined by gel electrophoresis, immunofluorescence, and electron microscopy. J Neurocytol. 1981;10:133–147. doi: 10.1007/BF01181749. [DOI] [PubMed] [Google Scholar]
- 8.García JA, Yee AG, Hasson T, Gillespie PG, Corey DP (1997) Localization of myosin 1b in frog saccular hair cells using confocal and immunoelectron microscopy. 20th Midwinter Research Meeting [Abstr] 929:92.
- 9.Gillespie PG, Corey DP. Myosin and adaptation by hair cells. Neuron. 1997;19:955–958. doi: 10.1016/s0896-6273(00)80387-6. [DOI] [PubMed] [Google Scholar]
- 10.Gillespie PG, Wagner MC, Hudspeth AJ. Identification of a 120 kDa hair-bundle myosin located near stereociliary tips. Neuron. 1993;11:581–594. doi: 10.1016/0896-6273(93)90071-x. [DOI] [PubMed] [Google Scholar]
- 11.Gillespie PG, Hasson T, García JA, Corey DP. Multiple myosin-isozymes and hair-cell function. Cold Spring Harbor Symp Quant Biol. 1996;61:309–317. [PubMed] [Google Scholar]
- 12.Hasson T, Mooseker MS. Porcine myosin-VI: characterization of a new mammalian unconventional myosin. J Cell Biol. 1994;127:425–440. doi: 10.1083/jcb.127.2.425. [DOI] [PMC free article] [PubMed] [Google Scholar]
- 13.Hasson T, Gillespie PG, García JA, MacDonald RB, Zhao Y-D, Yee AG, Mooseker MS, Corey DP. Unconventional myosins in inner-ear sensory epithelia. J Cell Biol. 1997;137:1287–1307. doi: 10.1083/jcb.137.6.1287. [DOI] [PMC free article] [PubMed] [Google Scholar]
- 14.Howard J, Hudspeth AJ. Mechanical relaxation of the hair bundle mediates adaptation in mechanoelectrical transduction by the bullfrog’s saccular hair cell. Proc Natl Acad Sci USA. 1987;84:3064–3068. doi: 10.1073/pnas.84.9.3064. [DOI] [PMC free article] [PubMed] [Google Scholar]
- 15.Howard J, Hudspeth AJ. Compliance of the hair bundle associated with gating of mechanoelectrical transduction channels in the bullfrog’s saccular hair cell. Neuron. 1988;1:189–199. doi: 10.1016/0896-6273(88)90139-0. [DOI] [PubMed] [Google Scholar]
- 16.Hudspeth AJ, Gillespie PG. Pulling springs to tune transduction: adaptation by hair cells. Neuron. 1994;12:1–9. doi: 10.1016/0896-6273(94)90147-3. [DOI] [PubMed] [Google Scholar]
- 17.Kachar B, Battaglia A, Fex J. Compartmentalized vesicular traffic around the hair cell cuticular plate. Hear Res. 1997;107:102–112. doi: 10.1016/s0378-5955(97)00027-0. [DOI] [PubMed] [Google Scholar]
- 18.Metcalf AB. Immunolocalization of myosin-Iβ in the hair cell’s hair bundle. Cell Motil Cytoskeleton. 1998;39:159–165. doi: 10.1002/(SICI)1097-0169(1998)39:2<159::AID-CM6>3.0.CO;2-1. [DOI] [PubMed] [Google Scholar]
- 19.Pickles JO, Comis SD, Osborne MP. Cross-links between stereocilia in the guinea pig organ of Corti, and their possible relation to sensory transduction. Hear Res. 1984;15:103–112. doi: 10.1016/0378-5955(84)90041-8. [DOI] [PubMed] [Google Scholar]
- 20.Richardson GP, Forge A, Kros CJ, Fleming J, Brown SD, Steel KP. Myosin VIIA is required for aminoglycoside accumulation in cochlear hair cells. J Neurosci. 1997;17:9506–9519. doi: 10.1523/JNEUROSCI.17-24-09506.1997. [DOI] [PMC free article] [PubMed] [Google Scholar]
- 21.Shepherd GMG, Assad JA, Parakkal M, Kachar B, Corey DP. Movement of the tip-link attachment is correlated with adaptation in bullfrog saccular hair cells. J Gen Physiol. 1991;95:25A. [Google Scholar]
- 22.Solc CK, Derfler BH, Duyk GM, Corey DP. Molecular cloning of myosins from bullfrog saccular macula: a candidate for the hair cell adaptation motor. Auditory Neurosci. 1994;1:63–75. [Google Scholar]
- 23.Zhao Y, Yamoah EN, Gillespie PG. Regeneration of broken tip links and restoration of mechanical transduction in hair cells. Proc Natl Acad Sci USA. 1996;93:15469–15474. doi: 10.1073/pnas.93.26.15469. [DOI] [PMC free article] [PubMed] [Google Scholar]