Abstract
Analysis of cone inputs to primate parvocellular ganglion cells suggests that red–green spectral opponency results when connections segregate input from long wavelength (L) or middle wavelength (M) sensitive cones to receptive field centers and surrounds. However, selective circuitry is not an obvious retinal feature. Rather, cone receptive field surrounds and H1 horizontal cells get mixed L and M cone input, likely indiscriminately sampled from the randomly arranged cones of the photoreceptor mosaic. Red–green spectral opponency is consistent with random connections in central retina where the mixed cone ganglion cell surround is opposed by a single cone input to the receptive field center, but not in peripheral retina where centers get multiple cone inputs. The selective and random connection hypotheses might be reconciled if cone type selective circuitry existed in inner retina. If so, the segregation of L and M cone inputs to receptive field centers and surrounds would increase from horizontal to ganglion cell, and opponency would remain strong in peripheral retina. We measured the relative strengths of L and M cone inputs to H1 horizontal cells and parasol and midget ganglion cells by recording intracellular physiological responses from morphologically identified neurons in an in vitro preparation of the macaque monkey retina. The relative strength of L and M cone inputs to H1 and ganglion cells at the same locations matched closely. Peripheral midget cells were nonopponent. These results suggest that peripheral H1 and ganglion cells inherit their L and M cone inputs from the photoreceptor mosaic unmodified by selective circuitry.
Keywords: parasol ganglion cell, midget ganglion cell, H1 horizontal cell, red/green spectral opponency, primate, physiology
Introduction
Neurons of the parvocellular laminae of the lateral geniculate nucleus (LGN) are driven by input from the midget retinal ganglion cells. Most of the parvocellular neurons that map to central retina respond with opposite polarities when the retina is stimulated with long versus middle wavelength light (Wiesel and Hubel, 1966; De Valois et al., 1966; Gouras, 1968; De Monasterio and Gouras, 1975; De Monasterio et al., 1975; De Monasterio, 1978; Derrington et al., 1984; Lankheet et al., 1998a). Recent studies strongly suggest that red–green spectral opponency results when the center of the receptive field of a parvocellular neuron gets exclusive input from either the long wavelength sensitive (L) or middle wavelength sensitive (M) cones while the concentric, spatially antagonistic receptive field surround gets exclusive input from the opposite cone type. In the central visual field, Reid and Shapley (1992, 2002) found that 80% of the parvocellular LGN neurons showed center surround segregation of L and M cone input. Lee et al. (1998) reported a similarly high proportion of opponent retinal ganglion cells. In the peripheral retina between 20 and 50 degrees of eccentricity, Martin et al. (2001) found that 80% of tonically responding, presumably midget, ganglion cells were opponent. These data are consistent with a “selective connection” model (Wiesel and Hubel, 1966; Reid and Shapley, 1992, 2002; Lee et al., 1998; Martin et al., 2001) of spectral opponency that hypothesizes cone type-specific connections to receptive field centers and surrounds. In central retina, where the receptive field centers of midget ganglion cells get input from single cones (Milam et al., 1993; Wässle et al., 1994; Calkins et al., 1994), segregation of cone types to center and surround requires selective connections only for the surround. In peripheral retina, where midget ganglion cell centers get input from multiple cones, segregation requires selective connections for the center as well.
On the other hand, the circuitry required by the selective connection model is not an obvious feature of retinal organization. Rather, evidence suggests that signals from the randomly arranged L and M cones (Mollon and Bowmaker, 1992; Packer et al., 1996; Roorda et al., 2001) are mixed at the first retinal synapse. Verweij et al. (2003) showed that the receptive fields of individual cone photoreceptors have surrounds that get mixed L and M cone input. H1 horizontal cells, thought to contribute to the inhibitory surrounds of midget bipolar and ganglion cells, get nonselective input from L and M cones (Wässle et al., 1989; Dacheux and Raviola, 1990; Goodchild et al., 1996; Dacey et al., 1996, 2000b). There is no evidence that midget bipolar cells, which are the middle elements in the private line connections from cones to midget ganglion cells, have selective surround circuitry. Additionally, during development, bipolar dendrites are stratified in the outer plexiform layer and synaptic markers are present well before L or M cone opsins are expressed, consistent with the formation of retinal circuitry before cone type is established (Okada et al., 1994; Bumsted et al., 1997). Finally, psychophysically measured red–green color sensitivity decreases more rapidly with increasing retinal eccentricity than would be expected from the loss of achromatic sensitivity (Mullen, 1991; Mullen and Kingdom, 1996, 2002). These data are consistent with a “random connection” model of spectral opponency (Lennie, 1980; Paulus and Kroger-Paulus, 1983; Shapley and Perry, 1986; Lennie et al., 1991; Mullen and Kingdom, 1996), according to which horizontal and bipolar cells indiscriminately contact the L and M cones in the photoreceptor mosaic that lie adjacent to their dendritic fields. Red–green spectral opponency results when the single cone input to the receptive field centers of central midget cells is opposed by a surround that gets mixed L and M cone input. This model predicts similar L and M cone input ratios for any horizontal cell, bipolar cell, or ganglion cell at the same retinal location. It also predicts that substantial individual variability in L and M cone input strength will result from the large range of relative L and M cone numbers in normal individuals (Vimal et al., 1989; Wesner et al., 1991; Roorda et al., 2001). Finally, it predicts a decline in opponency with increasing eccentricity as increasing numbers of cone inputs to center and surround drive the relative numbers of L and M cones toward that of the cone mosaic as a whole (Mullen and Kingdom, 1996).
If midget ganglion cell centers and surrounds get pure cone inputs, whereas H1 horizontal cells and bipolar cells get mixed L and M cone inputs, then cone type selectivity must be established elsewhere. It is possible that amacrine cells play a role in surround formation (Demb et al., 1999; Taylor, 1999; Flores-Herr et al., 2001). Although available evidence favors their nonselectivity (Calkins and Sterling, 1996), many amacrine cell types remain poorly characterized. If inner retinal circuitry exhibited cone type selectivity, L and M cone inputs to ganglion cell centers and surrounds would be more segregated than inputs to horizontal cells. The first goal of these experiments was to determine if this was true. The second goal was to make additional measurements of midget cell opponency to determine if careful morphological identification and a comprehensive evaluation of red–green opponency would confirm previous peripheral measurements (Lee et al., 1998; Martin et al., 2001) that support the selective connection model or result in weak opponency consistent with the random connection model. Peripheral retina is a good location for these measurements because the strength of opponency predicted by the two models diverges with increasing eccentricity.
Intracellular recordings were made from morphologically identified midget and parasol ganglion cells in the periphery of the in vitro macaque retina (Dacey and Lee, 1994). We measured responses to stimuli that systematically varied in L and M cone contrast and evaluated the relative sign and strength of L and M cone input to the receptive field (Dacey et al., 2000b). In many cases, we recorded from midget and parasol cells sequentially at the same retinal location. Peripheral midget cells always summed L and M cone input and the relative strength of those inputs was highly correlated with those of neighboring nonopponent parasol cells. Thus, although the relative weight of L and M cone input to the midget receptive field varied from cell to cell, this variability was closely matched by that of parasol cells with overlapping receptive fields. Finally, we compared the relative strengths of L and M cone inputs to ganglion cells to the inputs to H1 horizontal cells, whose dendrites sum input from L and M cones (Dacey et al., 1996). The relative strengths of L and M cone input to H1 cells also varied from cell to cell (Dacey et al., 2000b) but were highly correlated with the inputs to ganglion cells at the same retinal locations. The simplest explanation for these results is that, for both the midget and parasol cells of inner retina and the H1 horizontal cells of outer retina, responses reflect the local ratio of L and M cones in the photoreceptor mosaic unmodified by cone type-selective circuitry.
Materials and Methods
Tissue preparation. H1 horizontal cells, midget ganglion cells, and parasol ganglion cells were recorded in an in vitro preparation of intact primate (Macaca nemestrina, Macaca fascicularis, Papio c. anubis) retina using methods described in detail elsewhere (Dacey et al., 2000b). Retinas were obtained through the Tissue Distribution Program at the Regional Primate Research Center at the University of Washington. Eyes were enucleated under deep barbiturate anesthesia. The retina was dissected as a unit from the sclera, flattened by making radial cuts, glued ganglion cell side up to the bottom of a recording chamber mounted on the stage of a light microscope, and superfused with oxygenated Ames medium (Sigma, St. Louis, MO). The fluorescent dyes 4,6 diamidino-2-phenylindole (DAPI) (10 μm) and acridine orange selectively stained H1 horizontal and ganglion cell somas, respectively. Targeted cells were recorded with high-resistance (>200 MΩ) glass microelectrodes filled with 2–3% Neurobiotin (Vector Laboratories, Burlingame, CA) and 1–2% pyranine (Molecular Probes, Eugene, OR) in 1 m KCl. Cell type was confirmed visually by iontophoresis of pyranine. Neurobiotin was iontophoretically injected (+0.1–0.2 nA; ∼15 min) after recording. After the experiment, cell morphology was recovered by dissecting the retina from the choroid, fixing it in 4% paraformaldehyde (0.1 m, phosphate-buffered, pH 7.4) for 2 hr, and converting the Neurobiotin into a permanent black reaction product using standard horseradish peroxidase histochemistry. The retina was subsequently mounted on a slide in a water-based solution of polyvinyl alcohol and glycerol.
Stimuli and response recording. Three light emitting diodes (LEDs) with peak outputs at 656, 525, and 460 nm were mounted on an optical bench above the microscope (Swanson et al., 1987; Dacey and Lee, 1994) and imaged onto the retina through the camera port where they formed a homogeneous circular field with a retinal illuminance of ∼1000 trolands.
Stimulus specification is described in detail in Dacey et al. (2000b). In brief, the intensity and chromaticity of a uniform circular stimulus larger than the receptive field of the cell was sinusoidally modulated. The sum of the mean intensities of the three LEDs were set to produce the same mean quantum catch in all three cone types. This held mean cone adaptation state constant. The quantum catch of each cone type for each LED was calculated by taking the product of the LED spectrum and the spectral sensitivity of the photopigment on a wavelength by wavelength basis and then summing across wavelength. The quantum catch for each cone type during a stimulus presentation was the sum across all three LEDs. The absolute irradiance spectrum of each LED was measured at maximum light output by placing the fiber optic probe of a Gamma Scientific photomultiplier based spectroradiometer at the location of the retina during stimulation. Additional measurements made using a PhotoResearch 650 spectroradiometer confirmed the shape of the LED spectra. Light output was controlled by modulating the frequency of 250 μsec pulses driving each LED using a voltage to frequency converter (Swanson et al., 1987). Over the range used in these experiments, light output as a function of input voltage was linear. All three cone types were assumed to have the same absolute sensitivity. To calculate the photon catches of each cone type we used the photopigment spectra of Baylor et al. (1987) and a photopigment density of 0.05 log units. The low density was consistent with short peripheral cone outer segments illuminated obliquely to their optical axes. Because the Baylor spectra were measured using transverse microspectrophotometry in dissociated cells, their use obviated the need to correct for optical filtering by preretinal media.
Stimuli were designed to determine if a recorded cell was summing or differencing inputs from the L and M cones and to measure the relative strength of those inputs. The intensities of the three LEDs were independently modulated around mean light levels that produced equal quantum catches in the three cone types. The amplitude of the sinusoidal modulation of each LED was chosen to create a stimulus with a particular L and M cone contrast. The contrast seen by each cone type was varied systematically over a set of 13 stimuli (Fig. 1 A). Initially, L and M cone contrasts were equal and of the same sign (left shaded area). M cone contrast decreased, whereas L cone contrast increased until M cone contrast was zero (L cone isolation). M cone contrast then reversed sign (equivalent to a 180° phase shift) and increased while L cone contrast decreased to zero (M cone isolation). Finally, the two cone contrasts returned to the same sign (right shaded area) and in the last stimulus again had equal contrast. A cell that summed L and M cone input would have a peak response to a stimulus within the shaded regions whose summed L and M cone contrasts best matched the relative strengths of the L and M cone inputs of the cell (Fig. 1 B, dashed curves). If the cell got stronger L cone input, the response would peak in a stimulus region where L cone contrast was higher (Fig. 1 B, left dashed curve). If the cell got stronger M cone input, the response would peak in a stimulus region where M cone contrast was higher (Fig. 1 B, right dashed curve). Because we were not interested in distinguishing between cells whose L and M cone inputs were both positively signed and cells whose L and M cone inputs were both negatively signed, we plotted both types as though their inputs were positive. A cell that differenced L and M cone inputs would have a peak response to one of the stimuli within the central region whose L and M cone contrasts had opposite signs (Fig. 1 B, solid curve). The stimulus that produced the best response would be the one that best matched the relative strengths of the L and M cone inputs.
Figure 1.
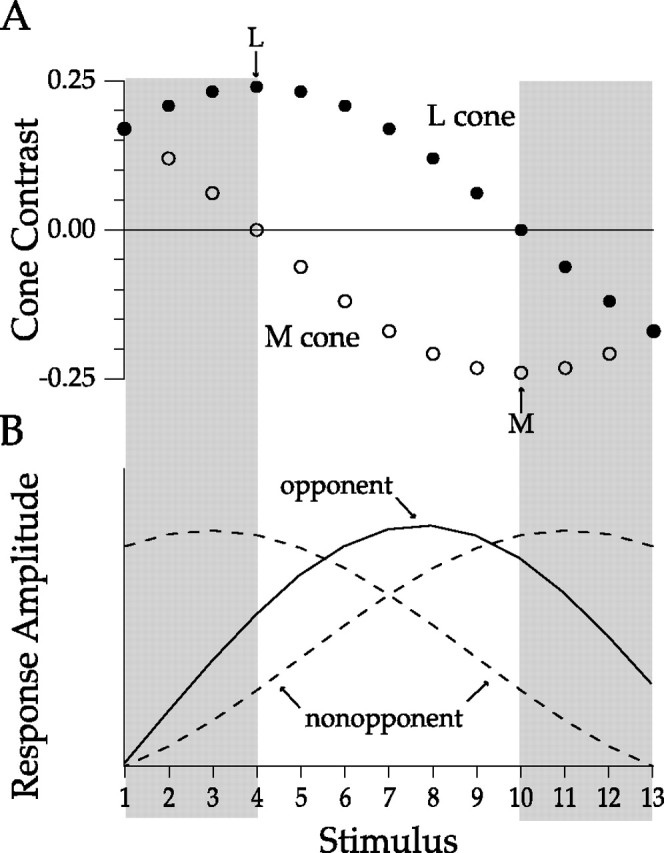
A, The L and M cone contrasts of our series of 13 stimuli. For sinusoidally modulated stimuli, cone contrast is the amplitude of the excursion above or below the mean calculated photon catch divided by the mean calculated photon catch. Negative contrast implies 180° of phase shift of the sinusoidal modulation relative to positive contrast. Filled circles are calculated L cone contrast. Open circles are calculated M cone contrast. The L and M (arrows) indicate the stimuli that modulate only the L and M cones respectively. The shaded areas denote stimuli whose L and M cone contrasts have the same signs. The unshaded central area denotes stimuli whose L and M contrasts have opposite signs. B, All nonopponent cells that sum L and M cone inputs respond best to stimuli within the shaded region. The stimulus that elicits the best response depends on the relative strength of L and M cone input. A cell with a strong L cone input (left dashed curve) will peak where L cone contrast is higher. A cell with a strong M cone input (right dashed curve) will peak where M cone contrast is higher. An opponent cell (solid curve) differences the L and M cone inputs and responds best to stimuli between the shaded areas. The exact position of the peak depends on the sign and relative strengths of L and M cone inputs.
The temporal frequency of stimulus modulation was chosen to maximize our ability to measure L and M cone inputs free from contamination by rod input, because our calculations of the L and M cone contrasts produced by our three-LED visual stimulator are not valid if the rod system is responding to stimuli. Although our mean light level of 1000 trolands was high enough to reduce rod system response, we also took advantage of the sluggish response of the rod system by making most of our measurements at 9.7 Hz, a temporal frequency that we had previously determined to be high enough to further attenuate any remaining rod responses (Verweij et al., 1999). For testing the validity of our assumption that this frequency was not high enough to reduce opponency by weakening center surround antagonism, some measurements were also made at temporal frequencies ranging from 1.2 to 19.5 Hz.
Physiological responses were averaged over several stimulus presentations. Fundamental response amplitudes at the temporal modulation frequency were calculated from the average responses using a digital Fourier transform. The relative strengths of L and M cone inputs to the cell were calculated by fitting the responses with a weighted sum of L and M cone inputs:
 |
(1) |
where WL and WM are the weights of the L and M cone inputs, and Lc and Mc are the L and M cone contrasts of the stimulus.
Spatial tuning curves were measured using a digital light projector (Packer et al., 2001). Drifting sine wave luminance gratings were imaged directly on the retina through the camera port of the physiological microscope. All three channels of the stimulator were set to the same proportion of maximum output yielding a grating that was visually achromatic. Grating contrast was calibrated by measuring the integrated irradiance of the peak and trough of the sinusoidal waveform using a Gamma Scientific radiometer. Grating contrast was set to 50% to avoid driving the cells out of their linear response range. Mean grating luminance was ∼1000 trolands. Responses were corrected for contrast losses in the stimulator at high spatial frequencies. The amplitudes of the responses at the fundamental temporal frequency of the drifting grating were calculated using a digital Fourier transform and fit with a difference of Gaussians model of the receptive field (Dacey et al., 2000b).
Results
Locations of recorded cells
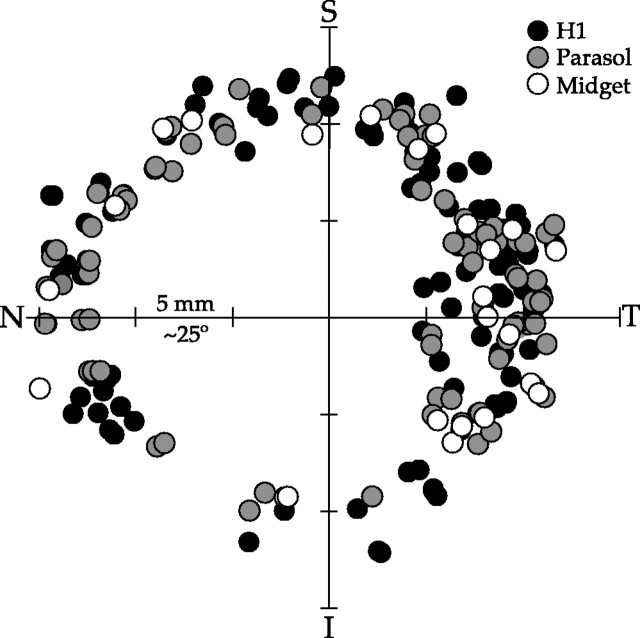
H1 horizontal cells, parasol ganglion cells, and midget ganglion cells were recorded from all quadrants of peripheral retina (Fig. 2). The most central and most peripheral cells were located at eccentricities of ∼5 and ∼15 mm, respectively.
Figure 2.
A topographic map showing the retinal coordinates of recorded cells. H1 horizontal cells (n = 137) are shown as filled black circles. Parasol ganglion cells (n = 96) are shown as filled gray circles. Midget ganglion cells (n = 28) are shown as open circles. The x and y axes represent the horizontal and vertical meridians, respectively, and intersect at the fovea. Tick marks represent eccentricity in 5 mm (∼25°) intervals. The temporal (T), nasal (N), superior (S), and inferior (I) meridians are labeled.
L and M cone inputs to parasol ganglion cells
After targeting large ganglion cell somas and establishing a stable recording, we iontophoretically injected pyranine and viewed the dendritic tree. Parasol cells had monostratified dendritic trees of medium diameter that ramified at either ∼1/3 or ∼2/3 of the depth of the inner plexiform layer. Combined with a uniform dendritic organization, these characteristics made it possible to reliably distinguish them from other ganglion cells (Fig. 3A).
Figure 3.
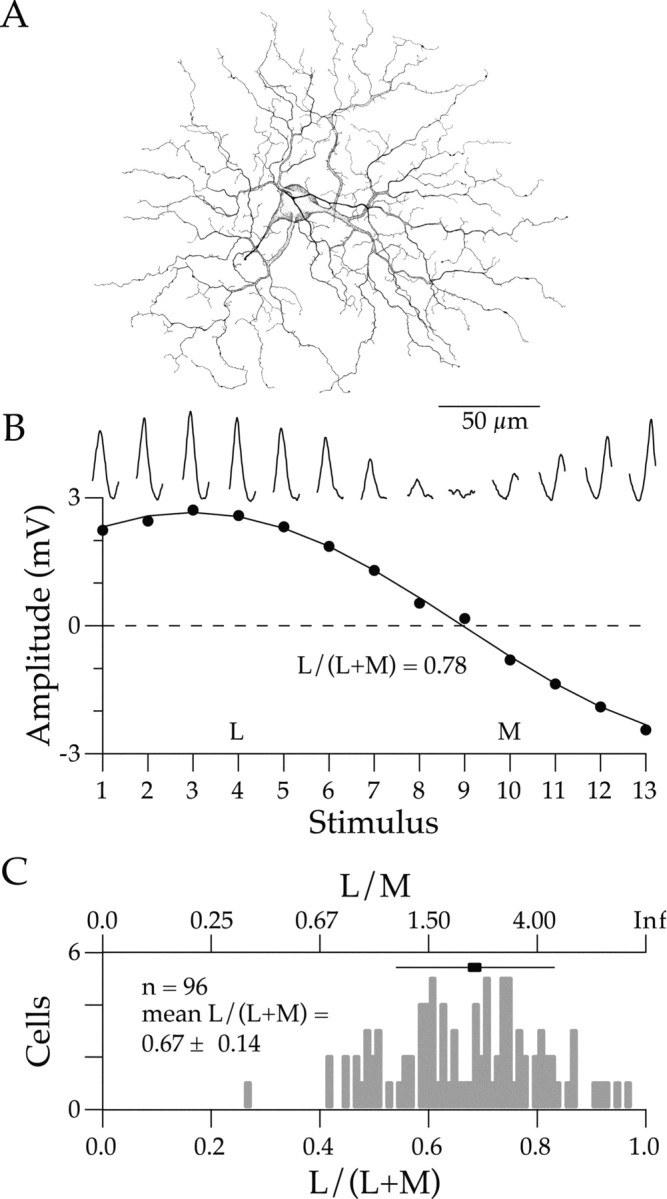
The relative strengths of L and M cone inputs to parasol ganglion cells. A, A drawing of the dendritic arbor of a peripheral parasol ganglion cell. The scale bar indicates distance in micrometers. B, The traces at the top are the average responses of a parasol ganglion cell to each of the 13 sinusoidal stimuli. The x-axis of each trace is time, and the y-axis is amplitude. Although the axes are not shown, they are identical for all traces. The graph plots fundamental response amplitude as a function of stimulus number. The L and M cone contrasts associated with each stimulus are found in Figure 1. The filled circles represent the average fundamental response amplitude of a parasol ganglion cell to each stimulus. The solid line is the best fit of Equation 1 through the data points. The relative strength of L and M cone inputs L/(L + M) is found by noting the relative L and M contrasts at which the response nulls. The solid curve crosses the x-axis just to the left of stimulus number 9. This corresponds to an L/(L + M) ratio of 0.78. C, Histogram of 96 parasol ganglion cell input ratios measured at a temporal frequency of 9.7 Hz. The top x-axis expresses relative L and M cone input as a simple ratio (L/M). The lower axis expresses relative cone input as a normalized ratio L/(L + M). The center of the horizontal bar is the mean L/(L + M) ratio of the group. The length of the bar represents the SD of the distribution.
Parasol cells responded to sinusoidal stimuli with approximately sinusoidal responses (Fig. 3B, top traces). When L and M cone contrasts were large and of the same sign (stimuli 1–3, 11–13), the response was large. When L and M cone contrasts were of opposite sign (stimuli 5–9), the response was smaller, declining to a minimum for stimulus number 9. This pattern was the expected response of a cell that summed L and M cone inputs. The relative strength of L and M cone input L/(L + M) can be estimated from the ratio of cone contrasts that produced the smallest response. However, a better estimate uses all of the data by fitting the fundamental response amplitudes (Fig. 3B, filled symbols) with the summation model (Eq. 1) (Fig. 3B, solid curve). In this particular parasol cell, the response null occurred near stimulus number 9 at a point corresponding to an L/(L + M) ratio of 0.78 (L/M = 3.55). This cell summed L and M cone input, but was much more strongly driven by L cone input.
The relative strength of L and M cone input was measured in 96 parasol cells at a temporal frequency of 9.7 Hz. The results were summarized in a histogram of the cone input ratios (Fig. 3C). The L/(L + M) ratios ranged from 0.26 to 0.97 with a mean of 0.67 ± 0.14. Every cell summed L and M cone input. On average, L cone input was twice as strong as M cone input, but in any individual cell, the relative strengths of the inputs ranged widely from strongly M cone dominated to strongly L cone dominated.
Comparing the L and M cone inputs of parasol and H1 cells
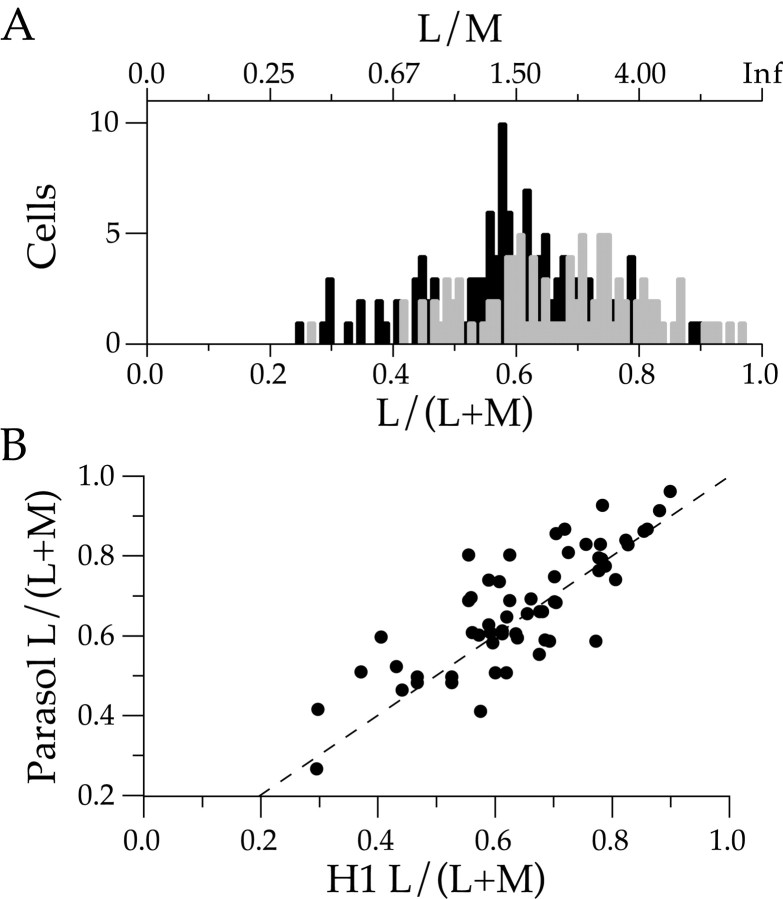
The highly variable L/(L + M) ratios of parasol ganglion cells were similar to identical measurements made in H1 horizontal cells (Dacey et al., 2000b). Populations of the two cell types were compared by superimposing the H1 (Fig. 4A, black bars) and parasol data (Fig. 4A, gray bars). The two ranges overlapped each other almost completely, and the means of the two distributions were statistically indistinguishable.
Figure 4.
A comparison of the L and M cone inputs to H1 horizontal cells and parasol ganglion cells. A, Format is identical to Figure 3B. The dark bars represent H1 horizontal cells. The gray bars represent parasol ganglion cells. B, The relative strengths of pairs of H1 and parasol cells recorded at the same retinal locations. The axes are the L/(L + M) ratios of H1 and parasol cells. Each filled circle represents one retinal location at which a pair of cells were recorded. The diagonal dashed line represents locations at which H1 and parasol cells have the same relative strengths of L and M cone input. This line passes through the graph origin. Data points above the line are locations at which the parasol cell gets relatively more L input than the H1 cell. Data points below the line are locations at which the parasol cell gets relatively less L cone input than the H1 cell. The correlation coefficient of the fit to the diagonal was 0.82.
Although the histogram showed that H1 and parasol cells have distributions with similar means and substantial variability, it provided no information about changes in the L/(L + M) ratios of different cell types at the same retinal locations. To investigate this issue, we measured pairs of H1 and parasol cells at nearby retinal locations and plotted their L/(L + M) ratios against each other (Fig. 4B). A pair of cells with identical L/(L + M) ratios would plot on the diagonal line. A parasol that was more L cone dominated than the H1 cell would plot above the diagonal. A parasol that was less L cone dominated than the H1 cell would plot below the diagonal. The cloud of data points spread along the diagonal, showed that the L/(L + M) ratios of H1 and parasol cells at the same location were highly correlated (0.82). Thus, although cone input ratios ranged widely from location to location, at any given location, H1 and parasol cells had nearly identical ratios. There was no evidence that the cone ratios of the magnocellular pathways were modified as visual information moved through the retina from cones to ganglion cells.
L and M cone inputs to midget ganglion cells
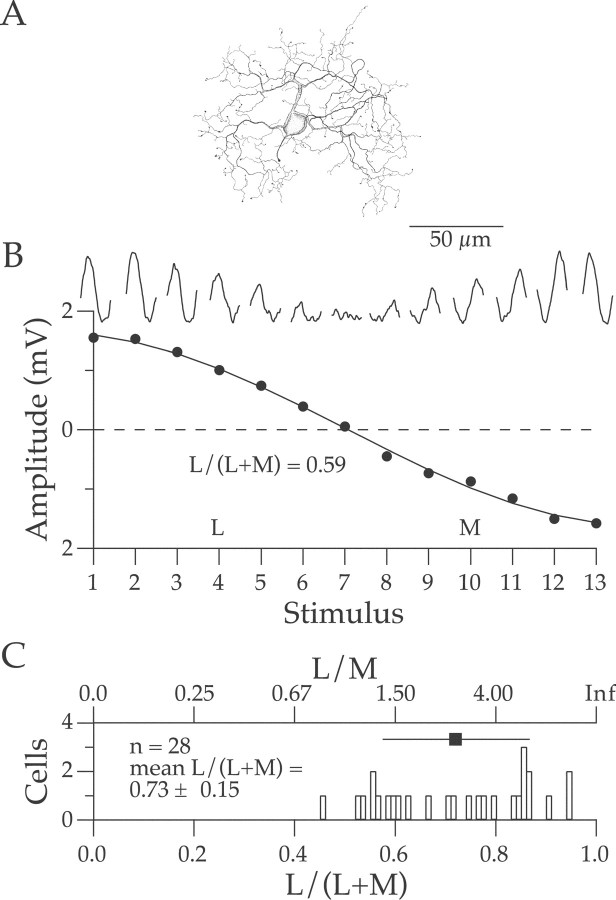
Midget cells were positively identified by targeting small ganglion cell somas and iontophoretically filling their dendritic trees with pyranine. Midget cells had small monostratified dendritic trees that ramified at either ∼1/5 or ∼4/5 of the depth of the inner plexiform layer. They also had a characteristically clumpy dendritic organization (Fig. 5A) that, together with their other features made it possible to classify them reliably.
Figure 5.
The relative strengths of L and M cone inputs to midget ganglion cells. A, A drawing of the dendritic arbor of a peripheral midget ganglion cell. The scale bar indicates distance in micrometers. B, The response of a midget cell to the stimulus series, otherwise identical to Figure 3A. The best fitting curve through the data points represents an L/(L + M) ratio of 0.59. C, Histogram of 28 midget ganglion cell L/(L + M) ratios measured at a temporal frequency of 9.7 Hz, otherwise identical to Figure 3B.
Midget ganglion cells in peripheral retina had responses very similar to those of parasol cells. A midget cell responded approximately sinusoidally to sinusoidal stimulus modulation (Fig. 5B, top traces). The fundamental response amplitude depended on the L and M cone contrast of the stimulus. An example of a midget cell that summed L and M cone input is illustrated in Figure 5B. The response was largest for those stimuli with large L and M cone contrasts of the same sign and smallest for stimuli with L and M cone contrasts of opposite sign. The L/(L + M) ratio, calculated by fitting the fundamental response amplitudes with the cone summation model (Eq. 1), was 0.59 (L/M = 1.43). The strength of L cone input was slightly greater that of the M cone input.
This cell turned out to be typical in that all confirmed midget cells summed L and M cone input. The L/(L + M) ratios of all 28 recorded midget cells were summarized in a histogram (Fig. 5C) and ranged widely from 0.45 to 0.95 with a mean of 0.72 ± 0.15. On average, L cone input exceeded M cone input by more than a factor of two.
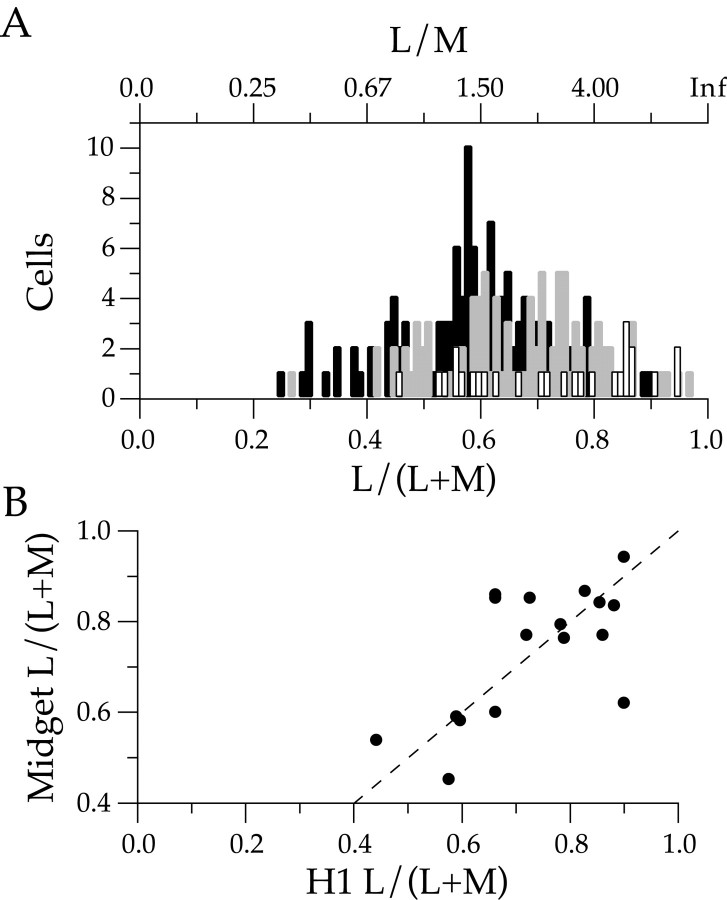
When the L/(L + M) ratios of the midget cells were overlaid on those of the H1 and parasol cells (Fig. 6A), the midget range completely overlapped the H1 and parasol ranges. The small differences in the means were not statistically significant.
Figure 6.
A comparison of the L and M cone inputs to horizontal cells and ganglion cells. A, Histogram of the relative strengths of L and M cone inputs to H1 (black bars), parasol (gray bars), and midget (white bars) cells. Format is otherwise the same as Figure 3B. B, The relative strengths of the L and M cone inputs to pairs of H1 and midget ganglion cells at the same retinal location. The format is identical to that of Figure 4B. The correlation coefficient of the fit to the diagonal was 0.65.
As was the case for the H1 and parasol cells, H1 and midget cells at the same retinal location had very similar L/(L + M) ratios (Fig. 6B). When the ratios of pairs of H1 and midget cells at similar retinal locations were plotted against each other, the data points clustered along the diagonal line that represented equal L and M cone strength. The correlation between the two measurements was strong (0.65). There was no evidence that L/(L + M) ratios of the cells of the parvocellular pathway were modified as visual information moved through inner retina.
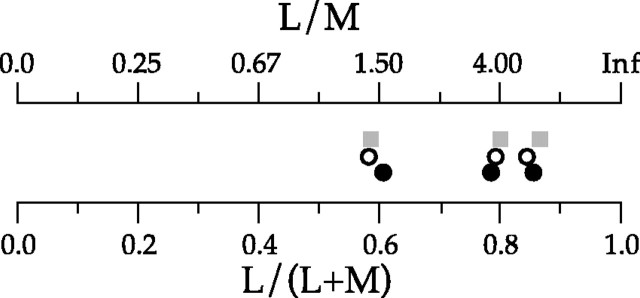
Finally, at three locations, it was possible to record from an H1, parasol, and midget cell (Fig. 7). In every case, the L/(L + M) ratios of all three cell types were almost identical.
Figure 7.
The L/(L + M) ratios of H1 (black circle), parasol (gray square), and midget (open circle) cells measured at three locations on the retina. The three symbols are offset vertically for better visibility.
The effects of temporal frequency on opponency and receptive field structure
None of the positively identified midget ganglion cells that we recorded in peripheral retina exhibited red–green spectral opponency. Because previous studies using other stimuli reported that such cells were numerous, we wanted to assure ourselves that we could identify and quantitatively analyze opponent responses if a cell exhibited them. In addition we wanted to explore the possibility that the 9.7 Hz temporal frequency that we used for most measurements was masking existing opponency.
In fact, we did measure one ganglion cell that exhibited overt red–green opponency (Fig. 8), although we were unable to positively identify its type. It may have been one of the novel morphological types not yet well characterized physiologically (Dacey et al., 2003). Regardless, this cell responded best to L and M cone contrasts of opposite sign. To see if temporal frequency affected the robustness of the opponency, the cell was measured at five temporal frequencies between 1.22 and 15.2 Hz. As temporal frequency increased (from bottom to top), opponency remained strong even at 15.2 Hz (top curve), although the amplitude of the response differences to stimuli whose L and M cone contrasts were in (#1, #13) and out (#7) of phase with each other did decrease slightly. A slight leftward shift of the peaks of the fitted curves indicated a slight increase in L cone dominance with increasing temporal frequency.
Figure 8.
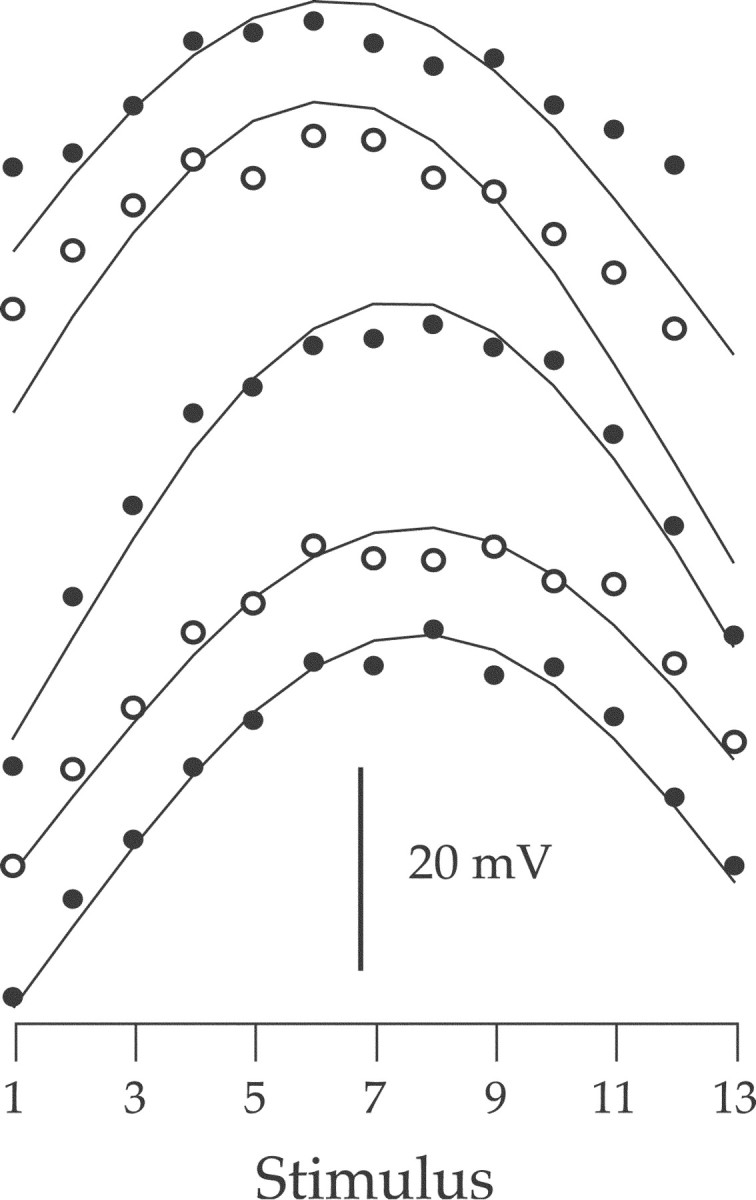
The responses of a red–green spectrally opponent ganglion cell to the 13 sinusoidal stimuli at a series of temporal frequencies. From the bottom, the temporal frequencies were 1.22, 2.44, 4.8, 9.7, and 15.2 Hz. Each set of filled or open circles are the response amplitudes to the stimuli. Filled and open circles alternate for clarity. Each curve is the best fit of the L and M cone summation model (Eq. 1) to the data points. Each curve and associated data points have been shifted along the y-axis for clarity. The scale bar indicates 20 mV of response amplitude. The ganglion cell type was not positively determined.
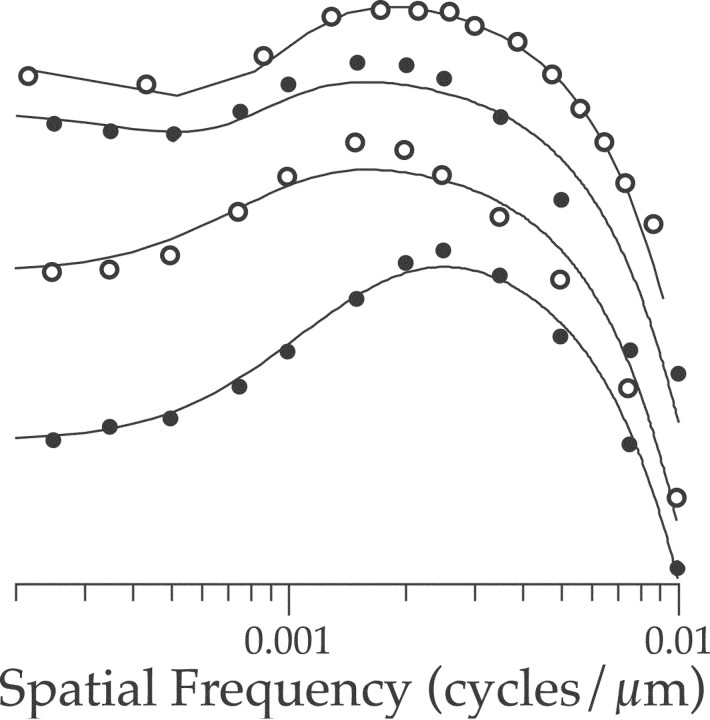
To further assure ourselves that the relatively high temporal frequency of our stimuli was not masking opponency by weakening the center surround structure of the receptive field, we measured the spatial tuning curves of several midget ganglion cells by drifting sine wave gratings across their receptive fields (Fig. 9). All of the cells were insensitive at low spatial frequencies, a characteristic of well developed surround inhibition. The spatial tuning curves of seven cells measured at 9.7 Hz and of two cells measured at 2 Hz had mean center surround phase differences of 146 and 169°, respectively. Thus, these cells had not lost surround antagonism either as a result of surround insensitivity or due to the convergence of the phases of center and surround responses.
Figure 9.
The spatial tuning curves of four midget ganglion cells measured at a temporal frequency of 9.7 Hz. The responses of each cell (filled or open circles) to 50% contrast drifting sine wave luminance gratings at a series of spatial frequencies measured in cycles per micrometer were fit with a difference of Gaussians model (solid curve). The four tuning curves have been arbitrarily shifted along the y-axis for clarity. Filled and open circles are also alternated for clarity. The reduced response to lower spatial frequencies is indicative of surround inhibition.
Last, we measured the relative strengths of cone inputs to 10 parasol cells at multiple temporal frequencies to look for temporal frequency-dependent shifts. Three cells were measured at 4.8, 9.7, and 19.5 Hz. Seven cells were measured at 9.7 and 19.5 Hz. Four cells had no or ambiguous changes in cone ratio as a function of temporal frequency. Three cells had slightly larger ratios at higher temporal frequency, whereas three other cells had slightly smaller ratios. We found no evidence of systematic changes in cone ratio as a function of temporal frequency.
Other sources of the variability in the strength of L and M cone input
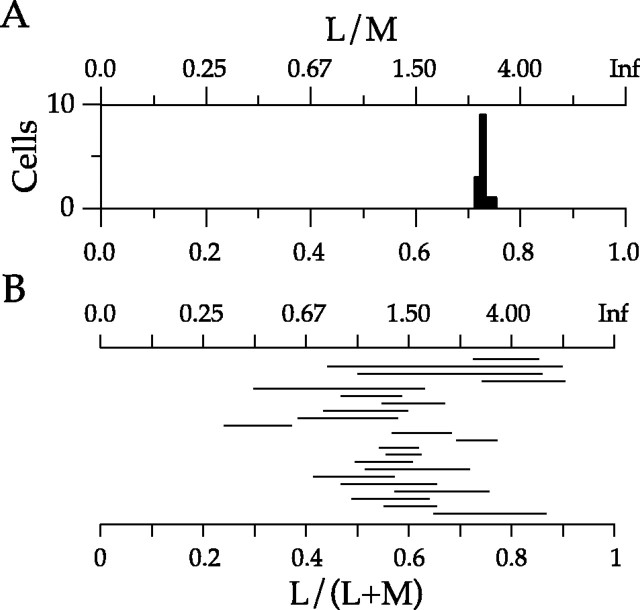
The distributions of the L/(L + M) ratios of the H1, parasol, and midget cells all showed substantial variability (Fig. 6A). We ruled out measurement error as a significant contributor by making repeated measures of the L/(L + M) ratios of single cells and showing that the spread of the measurements was very small. For example, 14 measurements of a single H1 cell (Fig. 10A) yielded a distribution of L/(L + M) ratios that ranged from 0.71 to 0.75. This was typical of results obtained from parasol and midget cells as well.
Figure 10.
Sources of the variability of the L/(L + M) ratios. A, Histogram of L/(L + M) ratios for 14 repeated measurements of a single H1 cell. B, Variability of the L/(L + M) ratios of H1 cells within and across 22 animals. Each horizontal bar represents the range of L and M cone input ratios of a separate animal.
To more closely examine the contributions of within and between retina variability, we replotted the L/(L + M) ratios of each animal separately (Fig. 10B). Because more H1 cells were recorded than parasol or midget cells, we chose to replot the H1 distribution. Results for both parasol and midget cells were similar. Each bar of the figure represented the range of L/(L + M) ratios of a single animal. No single animal exhibited as much variability as was found among animals. In most cases, the within-animal range was a quarter or less of the total range, although in three animals the range was half or more of the total. In general, between-animal variability contributed more to the total range than did within-animal variability. It is important to note however, that the within-animal variability is likely an underestimate because the number of cells measured in each animal was small, and the locations of the recorded cells varied. The wide range of variability in the original histograms included substantial contributions from sources both within and among individual retinas. We will consider these sources further in the Discussion.
Discussion
In peripheral macaque retina, H1 horizontal cells and parasol and midget ganglion cells summed L and M cone input. On average, L cone input was stronger than M cone input, consistent with previous measurements of the relative numbers of cones in the photoreceptor mosaic (Baylor et al., 1987; Mollon and Bowmaker, 1992; Packer et al., 1996; Roorda et al., 2001), the relative physiological strength of cone input (Jacobs and Deegan, 1997; Dacey at al, 2000b), and the relative abundance of cone photopigment mRNA (Deeb et al., 2000). The L/(L + M) ratios of H1 cells and ganglion cells at the same retinal locations covaried. We conclude that these cells get indiscriminate inputs from L and M cones and that no modification of input strength occurs between cones and ganglion cells.
Variability in the strength of L and M cone inputs to ganglion cells
One key result of this study is the substantial variability in the relative strength of L and M cone input to horizontal and ganglion cells (Fig. 10B). This variability originates in the retina since repeated measurements of individual cells had minimal spread (Fig. 10A). If this variability reflects the organization of the photoreceptor mosaic, then our physiological measurements should mirror other measures thought to reflect the relative numbers of L and M cones. Electroretinogram (ERG) flicker photometric (Chang et al., 1993; Carroll et al., 2002) estimates in 68 primates ranged from 0.79 to 1.33 (Jacobs et al., 1996; Jacobs and Deegan, 1997). Optical and photopigment transmittance imaging of cones in a handful of monkey retinas (Mollon and Bowmaker, 1992; Packer et al., 1996; Roorda et al., 2001) yielded ratios between 1 and 1.4. These ratios were consistent with our mean ratio (1.5 ± 0.18; n = 271) across cell types. In human retina, the link is stronger still because analysis of photopigment gene structure and ERG flicker photometry closely match direct optical imaging of retinal patches (Brainard et al., 2000; Carroll et al., 2000, 2002).
Differences in the relative numbers of L and M cones result from variability both within and among retinas. Within retina variability is due to change as a function of retinal location. The increasing contribution of L cones in peripheral (Hagstrom et al., 1998, 2000) and nasal retina (Deeb et al., 2000) are two examples. Sampling variability resulting from the near random distribution of L and M cones (Mollon and Bowmaker, 1992; Packer et al., 1996; Roorda and Williams, 1999) is minimal in peripheral retina since the L/(L + M) cone ratio of a sample approaches that of the mosaic as a whole for sample sizes (∼100) easily attained by peripheral receptive fields.
Variability of the relative strengths of L and M cone input to parasol ganglion cells, thought to be the substrate for the psychophysically measured photopic luminosity function (Derrington et al., 1984; Lee et al., 1988), suggests that these cells inherit their L and M cone inputs from the photoreceptor mosaic (Lennie et al., 1993). This idea is supported by the close match between the variability of the cone ratios of parasol ganglion cells and H1 cells (Fig. 4) and by the substantial individual variability in the peak wavelength of the photopic luminosity function (Lutze et al., 1990). It predicts that the L/(L + M) ratios of parasol ganglion cells and psychophysical measures that depend on luminosity (Cavanagh and Anstis, 1991) will covary.
Variability in the responses of retinal neurons caused by variability in the relative numbers of L and M cones is exactly the prediction of the random connection model but is inconsistent with the squelched variability of the selective connection model. Previous physiological measurements (Gouras and Zrenner, 1979; Derrington et al., 1984) reported substantial variability of the L/(L + M) ratio, leading us to design stimuli that measured the ratio directly rather than simply classifying cells as responding best to chrominance or luminance (Martin et al., 2001). Dacey et al. (2000b) argued that the L/(L + M) ratios of H1 cells reflected the relative numbers of L and M cones without additional neural weighting at synapses preceding the ganglion cells. This hypothesis can now be extended to the ganglion cells.
Implications for color vision
The anatomical (Wässle et al., 1989; Boycott and Wässle, 1991; Goodchild et al., 1996; Calkins and Sterling, 1996), physiological (Dacheux and Raviola, 1990; Dacey et al., 1996, 2000a,b), and psychophysical (Mullen and Kingdom, 2002) data from outer retina consistent with the random connection model (Lennie, 1980; Paulus and Kroger-Paulus, 1983; Shapley and Perry, 1986; Lennie et al., 1991; Mullen and Kingdom, 1996) might be reconciled with the selective connection model (Reid and Shapley, 1992; Dacey, 1993; Lee et al., 1998; Martin et al., 2001) by invoking inner retinal selectivity. However, selective connections are inconsistent with the covariance of horizontal and ganglion cell L/(L + M) ratios at single retinal locations, as is the lack of peripheral midget opponency. These findings extend the evidence in favor of the random connection model to the circuitry of inner retina, sharpening not reconciling contradictions with previous studies.
Although the best way to discriminate the two hypotheses is to test their predictions about the effects of retinal eccentricity on opponency, no single study has measured the entire range. In central retina, the random connection model predicts that the single cone input to the center of some midget ganglion cells will be opposed by a small surround that samples cones of the opposite type (Packer and Dacey, 2002). However, the model does not predict that 80% of midget cells would have pure cone surrounds as Reid and Shapley (1992, 2002) reported. We cannot rule out qualitative differences in the receptive field circuitry of central and peripheral retina. In peripheral retina, the average eccentricity of our measurements was somewhat greater than those of Martin et al. (2001). The random connection model predicts stronger opponency more centrally both because the probability of a single cone center increases and because the smaller receptive field raises the probability that, in a proportion of cells, the cones that contribute to the surround will be of the type opposite that of the center (Lennie et al., 1991; Calkins and Sterling, 1999; Packer and Dacey, 2002). Even so, the mean eccentricity difference between the two studies is too small to account for the large differences in measured opponency.
In short, we were unable to reconcile these studies, possibly because spectral response depends in complex ways on the spatial, temporal, and chromatic parameters of the stimulus. Martin et al. (2001) measured opponency by mixing the light from two LEDs with peak outputs at middle and long wavelengths. The LEDs were sinusoidally modulated either in phase with each other to produce an isochromatic stimulus or out of phase with each other to produce an isoluminant stimulus. The LED outputs were weighted by the estimated strength of L and M cone input so that a cell that summed cone inputs would have a minimal isoluminant response, whereas a cell that differenced cone inputs would have a minimal isochromatic response. Thus, the stimulus assumed a particular ratio of L and M cone input and assessed the response only under conditions for which the responses to the LEDs were predicted to completely add or subtract. Cells were classified as opponent if their isoluminant response exceeded their isochromatic response. We previously used a similar small spot stimulus to probe peripheral midget ganglion cell receptive fields (Dacey and Lee, 1999; Dacey, 1999, 2000) and found that both centers and surrounds summed L and M cone inputs. Here, we measured responses to a wide range of L and M cone contrasts independent of any assumptions about the relative strength of cone input.
Our measurements, made mostly at a temporal frequency of 9.7 Hz to minimize the possibility of rod intrusion (see Materials and Methods), might have been more luminance-dominated than those of Martin et al. (2001), made at ∼1 Hz. Gouras and Zrenner (1979) found a temporal frequency-dependent shift in the relative strength of response to chromatic and luminance stimuli resulting from a reduction in the phase difference between receptive field center and surround at high temporal frequencies. Opponent cells had larger chromatic responses at low temporal frequencies where the center and surround were out of phase, but larger luminance responses at very high temporal frequencies where the phases converged. Similarly, Lee et al. (1988) and Martin et al. (2001) found that the chromatic response was stronger than the luminance response at 1 Hz. The luminance response grew faster with increasing temporal frequency and exceeded the chromatic response at more than ∼10 Hz. This crossover occurred at even lower temporal frequencies in peripheral retina (Solomon et al., 2002). Although these data might suggest that we found little spectral opponency caused by the high temporal frequencies of our stimuli, Lankheet et al. (1998b) specifically measured the strength of opponency in parvocellular LGN neurons and found few cells that lost their opponency at temporal frequencies of <15 Hz. Our data argue similarly. First, the red–green opponent cell (Fig. 8) showed little change in the strength of opponency over a wide range of temporal frequencies between 1.22 and 15.2 Hz. In addition, of the 12 ganglion cells measured at multiple temporal frequencies, 4 cells had identical or ambiguous L/M ratios at all temporal frequencies, 4 cells showed slight increases in L/M ratio as temporal frequency increased, and 4 cells had slight decreases in ratio as frequency increased. Thus, we see no evidence that higher temporal frequencies impaired our ability to measure opponency or altered the L/M ratios of nonopponent cells. Second, the center surround receptive field organization of midget cells was strong at 9.7 Hz as shown by both the well developed low-frequency insensitivity of midget spatial tuning curves (Fig. 9) and the 146° mean phase difference between centers and surrounds. We found no evidence that surround inhibition was suppressed at 9.7 Hz nor that the phase of center and surround responses had converged significantly.
In conclusion, although a reconciliation with previous ganglion cell results must await additional measurements across a range of eccentricities and temporal frequencies, our results add to the evidence that L and M cone inputs to ganglion cells are inherited, unweighted, from the cone mosaic. Evidence that plasticity in the wavelength of unique yellow, a psychophysical measure of the relative strengths of L and M cone inputs to the midget pathway, has a central component (Neitz et al., 2002) suggests that adjustments to the balance of red–green opponency needed to maintain normal color perception in the face of differences in cone ratio and changes in the mean chromaticity of the visual environment need not be made in the retina by selective circuitry or modifications to synaptic weighting. Recently, the human L photopigment gene has been added to mouse retina, creating a novel class of functional cones (Jacobs et al., 1999). The selective connection model predicts that an L cone type added to a retina containing only M cones could not mediate red–green spectral opponency because no selective circuitry would be present. The random connection model predicts that the new L cone type could facilitate opponency because no selective circuitry is required. Red–green spectral opponency resulting from the addition of an L cone to the retina of a dichromatic monkey would be strong evidence in favor of the random selection model.
Footnotes
This work was supported by National Institutes of Health Grants EY09625 and EY06678 and Grant RR0166 to the Washington National Primate Research Center. D.R.W. contributed to this work while on sabbatical in the Department of Biological Structure. We thank Toni Haun and Beth Peterson for technical assistance and Vivianne Smith for comments on this manuscript.
Correspondence should be addressed to Orin Packer, Department of Biological Structure, Health Sciences Building G514, University of Washington, Seattle, WA 98195. E-mail: orin@u.washington.edu.
DOI:10.1523/JNEUROSCI.3828-03.2004
Copyright © 2004 Society for Neuroscience 0270-6474/04/51079-10$15.00/0
References
- Baylor DA, Nunn BJ, Schnapf JL (1987) Spectral sensitivity of cones of the monkey Macaca fascicularis J Physiol (Lond) 390: 145–160. [DOI] [PMC free article] [PubMed] [Google Scholar]
- Boycott BB, Wässle H (1991) Morphological classification of bipolar cells of the primate retina. Eur J Neurosci 3: 1069–1088. [DOI] [PubMed] [Google Scholar]
- Brainard DH, Roorda A, Yamauchi Y, Calderone JB, Metha A, Neitz M, Neitz J, Williams DR, Jacobs GH (2000) Functional consequences of the relative numbers of L and M cones. J Opt Soc Am A Opt Image Sci Vis 17: 607–614. [DOI] [PubMed] [Google Scholar]
- Bumsted K, Jasoni C, Szél A, Hendrickson A (1997) Spatial and temporal expression of cone opsins during monkey retinal development. J Comp Neurol 378: 117–134. [PubMed] [Google Scholar]
- Calkins DJ, Sterling P (1996) Absence of spectrally specific lateral inputs to midget ganglion cells in primate retina. Nature 381: 613–615. [DOI] [PubMed] [Google Scholar]
- Calkins DJ, Sterling P (1999) Evidence that circuits for spatial and color vision segregate at the first retinal synapse. Neuron 24: 313–321. [DOI] [PubMed] [Google Scholar]
- Calkins DJ, Schein SJ, Tsukamoto Y, Sterling P (1994) M and L cones in macaque fovea connect to midget ganglion cells by different numbers of excitatory synapses. Nature 371: 70–72. [DOI] [PubMed] [Google Scholar]
- Carroll J, McMahon C, Neitz M, Neitz J (2000) Flicker-photometric electroretinogram estimates of L:M cone photoreceptor ratio in men with photopigment spectra derived from genetics. J Opt Soc Am A Opt Image Sci Vis 17: 499–509. [DOI] [PubMed] [Google Scholar]
- Carroll J, Neitz J, Neitz M (2002) Estimates of L:M cone ratio from ERG flicker photometry and genetics. J Vis 2: 531–542. [DOI] [PubMed] [Google Scholar]
- Cavanagh P, Anstis S (1991) The contribution of color to motion in normal and color-deficient observers. Vision Res 31: 2109–2148. [DOI] [PubMed] [Google Scholar]
- Chang Y, Burns SA, Kreitz MR (1993) Red-green flicker photometry and nonlinearities in the flicker electroretinogram. J Opt Soc Am A 10: 1413–1422. [DOI] [PubMed] [Google Scholar]
- Dacey DM (1993) The mosaic of midget ganglion cells in the human retina. J Neurosci 13: 5334–5355. [DOI] [PMC free article] [PubMed] [Google Scholar]
- Dacey D (1999) Primate retina: cell types, circuits and color opponency. Prog Retin Eye Res 18: 737–763. [DOI] [PubMed] [Google Scholar]
- Dacey D (2000) Parallel pathways for spectral coding in primate retina. Annu Rev Neurosci 23: 743–775. [DOI] [PubMed] [Google Scholar]
- Dacey DM, Lee BB (1994) The “blue-on” opponent pathway in primate retina originates from a distinct bistratified ganglion cell type. Nature 367: 731–735. [DOI] [PubMed] [Google Scholar]
- Dacey DM, Lee BB (1999) Functional architecture of cone signal pathways in the primate retina. In: Color vision: from genes to perception (Gegenfurtner KR, Sharpe LT, eds) pp 181–202. Cambridge: Cambridge UP.
- Dacey DM, Lee BB, Stafford DK, Pokorny J, Smith VC (1996) Horizontal cells of the primate retina: cone specificity without spectral opponency. Science 271: 656–659. [DOI] [PubMed] [Google Scholar]
- Dacey D, Packer OS, Diller L, Brainard D, Peterson B, Lee B (2000a) Center surround receptive field structure of cone bipolar cells in primate retina. Vis Res 40: 1801–1811. [DOI] [PubMed] [Google Scholar]
- Dacey DM, Diller LC, Verweij J, Williams DR (2000b) Physiology of L- and M-cone inputs to H1 horizontal cells in the primate retina. J Opt Soc Am A Opt Image Sci Vis 17: 589–596. [DOI] [PubMed] [Google Scholar]
- Dacey DM, Peterson BB, Robinson FR, Gamlin PD (2003) Fireworks in the primate retina: in vitro photodynamics reveals diverse LGN-projecting ganglion cell types. Neuron 37: 15–27. [DOI] [PubMed] [Google Scholar]
- Dacheux RF, Raviola E (1990) Physiology of HI horizontal cells in the primate retina. Proc R Soc Lond B Biol Sci 239: 213–230. [DOI] [PubMed] [Google Scholar]
- Deeb SS, Diller LC, Williams DR, Dacey DM (2000) Interindividual and topographical variation of L:M cone ratios in monkey retinas. J Opt Soc Am A Opt Image Sci Vis 17: 538–544. [DOI] [PubMed] [Google Scholar]
- Derrington AM, Krauskopf J, Lennie P (1984) Chromatic mechanisms in lateral geniculate nucleus of macaque. J Physiol (Lond) 357: 241–265. [DOI] [PMC free article] [PubMed] [Google Scholar]
- De Valois RL, Abramov I, Jacobs GH (1966) Analysis of response patterns of LGN cells. J Opt Soc Am 56: 966–977. [DOI] [PubMed] [Google Scholar]
- De Monasterio FM (1978) Center and surround mechanisms of opponent-color X and Y ganglion cells of retina of macaques. J Neurophysiol 41: 1418–1434. [DOI] [PubMed] [Google Scholar]
- De Monasterio FM, Gouras P (1975) Functional properties of ganglion cells of the rhesus monkey retina. J Physiol (Lond) 251: 167–195. [DOI] [PMC free article] [PubMed] [Google Scholar]
- De Monasterio FM, Gouras P, Tolhurst DJ (1975) Trichromatic colour opponency in ganglion cells of the rhesus monkey retina. J Physiol (Lond) 251: 197–216. [DOI] [PMC free article] [PubMed] [Google Scholar]
- Demb JB, Haarsma L, Freed MA, Sterling P (1999) Functional circuitry of the retinal ganglion cell's nonlinear receptive field. J Neurosci 19: 9756–9767. [DOI] [PMC free article] [PubMed] [Google Scholar]
- Flores-Herr N, Protti DA, Wässle H (2001) Synaptic currents generating the inhibitory surround of ganglion cells in the mammalian retina. J Neurosci 21: 4852–4863. [DOI] [PMC free article] [PubMed] [Google Scholar]
- Goodchild AK, Chan TL, Grunert U (1996) Horizontal cell connections with short-wavelength-sensitive cones in macaque monkey retina. Vis Neurosci 3: 833–845. [DOI] [PubMed] [Google Scholar]
- Gouras P (1968) Identification of cone mechanisms in monkey ganglion cells. J Physiol (Lond) 199: 533–547. [DOI] [PMC free article] [PubMed] [Google Scholar]
- Gouras P, Zrenner E (1979) Enchancement of luminance flicker by color-opponent mechanisms. Science 205: 587–589. [DOI] [PubMed] [Google Scholar]
- Hagstrom SA, Neitz J, Neitz M (1998) Variations in cone populations for red-green color vision examined by analysis of mRNA. NeuroReport 9: 1963–1967. [DOI] [PubMed] [Google Scholar]
- Hagstrom SA, Neitz M, Neitz J (2000) Cone pigment gene expression in individual photoreceptors and the chromatic topography of the retina. J Opt Soc Am A Opt Image Sci Vis 17: 527–537. [DOI] [PubMed] [Google Scholar]
- Jacobs GH, Deegan II JF (1997) Spectral sensitivity of macaque monkeys measured with ERG flicker photometry. Vis Neurosci 14: 921–928. [DOI] [PubMed] [Google Scholar]
- Jacobs GH, Deegan II JF, Moran JL (1996) ERG measurements of the spectral sensitivity of common chimpanzee (Pan troglodytes). Vis Res 36: 2587–2594. [DOI] [PubMed] [Google Scholar]
- Jacobs GH, Fenwick JC, Calderone JB, Deeb SS (1999) Human cone pigment expressed in transgenic mice yields altered vision. J Neurosci 19: 3258–3265. [DOI] [PMC free article] [PubMed] [Google Scholar]
- Lankheet MJ, Lennie P, Krauskopf J (1998a) Distinctive characteristics of subclasses of red-green P-cells in LGN of macaque. Vis Neurosci 15: 37–46. [DOI] [PubMed] [Google Scholar]
- Lankheet MJ, Lennie P, Krauskopf J (1998b) Temporal-chromatic interactions in LGN P-cells. Vis Neurosci 15: 47–54. [DOI] [PubMed] [Google Scholar]
- Lee BB, Martin PR, Valberg A (1988) The physiological basis of heterochromatic flicker photometry demonstrated in the ganglion cells of the macaque retina. J Physiol (Lond) 404: 323–347. [DOI] [PMC free article] [PubMed] [Google Scholar]
- Lee BB, Kremers J, Yeh T (1998) Receptive fields of primate ganglion cells studied with a novel technique. Vis Neurosci 15: 161–175. [DOI] [PubMed] [Google Scholar]
- Lennie P (1980) Parallel visual pathways: a review. Vis Res 20: 561–594. [DOI] [PubMed] [Google Scholar]
- Lennie P, Haake PW, Williams DR (1991). The design of chromatically opponent receptive fields. In: Computational models of visual processing (Landy MS, Movshon JA, eds), pp 71–82. Cambridge: MIT.
- Lennie P, Pokorny J, Smith VC (1993) Luminance. J Opt Soc Am A 10: 1283–1293. [DOI] [PubMed] [Google Scholar]
- Lutze M, Cox NJ, Smith VC, Pokorny J (1990) Genetic studies of variation in Rayleigh and photometric matches in normal trichromats. Vis Res 30: 149–162. [DOI] [PubMed] [Google Scholar]
- Martin PR, Lee BB, White AJ, Solomon SG, Ruttiger L (2001) Chromatic sensitivity of ganglion cells in the peripheral primate retina. Nature 410: 933–936. [DOI] [PubMed] [Google Scholar]
- Milam AH, Dacey DM, Dizhoor AM (1993) Recoverin immunoreactivity in mammalian cone bipolar cells. Vis Neurosci 10: 1–12. [DOI] [PubMed] [Google Scholar]
- Mollon JD, Bowmaker JK (1992) The spatial arrangement of cones in the primate fovea. Nature 360: 677–679. [DOI] [PubMed] [Google Scholar]
- Mullen KT (1991) Colour vision as a post-receptoral specialization of the central visual field. Vis Res 31: 119–130. [DOI] [PubMed] [Google Scholar]
- Mullen KT, Kingdom FA (1996) Losses in peripheral colour sensitivity predicted from “hit and miss” post-receptoral cone connections. Vis Res 36: 1995–2000. [DOI] [PubMed] [Google Scholar]
- Mullen KT, Kingdom FA (2002) Differential distributions of red-green and blue-yellow cone opponency across the visual field. Vis Neurosci 19: 109–118. [DOI] [PubMed] [Google Scholar]
- Neitz J, Carroll J, Yamauchi Y, Neitz M, Williams DR (2002) Color perception is mediated by a plastic neural mechanism that is adjustable in adults. Neuron 35: 783–792. [DOI] [PubMed] [Google Scholar]
- Okada M, Erickson A, Hendrickson A (1994) Light and electron microscopic analysis of synaptic development in Macaca monkey retina as detected by immunocytochemical labeling for the synaptic vesicle protein, SV2. J Comp Neurol 339: 535–558. [DOI] [PubMed] [Google Scholar]
- Packer OS, Dacey DM (2002) Receptive field structure of H1 horizontal cells in macaque monkey retina. J Vis 4: 272–292. [DOI] [PubMed] [Google Scholar]
- Packer OS, Williams DR, Bensinger DG (1996) Photopigment transmittance imaging of the primate photoreceptor mosaic. J Neurosci 16: 2251–2260. [DOI] [PMC free article] [PubMed] [Google Scholar]
- Packer O, Diller LC, Verweij J, Lee BB, Pokorny J, Williams DR, Dacey DM, Brainard DH (2001) Characterization and use of a digital light projector for vision research. Vis Res 41: 427–439. [DOI] [PubMed] [Google Scholar]
- Paulus W, Kroger-Paulus A (1983) A new concept of retinal colour coding. Vis Res 23: 529–540. [DOI] [PubMed] [Google Scholar]
- Reid RC, Shapley RM (1992) Spatial structure of cone inputs to receptive fields in primate lateral geniculate nucleus. Nature 356: 716–718. [DOI] [PubMed] [Google Scholar]
- Reid RC, Shapley RM (2002) Space and time maps of cone photoreceptor signals in macaque lateral geniculate nucleus. J Neurosci 22: 6158–6175. [DOI] [PMC free article] [PubMed] [Google Scholar]
- Roorda A, Williams DR (1999) The arrangement of the three cone classes in the living human eye. Nature 397: 520–522. [DOI] [PubMed] [Google Scholar]
- Roorda A, Metha AB, Lennie P, Williams DR (2001) Packing arrangement of the three cone classes in primate retina. Vis Res 41: 1291–1306. [DOI] [PubMed] [Google Scholar]
- Solomon SG, Martin PR, White AJ, Ruttiger L, Lee BB (2002) Modulation sensitivity of ganglion cells in peripheral retina of macaque. Vis Res 42: 2893–2898. [DOI] [PubMed] [Google Scholar]
- Shapley RM, Perry VH (1986) Cat and monkey retinal ganglion cells and their visual functional roles. Trends Neurosci 9: 229–235. [Google Scholar]
- Swanson WH, Ueno T, Smith VC, Pokorny J (1987) Temporal modulation sensitivity and pulse-detection thresholds for chromatic and luminance perturbations. J Opt Soc Am A 4: 1992–2005. [DOI] [PubMed] [Google Scholar]
- Taylor WR (1999) TTX attenuates surround inhibition in rabbit retinal ganglion cells. Vis Neurosci 16: 285–290. [DOI] [PubMed] [Google Scholar]
- Verweij J, Dacey DM, Peterson BB, Buck SL (1999) Sensitivity and dynamics of rod signals in H1 horizontal cells of the macaque monkey retina. Vis Res 39: 3662–3672. [DOI] [PubMed] [Google Scholar]
- Verweij J, Hornstein EP, Schnapf JL (2003) Surround antagonism in macaque cone photoreceptors. J Neurosci 23: 10249–10257. [DOI] [PMC free article] [PubMed] [Google Scholar]
- Vimal RL, Pokorny J, Smith VC, Shevell SK (1989) Foveal cone thresholds. Vis Res 29: 61–78. [DOI] [PubMed] [Google Scholar]
- Wässle H, Boycott BB, Rohrenbeck J (1989) Horizontal cells in the monkey retina: cone connections and dendritic network. Eur J Neurosci 1: 421–435. [DOI] [PubMed] [Google Scholar]
- Wässle H, Grunert U, Martin PR, Boycott BB (1994) Immunocytochemical characterization and spatial distribution of midget bipolar cells in the macaque monkey retina. Vis Res 34: 561–579. [DOI] [PubMed] [Google Scholar]
- Wesner MF, Pokorny J, Shevell SK, Smith VC (1991) Foveal cone detection statistics in color-normals and dichromats. Vis Res 31: 1021–1037. [DOI] [PubMed] [Google Scholar]
- Wiesel TN, Hubel DH (1966) Spatial and chromatic interactions in the lateral geniculate body of the rhesus monkey. J Neurophysiol 29: 1115–1156. [DOI] [PubMed] [Google Scholar]


