

Abstract
NMDA receptor-dependent long-term potentiation and long-term depression (LTD) involve changes in AMPA receptor activity and postsynaptic localization that are in part controlled by glutamate receptor 1 (GluR1) subunit phosphorylation. The scaffolding molecule A-kinase anchoring protein (AKAP)79/150 targets both the cAMP-dependent protein kinase (PKA) and protein phosphatase 2B/calcineurin (PP2B/CaN) to AMPA receptors to regulate GluR1 phosphorylation. Here, we report that brief NMDA receptor activation leads to persistent redistribution of AKAP79/150 and PKA-RII, but not PP2B/CaN, from postsynaptic membranes to the cytoplasm in hippocampal slices. Similar to LTD, AKAP79/150 redistribution requires PP2B/CaN activation and is accompanied by GluR1 dephosphorylation and internalization. Using fluorescence resonance energy transfer microscopy in hippocampal neurons, we demonstrate that PKA anchoring to AKAP79/150 is required for NMDA receptor regulation of PKA-RII localization and that movement of AKAP–PKA complexes underlies PKA redistribution. These findings suggest that LTD involves removal of AKAP79/150 and PKA from synapses in addition to activation of PP2B/CaN. Movement of AKAP79/150–PKA complexes from the synapse could further favor the actions of phosphatases in maintaining dephosphorylation of postsynaptic substrates, such as GluR1, that are important for LTD induction and expression. In addition, our observations demonstrate that AKAPs serve not solely as stationary anchors in cells but also as dynamic signaling components.
Keywords: A-kinase anchoring proteins, AMPA receptor, LTD, PKA, synaptic plasticity, FRET
Introduction
Hippocampal NMDA receptor-dependent long-term depression (LTD) and long-term potentiation (LTP) are thought to play major roles in learning and memory (Malenka and Bear, 2004). The postsynaptic density (PSD) of excitatory neurons contains NMDA and AMPA receptors in complexes with cytoskeletal, scaffold, and signaling proteins (Kim and Sheng, 2004). AMPA receptors mediate the bulk of fast excitatory synaptic transmission and express synaptic plasticity through alterations in channel activity and synaptic localization that are in part regulated by receptor phosphorylation (Malinow and Malenka, 2002; Bredt and Nicoll, 2003). Association of AMPA receptors with scaffold proteins linked to intracellular signaling pathways is central to these processes.
Human A-kinase anchoring protein 79/rat 150 (AKAP79/150; also AKAP5) is a postsynaptic scaffold protein that binds cAMP-dependent protein kinase (PKA) and protein phosphatase 2B/calcineurin (PP2B/CaN; also PPP3) (Bauman et al., 2004). Associations with the actin cytoskeleton, acidic phospholipids, and cadherins target AKAP79/150 to the postsynaptic membrane (Dell’Acqua et al., 1998; Gomez et al., 2002; Gorski et al., 2005). AKAP79/150 also binds to the membrane-associated guanylate kinase (MAGUK) scaffold proteins PSD-95 and SAP97 (synapse-associated protein 97), linking the AKAP to NMDA and AMPA receptors (Colledge et al., 2000). AKAP79/150 anchoring of PKA and PP2B/CaN bidirectionally regulates AMPA receptor activity and glutamate receptor 1 (GluR1) subunit phosphorylation in transfected cells (Colledge et al., 2000; Dell’Acqua et al., 2002; Tavalin et al., 2002). Similar PKA and PP2B/CaN regulation of AMPA receptors occurs during LTP and LTD (Song and Huganir, 2002; Lee et al., 2003). PKA phosphorylation of AMPA GluR1–Ser845 is thought to promote synaptic incorporation during LTP (Lee et al., 2000; Esteban et al., 2003). In contrast, expression of NMDA receptor-dependent LTD has been associated with GluR1–Ser845 dephosphorylation and endocytosis of AMPA receptors through pathways involving protein phosphatase 1 (PP1) and PP2B/CaN (Lee et al., 1998, 2000, 2003; Carroll et al., 1999a; Ehlers, 2000; Lin et al., 2000). Recent studies show that synthetic peptide disruption of PKA anchoring in hippocampal neurons leads to PP2B/CaN-dependent rundown of AMPA receptor currents and removal of receptors from the cell surface in a manner mimicking LTD (Tavalin et al., 2002; Snyder et al., 2005).
In hippocampal neurons, NMDA treatments that activate PP2B/CaN disrupt association of AKAP79/150 with PSD-95 and cadherins, leading to loss of the AKAP from spines coincident with removal of AMPA receptors from synapses, suggesting links to LTD (Halpain et al., 1998; Gomez et al., 2002; Gorski et al., 2005). These previous studies also observed greater NMDA-stimulated PKA redistribution than PP2B/CaN, suggesting that PKA might move from synapses anchored to AKAP79/150. However, these studies used higher doses and longer applications of NMDA than necessary for LTD induction. Additionally, it was not examined whether decreases in postsynaptic localization of AKAP79/150 and PKA persist after the initial stimulus as would be predicted for an LTD mechanism. Thus, here we examine localization of AKAP79/150–PKA complexes in cultured hippocampal neurons and acutely prepared hippocampal slices at various time points after minimal NMDA treatments that induce LTD at many synapses simultaneously (chem-LTD) (Lee et al., 1998).
Materials and Methods
Hippocampal slice preparation.
All animal use was approved by the University of Colorado Health Sciences Center Institutional Animal Use and Care Committee. Male Sprague Dawley rats, postnatal day 21 (P21) to P28, were killed by decapitation, and the brains were rapidly removed into ice-cold dissection buffer (2.6 mm KCl, 3 mm MgCl2, 1 mm CaCl2, 1.23 mm NaH2PO4, 10 mm dextrose, 212.7 mm sucrose, and 26 mm NaHCO3). CA1 minislices were prepared as described previously (Grosshans et al., 2002; Alvestad et al., 2003). The hippocampi were removed and unrolled along the hippocampal fissure. Two cuts were made to isolate the CA1 region. CA1 slices (400 μm) were prepared and transferred to a holding chamber containing artificial CSF (ACSF) (in mm: 124 mm NaCl, 5 KCl, 1.25 NaH2PO4, 10 dextrose, 1.5 MgCl2, 2.5 CaCl2, and 26 NaHCO3) bubbled with 95% O2/5% CO2 maintained at 32°C. The slices were allowed to recover for a minimum of 90 min before use in experiments. For chem-LTD NMDA treatment followed by biochemical assay, slices were transferred to a 12-well multiwell plate with mesh inserts (Fisher Scientific, Houston, TX) supplied with 95% O2/5% CO2. For drug treatment, the mesh insert was transferred to a new well containing the drug of interest diluted in freshly oxygenated ACSF (well volume, 4–5 ml) for the times indicated. d-(−)-2-Amino-5-phosphonopentanoic acid (AP-V) (Tocris, St. Louis, MO) was incubated with the slices for 20 min before chem-LTD NMDA treatment. Cyclosporine A (Calbiochem, La Jolla, CA) was added 30 min before treatment. For chem-LTD NMDA treatment, the mesh insert was transferred to a new well containing 20 μm NMDA (Tocris) plus or minus drugs for 3 min, and the insert was returned to a well containing fresh ACSF before slices were transferred back to the holding chamber for the posttreatment incubation.
Subcellular fractionation.
Dounce homogenates (H) were prepared using glass homogenizers from treated and control untreated hippocampal CA1 minislices in homogenization buffer (HB) [10 mm Tris base, pH 7.6, 320 mm sucrose, 150 mm NaCl, 5 mm EDTA, 5 mm EGTA, 1 mm benzamidine, 1 mm 4-(2-aminoethyl)benzenesulfonyl fluoride, 2 μg/ml leupeptin, 2 μg/ml pepstatin, and 50 mm NaF]. The homogenates were centrifuged at 960 × g to remove nuclei and large debris (P1). Crude synaptosomal membranes (P2) were prepared from supernatants (S1) by centrifugation at 10,000 × g. The P2 pellet was homogenized in HB, and an aliquot was taken for Western analysis. PSD fractions (TxP) were generated by incubating the remaining P2 sample on ice in HB plus 0.5% Triton X-100 for 20 min followed by centrifugation at 32,000 × g. Final pellets were sonicated in resuspension buffer (RB) (10 mm Tris, pH 8, 1 mm EDTA, and 1% SDS). Protein concentrations were determined using the Bio-Rad (Hercules, CA) protein assay kit, and equal concentrations of P2 and the final supernatant (S2) were resolved on Tris-SDS gels and transferred in 20% methanol to nitrocellulose. Primary antibodies were incubated with the membranes for a minimum of 90 min before detection with horseradish peroxidase (HRP)-coupled secondary antibodies (Bio-Rad) followed by enhanced chemiluminescence (ECL) (West Pico Chemiluminescent Substrate or West Dura Extended Duration Chemiluminescent Substrate; Pierce, Rockford, IL). AKAP150 antibody was a gift from Dr. Yvonne Lai (Icos, Bothel WA). GluR1, GluR2/3, phosphoserine GluR1–Ser831, phosphoserine GluR1–Ser845, and PSD-95 family antibodies were from Upstate (Lake Placid, NY). PKA-RIIβ, PKA-RIIα, and PKA-RI antibodies were from Transduction Labs (Los Angeles, CA). PKA catalytic subunit antibody was from Santa Cruz Biotechnology (Santa Cruz, CA). Calcineurin A antibody was from Sigma (St. Louis, MO). Immunoreactivity was imaged using the Alpha Innotech (San Leandro, CA) ChemiImager System. The ratio of immunoreactivity observed in the P2 fraction compared with that in the S2 fraction was calculated using the AlphaEase software and Excel. After initial antibody detection, the membranes were stripped at 60°C for 1 h using Restore stripping buffer (Pierce) followed by several washes in Tris-buffered saline plus Tween and a single wash in blotto. A second set of antibodies was applied as described above.
Semiquantitative Western blot analysis of protein concentration in the Triton PSD pellet (TxP) was performed as described previously (Grosshans et al., 2002; Alvestad et al., 2003). Briefly, a 5 point standard curve of hippocampal total protein was included on each gel. The integrated density values generated by the standard curve for each antibody were plotted as a line, and the unknowns quantified from the linear range of the curve. Final values were expressed as a percentage of the protein concentration in the control sample (Grosshans et al., 2002; Alvestad et al., 2003).
Chemical cross-linking to measure GluR1 internalization.
Chemical cross-linking was performed essentially as described previously (Grosshans et al., 2002). After the desired post-chem-LTD incubation period, slices were transferred to Eppendorf tubes containing ice-cold ACSF plus or minus 1 mg/ml bis(sulfosuccinimidyl)suberate (BS3) (Pierce) and placed on a nutator for 45 min at 4°C. To quench the remaining BS3, the slices were washed three times in ice-cold ACSF containing 20 mm Tris, pH 7.6, and sonicated into RB. After homogenization, protein concentration was determined by the Bio-Rad protein assay. Samples were run on Tris-SDS gels and transferred in 10% methanol to polyvinylidene difluoride (PVDF). GluR1 surface versus internal expression was determined by calculating the ratio of immunoreactivity in the BS3-treated samples (internal receptors) to that in the un-cross-linked controls (total receptors). When indicated, membranes were stripped and reprobed as described above.
GluR1 phosphoserine analysis.
After the desired post-chem-LTD incubation period, slices were sonicated into RB, protein concentration was determined, and samples were resolved on Tris-SDS gels. After transfer to PVDF in 10% methanol, membranes were dipped in 100% methanol and dried. The membranes were reactivated in 100% methanol and washed in water. For phosphoserine GluR1–Ser845 and phosphoserine GluR1–Ser831 detection, the blots were processed according to the primary antibody manufacturer’s recommendation followed by incubation with HRP-coupled secondary antibody and ECL. Immunoreactivity was detected and analyzed using the ChemiImager system. After phosphoserine detection, the membranes were stripped as described above and reprobed using GluR1 primary antibody. The ratio of phosphoserine GluR1 to total GluR1 protein was determined within the same sample.
Primary hippocampal neuron culture.
Hippocampal neurons were cultured as described previously (Gomez et al., 2002) with slight modifications. Briefly, the hippocampi from P0–P2 Sprague Dawley rats were dissociated and plated at low density (40,000 cells/ml) on glass coverslips coated with poly-d-lysine and laminin (Discovery Labware; BD Biosciences, Mountain View, CA) for immunostaining or transfected with the desired constructs using the Amaxa (Gaithersburg, MD) Nucleofector I according to manufacturer’s recommendations (Gorski et al., 2005). Transfected neurons were plated at medium density (200,000 cells/ml) for live-cell imaging into 35 mm glass-bottom dishes. Low-density cultures were fed with glia-conditioned media.
Mammalian cDNA expression vectors.
The pEGFPN1 (Clontech, Palo Alto, CA) vectors encoding C-terminal cyan/yellow fluorescent protein (C/YFP) fusions of AKAP79WT, AKAP79ΔPKA (pECFPN1-AKAP79, pEYFPN1-AKAP79), PKA-RIIα (pECFPN3-RIIα, pEYFPN3-RIIα), and PSD-95–CFP (pECFPN1-PSD-95) were described previously (Gomez et al., 2002; Oliveria et al., 2003; Gorski et al., 2005).
Immunocytochemistry.
Cultured hippocampal neurons were washed in PBS before fixing in 3.7% formaldehyde/PBS (10 min) and permeabilization in 0.2% Triton X-100 in PBS (10 min). Cells were blocked in PBS plus 10% BSA overnight at 4°C. Primary antibodies were incubated for 2 h at room temperature in blocking buffer as follows: 1:1000 rabbit anti-AKAP150, 1:200 mouse anti-PSD-95 (ABR), 1:250 mouse anti-MAP2 (Transduction Labs), 1:200 mouse anti-PKA-RIIβ (Transduction Labs), and 1:500 rabbit anti-synaptophysin (Santa Cruz Biotechnology). After incubation with primary antibody, cells were washed in PBS, followed by a single wash in PBS plus BSA, and incubated in fluorescent secondary antibody conjugates [goat anti-mouse- or goat anti-rabbit-Texas Red (1:250); -A488 (1:500) or -A647 (1:250) (Invitrogen, Eugene, OR)] for 1 h at room temperature. Coverslips were then washed extensively in PBS and water before mounting on glass slides with Pro-long (Invitrogen).
Fluorescence microscopy and quantitative digital image analysis.
Live-cell imaging of neurons was performed on an inverted Zeiss (Oberkochen, Germany) Axiovert 200M with 100× plan-apo/1.4 numerical aperture objective, 175 W xenon illumination, Coolsnap CCD camera, and Slidebook 4.0 software (Intelligent Imaging Innovations, Denver, CO). Live cells were maintained at 33°C and ∼5% CO2 during the entire imaging period. For detection of indirect immunofluorescence or direct fluorescence of C/YFP, three-dimensional z-stacks of xy planes with 0.5 μm steps were collected for the entire cell imaged. Images were deconvolved to the nearest neighbor to generate confocal xy sections. Two-dimensional maximum intensity projection images were generated to better represent a complete picture of dendrites and spines and used for quantitative mask analysis (see below).
Quantitation of fluorescence signals in hippocampal neurons was performed as described previously using Slidebook 4.0 (Gomez et al., 2002). Dendrite/soma and dendritic spine/shaft ratio measurements were achieved by drawing masks as described previously (Gomez et al., 2002). Measurements of colocalization in dendritic masks are presented as correlation r values from −1 to +1 that were measured using built-in algorithms in Slidebook 4.0. Values >0 indicate colocalization, with 1 being perfect overlap of the two proteins. A value of 0 indicates random distribution and negative r values imply nonoverlapping proteins in the same subcellular location. Fluorescence micrograph images were exported as RGB TIFF files and assembled into figures using Adobe Photoshop 7.0.
Fluorescence resonance energy transfer microscopy.
For fluorescence resonance energy transfer (FRET) analysis, CFP, YFP, and FRET were detected in single focal planes using the “micro-FRET” method. Briefly, three images are captured as follows: (1) YFP excitation/YFP emission, (2) CFP excitation/CFP emission, and (3) CFP excitation/YFP emission (raw FRET) and then fractional image subtraction to correct for both CFP bleed-through (0.55), YFP cross-excitation (0.016), and background in raw FRET images, which are used to yield FRETc images showing sensitized FRET emission. Mean intensity values used to calculate donor normalized FRET intensity (FRETN = (FRETc/CFP) × 100) were obtained by mask analysis in Slidebook 4.0 as previously described (Oliveria et al., 2003).
Statistical analysis.
Analysis of data was performed in Prism using one-way ANOVA followed by Newman–Keuls post hoc analysis for group data as indicated in the figures. Pairwise analysis was performed using one-tailed t tests. Data are expressed as mean ± SEM in all figures.
Results
Chem-LTD NMDA receptor activation induces a persistent loss of AKAP150 from synapses in cultured hippocampal neurons
In previous work, application of 50 μm NMDA for 10 min caused redistribution of both AKAP150 and PKA-RIIβ from dendritic spines to the cytoplasm of dendrite shafts and the cell body of cultured hippocampal neurons (Gomez et al., 2002). Thus, we wanted to examine the effects of milder chem-LTD NMDA receptor activation (20–25 μm for 3 min) on AKAP150 localization. Using low-density cultured rat hippocampal neurons, we found that chem-LTD treatment caused a persistent loss of AKAP150 from dendritic spines (Fig. 1A). Under control conditions, AKAP150 was mostly punctate and colocalized with PSD-95. However, treatment of neurons with 25 μm NMDA for 3 min at 37°C caused AKAP150 immunoreactivity to shift toward dendrite shafts and the cell soma 15 min after NMDA (Fig. 1B). Importantly, loss of AKAP150 from synapses persisted 30 min after NMDA treatment (Fig. 1C,D). To quantify this effect, AKAP150 colocalization with PSD-95 was measured as an r value ranging from −1 (no overlap) to 0 (random distribution) to +1 (perfect colocalization). We observed that the AKAP150/PSD-95 colocalization r value decreased from 0.43 in control dendrites to approximately zero 15 min after NMDA, a highly significant change (Fig. 1D). By 30 min after NMDA treatment, the r value was negative, indicating that AKAP150 had clearly moved away from PSD-95. Despite a loss of clustering, the overall mean intensity levels for AKAP150 were unchanged as a result of NMDA treatment (data not shown). This is consistent with previous studies showing no change in the levels of AKAP150 in cultured neurons after stronger NMDA stimulation (Gomez et al., 2002; Gorski et al., 2005). As a control to ensure that the effect of chem-LTD on AKAP150 localization was not attributable to a nonspecific redistribution of dendritic proteins including other AKAPs, we examined immunoreactivity of an unrelated but abundant neuronal AKAP, microtubule-associated protein 2 (MAP2). Chem-LTD treatment had no effect on dendritic localization of MAP2 (supplemental Fig. 1, available at www.jneurosci.org as supplemental material).
Figure 1.
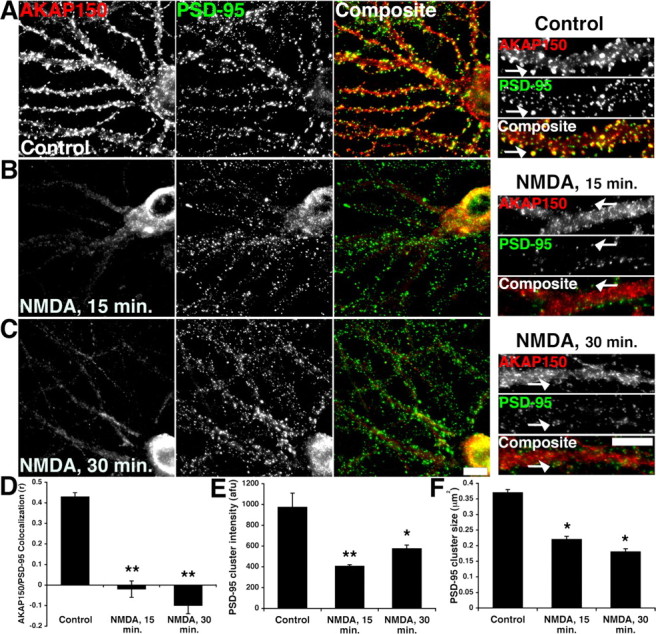
Regulation of AKAP150 postsynaptic localization with PSD-95 by chem-LTD NMDA receptor activation in hippocampal neurons. A, Endogenous AKAP150 (red) and PSD-95 (green) colocalize in dendrites of 19–21 d in vitro hippocampal neurons under control conditions. The small panels show magnifications of dendrites. The arrows indicate colocalization of AKAP150 and PSD-95 clusters. B, C, Chem-LTD treatment (25 μm NMDA; 3 min at 37°C) decreases AKAP150 postsynaptic localization with PSD-95 15 min (B) and 30 min (C) after NMDA treatment with redistribution of AKAP150 from dendritic spines into the dendritic shaft and cell soma. D, Quantification of AKAP150 colocalization with PSD-95 from A–C expressed as correlation r values [control r, 0.43 ± 0.02; NMDA (15 min), r = −0.02 ± 0.04; NMDA (30 min), r = −0.1 ± 0.04; n = 9 for all conditions]. E, F, PSD-95 cluster intensity (E) and size (F) decrease after chem-LTD treatment when imaged at the same exposure level as seen in the higher magnification panels in A–C. Puncta intensity is expressed as arbitrary fluorescence units (afu): control, 973 ± 137; NMDA (15 min), 405 ± 15; NMDA (30 min), 575 ± 35 (n = 9 for each condition). PSD-95 cluster size is expressed in square micrometers (μm2): control, 0.37 ± 0.01; NMDA (15 min), 0.22 ± 0.01; NMDA (30 min), 0.18 ± 0.01 (*p < 0.01; **p < 0.001; ANOVA). In A–C, the small panels on the right show magnifications of dendrites, with arrows indicating PSD-95 clusters colocalized with AKAP150 in controls but not after NMDA. Scale bars, 10 μm. Data are expressed as mean ± SEM.
Previous work by Colledge et al. (2003) indicated that chem-LTD treatment of cultured neurons induces proteosomal degradation of PSD-95, leading to its decreased synaptic clustering through a pathway that is activated by PP2B/CaN and inhibited by PKA. Furthermore, this PSD-95 degradation is thought to contribute to the removal of synaptic AMPA receptors. Therefore, we quantified both PSD-95 cluster intensity and size after chem-LTD treatment of cultured hippocampal neurons. As illustrated in the smaller panels of Figure 1A–C, when imaged under the same settings, there was a significant decrease in PSD-95 cluster intensity and size quantified both 15 and 30 min after NMDA treatment (Fig. 1E,F). Thus, in parallel with AKAP150 redistribution, we have observed other PKA- and PP2B/CaN-regulated events that are linked to LTD in cultured neurons.
Chem-LTD NMDA receptor activation causes a persistent redistribution of AKAP150 into the cytoplasm in CA1 hippocampal slices
Our findings in cultured neurons suggest that redistribution of AKAP79/150 may play a role in the early stages of LTD. Thus, we wanted to determine whether chem-LTD NMDA receptor activation also induces a long-lasting redistribution of endogenous AKAP150 in a more intact brain slice preparation. To this end, we analyzed AKAP150 subcellular localization in acute rat CA1 hippocampal minislices fractionated into synaptosomal membrane (P2) and soluble cytoplasmic (S2) fractions. In chem-LTD-treated slices, AKAP150 immunoreactivity was increased in the S2 fraction 15 min after NMDA treatment when compared with untreated controls (Fig. 2A). This shift corresponded to an ∼70% increase in the amount of AKAP150 in S2 relative to the amount in P2 (Fig. 2B). As expected, the NMDA receptor antagonist AP-V blocked redistribution of AKAP150. Consistent with a change in AKAP150 subcellular distribution but not protein levels, there was no change in the amount of AKAP150 in whole homogenates after any treatments (data not shown). Thus, although redistribution of AKAP150 into the cytoplasm in CA1 slices after chem-LTD treatment is less dramatic and complete than seen by immunostaining of cultured neurons, it is clearly detectable using subcellular fractionation of acute hippocampal minislices.
Figure 2.

Chem-LTD NMDA treatment of acute hippocampal slices induces redistribution of AKAP150, GluR1–Ser845 dephosphorylation, and GluR1 internalization. A, Representative blots illustrating an increase in AKAP150, but not PSD-95, immunoreactivity in the S2 cytosolic fraction 15 min after chem-LTD treatment (20 μm NMDA; 3 min at 34°C) of hippocampal CA1 minislices. AKAP150 redistribution is blocked by pretreatment with AP-V. B, AKAP150 S2/P2 (synaptosomal membrane) immunoreactivity ratios calculated for experiments in A normalized to control reveal a 73 ± 28% increase in AKAP150 immunoreactivity present in S2 with NMDA (*p < 0.05; n = 10; ANOVA). C, Dephosphorylation of GluR1–Ser845 detected 15 min after NMDA treatment is attenuated by pretreatment with AP-V. GluR1–Ser845 phosphorylation detected by immunoblotting (top panel) was quantified by normalizing to total GluR1 levels for each treatment group and is expressed as a percentage of control (bottom panel). NMDA treatment caused a 60 ± 9% reduction in GluR1–Ser845 phosphorylation (*p < 0.01; n = 6; ANOVA). D, Parallel analysis showed no change in the GluR1–Ser831 phosphorylation with NMDA treatment. E, AMPA receptor internalization detected 15 min after chem-LTD treatment. Increased GluR1 immunoreactivity resistant to BS3 cross-linking (internal receptors; top panel) in NMDA-treated samples with no change in total GluR1 (no BS3 added; middle panel). Data were quantified by normalizing internalized GluR1 to total GluR1 immunoreactivity (bottom panel), revealing a 64.48 ± 17.75% increase relative to control in the internalized GluR1 after NMDA treatment (*p < 0.01; n = 20; ANOVA). F, Graph illustrating changes in S2/P2 distribution of AKAP150 (closed diamonds), GluR1 internalization (open circles), and GluR1–Ser845 phosphorylation (closed circles) normalized to controls at various times after NMDA treatment. Each data point is significantly different from its respective time point control (p < 0.05; ANOVA) except for AKAP150 at 5 min. Data are expressed as mean ± SEM.
Consistent with some PSD-95 remaining clustered at synapses as seen in cultured neurons, we observed no change in the S2/P2 distribution of PSD-95 after chem-LTD treatment of hippocampal minislices (Fig. 2A). However, in contrast to observations in culture, we detected no reduction in the total amount of PSD-95 present in synapses (P2) or whole homogenates (data not shown) after chem-LTD treatment. Thus, either degradation of PSD-95 does not occur in the slice preparation or it is too small an effect to be detected by our methods. However, in parallel slice studies below, we were able to detect biochemical changes in AMPA receptor phosphorylation and subcellular localization associated with LTD.
In particular, GluR1–Ser845 dephosphorylation and internalization of AMPA receptors are thought to occur during LTD (Carroll et al., 1999b; Beattie et al., 2000; Ehlers, 2000; Lin et al., 2000). Consistent with previous studies (Lee et al., 1998), chem-LTD treatment of hippocampal CA1 minislices caused a ∼60% decrease in the phosphorylation state of GluR1–Ser845 with no change in GluR1–Ser831 phosphorylation 15 min after treatment (Fig. 2C,D). In addition, chem-LTD treatment led to a significant decrease in the surface level of the GluR1 subunit, as determined by cross-linking of receptor extracellular domains using BS3, a membrane-impermeable reagent. This decrease in surface GluR1 was indirectly observed as a ∼65% increase in the remaining immunoreactivity representing internal receptors not subject to BS3 cross-linking (Fig. 2E). Similar internalization was observed for AMPA receptor GluR2/3 subunits (data not shown). GluR1 internalization and Ser845 dephosphorylation were both blocked by pretreatment with AP-V. Next, we wanted to determine whether GluR1 and AKAP150 regulation occurred within the same time frame. Dephosphorylation and internalization of GluR1 could be observed as early as 5 min after chem-LTD treatment and persisted at 15 and 30 min, whereas redistribution of AKAP150 was not significant until 15 and 30 min after treatment (Fig. 2F). Thus, initial changes in GluR1 phosphorylation and internalization slightly precede detectable changes in the localization of AKAP150.
Chem-LTD NMDA receptor activation leads to a persistent redistribution of PKA, but not PP2B/CaN, into the cytoplasm in CA1 hippocampal slices
As mentioned above, AKAP150 translocation from synapses might also redistribute PKA within neurons. In support of this idea, fractionation of slices 15 min after chem-LTD treatment showed a significant shift of PKA-RIIβ immunoreactivity into S2 (Fig. 3A). Concomitant with this shift in PKA regulatory subunit distribution was a smaller, yet statistically significant, shift in the immunoreactivity of PKA catalytic subunits (Fig. 3B). Additionally, we examined PKA-RIIα, which binds to AKAP79/150 with an affinity similar to PKA-RIIβ but is not as highly expressed in hippocampus; and PKA-RI, which is highly expressed in neurons but does not bind to AKAP79/150 with high affinity (Leiser et al., 1986; Hausken et al., 1996; Wong and Scott, 2004). Chem-LTD treatment of CA1 minislices resulted in a significant redistribution of PKA-RIIα immunoreactivity (Fig. 3C) but no change in PKA-RI (Fig. 3D). Chem-LTD NMDA treatment also induced a highly variable minor shift of PP2B/CaN toward S2, which was not significant (Fig. 3E). Importantly, changes in localization of PKA-RIIβ closely paralleled those seen with AKAP150 over the same time points after chem-LTD treatment (Fig. 3F). However, PKA catalytic redistribution was significant only at 15 min after chem-LTD treatment, whereas PP2B/CaN showed no significant redistribution at any time point. These results are similar to previous immunostaining studies of cultured neurons, in which PP2B/CaN staining was decreased in dendritic spines after NMDA treatment, but not as completely as AKAP79/150 and PKA-RIIβ (Gomez et al., 2002).
Figure 3.
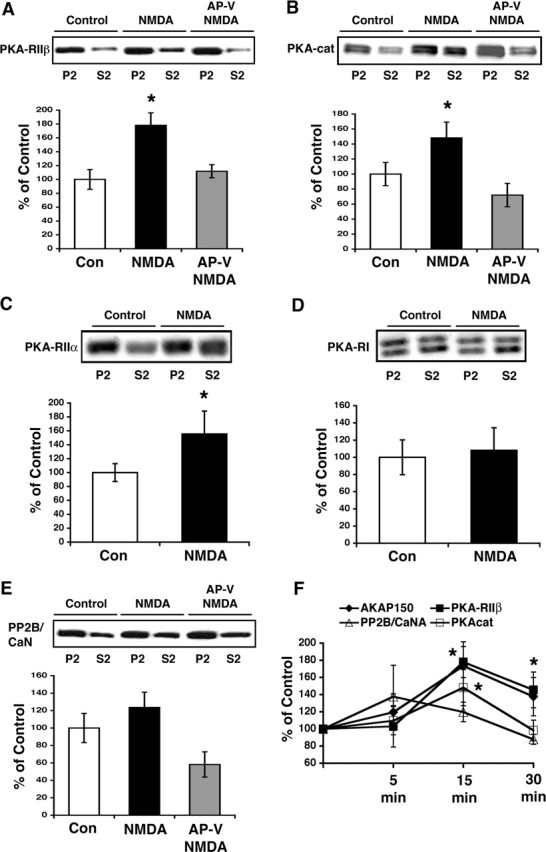
Chem-LTD NMDA treatment causes a redistribution of PKA-RII regulatory subunits and PKA catalytic but not PKA-RI or PP2B/CaN A subunits in hippocampal CA1 minislices. A, PKA-RIIβ immunoreactivity in S2 increases 15 min after NMDA treatment. PKA-RIIβ redistribution is blocked by pretreatment with AP-V (top panel). Calculation of PKA-RIIβ S2/P2 immunoreactivity ratios normalized to control shows a 78 ± 18% increase after NMDA (*p < 0.05; n = 10; ANOVA). B, PKA catalytic immunoreactivity shifts into cytosolic fractions in response to NMDA (top panel) with the S2/P2 ratio calculated to be increased by 48.2 ± 21% (bottom panel) (*p < 0.05; n = 11; ANOVA). The antibody recognizes both α and β forms of the PKA catalytic subunit. C, PKA-RIIα immunoreactivity also redistributes from P2 to S2 in response to chem-LTD treatment (top panel). This somewhat more variable, yet still significant, shift represents a 55.4 ± 33% increase in the S2/P2 ratio after NMDA treatment (*p < 0.05; n = 8; t test). D, PKA-RI immunoreactivity does not redistribute in response to NMDA (top panel) with the S2/P2 ratio calculated to be 108 ± 8% of control (p > 0.05; n = 8; t test). E, PP2B/CaN A subunit immunoreactivity also shows little redistribution in response to NMDA (top panel) with only a slight S2/P2 ratio increase (bottom panel) (23.6 ± 17%) that does not reach statistical significance (p > 0.05; n = 10; ANOVA). The antibody recognizes both α and β forms of the PKA-RI subunit. F, Line graph illustrating the effects of chem-LTD on the localization of AKAP150 and associated proteins at various times after NMDA. Increases in AKAP150 (closed diamond) and PKA-RIIβ (closed square) S2/P2 distributions parallel each other with little change seen in the distributions of PP2B/CaN A (open triangle). PKA catalytic (open square) subunit appears to shift only at the 15 min time point. The asterisks denote significance from the respective control for AKAP150, PKA-RIIβ, and PKA catalytic at the indicated time points only (p < 0.05; ANOVA). Data are expressed as mean ± SEM.
Because we have observed redistribution of AKAP150 and PKA-RII subunits from the membrane P2 fraction to a more cytosolic S2 fraction, we wanted to more directly examine the relative concentration of these proteins at the PSD after chem-LTD treatment. Using semiquantitative Western analysis of the Triton-insoluble pellet obtained after subcellular fractionation, we found a 50% reduction in the amount of AKAP150 at the PSD 15 min after chem-LTD treatment (Fig. 4A). Additionally, the levels of both PKA-RIIβ and PKA-RIIα in the PSD are reduced by ∼40 and 25%, respectively (Fig. 4B,C). These reductions confirm that chem-LTD treatment results in a loss of AKAP79/150 and PKA from the postsynaptic density.
Figure 4.

Chem-LTD treatment reduces the amount of AKAP150 and PKA-RII present in PSD fractions. A, Semiquantitative Western analysis shows a reduction in the amount of AKAP150 in the Triton-insoluble pellet after NMDA treatment (top panel). AKAP150 levels were determined to be 50.2 ± 4% of the control amount (bottom panel) (*p < 0.05; n = 4; t test). B, PKA-RIIβ also is reduced in the Triton-insoluble pellet (top panel) to 60.4 ± 4% of control (bottom panel) (*p < 0.05; n = 4; t test). C, NMDA treatment induces a similar loss in PKA-RIIα levels in the PSD fraction (top panel) to 74.9 ± 6% of control levels (bottom panel) (*p < 0.05; n = 4; t test). Data are expressed as mean ± SEM.
Persistent AKAP150 redistribution requires PP2B/CaN activation
From our findings above, it appears that that the effects of chem-LTD on PKA localization are greater than on PP2B/CaN localization, an observation that could be important for LTD, because previous work demonstrated that chem-LTD requires PP2B/CaN activation and dephosphorylation of PKA substrates (Kameyama et al., 1998). In addition, NMDA regulation of AKAP79/150 targeting in cultured neurons requires PP2B/CaN activation (Gomez et al., 2002). Therefore, we explored the CaN/PP2B dependence of AKAP150 redistribution 30 min after NMDA treatment. As expected, chem-LTD-induced redistribution of AKAP150 into S2 was blocked by pretreatment of hippocampal CA1 minislices with cyclosporine A (Fig. 5A,B).
Figure 5.

Chem-LTD NMDA-induced redistribution of AKAP150 in hippocampal CA1 minislices requires PP2B/CaN activity. A, Redistribution of AKAP150 into S2 detected 30 min after NMDA treatment is blocked by preincubation with 10 μm cyclosporine A (CsA) (30 min). B, AKAP150 S2/P2 immunoreactivity ratios calculated from experiments in A show an increase of 37.6 ± 22% (*p < 0.05; n = 10; ANOVA) after NMDA treatment that is blocked by CsA pretreatment. Data are expressed as mean ± SEM.
NMDA-stimulated PKA-RII redistribution requires anchoring to AKAP79/150
Our findings thus far suggest that PKA may redistribute from synapses after NMDA receptor activation through anchoring to AKAP79/150. Therefore, we wished to demonstrate that AKAP79/150 performs an active role in regulating the synaptic localization of PKA in response to NMDA treatment. As a first step in probing the mechanism by which AKAP79/150 regulates PKA-RIIβ postsynaptic targeting, we transfected wild-type human AKAP79–YFP into cultured rat hippocampal neurons. In untransfected 12- to 14-d-old neurons, endogenous PKA-RIIβ immunoreactivity appeared evenly distributed throughout the dendrite and soma (Fig. 6A) with minimal staining present in dendritic spines colocalized with endogenous AKAP150 (Fig. 6A, top row magnifications). Relatively minor localization of AKAP150 and PKA-RIIβ to spines at this developmental stage is consistent with previous observations (Gomez et al., 2002). In contrast, transfection of AKAP79WT–YFP caused a dramatic increase in punctate staining for endogenous PKA-RIIβ in spines (Fig. 6A, bottom row magnifications) and an increase in PKA-RIIβ localization to the plasma membrane of dendrite shafts and the soma (Fig. 6A). However, transfection of AKAP79 containing a deletion of the PKA anchoring site (AKAP79ΔPKA–YFP) did not show this increase in spine or membrane staining for PKA-RIIβ (Fig. 6B). AKAP79WT–YFP strongly colocalized with PKA-RIIβ, whereas AKAP79ΔPKA–YFP colocalization with PKA-RIIβ was significantly less (Fig. 6E). This result suggests that overexpression of AKAP79WT recruits additional endogenous PKA-RIIβ to dendritic spines and plasma membranes. AKAP79WT–YFP and PKA-RIIβ also colocalized with synaptophysin, and NMDA treatment decreased this colocalization. AKAP79WT–YFP and PKA-RIIβ both showed more diffuse distributions in the shaft and soma after NMDA treatment (Fig. 6D,F). Examination of the colocalization of PKA-RIIβ with synaptophysin revealed that deletion of the PKA anchoring site in AKAP79ΔPKA–YFP reduced synaptic localization of PKA-RIIβ to a level similar to that seen after NMDA treatment in AKAP79WT-expressing neurons (Fig. 6F). However, AKAP79ΔPKA–YFP colocalized with synaptophysin as efficiently as AKAP79WT–YFP, indicating that targeting to synapses was unaltered by the ΔPKA deletion (Fig. 6F). Together, these results show that the level of PKA-RIIβ in dendritic spines can be altered by manipulating the expression level of AKAP79, suggesting that AKAP79/150 plays a key role in controlling the postsynaptic targeting of PKA-RIIβ and its regulation by NMDA receptor activation.
Figure 6.
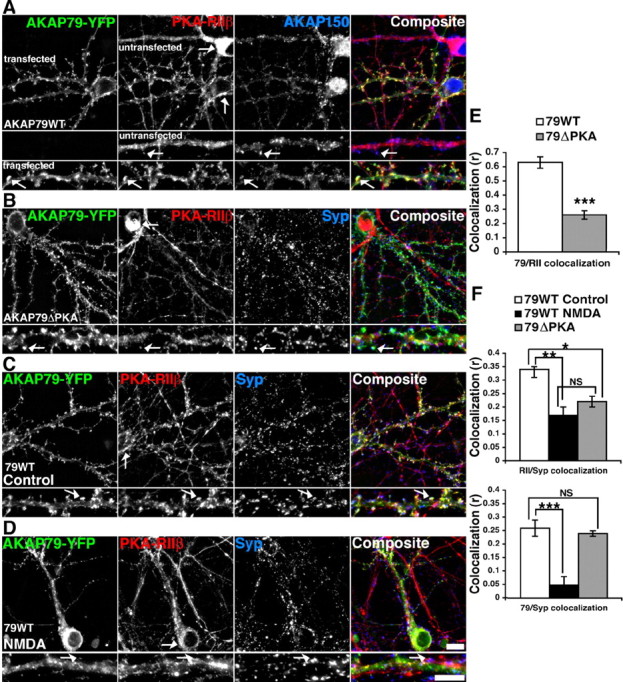
Regulation of PKA-RIIβ postsynaptic localization by overexpression of AKAP79WT but not AKAP79ΔPKA in hippocampal neurons. A, Neurons transfected with AKAP79–YFP (green) and stained at 12–14 d in vitro for PKA-RIIβ (red) and endogenous AKAP150 (blue). Transfection of AKAP79WT–YFP recruits PKA-RIIβ to dendritic spines (arrows, small magnification panels) and the plasma membrane of the soma (arrows, top panel) when compared with neighboring untransfected neurons. B, Hippocampal neurons transfected with AKAP79ΔPKA–YFP (green) and stained for PKA-RIIβ (red) and synaptophysin (Syp) (blue). AKAP79ΔPKA–YFP is targeted to dendritic spines (arrows, small magnification panels) and the plasma membrane of the soma (top panel); however, PKA-RIIβ localization remains similar to that observed in untransfected neurons (see A) with limited localization to spines (arrows, small magnification panels) and a prominent intracellular distribution in the soma (arrow, top panel). C, D, Hippocampal neurons transfected with AKAP79WT–YFP (green), stained for PKA-RIIβ (red) and synaptophysin (blue) under control conditions (C) and after NMDA treatment (50 μm for 10 min at 37°C) (D). The arrows in the high-magnification panels show colocalization of AKAP79WT–YFP and PKA-RIIβ with synaptophysin in control untreated neurons and the lack of colocalization with synaptophysin after NMDA treatment. E, Quantification showing greater dendritic colocalization of AKAP79WT (open bar) (r = 0.63 ± 0.04) than AKAP79ΔPKA (closed bar) (r = 0.26 ± 0.03) with PKA-RIIβ. F, PKA-RIIβ colocalization with synaptophysin is greater in AKAP79WT- (r = 0.34 ± 0.01) versus AKAP79ΔPKA- (r = 0.22 ± 0.02) transfected neurons. NMDA treatment of AKAP79WT neurons decreases PKA-RIIβ colocalization with synaptophysin (r = 0.17 ± 0.03). Colocalization of AKAP79WT and AKAP79ΔPKA with synaptophysin are similar (AKAP79WT, r = 0.26 ± 0.03; AKAP79ΔPKA, r = 0.24 ± 0.01), and this colocalization for AKAP79WT decreases significantly after NMDA treatment (r = 0.05 ± 0.03). *p = 0.002; **p < 0.0001; ***p < 0.000001; NS, p = 0.07; t test; n = 6 for AKAP79WT NMDA and 8 for AKAP79WT and AKAP79ΔPKA conditions. Data are expressed as mean ± SEM. Scale bars, 10 μm.
We turned to live-cell imaging of cultured hippocampal neurons to explore this matter further. Similar to results from fixed neurons, chem-LTD treatment of neurons transfected with AKAP79–YFP and PSD-95–CFP revealed loss of AKAP colocalization with PSD-95 (Fig. 7A,B) quantified 20–40 min after NMDA (Fig. 7C). NMDA-induced redistribution of the AKAP from spines and membranes into the cytoplasm of dendrite shafts and the soma was quantified as decreases in AKAP79–YFP dendritic spine/shaft and dendrite/soma fluorescence ratios (Fig. 7D). Additionally, we generated a time course of AKAP79–YFP movement in response to chem-LTD using time-lapse imaging (supplemental Fig. 2A, available at www.jneurosci.org as supplemental material). Consistent with results for endogenous AKAP150, AKAP79–YFP began moving away from dendritic spines and membranes 15–20 min after NMDA treatment and was clearly present in the dendrite shaft cytoplasm 30 min after treatment.
Figure 7.

NMDA receptor regulation of PKA-RII postsynaptic localization imaged in living hippocampal neurons expressing AKAP79WT but not AKAP79ΔPKA. A, AKAP79WT–YFP (green) and PSD-95–CFP (blue) colocalize on dendritic spines in transfected hippocampal neurons under control conditions. B, This colocalization is lost 20–40 min after chem-LTD treatment (25 μm NMDA; 3 min). C, Quantification of AKAP79WT colocalization with PSD-95 from A and B: control, r = 0.31 ± 0.02, n = 12; NMDA (20–40 min), r = −0.18 ± 0.04, n = 11. D, Quantification of AKAP79WT–YFP fluorescence redistribution from dendrite to soma [dendrite (Dend.)/soma ratio: control, 1.63 ± 0.09, n = 12; NMDA, 0.53 ± 0.06, n = 11] and from dendritic spines to dendrite shafts (spine/shaft ratio: control, 1.66 ± 0.05, n = 12; NMDA, 0.56 ± 0.03, n = 11) 20–40 min after NMDA treatment. E, PKA-RIIα–CFP (blue) is colocalized with AKAP79WT–YFP (green) in dendritic spines under control conditions. F, This spine localization is lost 20–40 min after NMDA treatment. G, H, PKA-RIIα–CFP (blue) is found only in dendrite shafts in AKAP79ΔPKA–YFP- (green) transfected neurons under both control conditions (G) and 20–40 min after NMDA treatment (H). I, Quantification showing equal targeting of AKAP79WT and AKAP79ΔPKA–YFP to dendritic spines in control neurons [spine/shaft ratio: wild type (WT), 1.32 ± 0.04, n = 9; ΔPKA, 1.26 ± 0.04, n = 7] and equal redistribution from spines to dendrite shafts after NMDA treatment (spine/shaft ratio: WT, 0.69 ± 0.05, n = 5; ΔPKA, 0.59 ± 0.08, n = 6). J, PKA-RIIα–CFP shows greater spine localization in AKAP79WT- versus AKAP79ΔPKA-transfected neurons under control conditions (spine/shaft ratio: WT, 0.46 ± 0.05, n = 9; ΔPKA, 0.20 ± 0.04, n = 7). NMDA treatment leads to a reduction in spine localization for PKA-RIIα–CFP expressed with AKAP79WT but not with AKAP79ΔPKA (spine/shaft ratio: WT, 0.25 ± 0.06, n = 5; ΔPKA, 0.24 ± 0.08, n = 6). The spine/shaft ratios for PKA-RIIα–CFP with AKAP79ΔPKA under control conditions and with AKAP79WT after NMDA treatment are not significantly different. K, High-magnification images of dendrites from hippocampal neurons transfected with AKAP79WT–YFP (green) and CFP alone (blue). *p < 0.003; **p < 0.0001; ***p < 0.000001; NS, p > 0.06; t test; n = 12 (C, D) and 5–9 (I, J). Data are expressed as mean ± SEM. In A–H, higher magnification panels on the right include arrows to mark representative dendritic spines. Scale bars, 10 μm.
Imaging of neurons transfected with AKAP79WT–YFP and PKA-RIIα–CFP showed colocalization of both proteins in dendritic spines with additional localization of PKA-RIIα–CFP to dendrite shafts (Fig. 7E). Neurons transfected with AKAP79ΔPKA–YFP and PKA-RIIα–CFP showed targeting of the AKAP to dendritic spines, but no recruitment of PKA-RIIα–CFP (Fig. 7G). This exclusion of PKA-RIIα–CFP from dendritic spines in AKAP79ΔPKA–YFP-transfected neurons was not likely attributable to poor diffusion of soluble unanchored PKA-RIIα–CFP into spine as shown by CFP alone filling both spines and shafts when cotransfected with AKAP79WT–YFP (Fig. 7K). Thus, a more plausible explanation is that PKA-RIIα–CFP was retained in dendritic shafts because of a lack of anchoring to AKAP79ΔPKA, as well as possibly binding to the shaft-localized AKAP MAP2. In support of a significant pool of PKA-RIIα being bound to MAP2, both in AKAP79ΔPKA- and to some extent in AKAP79WT-expressing neurons, an apparent microtubular localization of PKA-RIIα–C/YFP was commonly seen in the interior dendrite shafts (supplemental Fig. 2B, available at www.jneurosci.org as supplemental material).
Chem-LTD treatment of cells transfected with either AKAP79WT or ΔPKA caused AKAP–YFP redistribution from dendritic spines (Fig. 7F,H,I). This result shows that deletion of the PKA anchoring site on the AKAP did not affect targeting regulation by NMDA. However, changes in PKA-RIIα–CFP localization occurred only in the cells transfected with wild-type AKAP, not in the cells transfected with the ΔPKA mutant (Fig. 7J). After NMDA treatment, the PKA-RIIα–CFP dendritic spine/shaft ratio decreased in the presence of AKAP79WT–YFP. This ratio was similar to that seen for PKA-RIIα–CFP in the presence of AKAP79ΔPKA–YFP under control conditions, and NMDA treatment did not further alter the distribution of PKA-RIIα–CFP transfected with AKAP79ΔPKA–YFP (Fig. 7J). Consistent with translocation of PKA-RII with AKAP79 in response to NMDA, time-lapse imaging of cells expressing AKAP79WT–CFP and PKA-RIIα–YFP revealed parallel movement of both proteins from dendritic membranes and spines to the shaft cytoplasm after the addition of NMDA (supplemental Fig. 2B, available at www.jneurosci.org as supplemental material).
Redistribution of AKAP79–PKA complexes imaged using FRET
Finally, we used FRET microscopy to image AKAP–PKA complexes and directly examine the regulation of PKA-RII localization through AKAP79 anchoring. FRET uses nonradiative energy transfer between CFP-donor and YFP-acceptor molecules to detect interaction between two proteins within a distance of ∼5 nm or less. We have previously shown that AKAP79WT–CFP interaction with PKA-RIIα–YFP can be detected by FRET in Cos7 cells (Oliveria et al., 2003). Here, we examined FRET between these two proteins before and after 10 min of treatment with 50 μm NMDA in cultured hippocampal neurons. Transfection of AKAP79WT–CFP and PKA-RIIα–YFP showed colocalization and FRET between these proteins in dendritic spines and membrane structures on the soma (Fig. 8A). As a negative control, transfection of AKAP79ΔPKA–CFP with PKA-RIIα–YFP did not show any colocalization or FRET between the proteins (Fig. 8B).
Figure 8.

NMDA receptor-stimulated redistribution of the AKAP79–PKA complex visualized using FRET microscopy. A, Hippocampal neurons transfected with AKAP79WT–CFP (blue) and PKA-RIIα–YFP (green) show colocalization and corrected, sensitized FRET (FRETc) in dendritic spines (arrows, lower magnification panels) and the soma. B, No FRETc is detected in neurons transfected with AKAP79ΔPKA–CFP (blue) and PKA-RIIα–YFP (green). C, In AKAP79WT–CFP- and PKA-RIIα–YFP-transfected neurons, NMDA treatment (50 μm NMDA for 10 min at 37°C) causes FRETc to move from dendritic spines and membrane structures in the soma (arrows, top panels) to the cytoplasm of dendritic shafts and the soma (bottom panels). In the right-hand panels of A–C, FRETc is shown as false color, in which high relative FRET intensity is red and no FRET is blue. D, High magnification of dendrites showing similar NMDA-stimulated redistributions of FRETc, AKAP79WT–CFP, and PKA-RIIα–YFP from dendritic spines (arrows) to shafts. E, Quantification of spine/shaft ratios for FRETc, AKAP79–CFP, and PKA-RII–YFP in controls (open bar) (FRETc, 1.73 ± 0.12; AKAP79–CFP, 1.68 ± 0.07; PKA-RII–YFP, 1.66 ± 0.09) and after NMDA treatment (closed bar) (FRETc, 0.82 ± 0.05; AKAP79–CFP, 0.75 ± 0.04; PKA-RII–YFP, 0.68 ± 0.09). ***p < 0.000001; t test; n = 13. Data are expressed as mean ± SEM. Scale bars, 10 μm.
NMDA treatment of AKAP79WT–CFP- and PKA-RIIα–YFP-transfected neurons caused the FRET signal to shift from being localized to dendritic spines and membranes into the shaft of the dendrite and soma cytoplasm (Fig. 8C–E). The FRET signal shift from membrane-associated to cytoplasmic was obvious in the cell body, and high magnifications of dendrites also clearly revealed spine-to-shaft relocalization of the FRET signal (Fig. 8D). Similar results were obtained when we examined FRET between AKAP79WT–CFP and PKA-RIIα–YFP in response to chem-LTD treatment (supplemental Fig. 3, available at www.jneurosci.org as supplemental material). Quantification of spine/shaft fluorescence ratios revealed that redistribution of the FRET signal was equivalent to those seen for AKAP79WT–CFP and PKA-RIIα–YFP individually consistent with movement of AKAP–PKA complexes (Fig. 8E). To further evaluate this possibility, we determined the amount of donor-normalized FRET in the dendrites for both treated and control conditions [FRETN = (100 × FRETc/CFP)]. In untreated hippocampal neurons, FRETN was 15 ± 1.4%, and after NMDA treatment, FRETN was 16.9 ± 0.9% (NS; p = 0.25; n = 13) indicating approximately equal levels of AKAP79–PKA-RII complex. Thus, our conclusion is that AKAP–PKA complexes redistribute from dendritic spines to dendrite shafts and the soma in response to NMDA receptor activation.
Discussion
Previous studies in cultured hippocampal neurons have shown that AKAP79/150 is targeted to AMPA and NMDA receptor signaling complexes in the postsynaptic density by its interactions with the actin cytoskeleton, cadherin adhesion molecules, and PSD-95 family MAGUK scaffold proteins and that these interactions are disrupted by treatments with NMDA leading to AKAP loss from synapses (Gomez et al., 2002; Gorski et al., 2005). Our present results extend this work to show that brief treatment of acute hippocampal slices and cultured hippocampal neurons with concentrations of NMDA that elicit long-term synaptic depression (Lee et al., 1998; Beattie et al., 2000) leads to a long-lasting redistribution of AKAP79/150 away from the synapse. Importantly, the current data show that NMDA receptor–PP2B/CaN calcium signaling pathways that underlie LTD and regulate AKAP79/150 localization in hippocampal neuron cultures also perform the same function in the relatively intact circuitry of hippocampal slices. In addition, we demonstrate that AKAP79/150 does not merely anchor PKA in a static manner but that it dynamically recruits PKA to synapses through a mechanism regulated by NMDA receptors. Here, we find that after chem-LTD NMDA treatment of acute hippocampal slices, PKA is lost from the postsynaptic fraction coincident with prolonged AKAP79/150 redistribution and GluR1 internalization and dephosphorylation. These current results confirm and extend our previous findings and those of Snyder et al. in cultured neurons showing that NMDA treatment causes a loss of PKA from synapses coincident with a decrease in surface expression and synaptic localization of AMPA receptors (Gomez et al., 2002; Snyder et al., 2005).
Hippocampal neuron transfection studies with AKAP79WT and a ΔPKA mutant provided confirmation of the direct involvement of AKAP79/150 in this active regulation of PKA-RII postsynaptic localization. Overexpression of AKAP79WT in hippocampal neurons increased the amount of PKA-RII in dendritic spines through formation of AKAP–PKA complexes that were detected by FRET imaging. Deletion of the PKA binding site on the AKAP prevented this recruitment as plainly seen in the presence of the AKAP79ΔPKA mutant where PKA-RII remained shaft localized and no FRET was detected. AKAP79ΔPKA showed normal localization to spines and clearly redistributed from spines to dendrite shafts after NMDA treatment; however, there was no change in the localization of PKA-RII in AKAP79ΔPKA-transfected neurons after NMDA treatment. Using FRET in AKAP79WT-expressing neurons, we found that localization of AKAP–PKA complexes in dendritic spines shifted to the cytoplasm of dendritic shafts and the soma after NMDA treatment, strongly supporting our conclusion that PKA-RII movement from synapses in response to NMDA receptor activation is mediated through translocation anchored to AKAP79/150.
The postsynaptic location of AKAP79/150 is thought to enable it to participate in the regulation of AMPA receptor activity, GluR1–Ser845 phosphorylation, and surface expression by positioning both PKA and PP2B/CaN near the receptor (Colledge et al., 2000; Dell’Acqua et al., 2002; Gomez et al., 2002; Tavalin et al., 2002; Snyder et al., 2005). Importantly, we show that, when AKAP79/150 shifts away from the synapse in response to NMDA receptor activation, it also removes anchored PKA-RII and a smaller amount of PKA catalytic subunit with it. We found a trend toward the removal of the PP2B/CaN A subunit as well; however, this shift did not reach statistical significance. These results are likely attributable to large amounts of PP2B/CaN associated with other proteins in the cell. The PKA catalytic subunit is associated with multiple RI and RII subunits, both in unanchored pools as well as in pools anchored to other AKAPs, such as MAP2, which does not relocalize in response to NMDA. Notably, the PKA-RI subunit appears to be slightly enriched in the cytosolic fraction of hippocampal CA1 minislices under control untreated conditions. Thus, the observation of a smaller redistribution of PKA catalytic is likely the detection of movement of only that pool of catalytic subunit anchored to AKAP79/150. Likewise, PP2B/CaN is an abundant protein that is present in significant soluble pools and also associated with multiple binding proteins. Minimal movement of PP2B/CaN A subunits into the soluble fraction is also consistent with our previous work in fixed hippocampal neurons, in which NMDA treatment induced only partial redistribution of PP2B/CaN B subunits, whereas AKAP79/150 and PKA-RIIβ left dendritic spines more completely (Gomez et al., 2002).
Importantly, the time courses that we observed for AKAP79/150 and PKA-RII redistribution into the cytoplasm closely parallel each other in both cultured neurons and acute slices. These changes in AKAP and PKA localization lag slightly behind detectable changes in AMPA receptor GluR1–Ser845 dephosphorylation and internalization, which were observed within 5 min of NMDA stimulation. Although this time delay could be related to differences in the sensitivities of the methods used to measure these events, an equally plausible explanation is that removal of the AKAP and PKA from synapses is not necessary for initial steps leading to GluR1 dephosphorylation and internalization. However, loss of AKAP79/150–PKA complexes from the PSD at later time points, after sufficient dendritic spine actin reorganization (Gomez et al., 2002), could support the persistent decreases in GluR1 phosphorylation and cell surface localization by preventing membrane reinsertion of internalized receptors, a process that is promoted by PKA (Ehlers, 2000; Snyder et al., 2005). Additionally, our results may provide a mechanistic explanation for the uncoupling of β-adrenergic stimulation of GluR1–Ser845 phosphorylation after NMDA treatment despite normal activation of adenylyl cyclase and production of cAMP (Vanhoose and Winder, 2003).
Our observations that redistribution of AKAP79/150 is not detected immediately after NMDA treatment and that significant redistribution of PP2B/CaN from synapses is not detected even at later times could both be relevant to the functions of PP2B/CaN in LTD. PP2B/CaN is involved in dephosphorylation of GluR1–Ser845 and in endocytosis of both GluR1 and GluR2 in response to NMDA receptor activation (Carroll et al., 1999b; Beattie et al., 2000; Ehlers, 2000; Lin et al., 2000). In particular, dephosphorylation of GluR1–Ser845 by PP2B/CaN leads to decreases in AMPA receptor currents and AKAP79/150 targeting of both the kinase and the phosphatase to AMPA receptors has been implicated in this process (Banke et al., 2000; Dell’Acqua et al., 2002; Tavalin et al., 2002). During induction of LTD, GluR1 dephosphorylation, AMPA receptor internalization, and synaptic depression are thought to be mediated by PP2B/CaN acting in concert with PP1, which may be recruited to dendritic spines (Mulkey et al., 1994; Kameyama et al., 1998; Ehlers, 2000; Lee et al., 2000; Morishita et al., 2001; Snyder et al., 2005). Postsynaptic targeting of PP1 is mediated in part through anchoring to the spinophilin/neurabin actin binding proteins, and interestingly, PP1 targeting through spinophilin/neurabins can be negatively regulated by PKA phosphorylation at both the level of actin targeting and PP1 binding (McAvoy et al., 1999; Hsieh-Wilson et al., 2003). In addition, PKA can negatively regulate PP1 phosphatase activity through phosphorylation of inhibitor 1, and during LTD, PP2B/CaN is thought to activate PP1 through inhibitor 1 dephosphorylation (Mulkey et al., 1994). Therefore, removal of PKA from the synapse in response to NMDA treatment could increase PP1 phosphatase activity at the PSD through multiple mechanisms.
In summary, although anchoring of PP2B/CaN to the AKAP could initially promote rapid AMPA receptor dephosphorylation and internalization stimulated by NMDA receptor calcium influx, subsequent removal of more PKA than PP2B/CaN from synapses after AKAP79/150 translocation could lead to a persistent shift in the balance of kinase to phosphatase activity in the PSD in favor of phosphatases long after termination of the NMDA receptor calcium signal. Thus, redistribution of AKAP79/150–PKA complexes away from synapses may reflect a form of molecular/cellular memory associated with LTD induction and expression that is akin to persistent autophosphorylation and translocation of CaMKII to synapses that is associated with LTP (Colbran and Brown, 2004). In the future, it will be interesting to extend our imaging studies of AKAP79/150 and PKA translocation from chem-LTD treatments that simultaneously induce LTD at many synapses to low-frequency electrical induction of LTD at single synapses.
We thank Yvonne Lai (Icos, Bothel, WA) for providing AKAP150 antibodies. We also thank Drs. K. Ulrich Bayer, Michael Browning, and Rachel Alvestad and members of the Dell’Acqua laboratory for providing advice during manuscript preparation.
References
- Alvestad RM, Grosshans DR, Coultrap SJ, Nakazawa T, Yamamoto T, Browning MD (2003). Tyrosine dephosphorylation and ethanol inhibition of N-methyl-d-aspartate receptor function. J Biol Chem 278:11020–11025. [DOI] [PubMed] [Google Scholar]
- Banke TG, Bowie D, Lee H-K, Huganir RL, Schousboe A, Traynelis SF (2000). Control of GluR1 AMPA receptor function by cAMP-dependent protein kinase. J Neurosci 20:89–102. [DOI] [PMC free article] [PubMed] [Google Scholar]
- Bauman AL, Goehring AS, Scott JD (2004). Orchestration of synaptic plasticity through AKAP signaling complexes. Neuropharmacology 46:299–310. [DOI] [PubMed] [Google Scholar]
- Beattie EC, Carroll RC, Yu X, Morishita W, Yasuda H, von Zastrow M, Malenka RC (2000). Regulation of AMPA receptor endocytosis by a signaling mechanism shared with LTD. Nat Neurosci 3:1291–1300. [DOI] [PubMed] [Google Scholar]
- Bredt DS, Nicoll RA (2003). AMPA receptor trafficking at excitatory synapses. Neuron 40:361–379. [DOI] [PubMed] [Google Scholar]
- Carroll RC, Lissin DV, von Zastrow M, Nicoll RA, Malenka RC (1999a). Rapid redistribution of glutamate receptors contributes to long-term depression in hippocampal cultures. Nat Neurosci 2:454–460. [DOI] [PubMed] [Google Scholar]
- Carroll RC, Beattie EC, Xia H, Luscher C, Altschuler Y, Nicoll RA, Malenka RC (1999b). Dynamin-dependent endocytosis of ionotropic glutamate receptors. Proc Natl Acad Sci USA 96:14112–14117. [DOI] [PMC free article] [PubMed] [Google Scholar]
- Colbran RJ, Brown AM (2004). Calcium/calmodulin-dependent protein kinase II and synaptic plasticity. Curr Opin Neurobiol 14:318–327. [DOI] [PubMed] [Google Scholar]
- Colledge M, Dean RA, Scott GK, Langeberg LK, Huganir RL, Scott JD (2000). Targeting of PKA to glutamate receptors through a MAGUK-AKAP complex. Neuron 27:107–119. [DOI] [PubMed] [Google Scholar]
- Colledge M, Snyder EM, Crozier RA, Soderling JA, Jin Y, Langeberg LK, Lu H, Bear MF, Scott JD (2003). Ubiquitination regulates PSD-95 degradation and AMPA receptor surface expression. Neuron 40:595–607. [DOI] [PMC free article] [PubMed] [Google Scholar]
- Dell’Acqua ML, Faux MC, Thorburn J, Thorburn A, Scott JD (1998). Membrane targeting sequences on AKAP79 bind phosphatidylinositol-4,5-bisphosphate. EMBO J 17:2246–2260. [DOI] [PMC free article] [PubMed] [Google Scholar]
- Dell’Acqua ML, Dodge KL, Tavalin SJ, Scott JD (2002). Mapping the protein phosphatase-2B anchoring site on AKAP79: binding and inhibition of phosphatase activity are mediated by residues 315–360. J Biol Chem 277:48796–48802. [DOI] [PMC free article] [PubMed] [Google Scholar]
- Ehlers MD (2000). Reinsertion or degradation of AMPA receptors determined by activity-dependent endocytic sorting. Neuron 28:511–525. [DOI] [PubMed] [Google Scholar]
- Esteban JA, Shi S-H, Wilson C, Nuriya M, Huganir RL, Malinow R (2003). PKA phosphorylation of AMPA receptor subunits controls synaptic trafficking underlying plasticity. Nat Neurosci 6:136–143. [DOI] [PubMed] [Google Scholar]
- Gomez LL, Alam S, Smith KE, Horne E, Dell’Acqua ML (2002). Regulation of A-kinase anchoring protein 79/150–cAMP-dependent protein kinase postsynaptic targeting by NMDA receptor activation of calcineurin and remodeling of dendritic actin. J Neurosci 22:7027–7044. [DOI] [PMC free article] [PubMed] [Google Scholar]
- Gorski JG, Gomez LL, Scott JD, Dell’Acqua ML (2005). Association of an AKAP signalling scaffold with cadherin adhesion molecules in neurons and epithelial cells. Mol Biol Cell 16:3574–3590. [DOI] [PMC free article] [PubMed] [Google Scholar]
- Grosshans DR, Clayton DA, Coultrap SJ, Browning MD (2002). LTP leads to rapid surface expression of NMDA but not AMPA receptors in adult rat CA1. Nat Neurosci 5:27–33. [DOI] [PubMed] [Google Scholar]
- Halpain S, Hipolito A, Saffer L (1998). Regulation of F-actin stability in dendritic spines by glutamate receptors and calcineurin. J Neurosci 18:9835–9844. [DOI] [PMC free article] [PubMed] [Google Scholar]
- Hausken ZE, Dell’Acqua ML, Coghlan VM, Scott JD (1996). Mutational analysis of the A-kinase anchoring protein (AKAP)-binding site on RII. J Biol Chem 271:29016–29022. [DOI] [PubMed] [Google Scholar]
- Hsieh-Wilson LC, Benfenati F, Snyder GL, Allen PB, Nairn AC, Greengard P (2003). Phosphorylation of spinophilin modulates its interaction with actin filaments. J Biol Chem 278:1186–1194. [DOI] [PubMed] [Google Scholar]
- Kameyama K, Lee H-K, Bear MF, Huganir RL (1998). Involvement of a postsynaptic protein kinase A substrate in the expression of homosynaptic long-term depression. Neuron 21:1163–1175. [DOI] [PubMed] [Google Scholar]
- Kim E, Sheng M (2004). PDZ domain proteins of synapses. Nat Rev Neurosci 5:7771–7781. [DOI] [PubMed] [Google Scholar]
- Lee H-K, Kameyama K, Huganir RL, Bear MF (1998). NMDA induces long-term synaptic depression and dephosphorylation of the GluR1 subunit of AMPA receptors in hippocampus. Neuron 21:1151–1162. [DOI] [PubMed] [Google Scholar]
- Lee H-K, Barbarosie M, Kameyama K, Bear MF, Huganir RL (2000). Regulation of distinct AMPA receptor phosphorylation sites during bidirectional synaptic plasticity. Nature 405:955–959. [DOI] [PubMed] [Google Scholar]
- Lee H-K, Takamiya K, Han J-S, Man H, Kim C-H, Rumbaugh G, Yu S, Ding L, He C, Petralia RS, Wenthold RJ, Gallagher M, Huganir RL (2003). Phosphorylation of the AMPA receptor GluR1 subunit is required for synaptic plasticity and retention of spatial memory. Cell 112:631–643. [DOI] [PubMed] [Google Scholar]
- Leiser M, Rubin CS, Erlichman J (1986). Differential binding of the regulatory subunits (RII) of cAMP-dependent protein kinase II from bovine brain and muscle to RII-binding proteins. J Biol Chem 261:1904–1908. [PubMed] [Google Scholar]
- Lin JW, Ju W, Lee SH, Ahmadian G, Wyszynski M, Wang YT, Sheng M (2000). Distinct molecular mechanisms and divergent endocytotic pathways of AMPA receptor internalization. Nat Neurosci 3:1282–1290. [DOI] [PubMed] [Google Scholar]
- Malenka RC, Bear MF (2004). LTP and LTD: an embarrassment of riches. Neuron 44:5–21. [DOI] [PubMed] [Google Scholar]
- Malinow R, Malenka RC (2002). AMPA receptor trafficking and synaptic plasticity. Annu Rev Neurosci 25:103–126. [DOI] [PubMed] [Google Scholar]
- McAvoy T, Allen PB, Obaishi H, Nakanishi H, Takai Y, Greengard P, Nairn AC, Hemmings HC Jr (1999). Regulation of neurabin I interaction with protein phosphatase 1 by phosphorylation. Biochemistry 38:12943–12949. [DOI] [PubMed] [Google Scholar]
- Morishita W, Connor JH, Xia H, Quinlan EM, Shenolikar S, Malenka RC (2001). Regulation of synaptic strength by protein phosphatase 1. Neuron 32:1133–1148. [DOI] [PubMed] [Google Scholar]
- Mulkey RM, Endo S, Shenolikar S, Malenka RC (1994). Involvement of a calcineurin/inhibitor-1 phosphatase cascade in hippocampal long-term depression. Nature 369:486–488. [DOI] [PubMed] [Google Scholar]
- Oliveria SF, Gomez LL, Dell’Acqua ML (2003). Imaging kinase-AKAP79-phosphatase scaffold complexes at the plasma membrane in living cells using FRET microscopy. J Cell Biol 160:101–112. [DOI] [PMC free article] [PubMed] [Google Scholar]
- Snyder EM, Colledge M, Crozier RA, Chen WS, Scott JD, Bear MF (2005). Role for A kinase-anchoring proteins (AKAPS) in glutamate receptor trafficking and long term synaptic depression. J Biol Chem 280:16962–16968. [DOI] [PMC free article] [PubMed] [Google Scholar]
- Song I, Huganir RL (2002). Regulation of AMPA receptors during synaptic plasticity. Trends Neurosci 25:578–588. [DOI] [PubMed] [Google Scholar]
- Tavalin SJ, Colledge M, Hell JW, Langeberg LK, Huganir RL, Scott JD (2002). Regulation of GluR1 by the A-kinase anchoring protein 79 (AKAP79) signaling complex shares properties with long-term depression. J Neurosci 22:3044–3051. [DOI] [PMC free article] [PubMed] [Google Scholar]
- Vanhoose AM, Winder DG (2003). NMDA and β1-adrenergic receptors differentially signal phosphorylation of glutamate receptor type 1 in area CA1 of hippocampus. J Neurosci 23:5827–5834. [DOI] [PMC free article] [PubMed] [Google Scholar]
- Wong W, Scott JD (2004). AKAP signalling complexes: focal points in space and time. Nat Rev Mol Cell Biol 5:959–970. [DOI] [PubMed] [Google Scholar]