

Abstract
Oligonucleotide and cRNA probes were used for nonradioactivein situ hybridizations carried out to identify the neural cell types expressing the glutamate transporter GLAST mRNA in the rat CNS. Additionally, the regional distribution of GLAST mRNA-expressing cells was studied, and the results were complemented by immunocytochemical investigations using an antibody against a synthetic GLAST peptide. The findings documented that GLAST is expressed by Bergmann glia and by astrocytes throughout the CNS. The glial localization of GLAST mRNA was verified unequivocally by double-labeling with an astrocytic marker protein. Additionally, GLAST mRNA reactivity and GLAST immunoreactivity were found in ependymal cells. In other neural cell types of the CNS, GLAST expression was not detectable. A high level of astrocytic immunolabeling was observed in the entire gray matter of the brain, with variations in intensity in different regions. Those brain areas that are known to possess high glutamatergic activity and astrocytic glutamate metabolism stained intensely for both GLAST mRNA and GLAST protein. The latter observation suggests that the GLAST glutamate transporter participates in the regulation of extracellular glutamate concentrations, especially in brain areas receiving an intense glutamatergic innervation.
Keywords: glutamate transporter GLAST, astrocytes, ependymal cells
High-affinity glutamate transporters in the CNS play an important role in the removal of transmitter glutamate from the synaptic cleft, thereby terminating the transmitter signal and protecting neurons from an excitotoxic action of glutamate (for review, see Kanai et al., 1993). The transporters have been studied extensively using synaptosome and membrane vesicle preparations (Kanner and Schuldiner, 1987), and in the last years the cDNAs of three high-affinity glutamate transporters have been isolated and characterized in vitro, namely that of GLT1 (Pines et al., 1992), EAAC1 (Kanai and Hediger, 1992), and GLAST (Storck et al., 1992). Subsequently, more detailed information has been gathered concerning the distribution of these three transporters in the CNS of rats (Rauen and Kanner, 1994; Rothstein et al., 1994; Torp et al., 1994; Chaudhry et al., 1995; Derouiche and Rauen, 1995; Lehre et al., 1995; Schmitt et al., 1996).
With respect to GLAST, immunocytochemical studies using antibodies against synthetic peptides have shown that glial cells seem to be the preferential localization of this transporter (Lehre et al., 1995), but GLAST protein also has been reported to be localized in subsets of neurons of various CNS regions (Rothstein et al., 1994). Furthermore, GLAST mRNA has been detected by radioactive in situhybridization (ISH) in the Purkinje cell layer of the cerebellar cortex, and more or less dense ISH signals have been observed throughout the brain (Storck et al., 1992; Torp et al., 1994). Because of the poor cellular resolution of radioactive ISH, however, the question of the precise cellular distribution of GLAST mRNA still has not been answered conclusively.
In the present study, we have used a highly sensitive method that provides clear cellular resolution, namely nonradioactive ISH using cRNA and oligonucleotide probes to detect GLAST mRNA. The aim was to identify unequivocally the neural cell types expressing GLAST mRNA (especially with respect to a supposed neuronal localization) and to provide more detailed information about the localization of GLAST mRNA in various regions of the rat CNS. The ISH data were compared with the distribution of GLAST protein detected by immunocytochemistry using a polyclonal antibody against a synthetic C-terminal GLAST peptide.
MATERIALS AND METHODS
Animals and tissues
The brains and cervical spinal cords of 30 adult male Wistar rats were used for RNA preparation, ISH, immunoblotting, and immunocytochemistry. Frontal blocks of aldehyde-fixed (see below) and fresh brains of between 3 and 5 mm thickness (approximate interaural level 7.0 to 5 mm and −1.5 to −2.5 mm, according to the rat brain stereotaxic atlas of Paxinos and Watson, 1986) were used for ISH and immunocytochemistry, respectively.
Generation of digoxigenin (DIG)-labeled cRNA probes
All procedures for the preparation of cRNA probes were performed as described by Sambrook et al. (1989) and Schmitt et al. (1996) and will be described here only briefly. Total RNA from rat brain was isolated by acid guanidinium thiocyanate–phenol–chloroform extraction (Chomczynski and Sacchi, 1987), and poly(A+)RNA was enriched by oligo(dT)-cellulose chromatography. The first-strand synthesis of the cDNA was performed for 1 hr at 42°C in a reaction volume of 20 μl containing 3 μg poly(A+)-enriched RNA, 1.8 μm oligo(dT)-primer (18-mer), 1 mm of each dNTP, 20 U of RNasin, 50 mm Tris-HCl, pH 8.5, 8 mm MgCl2, 30 mm KCl, 1 mm dithiothreitol, and 40 U of AMV-reverse transcriptase (Boehringer Mannheim, Mannheim, Germany). Two primers, GLAST (1), 5′-GCTGGGATCCTACTCCGAGCTACCTGC-3′ (complementary to nucleotides 5–31), and GLAST (2), 5′-CAACATCTCGGTTCTTCAGTTCATGTCG-3′ (complementary to nucleotides 1683–1710; purchased from Roth, Karlsruhe, Germany) based on the rat GLAST sequence published by Storck et al. (1992), were used to amplify a rat GLAST cDNA fragment.
Ten percent of the reverse transcription mixture was used for a PCR in a final volume of 100 μl containing 0.4 μm of each primer, 0.4 mm of each dNTP, 2 U Taq-polymerase (Boehringer), 50 mm KCl, 1.5 mmMgCl2, and 10 mm Tris-HCl, pH 8. The following profile was used for amplification: denaturation 1 min/94°C, annealing 2 min/60°C, extension 3 min/70°C, 28 cycles, and a final elongation for 10 min at 70°C. The resulting cDNA was cloned into theEcoRV site of the Bluescript vector (pBluescript II SK+; Stratagene, La Jolla, CA) and transfected and propagated in Escherichia coli XL 1 Blue. The identity of the cloned cDNA was verified by restriction analysis and partial DNA sequencing (Sanger et al., 1977).
For generation of a DIG-labeled antisense (sense) probe, plasmids were linearized by ClaI (EcoRI) restriction, phenol–chloroform-extracted, precipitated, and transcribed by T7 RNA polymerase (T3 RNA polymerase) according the manufacturer’s manual (Boehringer). Usually 1.5 μg of cDNA template yielded 10–30 μg of labeled cRNA incorporating approximately one DIG-11-UTP at every 20th nucleotide. cRNA probes were analyzed on a formaldehyde agarose gel (1%).
In situ hybridization
cRNA probe. Rats under ether anesthesia were perfused transcardially for 10–20 sec with 0.1 m PBS, pH 7.4, and then for 4 min with PBS-buffered fixative containing 4% freshly prepared formaldehyde, pH 7.4. The brains were removed and post-fixed in the same fixative for 1 hr at room temperature. Frontal blocks of the brains (see above) were rinsed overnight in PBS containing 10–20% sucrose at 4°C and then snap-frozen as described below.
Twelve-micrometer-thick cryostat sections mounted on precoated glass slides (Superfrost Plus; Menzel, Braunschweig, Germany) were thawed and processed further, exactly as described by Schmitt et al. (1996). Briefly, the sections were rinsed in PBS, 50 mm Tris-HCl buffer, pH 7.6, and H2O. The tissue sections were treated with 0.05 N HCl, washed in PBS, incubated with freshly prepared 0.25% acetic anhydride, washed again with PBS, dehydrated in a graded series of ethanol, delipidated with chloroform, transferred to ethanol, and air-dried; then a prehybridization solution was applied to the sections for 1–2 hr at 42°C in a moist chamber. The prehybridization solution contained 4× SSC, 1× Denhardt’s solution (Sambrook et al., 1989), 10% dextran sulfate, 50% deionized formamide, and 500 μg/ml salmon testes DNA (Sigma, Deisenhofen, Germany).
After removal of the prehybridization solution, the sections were covered with the hybridization solution containing the DIG-labeled antisense RNA probe (final concentration 3–6 ng/μl) in the prehybridization solution at 42°C for 16–18 hr. Posthybridization washes were carried out with 2× SSC at 58°C and then at 37°C. Subsequently, the sections were treated with 30 μg/ml ribonuclease A (50 Kunitz units/mg; Boehringer) to remove unhybridized single-strand RNAs. After the treatment, the sections were transferred to various solutions containing SSC and formamide, as described in detail bySchmitt et al. (1996).
For detection of the DIG-labeled cRNA probe, the sections were rinsed in Tris-buffered saline (TBS; 100 mm Tris and 150 mm NaCl, pH 7.5) for 5 min, incubated with TBS containing 0.5% blocking reagent (DIG Nucleic Acid Detection Kit, Boehringer; 30 min), followed by 0.3% Triton X-100 in TBS (20 min). After incubation with 1.5 U/ml sheep anti-DIG-alkaline phosphatase (aP) conjugate (Boehringer) in TBS containing 0.3% Triton X-100 for 60 min, the sections were washed in TBS, transferred to a 0.1 mTris-buffer containing 100 mm NaCl and 50 mmMgCl2, pH 9.5, for 2 min before the aP visualization described below. In some experiments, after the aP visualization, several sections were used for the immunocytochemical detection of glial fibrillary acidic protein (GFAP) by applying the peroxidase-antiperoxidase method (see below).
Oligonucleotide probe. ISH was carried out according to the method of Dågerlind et al. (1992), using an aP-coupled 30-mer oligonucleotide probe complementary to part of the coding region of GLAST mRNA (antisense probe to the nucleotides 1681–1710: 5′-CAACATCTCGGTTCTTCAGTTCATGTCGGG-3′; custom-synthesized by DNA Technology, Aarhus, Denmark). Twelve-micrometer-thick cryostat sections of snap-frozen frontal tissue blocks of brain (see above) mounted on Superfrost slides were thawed and covered with hybridization solution (see above) containing 6 fmol/μl antisense oligonucleotide probe at 37°C for 20–40 hr. Posthybridization washes were carried out with 1× SSC for 4 × 15 min at 55°C. After they were cooled to room temperature, the sections were transferred to TBS for 30 min, followed by 100 mm Tris-HCl containing 100 mm NaCl, 50 mm MgCl2, pH 9.5, for 10 min, before the aP visualization.
Detection of alkaline phosphatase. The procedure used was described recently (Asan and Kugler, 1995). The incubation media contained 0.4 mm 5-bromo-4-chloro-3-indolylphosphate (BCIP; Boehringer), 100 mm sodium chloride, 50 mmMgCl2, and 0.4 mm tetranitroblue tetrazoliumchloride or nitroblue tetrazoliumchloride (Serva, Heidelberg, Germany) in 100 mm Tris-HCl buffer at pH 9.5.
Controls for ISH. Substitution of the antisense cRNA probe by an equivalent amount of labeled sense cRNA probe lead to a complete lack of staining (compare Fig. 1c). Also no staining was observed in sections of unfixed tissue if a 100-fold excess of unlabeled oligonucleotide probe was applied together with the aP-labeled probe (compare Fig. 1e), indicating a complete competitive inhibition of specific binding of the labeled probe in these preparations. An equivalent excess of unlabeled oligonucleotides with different nonrelated sequences did not influence the GLAST mRNA reaction intensity. Omission of labeled cRNA or oligonucleotide probes from the respective hybridization mixtures resulted in completely unstained sections. From these findings it can be concluded that (1) the antisense probes were specific, (2) the DIG detection did not create labeling artifacts, and (3) there was no endogenous aP activity left in the sections.
Fig. 1.
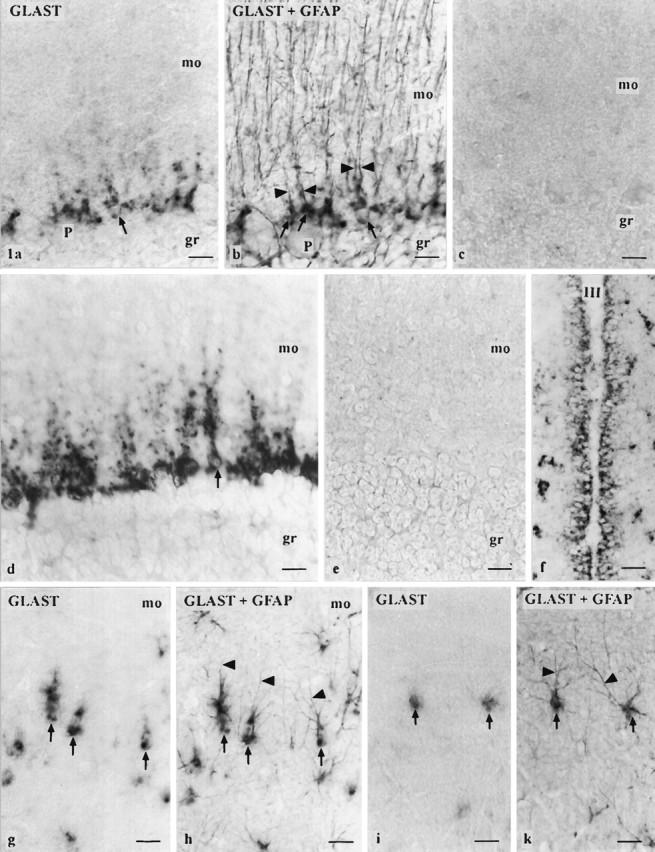
Cellular distribution of GLAST mRNA.a/b, g/h, and i/k are micrograph pairs showing sections after ISH using the cRNA probe in the first and after additional GFAP immunostaining in the second figure. GFAP-immunoreactive processes (arrowheads) allow identification of ISH-reactive cells as Bergmann glia (arrows) in the cerebellar cortex (mo, molecular layer; gr, granule cell layer;P, Purkinje cell soma) and as astrocytes (arrows) in the mo of the hippocampal dentate gyrus (g/h) and in the outer parietal cortex (area 1; i/k). d,f, Micrographs of sections after ISH using the oligonucleotide probe. Bergmann glia is strongly labeled (d). A single Bergmann glia cell can be clearly identified (arrow) showing staining around the nucleus and in the proximal processes. A strong labeling is also observed in ependymal cells (f) of the third ventricle (III) adjacent to the arcuate hypothalamic nucleus. No labeling is observed using the sense cRNA probe (c; cerebellar cortex) or the oligonucleotide probe in the presence of a 100-fold excess of unlabeled oligonucleotide probe (e; cerebellar cortex). Scale bars, 20 μm.
Antibodies and immunoblotting
Antibodies. A peptide corresponding to the C-terminal region 523–542 (Q-L-J-A-Q-D-N-E-P-E-K-P-V-A-D-S-E-T-K) of the GLAST protein (Storck et al., 1992) was synthesized by the fmoc method and purified by reverse phase-HPLC (Atherton et al., 1981). For immunization, the peptide was coupled to keyhole limpet hemocyanin by glutaraldehyde, as described in detail by Drenckhahn et al. (1993). One milliliter of the peptide solution (corresponding to 500 μg peptide) was mixed with polyalphaolefin adjuvant (Ethyl S. A., Brussels, Belgium) and injected subscapularly in rabbits (Drenckhahn et al., 1993). At intervals of 3 weeks, animals were given booster injections of the same amount of antigen. Positive antisera were identified by dot-blot assay (Drenckhahn et al., 1993). The antisera were affinity-purified, using the synthetic peptide immobilized by transfer to nitrocellulose paper (Schleicher and Schüll, Darmstadt, Germany). The bound immunoglobulins were eluted with PBS warmed to 56°C as described elsewhere (Drenckhahn and Franz, 1986), and the protein content was determined spectrophotometrically (Drenckhahn et al., 1993).
Mouse monoclonal antibody against GFAP was purchased from Dako (Hamburg, Germany). In the CNS, GFAP is a specific marker protein of astrocytes (Bignami et al., 1972).
Immunoblotting. For immunoblotting, cerebellum, hippocampus, whole neocortex, and cervical spinal cord were dissected and homogenized at 4°C in 10 mmNaH2PO4, pH 7.2, containing 2 mmMgCl2, aprotinin (5 μg/ml), leupeptin (2 μg/ml), pepstatin (2 μg/ml), and phenylmethylsulfonyl fluoride (100 μg/ml). The homogenate was centrifuged at 1,000 × g for 10 min, and the 1,000 × g supernatant was centrifuged at 100,000 × g for 1 hr. The protein contents of the 100,000 × g supernatant and pellet were determined by the Bio-Rad protein assay (Bio-Rad, München, Germany); the supernatant and the pellet (membrane fraction) were used for immunoblotting. Proteins (5–50 μg per lane) were electrophoretically separated on 10% gels by SDS-PAGE. Subsequently, the proteins were transferred electrophoretically to nitrocellulose membranes (Burnette, 1981). Strips of the nitrocellulose membranes were incubated for 24 hr at 4°C with the affinity-purified antibody (∼1.8 μg/ml). Bound immunoglobulins were visualized using peroxidase-conjugated goat anti-rabbit IgG (1:3000; Bio-Rad, Richmond, Canada; blotting grade) and the enhanced luminol chemiluminescence technique (Amersham, Braunschweig, Germany). Antibody absorbed previously with an excess of the peptide that was used for immunization served as control.
Deglycosylation. Aliquots of the 100,000 ×g pellet from cerebellum and hippocampus (see above) containing 50 μg protein were resuspended in 0.2 m sodium acetate buffer, pH 6.5, containing 16 mm EDTA, 8 mm 2-mercaptoethanol, and 0.8 mmphenylmethylsulfonyl fluoride. N-glycosidase F (0.5 U; from Flavobacterium meningosepticum; Boehringer) was added, and the suspension was incubated for 18 hr at 37°C. The reaction was terminated by the addition of 50 μl of SDS sample buffer. The samples were analyzed by immunoblotting as described above. Controls were processed as described above, but without the addition ofN-glycosidase F.
Immunostaining
Pieces of various CNS regions (hippocampus, cerebellum, spinal cord) and frontal blocks of the brain (as described above) were frozen in liquid nitrogen-cooled isopentane, and 2- to 10-μm-thick sections were cut in a cryostat and mounted on Superfrost slides. The sections were treated with chloroform for 5 min at room temperature or with PBS-buffered, freshly prepared 1% formaldehyde, pH 7.4, for 1 min, and after several washes with PBS, with acetone for 1 min at room temperature, or were used without any treatment.
Furthermore, frozen tissue pieces of the hippocampus and cerebellum were freeze-dried and embedded in Epon (Drenckhahn and Franz, 1986). Semithin sections (1 μm) were mounted on glass slides. The resin was removed by placing the slides for 5 min in Maxwell’s solution (Maxwell, 1978) followed by incubation in 4% H2O2 for 5 min (Vidal et al., 1995).
All tissue sections were preincubated for 3 hr at room temperature with 2% bovine serum albumin, 10% normal goat serum, and 0.05% Tween 20 (Ferrak, Berlin, Germany) in PBS, pH 7.4. Then the sections were incubated for 24–48 hr at 4°C for single- and double-labeling with the primary antibody diluted in the preincubation solution (anti-GLAST, 15 μg/ml; anti-GFAP, 1:20,000). After several washes with PBS, the sections were incubated for 90 min at room temperature with Texas Red sulfonyl chloride (TRSC)-labeled secondary antibody (1:100; goat anti-rabbit IgG; Dianova, Hamburg, Germany) for detection of GLAST, and with fluorescein-isothiocyanate (FITC)-labeled secondary antibody (1:50; goat anti-mouse IgG; Sigma) for the detection of GFAP. Controls were performed with primary antibody, previously absorbed with an excess of the GLAST peptide, or without the primary antibody. The sections were examined with an Olympus BH-2 fluorescence microscope (Olympus, New Hyde Park, NY) equipped with Zeiss optics and an appropriate filter combination for selective visualization of TRSC and FITC fluorescence (BH II DFC 6; Olympus).
Additionally, in further experiments, aP-labeled secondary antibody (goat antiserum to rabbit immunoglobulin, 1:100; Sigma) was used instead of the fluorescent ones, and detection was carried out using an aP-detection medium. The aP-detection medium consisted of 1 mm BCIP, 1.5 mm tetranitroblue tetrazoliumchloride, 5 mm tetramisole (Sigma), and 10% polyvinyl alcohol (polyviol G 04/140; Wacker-Chemie, München, Germany) in 0.05 m Hepes buffer; the final pH was 9.2.
RESULTS
In situ hybridization
Application of the cRNA probe to cryostat sections of perfusion-fixed tissue or of the aP-labeled oligonucleotide probe to cryostat sections of snap-frozen tissue resulted in identical patterns of cellular and regional distribution of GLAST mRNA in the rat CNS, both methods showing a high cellular resolution. The aP-labeled oligonucleotide probe provided a higher signal intensity than the cRNA probe did.
Cellular distribution
ISH reaction product was localized exclusively in glial cells, which on the basis of their shape and distribution appeared to be Bergmann glia (Fig. 1a–e) and astrocytes (Fig. 1g–k). This localization in astrocytes and Bergmann glia was proven by double-labeling with GFAP (Fig. 1a,b, g–k). Reaction product was localized primarily in a cytoplasmic rim around the nucleus of astrocytes. In more strongly reacting astrocytes and in Bergmann glia, reaction product extended into proximal processes (Fig. 1d). Finer processes that were immunostained in the detection of GFAP were not labeled (Fig.1a,b, g–k). Neighboring blood vessels of astrocytes (Fig.2g) and subpial astrocytes were also stained. Both the cRNA and the oligonucleotide probe specifically labeled ependymal cells (Fig. 1f). Neurons, oligodendrocytes, tanycytes, and epithelial cells of the choroid plexus showed no staining.
Fig. 2.
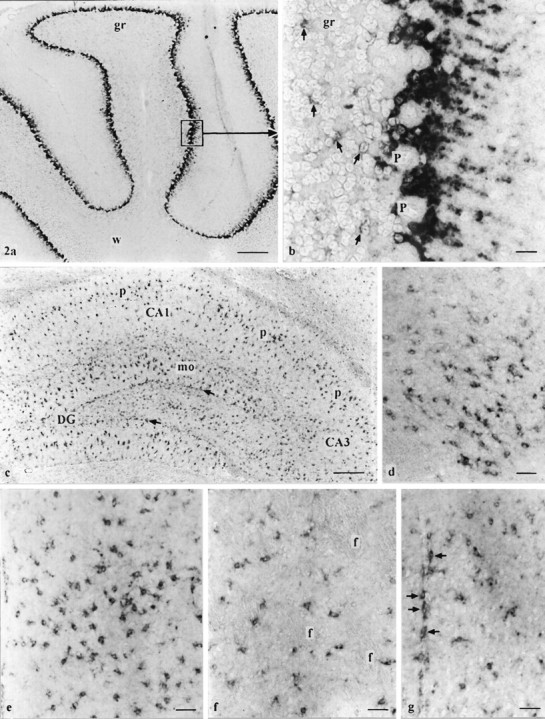
a–g, Regional distribution of GLAST mRNA using the oligonucleotide probe. a, Cerebellar cortex. Strongly reacting Bergmann glia is observed in the Purkinje cell layer, whereas astrocytes in the granule cell layer (gr) are lightly labeled. At this magnification, no obvious staining can be observed in the white matter (w). b, Higher magnification froma, as indicated. Note the strong labeling of Bergmann glia and the faint staining of astrocytes (arrows).P, Purkinje cells. c, Hippocampus. Strongly labeled astrocytes are observed throughout the gray matter of hippocampus showing a relatively high density in the molecular layer (mo) and just beneath the granule cell layer of the dentate gyrus (DG; arrows) and in and around the pyramidal cell layer (p) of the cornu ammonis sectors 1–3 (CA1–3). Supraoptic (d) and medial (e) amygdaloid nuclei show strongly labeled astrocytes. Striatum (f) and parietal (g) cortex (superficial layers) with scattered, moderately reacting astrocytes. f (in f), Fiber tracts; arrows in g, labeled perivascular astrocytes. Scale bars: a, c, 300 μm;b, 25 μm; d–g, 50 μm.
Regional distribution (Table 1)
The strongest reaction was found in Bergmann glia of the cerebellar cortex (Fig. 2a,b). Astrocytes reacting positively for GLAST mRNA were detected throughout the CNS and showed different levels of reactivity. A relatively high density of strongly reacting astrocytes was observed in the hippocampus (Fig.2c) (mainly in the molecular layer and just beneath the granule cell layer of the dentate gyrus and around pyramidal cells of CA1-3), in the medial part of the hypothalamus (paraventricular hypothalamic nucleus, retrochiasmatic area, arcuate hypothalamic nucleus), in the supraoptic nucleus (Fig. 2d), in the medial part of the thalamus (paraventricular and ventromedial thalamic nuclei), and in the medial (Fig. 2e) and cortical amygdaloid nuclei. Density and reactivity of astrocytes decreased from medial to lateral parts of the thalamus and hypothalamus. The remaining amygdala, the neocortex (mainly superficial layers) (Fig. 2g), the striatum (Fig. 2f), and the reticular thalamic nucleus showed moderately labeled astrocytes. A slightly less intense labeling of astrocytes was observed in the vicinity of unlabeled neuronal perikarya of cerebellar, dorsal cochlear, medial and spinal vestibular, external cuneate, spinal trigeminal, and facial and gigantocellular reticular nuclei, and in the nucleus of the solitary tract. The granule cell layer of the cerebellar cortex (Fig.2b) and other brain regions (not further specified) showed only faint astrocytic labeling. In white matter tracts of the cortex, brain stem, and spinal cord, scattered astrocytes were stained faintly. The same was true for the gray matter of the spinal cord, with the exception of laminae I and II in the dorsal horn and of the region surrounding the canalis centralis, where a somewhat denser population of astrocytes showed a light to moderate staining.
Table 1.
Expression of GLAST mRNA and protein in astrocytes and Bergmann glia of rat CNS applying in situ hybridization (ISH) and immunocytochemistry (ICC)
| ISH | ICC | |
|---|---|---|
| Gray matter | ||
| Cerebellar cortex | ||
| Bergmann glia | ++++ | ++++ |
| Granule cell layer | + | ++ |
| Cerebellar nuclei | ++ | +++ |
| Neocortex | ||
| Superficial layer | ++ | ++ |
| Deep layer | + | + |
| Hippocampus | ||
| Dentate gyrus | +++ | +++ |
| Pyramidal cell layer | +++ | +++ |
| Amygdala | ||
| Cortical | +++ | ++ |
| Medial | +++ | ++ |
| Lateral | + | ++ |
| Striatum | ++ | +++ |
| Thalamus | ||
| Medial | +++ | ++ |
| Lateral | ++ | +++ |
| Reticular nucleus | ++ | +++ |
| Hypothalamus | ||
| Medial | +++ | ++ |
| Lateral | ++ | ++ |
| Brainstem nuclei | ++ | +++ |
| Spinal cord | ||
| Dorsal gray | ++ | +++ |
| Ventral gray | + | ++ |
| White matter | + | + |
Staining intensity: +, very low; ++, low to moderate; +++, moderate to strong; ++++, very strong.
Ependymal cells lining the third ventricle showed a moderate labeling, preferentially at sites where astrocytes in the hypothalamus were strongly stained (Fig. 1f). In the other ventricular regions, the majority of ependymal cells showed faint labeling.
Immunoblotting
In immunoblots of the 100,000 × g pellet of tissue homogenate, the affinity-purified antibody against the GLAST peptide labeled a ∼65 kDa band in the cerebellum and somewhat lower bands in the hippocampus, neocortex, and spinal cord (Fig.3). In the 100,000 × g supernatant, no protein band was immunolabeled, indicating that the detected protein was localized in membranes. Concerning the regional distribution, the highest level of GLAST was observed in the cerebellum, and lower levels were detected in the hippocampus and neocortex, whereas a very low level was seen in the spinal cord (Fig. 3). Preabsorption of the antibody with the GLAST peptide abolished binding to the protein bands (Fig. 3). After deglycosylation with N-glycosidase F, a ∼55 and a ∼50 kDa band were labeled in immunoblots of the cerebellum and hippocampus, respectively (Fig. 4).
Fig. 3.

Immunoblot analysis (10% SDS-PAGE) of homogenized cerebellum (c), hippocampus (h), cerebral cortex (cc), and cervical spinal cord (s) using the affinity-purified GLAST antibody. For probing, the 100,000 × g pellet was used. The amount of protein loaded per lane was 10 μg (cerebellum, hippocampus, and cerebral cortex) and 50 μg (spinal cord). The GLAST antibody labeled a ∼65 kDa band in the cerebellum (1) and somewhat lower ones in the hippocampus (3), cerebral cortex (5), and spinal cord (7). Immunoblotting using antibody previously absorbed with an excess of the peptide used for immunization served as control (2, 4, 6, 8).
Fig. 4.
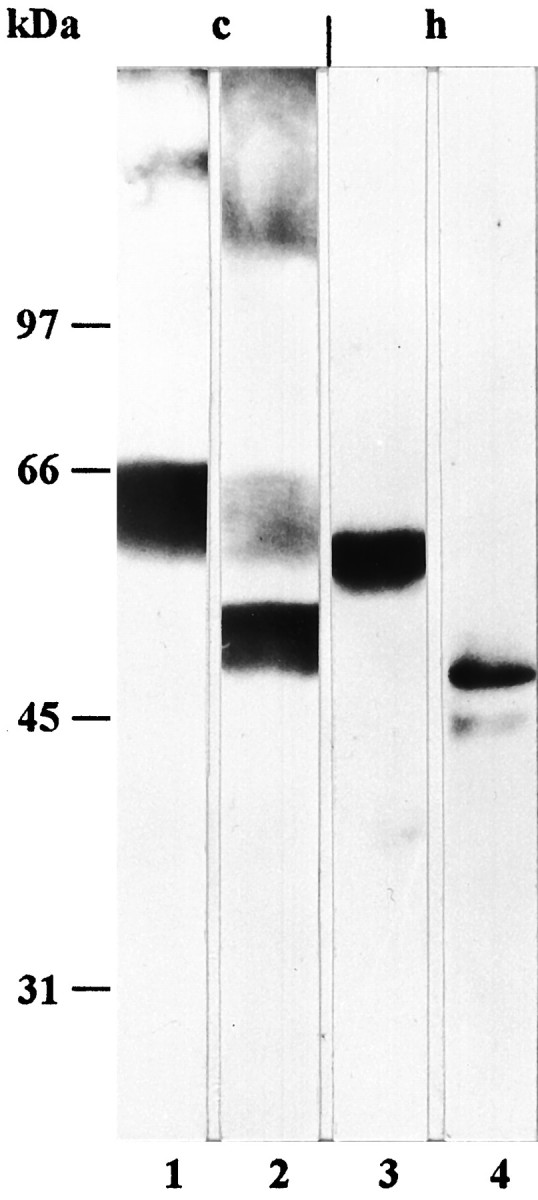
Deglycosylation experiment. Immunoblot analysis (10% SDS-PAGE) of homogenized cerebellum (c) and hippocampus (h) using the affinity-purified GLAST antibody. For probing, the 100,000 × g pellet was used with (2, 4) and without (1, 3) treatment with N-glycosidase F, as described in Materials and Methods. The amount of protein loaded per lane was 50 μg. After enzyme treatment, the molecular mass of both the cerebellar and the hippocampal protein was reduced by ∼10 kDa (2, 4).
Immunocytochemistry
When the affinity-purified antibody against the GLAST peptide was applied to thin sections (1 μm thick), membranous profiles in the neuropil of the gray matter of the various CNS regions studied were labeled (compare Fig. 5a). A more homogenous staining of the gray matter neuropil was observed in thicker cryostat sections (10 μm thick), presumably because of the high density of labeled profiles (cf. Fig. 5d–g). The distribution of immunolabeling was the same in all tissue preparations (see Materials and Methods).
Fig. 5.
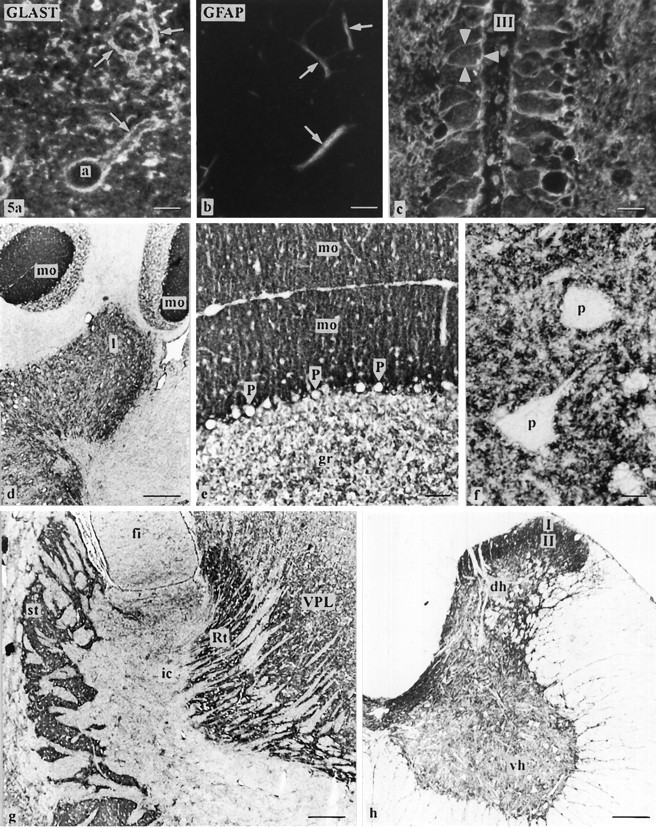
a–c, Cellular distribution of GLAST protein detected by immunofluorescence staining in semithin plastic sections of freeze-dried hippocampus (a, b, radiatum layer of cornu ammonis sector CA1) and ependym (c, third ventricle, III, adjacent to the neuropil of the arcuate hypothalamic nucleus). a/b is a micrograph pair of a section double-labeled for GLASTand the astrocytic marker GFAP. Note that membranes of astrocytic processes (arrows) identified by GFAP immunoreactivity (b) display GLAST immunoreactivity.a, Astrocyte. There are numerous immunostained membrane profiles in the neuropil in a, which are not associated with GFAP immunoreactivity (cf. b), representing fine astrocytic processes (without GFAP). Note the immunolabeling for GLAST in apical and basolateral membranes (arrowheads) of ependymal cells. d–h, Regional distribution of GLAST immunoreactivity detected by aP-labeled secondary antibody in 10-μm-thick cryostat sections (post-fixed with paraformaldehyde and acetone). d–f, Cerebellum. Strong labeling is observed in the molecular layer (mo in d, e) and in the cerebellar nuclei (l, lateral cerebellar nucleus in d), especially in the neuropil around unstained perikarya (p in f). The granule cell layer (gr in e) is stained moderately. Purkinje cells (P ine) are not labeled. g, The striatum (st) and the reticular nucleus of thalamus (Rt) show a fairly strong labeling, whereas the ventral posterolateral thalamic nucleus (VPL) is stained less intensely. ic, Internal capsule. h, Spinal cord. The ventral horn (vh) is moderately labeled, and the dorsal horn (dh; especially laminaeI, II) and the intermediate zone are strongly labeled. Scale bars: a–c, 7 μm; d, g, h, 300 μm; e, 50 μm; f, 20 μm.
Cellular distribution
In thin sections (1 μm), we observed a moderate to strong labeling of glial cells (cell membranes of somata and processes), which we identified by double-immunolabeling with GFAP antibody to be astrocytes (Fig. 5a,b) and Bergmann glia. Immunostained membrane profiles in the neuropil seemed to represent fine astrocytic processes (without GFAP; Fig. 5a,b). Astrocytic processes around blood vessels and forming the outer limiting membrane were also positive for GLAST. Neuronal perikarya were frequently surrounded by a dense network of GLAST-positive processes (Figs. 5f,6b), whereas the plasmalemmata of neuronal perikarya did not show staining (Fig. 5f). A light to moderate immunostaining was found in the apical and basolateral cell membranes of ependymal cells (Fig. 5c). Other than astrocytes, Bergmann glia, and ependymal cells, no additional neural cell types showed immunostaining.
Fig. 6.

a, Distribution of GLAST immunoreactivity in the hippocampus detected by aP-labeled secondary antibody in a 10-μm-thick cryostat section (post-fixed with paraformaldehyde and acetone). The neuropil around the perikarya of the pyramidal cell layer (p; preferentially in the cornu ammonis sector 1, CA1) and the multiform layer just beneath the granule cells (gr;arrows) react strongly. The lacunosum molecular layer (lm) of the hippocampus proper and the outer two-thirds of the dentate gyrus molecular layer (mo) are stained moderately. b, Detection of GLAST protein by immunofluorescence staining in the cornu ammonis sector 1 (semithin plastic section of freeze-dried hippocampus). Note strong staining of the neuropil around the unstained perikarya (arrows) of the pyramidal cell layer (p). Labeling in the vicinity of pyramidal cell dendrites (arrowheads) in the radiatum layer (r) is weak to moderate, whereas it is strong in the region of the initial parts of the pyramidal cell axons in the oriens layer (o). bv, Blood vessel. Scale bar: a, 300 μm; b, 25 μm.
Regional distribution (Table 1)
A high number of labeled profiles were found in the neuropil of the gray matter throughout the whole CNS showing different labeling intensities, whereas in the white matter tracts of the CNS scattered astrocytes showed mostly a weak to moderate reactivity. The strongest reaction was observed in the molecular layer of the cerebellar cortex (Fig. 5d,e). A moderately strong immunoreaction was seen in some regions of the hippocampus (see below), in the reticular nucleus of the thalamus (Fig. 5g), the arcuate nucleus of the hypothalamus, the dorsomedial striatum (Fig. 5g), the entopeduncular nucleus, and the retrosplenial cortex. Intensely reactive astrocytic processes were also found around the perikarya in cerebellar nuclei (Fig. 5d,f) and brainstem nuclei (e.g., vestibular, cochlear, facial, and trigeminal nuclei), and in the dorsal horn (especially lamina I, II) and intermediate zone of the spinal cord (Fig. 5h). A moderate to strong reactivity was seen in the lateral magnocellular nucleus of the hypothalamus, the thalamic nuclei (with decreasing reactivity in a dorsomedial direction), laminae I–III of the frontal cortex, hindlimb area, laminae I–II of the piriform cortex, the lateral habenular nucleus, the superficial gray layer of the superior colliculus, and the medial geniculate nucleus. In the remaining CNS regions included in this study, the neuropil labeling was weak to moderate.
A laminar labeling was observed in the hippocampus (Fig.6a,b). The neuropil around the pyramidal cells (preferentially in the cornu ammonis sector 1; Fig.6a,b) and the multiform layer just beneath the granule cell layer reacted strongly. The lacunosum molecular layer of the hippocampus proper and the outer two thirds of the dentate gyrus molecular layer showed a somewhat lower reactivity. The other hippocampal regions were stained only moderately.
DISCUSSION
Applying nonradioactive ISH and immunocytochemistry, we found that Bergmann glia and astrocytes seem to be the major cell types in the CNS expressing the high-affinity glutamate transporter GLAST. Additionally, ependymal cells in several ventricular regions were labeled. In other types of neural cells (e.g., neurons and oligodendrocytes), GLAST expression was not detectable.
Specificity of ISH and immunocytochemistry was ensured by selecting sequences of the oligonucleotide probe and of the peptide used for the production of polyclonal antibodies from regions nonhomologous to other cloned glutamate transporters (Kanai and Hediger, 1992; Pines et al., 1992; Ramachandran et al., 1993; Shafqat et al., 1993; Shashidharan and Plaitakis, 1993; Tanaka, 1993). Furthermore, based on the rat GLAST sequence (Storck et al., 1992), an antisense cRNA probe (nucleotides 5–1710) was generated, which resulted in the same ISH labeling as did the oligonucleotide probe. This strongly indicates that both probes were specific in detecting GLAST mRNA. The staining was abolished using the aP-labeled oligonucleotide probe in the presence of an excess of unlabeled oligonucleotide probe (competition experiment), with the cRNA sense probe and using the GLAST affinity-purified antibody previously absorbed to the synthetic peptide. Furthermore, on immunoblots of several CNS regions, the affinity-purified antibody to the GLAST peptide labeled a ∼65 kDa band in the cerebellum and bands with a somewhat lower molecular mass in other CNS regions. Similar results have been described previously by Lehre et al. (1995). Because GLAST is glycosylated (Storck et al., 1992; Conradt et al., 1995), the lower molecular mass in brain regions outside the cerebellum could be caused by differences in glycosylation. Our deglycosylation experiments, however, indicated that a similar glycosylation of GLAST protein existed, for example, in the cerebellum and hippocampus. Therefore, whether splice variants exist in the CNS has to be clarified.
Application of the aP-labeled oligonucleotide probe to cryostat sections of fresh-frozen tissue or of the DIG-labeled cRNA probe to cryostat sections of perfusion-fixed tissue resulted in high sensitivity and cellular resolution and low background. This observation is in accordance with previous findings applying nonradioactive ISH in the demonstration of mRNA of the glutamate transporter GLT1 (Schmitt et al., 1996). Our regional ISH findings are comparable with those of Storck et al. (1992) and Torp et al. (1994)using radioactive ISH: the strongest labeling was observed in the cerebellar cortex. The supposition that GLAST mRNA staining was localized in Bergmann glia (Storck et al., 1992; Torp et al., 1994) was sustained by our observations using nonradioactive ISH. We succeeded in unequivocally identifying labeled cells as Bergmann glia on the basis of their shape and distribution and by combining ISH and immunolabeling of GFAP.
In the telencephalon and brain stem, a more or less homogenous labeling has been found using radioactive ISH (Storck et al., 1992; Torp et al., 1994). Therefore, a glial localization of GLAST mRNA was supposed (Torp et al., 1994); however, because of the comparatively low cellular resolution of radioactive ISH, it was not possible to identify the type of cell labeled. By applying the nonradioactive ISH protocols and combined GLAST mRNA ISH/GFAP immunolabeling (see above), we were able to document clearly that GLAST mRNA-expressing cells were astrocytes. Furthermore, we showed that the ISH labeling of astrocytes differed in intensity between CNS regions. Labeling intensity was highest in various regions of the hippocampus, hypothalamus, thalamus, and corpus amygdaloideum, whereas a very low level of labeling was detected in white matter tracts (specified further in Results). A rough comparison of the regional distribution of astrocytic GLAST mRNA with that of astrocytic GLT1 mRNA (Schmitt et al., 1996) revealed that there seemed to be a high degree of similarity.
The immunocytochemical findings are in agreement with those obtained using ISH, because GLAST immunoreactivity was localized in membranes of glia, which we identified by applying double-immunolabeling for GLAST protein and GFAP to be astrocytes and Bergmann glia. These findings were also in accordance with previous studies (Chaudhry et al., 1995;Lehre et al., 1995). In initial investigations, it was reported that GLAST immunoreactivity can be found in subsets of neurons in addition to astrocytes (Rothstein et al., 1994). In a later study, however,Rothstein et al. (1995), like other investigators (Chaudhry et al., 1995; Lehre et al., 1995), reported results in agreement with our own observations, namely that neurons were not immunolabeled with a GLAST antibody. Furthermore, by applying our ISH protocol, we were not able to detect GLAST mRNA in neuronal perikarya. On the other hand, a dense network of immunolabeled fine astrocytic processes was frequently seen to be in touch with neuronal perikarya.
In accordance with Lehre et al. (1995), we observed the densest glial immunolabeling in the molecular layer of the cerebellar cortex. This corresponded to the strong ISH labeling of Bergmann glia. It is likely that in this glial localization (Chaudhry et al., 1995; Lehre et al., 1995; Schmitt et al., 1996) glutamate transporters GLAST and GLT1 are both important for the high-affinity uptake of glutamate synaptically released from fibers terminating in the molecular layer (Sandoval and Cotman, 1978). The fact that glutamate uptake inhibition leads to prolonged excitatory postsynaptic currents in Purkinje cells (Barbour et al., 1994) indicates that the action of the glutamate transporters in Bergmann glia is important for Purkinje cell excitatory kinetics. Furthermore, comparison of the density distribution of the GLAST immunolabeling shown outside the cerebellum in the present, with the pattern of glutamatergic termination fields specified in several previous reviews (Fagg and Foster, 1983; Fonnum, 1984), indicates that a positive correlation exists between the level of glutamatergic transmission and high-affinity glutamate transport in astrocytes. Similar results were obtained in the immunocytochemical demonstration of the glutamate transporter GLT1 (Schmitt et al., 1996). Glutamate taken up in astrocytes and Bergmann glia will undergo metabolism partly to glutamine (by the action of glutamine synthetase) and partly to α-ketoglutarate via glutamate dehydrogenase (Würdig and Kugler, 1991; Rothe et al., 1994; Kugler et al., 1995). Both enzymes are concentrated in these glial cells, and neighboring neurons are able to use glutamine and α-ketoglutarate as precursors for glutamate (for review, see Kugler, 1993).
In addition to GLAST mRNA-labeling of Bergmann glia and astrocytes, we observed a faint to moderate ISH signal in ependymal cells in the ventricular regions studied. A radioactive ISH signal close to the ependymal lining was documented by Torp et al. (1995). Lehre et al. (1995), who did not describe immunostaining for GLAST in ependymal cells, interpreted the findings of Torp et al. (1995) as a GLAST-immunoreactive subependymal astrocytic plexus; however, we observed clear immunoreaction signal in basolateral and apical membranes of ependymal cells, which supported our ISH findings. So far, no other glutamate transporter has been detected in this neural cell type. It can be supposed that the basolaterally localized GLAST prevents the diffusion of synaptically released glutamate from the intercellular spaces into the cerebrospinal fluid. The fate of glutamate in ependymal cells may be a further metabolism via glutamate dehydrogenase and enzymes of the tricarboxylic acid cycle. We were able to demonstrate a light immunolabeling for glutamate dehydrogenase in ependymal cells (data not published) supporting this supposed metabolic pathway. The function of the apically localized GLAST remains to be determined.
Comparison of the present results with those of a previous one suggests that GLAST and GLT1 (Schmitt el al., 1996) are colocalized in glial cells, supporting the observations by Lehre et al. (1995). Several explanations of the possible functional significance of this colocalization have been offered. Thus GLAST, whose Km value is higher than that of GLT1, may provide additional glutamate-transporting capacity, serving to protect neurons from toxic glutamate levels (Kanai et al., 1993). On the other hand, it may be possible that the transporters exist as hetero-oligomers with differing monomeric compositions, allowing for a great variation in the functional properties of the oligomers (Lehre et al., 1995). In this context, it is interesting to note that the relation between the expression of GLT1 and GLAST varies greatly between different glial cells. Thus, the GLAST expression is significantly higher than that of GLT1 in Bergmann glia, whereas in most astrocytic populations GLT1 expression seems to be stronger than that of GLAST (Rothstein et al., 1994; Chaudhry et al., 1995; Lehre et al., 1995; Schmitt et al., 1996; the present study). An explanation for the cause or significance of these expression differences is not at hand. On a different level, namely that of determining the positioning of glutamate transporter protein in glial membranes, microenvironmental conditions seem to be influential. Thus, the amount of GLT1 and GLAST protein detected along Bergmann glial membranes varies with the type of glutamatergic synapse with which the particular stretches of membranes are associated (Chaudhry et al., 1995). It is conceivable that the microenvironment influences not only the positioning in the membrane but also, indirectly, the expression of glutamate transporters. To find out more about possible regulatory influences, it will have to be determined whether the observed expressional differences are correlated with differences between the microenvironment of Purkinje cells and that of other neurons concerning additional parameters of glutamatergic transmission or metabolism, e.g., the presence of neuronal glutamate transporters.
Footnotes
This study was supported by a grant from the Deutsche Forschungsgemeinschaft. We thank Erna Kleinschroth and Kerstin Seubert for their excellent technical assistance.
Correspondence should be addressed to Professor Dr. Peter Kugler, Institute of Anatomy, Koellikerstrasse 6, D-97070 Würzburg, Germany.
This work is dedicated to Professor Andreas Oksche on the occasion of his 70th birthday.
REFERENCES
- 1.Asan E, Kugler P. Qualitative and quantitative detection of alkaline phosphatase coupled to an oligonucleotide probe for somatostatin mRNA after in situ hybridization using unfixed rat brain tissue. Histochem Cell Biol. 1995;103:463–471. doi: 10.1007/BF01457546. [DOI] [PubMed] [Google Scholar]
- 2.Atherton E, Logan CJ, Sheppard RC (1981) Peptide synthesis, Part 2. Procedures for solid-phase synthesis using Nα-fluorenylmethoxycarbonylamino-acids on polyamide supports: synthesis of substance P and of acyl carrier protein 65–74 decapeptide. J Chem Soc Perkin Trans I 538–546.
- 3.Barbour B, Keller BU, Llano I, Marty A. Prolonged presence of glutamate during excitatory synaptic transmission to cerebellar Purkinje cells. Neuron. 1994;12:1331–1343. doi: 10.1016/0896-6273(94)90448-0. [DOI] [PubMed] [Google Scholar]
- 4.Bignami A, Eng LF, Dahl D, Uyeda CT. Localization of the glial fibrillary acidic protein in astrocytes by immunofluorescence. Brain Res. 1972;43:429–435. doi: 10.1016/0006-8993(72)90398-8. [DOI] [PubMed] [Google Scholar]
- 5.Burnette WN. Western blotting: electrophoretic transfer of proteins from sodium dodecyl sulfate polyacrylamide gels to unmodified nitrocellulose and radiographic detection with antibody and radionated protein A. Anal Biochem. 1981;112:195–203. doi: 10.1016/0003-2697(81)90281-5. [DOI] [PubMed] [Google Scholar]
- 6.Chaudhry FA, Lehre KP, van Lookeren Campagne M, Ottersen OP, Danbolt NC, Storm-Mathisen J. Glutamate transporters in glial plasma membranes: highly differentiated localizations revealed by quantitative ultrastructural immunocytochemistry. Neuron. 1995;15:711–720. doi: 10.1016/0896-6273(95)90158-2. [DOI] [PubMed] [Google Scholar]
- 7.Chomczynski P, Sacchi N. Single-step method of RNA isolation by acid guanidinium thiocyanate-phenol-chloroform extraction. Anal Biochem. 1987;162:156–159. doi: 10.1006/abio.1987.9999. [DOI] [PubMed] [Google Scholar]
- 8.Conradt M, Storck T, Stoffel W. Localization of N-glycosylation sites and functional role of the carbohydrate units of GLAST-1, a cloned rat brain l-glutamate/l-aspartate transporter. Eur J Biochem. 1995;229:682–687. doi: 10.1111/j.1432-1033.1995.tb20514.x. [DOI] [PubMed] [Google Scholar]
- 9.Dågerlind A, Friberg K, Bean AJ, Hökfelt T. Sensitive mRNA detection using unfixed tissue: combined radioactive and non-radioactive in situ hybridization histochemistry. Histochemistry. 1992;98:39–49. doi: 10.1007/BF00716936. [DOI] [PubMed] [Google Scholar]
- 10.Derouiche A, Rauen T. Coincidence of l-glutamate/l-aspartate transporter (GLAST) and glutamine synthetase (GS) immunoreactions in retinal glia: evidence for coupling of GLAST and GS in transmitter clearance. J Neurosci Res. 1995;42:131–143. doi: 10.1002/jnr.490420115. [DOI] [PubMed] [Google Scholar]
- 11.Drenckhahn D, Franz H. Identification of actin-, α-actinin-, and vinculin-containing plaques at the lateral membrane of epithelial cells. J Cell Biol. 1986;102:1843–1852. doi: 10.1083/jcb.102.5.1843. [DOI] [PMC free article] [PubMed] [Google Scholar]
- 12.Drenckhahn D, Jöns T, Schmitz F. Production of polyclonal antibodies against proteins and peptides. Methods Cell Biol. 1993;37:7–56. doi: 10.1016/s0091-679x(08)60242-3. [DOI] [PubMed] [Google Scholar]
- 13.Fagg GE, Foster AC. Amino acid neurotransmitters and their pathways in the mammalian central nervous system. Neuroscience. 1983;9:701–719. doi: 10.1016/0306-4522(83)90263-4. [DOI] [PubMed] [Google Scholar]
- 14.Fonnum F. Glutamate: A neurotransmitter in mammalian brain. J Neurochem. 1984;42:1–11. doi: 10.1111/j.1471-4159.1984.tb09689.x. [DOI] [PubMed] [Google Scholar]
- 15.Kanai Y, Hediger MA. Primary structure and functional characterization of a high-affinity glutamate transporter. Nature. 1992;360:467–471. doi: 10.1038/360467a0. [DOI] [PubMed] [Google Scholar]
- 16.Kanai Y, Smith CP, Hediger MA. The elusive transporters with a high affinity for glutamate. Trends Neurosci. 1993;16:365–370. doi: 10.1016/0166-2236(93)90094-3. [DOI] [PubMed] [Google Scholar]
- 17.Kanner BI, Schuldiner S. Mechanism of transport and storage of neurotransmitters. CRC Crit Rev Biochem. 1987;22:1–38. doi: 10.3109/10409238709082546. [DOI] [PubMed] [Google Scholar]
- 18.Kugler P. Enzymes involved in glutamatergic and GABAergic neurotransmission. Int Rev Cytol. 1993;147:285–336. doi: 10.1016/s0074-7696(08)60771-8. [DOI] [PubMed] [Google Scholar]
- 19.Kugler P, Weeger T, Horváth E. Glutamate dehydrogenase in astrocytes of the rat dentate gyrus following lesion of the entorhinal cortex. Neuroscience. 1995;64:173–182. doi: 10.1016/0306-4522(94)00358-c. [DOI] [PubMed] [Google Scholar]
- 20.Lehre KP, Levy LM, Ottersen OP, Storm-Mathisen J, Danbolt NC. Differential expression of two glial glutamate transporters in the rat brain: quantitative and immunocytochemical observations. J Neurosci. 1995;15:1835–1853. doi: 10.1523/JNEUROSCI.15-03-01835.1995. [DOI] [PMC free article] [PubMed] [Google Scholar]
- 21.Maxwell MH. Two rapid and simple methods used for the removal of resins from 1.0 μm thick epoxy sections. J Microsc. 1978;112:253–255. doi: 10.1111/j.1365-2818.1978.tb01174.x. [DOI] [PubMed] [Google Scholar]
- 22.Paxinos G, Watson C. The rat brain in stereotaxic coordinates, 2nd Edition. Academic; New York: 1986. [Google Scholar]
- 23.Pines G, Danbolt NC, Bjørås M, Zhang Y, Bendahan A, Eide L, Koepsell H, Storm-Mathisen J, Seeberg E, Kanner BI. Cloning and expression of a rat brain l-glutamate transporter. Nature. 1992;360:464–467. doi: 10.1038/360464a0. [DOI] [PubMed] [Google Scholar]
- 24.Ramachandran B, Houben K, Rozenberg YY, Haigh JR, Varpetian A, Howard BD. Differential expression of transporters for norepinephrine and glutamate in wild type, variant, and WNT1-expressing PC12 cells. J Biol Chem. 1993;268:23891–23897. [PubMed] [Google Scholar]
- 25.Rauen T, Kanner BI. Localization of the glutamate transporter GLT-1 in rat and macaque monkey retina. Neurosci Lett. 1994;169:137–140. doi: 10.1016/0304-3940(94)90375-1. [DOI] [PubMed] [Google Scholar]
- 26.Rothe F, Brosz M, Storm-Mathisen J. Quantitative ultrastructural localization of glutamate dehydrogenase in the rat cerebellar cortex. Neuroscience. 1994;62:1133–1146. doi: 10.1016/0306-4522(94)90349-2. [DOI] [PubMed] [Google Scholar]
- 27.Rothstein JD, Martin L, Levey AI, Dykes-Hoberg M, Jin L, Wu D, Nash N, Kuncl RW. Localization of neuronal and glial glutamate transporters. Neuron. 1994;13:713–725. doi: 10.1016/0896-6273(94)90038-8. [DOI] [PubMed] [Google Scholar]
- 28.Rothstein JD, Van Kammen M, Levey AI, Martin LJ, Kuncl RW. Selective loss of glial glutamate transporter GLT-1 in amyotrophic lateral sclerosis. Ann Neurol. 1995;38:73–84. doi: 10.1002/ana.410380114. [DOI] [PubMed] [Google Scholar]
- 29.Sambrook J, Fritsch EF, Maniatis T. Molecular cloning: a laboratory manual, 2nd Edition. Cold Spring Harbor Laboratory; Cold Spring Harbor, NY: 1989. [Google Scholar]
- 30.Sandoval ME, Cotman WC. Evaluation of glutamate as a neurotransmitter of cerebellar parallel fibers. Neuroscience. 1978;3:199–206. doi: 10.1016/0306-4522(78)90101-x. [DOI] [PubMed] [Google Scholar]
- 31.Sanger F, Nicklen S, Coulsen AR. DNA sequencing with chain-terminating inhibitors. Proc Natl Acad Sci USA. 1977;74:5463–5467. doi: 10.1073/pnas.74.12.5463. [DOI] [PMC free article] [PubMed] [Google Scholar]
- 32.Schmitt A, Asan E, Püschel B, Jöns T, Kugler P. Expression of the glutamate transporter GLT1 in neural cells of the rat central nervous system: non-radioactive in situ hybridization and comparative immunocytochemistry. Neuroscience. 1996;71:989–1004. doi: 10.1016/0306-4522(95)00477-7. [DOI] [PubMed] [Google Scholar]
- 33.Shafqat S, Tamarappoo BK, Kilberg M, Puranam RS, McNamara JO, Guadano-Ferraz A, Fremeau RT. Cloning and expression of a novel Na+-dependent neutral amino acid transporter structurally related to mammalian Na+/glutamate cotransporters. J Biol Chem. 1993;268:15351–1555. [PubMed] [Google Scholar]
- 34.Shashidharan P, Plaitakis A. Cloning and characterization of a glutamate transporter cDNA from human cerebellum. Biochim Biophys Acta. 1993;1216:161–164. doi: 10.1016/0167-4781(93)90057-k. [DOI] [PubMed] [Google Scholar]
- 35.Storck T, Schulte S, Hofmann K, Stoffel W. Structure, expression, and functional analysis of a Na+-dependent glutamate/aspartate transporter from rat brain. Proc Natl Acad Sci USA. 1992;89:10955–10959. doi: 10.1073/pnas.89.22.10955. [DOI] [PMC free article] [PubMed] [Google Scholar]
- 36.Tanaka K. Expression and cloning of a rat glutamate transporter. Neurosci Res. 1993;16:149–153. doi: 10.1016/0168-0102(93)90082-2. [DOI] [PubMed] [Google Scholar]
- 37.Torp R, Danbolt NC, Babaie E, Bjørås M, Seeberg E, Storm-Mathisen J, Ottersen OP. Differential expression of two glial glutamate transporters in the rat brain: an in situ hybridization study. Eur J Neurosci. 1994;6:936–942. doi: 10.1111/j.1460-9568.1994.tb00587.x. [DOI] [PubMed] [Google Scholar]
- 38.Vidal S, Lombardero M, Sánchez P, Román A, Moya L. An easy method for the removal of Epon resin from semithin sections: application of the avidin-biotin technique. Histochem J. 1995;27:204–209. [PubMed] [Google Scholar]
- 39.Würdig S, Kugler P. Histochemistry of glutamate metabolizing enzymes in the rat cerebellar cortex. Neurosci Lett. 1991;130:65–168. doi: 10.1016/0304-3940(91)90388-a. [DOI] [PubMed] [Google Scholar]