

Abstract
The postnatal development of corticospinal projections was investigated in 11 macaques by means of the anterograde transport of wheat germ agglutin–horseradish peroxidase injected into the primary motor cortex hand area. Although the fibers of the corticospinal tract reached all levels of the spinal cord white matter at birth, their penetration into the gray matter was far from complete. At birth, as in the adult, corticospinal projections were distributed to the same regions of the intermediate zone, although they showed marked increases in density during the first 5 months. The unique feature of the primate corticospinal tract, namely direct cortico-motoneuronal projections to the spinal motor nuclei innervating hand muscles, was not present to a significant extent at birth. The density of these cortico-motoneuronal projections increased rapidly during the first 5 months, followed by a protracted period extending into the second year of life. The densest corticospinal terminations occupied only 40% of the hand motor nuclei in the first thoracic segment at 1 month, 73% at 5 months, and 75.5% at 3 years. A caudo-rostral gradient of termination density within the hand motor nuclei was present throughout development and persisted into the adult. As a consequence, the more caudal the segment within the cervical enlargement, the earlier the adult pattern of projection density was reached. No transitory corticospinal projections were found. The continuous postnatal expansion of cortico-motoneuronal projections to hand motor nuclei in primates is in marked contrast to the retraction of exuberant projections that characterizes the development of other sensory and motor pathways in subprimates.
Keywords: corticospinal development, cortico-motoneuronal projections, macaque monkey, primary motor cortex hand area, anterograde transport of WGA-HRP, densitometric analysis
In primates the direct, cortico-motoneuronal (CM) projections play an important part in the cortical control of skilled hand movements (Kuypers, 1981; Bortoff and Strick, 1993; Lemon, 1993) (see Porter and Lemon, 1993). It is known that the cortex exerts particularly powerful excitatory CM effects on those motoneurons that innervate hand and finger muscles and that the cortical neurons giving rise to these connections are particularly active during independent finger movements (Muir and Lemon, 1983; Palmer and Ashby, 1992; Porter and Lemon, 1993; Bennett and Lemon, 1996). It is also known that such projections are particularly well developed in species that possess a high degree of digital dexterity (Phillips, 1971; Heffner and Masterton, 1983; Bortoff and Strick, 1993). Lesion evidence has also stressed the particularly debilitating effects of motor cortex and pyramidal tract lesions on finger movements (Lawrence and Kuypers, 1968; Colebatch and Gandevia, 1989; Matsumura et al., 1991).
Newborn primates have very poorly developed finger movements, and even basic hand skills take many months to acquire. In the macaque monkey, the first signs of relatively independent finger movements are seen at ∼3 months but do not reach an adult pattern until at least 7–8 months (Lawrence and Hopkins, 1976; Galea and Darian-Smith, 1995). These behavioral changes undoubtedly reflect the maturation of the neural substrate subserving skilled digit control. In 1962, Kuypers, using anterograde degeneration techniques in a neonatal macaque, found that corticospinal fibers had reached all levels of the spinal cord and that there were terminals within the spinal intermediate zone. However, he found no significant terminations among the motor nuclei. An “almost adult pattern” of terminal labeling (i.e., including labeling in the dorsolateral motor nuclei supplying the hand muscles) was found in an 8-month-old animal.
These observations led Kuypers to suggest that the development of CM connections is a prerequisite for the performance of independent finger movements. In keeping with these findings, the thresholds of EMG responses to transcranial magnetic stimulation (TMS) of the motor cortex, which are thought to be mediated by the CM system, reach adult values by 5–8 months of age (Flament et al., 1992). However, little is known about the time course of the structural and functional changes that underlie these important developments. Because a number of motor disorders are associated with malformation of the corticospinal system, it is becoming increasingly important to understand the milestones of its developmental timetable.
A widely held view of brain development is that neural connections begin with an initial formation of widespread exuberant projections, followed by “pruning” or “dieback” of inappropriate or nonfunctional connections (O’Leary, 1992). Although this process undoubtedly occurs in the development of the corticospinal system in subprimates (for review, see Armand et al., 1996), it is not known whether such a process also applies to the CM projection, because this is lacking in subprimates. Galea and Darian-Smith (1995), who used retrograde tracers injected into the spinal gray of macaque monkeys of different ages, found evidence for an exuberant cortical origin of the tract in infant monkeys up to 3 months old, but their method could not reveal any conclusions specific to the CM projection.
This study addresses these different issues by the use of wheat germ agglutin–horseradish peroxidase (WGA-HRP), injected into the primary motor cortex, to produce anterograde labeling of corticospinal projections to the spinal motor nuclei of the cervical enlargement. We presume these projections to be principally cortico-motoneuronal. We carried out a systematic, quantitative analysis of the projections to the hand muscle motor nuclei because, from a behavioral point of view, it is the corticospinal control of motoneurons supplying hand and finger muscles that is of most interest in trying to understand how the maturation of this system might contribute to the development of hand skill.
The maturation of the CM projections is no means the only important factor in the functional development of the CM system: others include the ability of the corticospinal fibers to conduct impulses rapidly from cortex to cord and for these fibers to establish functional connections with their target motoneurons. These neurophysiological parameters were measured in the same group of monkeys, and the results are presented in the companion paper [Olivier et al., 1997 (this issue)].
A preliminary account of this work has been published previously (Armand et al., 1994).
MATERIALS AND METHODS
Animals. The experiments reported here and in the companion paper were performed on 14 macaque monkeys, including a neonate (5 d old at perfusion), 8 infants between 1 and 13 months of age, and 5 adults between 3 and 12 years of age (see Table1). Nine of the monkeys were Macaca mulatta, and five were M. fascicularis. All animals were purpose-bred for research. Anatomical and electrophysiological investigations were carried out in all animals, with the exception of three adults (cases 1, 12, and 14) that were used only for electrophysiology.
Table 1.
Details of macaque monkeys used for this investigation and in our parallel electrophysiological study (Olivier et al., 1997)
| Case | Age | Weight (kg) | Species | Sex | Anterograde labeling of CS projections | Densitometric analysis of C7–Th1 | Electrophysiology | |
|---|---|---|---|---|---|---|---|---|
| Neonate | 7 | 5 d | 0.6 | m.m. | ♀ | + | + | |
| Infants | 15 | 1 month | 0.6 | m.m. | ♂ | + | + | + |
| 11 | 2.5 months | 0.7 | m.m. | ♀ | + | + | + | |
| 2 | 3 months | 0.7 | m.m. | ♀ | + | + | ||
| 5 | 5 months | 0.8 | m.f. | ♂ | + | + | + | |
| 4 | 7 months | 1.0 | m.f. | ♀ | + | + | ||
| 9 | 9 months | 1.2 | m.m. | ♀ | + | + | + | |
| 8 | 11 months | 2.9 | m.m. | ♂ | + | + | + | |
| 10 | 13 months | 2.5 | m.m. | ♂ | + | + | ||
| Adults | 3 | 3 years | 2.2 | m.f. | ♂ | + | + | |
| 6 | 3 years | 2.1 | m.f. | ♀ | + | + | ||
| 1 | 3 years | 2.3 | m.f. | ♂ | + | |||
| 12 | 12 years | 5.9 | m.m. | ♀ | + | |||
| 14 | 10 years | 6.7 | m.m. | ♀ | + |
+, The monkey was used for the purpose indicated. m.m., m.f.,Macaca mulatta and M. fascicularis, respectively.
Injection of WGA-HRP. Our objective was to make a large injection of WGA-HRP into the hand area of the primary motor cortex in each animal of the series. Anesthesia was induced by intramuscular ketamine injection (10 mg/kg) and maintained using 2.5–3% isoflurane in a 50:50 O2/N2O mixture. In the cases of unweaned infants (cases 7, 11, and 15), the mother was sedated during the operation by intramuscular ketamine injection (10 mg/kg) and diazepam (1.5 mg/kg). Under full aseptic conditions, a small craniotomy was made, the dura was reflected, and a solution of 10% WGA-HRP (Sigma, St. Louis, MO) in 0.15 m saline was injected via a 29-gauge stainless steel needle into the rostral bank of the central sulcus. The target was the hand region of the primary motor cortex, and the precise laterality and depth of the injections were based on the location of the sulcal genu and our previous investigations of this region (Lemon et al., 1986; Bennett and Lemon, 1996). In each experiment, a total of eight needle tracks were made, four in a row approximately parallel to the sulcus and 0.5–1.0 mm rostral to it and four in a second row 1.5–2.5 mm rostral to it. Tracks in these two rows were made to depths of 8 and 6 mm, respectively. The tip of the needle was angled 5° anterior, so that the track remained within the rostral bank of the sulcus. Along each track, 0.1 μl of WGA-HRP solution was pressure-injected at 1 mm intervals, so that deposits were made at a total of 50–60 sites in each animal. One minute was allowed to elapse between injections at successive depths. In all animals, the injection was made in the right hemisphere.
Each animal was given full postoperative analgesic and antibiotic treatment. Recovery was uneventful in all cases, and each animal was carefully monitored during the survival period of ∼72 hr. Unweaned infants were returned to their mother during the recovery period.
Perfusion. At the end of the survival period, each animal underwent a brief electrophysiological experiment, carried out under isoflurane anesthesia [see companion paper (Olivier et al., 1997)]. At the end of this experiment, the animal was deeply anesthetized with Nembutal (30 mg/kg, i.v.) and perfused through the heart with a vascular rinse [0.9% NaCl, 10 mm NaNO2, 5% polyvinyl pyrrolidone (PVP40), 5000 U of heparin at 36°C] followed by fixative (1% paraformaldehyde, 2.5% glutaraldehyde in 0.1m phosphate buffer, pH 7.3, at 4°C). After 30 min, the perfusion with fixative was stopped and continued with 0.1m phosphate buffer (at 4°C) containing 10% sucrose for another 15 min and 20% sucrose for a final 15 min. After perfusion, the dorsal part of the cranium was removed and the head was fixed in a stereotaxic apparatus. Three histological blocks were made in stereotaxic coronal planes, i.e., a middle block containing the injection (A12.0–AP0), together with a rostral (A12.0–A20.5) and a caudal (AP0–P10.0) block. After laminectomy, each spinal segment was carefully identified and the spinal cord was removed. The cord was then cut into blocks. All histological blocks were kept overnight in 0.1m phosphate-buffered sucrose (30%) at 4°C.
Sections. Frozen sections were cut at 50 μm. For the cortical blocks containing the injection site, three series of coronal sections were collected, each consisting of every fifth section. The sections of the first series were processed histochemically to visualize HRP using the conventional nitroprusside–tetramethyl benzidine (TMB) method (Mesulam, 1982), and those of the second series were processed using the paratungstate/TMB reaction (Weinberg and Van Eyck, 1991). The sections of the third series were post-fixed in formalin and stained with cresyl violet for cytoarchitectonic analysis. For each spinal cord segment transported WGA-HRP was visualized, in alternate sections, with nitroprusside/TMB and paratungstate/TMB, respectively. The latter sections were also counterstained with Neutral Red to identify the motor nuclei.
Reconstruction of the cortical injection site.Reconstructions of the injection site were made by superimposing the drawings of nitroprusside/TMB-reacted sections and cresyl violet-stained sections (see Figs. 4, 5). All drawings were made with the aid of an X-Y plotter driven by linear potentiometers coupled to the microscope stage. On nitroprusside/TMB-reacted sections, two zones of reaction product density could be distinguished under bright-field illumination: an inner zone, where the labeling was as dense in the cell bodies and axons as in the extracellular space and often crossed by needle tracks (Figs. 4, 5, stippled areas), surrounded by an outer zone, where the reaction product was less dense in the extracellular space than in the cell bodies and axons (areas enclosed by dashed line in Figs. 4, 5). The inner areas of the injection site indicate where WGA-HRP uptake would have occurred, the outer area a region of probable diffusion and transport (Mesulam, 1982). The cytoarchitectonic areas were delineated on adjacent cresyl violet-stained sections under bright-field illumination. The criteria of Jones et al. (1978) were used to identify area 4. Area 6, and particularly the dorsal premotor region, was characterized by the lack of granular layer IV and a layer V containing scattered large pyramidal cells (Dum and Strick, 1991). Area 3a, at the bottom of the central sulcus in the hand area, was identified on the basis of its thinned granular layer IV (compared to the thicker layer IV of area 3b), a layer V containing some large pyramidal cells (Jones et al., 1978; Jones and Porter, 1980), and a sharply demarcated border between layer VI and white matter (Sessle and Wiesendanger, 1982). It was sometimes difficult to ascertain the area 3a–3b border (Fig. 5, section 1, 13 month case) and the area 1–2 border (Fig. 4, section 3, 3 months case; see Jones et al., 1978).
Fig. 4.
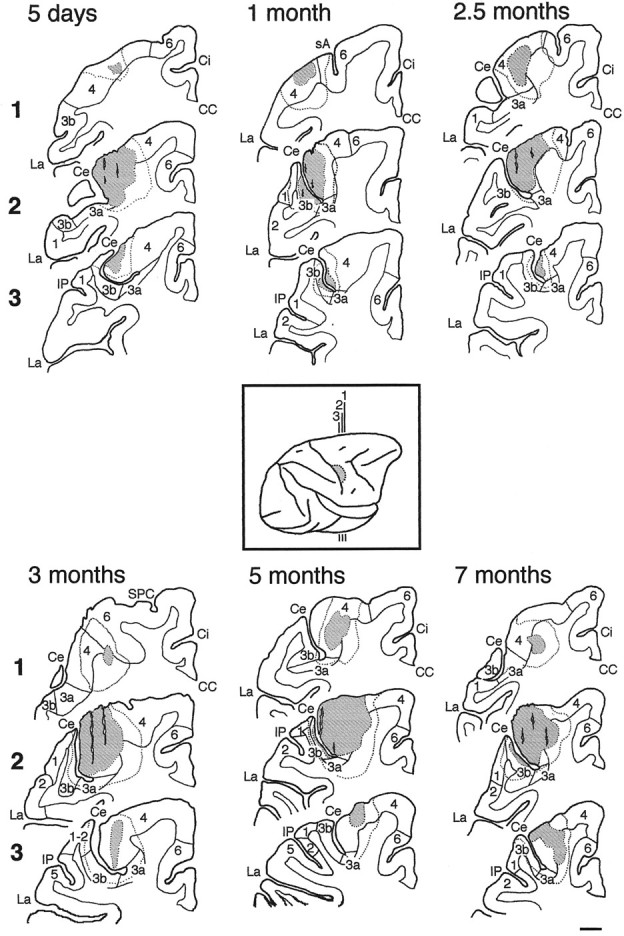
Injection sites of WGA-HRP in the different cases.Inset, Standard diagram of the right hemisphere and the position of three coronal planes (∼2.5 mm separation) in rostrocaudal sequence (1–3) passing through the injection site (stippled area). In each case (5 d and 1, 2.5, 3, 5, and 7 months), the stippled area shows the injection site, including needle tracks, where the reaction product is as dense in axons and perikarya as in the extracellular space, whereas the area enclosed by the dotted line is the surrounding zone of diffusion and/or transport of WGA-HRP (from TMB/nitroprusside-reacted sections). The boundaries between the gray and the white matter as well as between the cytoarchitectonic areas (4, 6, 3a, 3b, 1, 2, 5) are represented by a thin solid line (from cresyl violet-stained sections). In each section, medial is on theright and dorsal is at the top.CC, Corpus callosum; Ce, central sulcus;Ci, cingulate sulcus; IP, intraparietal sulcus; La, lateral sulcus; sA, spur of the arcuate sulcus; SPC, superior precentral sulcus. Scale bar, 2 mm.
Fig. 5.

Injection sites of WGA-HRP in the 9-, 11-, and 13-month-old and 3-year-old animals. The injection in the adult (case 3) is representative of both adult cases. See Figure 4 for details.
Densitometric analysis of corticospinal terminations in different cases. Our aim was to obtain a quantitative analysis of the relative density and distribution of reaction product in different parts of the spinal gray matter and at different segmental levels, so that we could carry out a detailed comparison of labeled corticospinal terminals in animals of different ages. Great care was taken to standardize the protocols at each step of the experiment, i.e., injection site and relative amount of tracer, histochemical processing, illumination for photography, film processing, and aperture of the charge-coupled device (CCD) camera when capturing the image. This densitometric analysis was performed in six animals of different ages, i.e., 1, 2.5, 5, 9, and 11 months and 3 years (case 3). For the adult, essentially similar results were obtained in the second case (case 6). It was not possible in the neonate (5 d) because the labeling in the spinal gray matter was so faint; only a qualitative description will be given.
Photography. To visualize the reaction product in the nitroprusside/TMB-reacted sections, we used polarizing filters and a dark-field effect. Using a Leitz Dialux 20 microscope with a 100 W light source, we achieved a dark-field effect using a phase-contrast condenser (Leitz UK Universal) with low-power objectives (1.6× and 2.4×). The condenser was fitted with phase rings, and ring #4 produced a dark-field stop sufficiently large to cover the spinal cord. Polarizing filters with an angular displacement of 90° were placed above and below the specimen. This combination maximized the image produced by refraction by the reaction product while minimizing the image of the background spinal tissue. To maintain the same quantitative relationship for the analysis, the exposure time was determined for the brightest section of the entire series and remained constant for all other sections. A photograph of this standard section was taken at the beginning of each new film, and all films were developed under identical conditions. The negative of the brightest section was digitized using a CCD camera (Orkis N432, picture definition 768 × 576 pixels), and the illumination was adjusted so that the entire image fell within 256 gray levels available (see negative image of an entire section photographed under dark-field illumination in Fig. 1A, together with the density histogram of this image). All other sections were digitized with the same illumination.
Fig. 1.

Densitometric analysis of a spinal cord section (Th1 level of the adult case 3). A, The whole section, shown on the left, is a negative image. The positive photomicrograph of the same section, photographed under dark-field illumination, is shown in Figure 6D. The distribution of gray levels within this negative image is shown on theright, i.e., number of pixels per gray level (0–256). The background density level (i.e., that contributed by the slide, mounting medium, and coverslip) was computed by selecting an area outside but close to the actual section (inset).B, The area of gray matter contralateral to the injection site has been selected. The background density level has been subtracted from this selected area. The histogram inB shows the density distribution of regions with and without labeling (note the difference in the ordinate scales betweenA and B). The gray matter regions without labeling corresponded to gray level values 0–85. The “window of terminations,” delineated by dashed lines, was between 85 and 220 gray levels and was subdivided into five equal ranges (arrowheads, 1–20%, 21–40%, 41–60%, 61–80%, and 81–100%).
Densitometric analysis for each case. Densitometric analysis was carried out using the Piclab Image Analysis package (P. Rage, Recherche Sainte Croix, Auriol, France). Analysis was performed on nitroprusside-reacted sections from the five spinal cord half-segments (caudal C7 to caudal Th1) in which the motor nuclei supplying hand and finger muscles are located (Jenny and Inukai, 1983). The total number of sections analyzed ranged from 35 to 60 per case. For each section, the entire spinal hemicord contralateral to the injection site was delineated and selected. Analysis was performed in two steps. In the first step, the background density, i.e., that contributed by the slide, mounting medium, and coverslip, was computed by selecting an area outside but close to the actual section (seeinset in Fig. 1A), and this background level was subtracted from that of the whole image (compare histograms in Fig. 1, A and B). This background level was similar in all cases. In the second step, the spinal gray matter was delineated and selected from this corrected image. The resulting image (Fig. 1B) showed the density distribution for gray matter regions with and without labeling. A “window of terminations,” i.e., a range of gray levels corresponding to the tissue labeled with reaction product, was defined by checking the upper and lower limits of labeling in every section from a given case. The lower threshold of this window was defined as the minimum gray level value of any labeling above the levels of unlabeled regions of the spinal gray. For each case, a mean value of this lower threshold was calculated from the values obtained from every section analyzed for that case. This lower threshold could vary with the age of the animal caused, for example, by changes in the density of the neuropil, myelination, and the development of terminal arborization.
The upper threshold was defined as the maximum gray level of the densest section of a given animal, usually found in the Th1 segment. Practically, this upper threshold was 6–8 gray levels below the very brightest pixels, which were generally contributed by HRP crystal artifacts overlaying the section. In the example shown in Figure1B, the arrows mark the window of termination (120–160). In a few sections, the overall window of termination was lower than that in adjacent sections in the rostro-caudal series. In these cases, the highest level of the section was adjusted to the highest level of the other sections simply by shifting the histogram without changing its distribution. The density of labeling within the termination window was divided into five equal ranges (i.e., 1–20%, 21–40%, 41–60%, 61–80%, and 81–100%; see Fig.1B). The Piclab package was used to compute, for each section, the total area of the gray matter. The mean area occupied by the five different density ranges was established from data obtained from 6–12 sections belonging to the same half-segment. The most rostral and most caudal sections of each half-segment were discarded in this part of the analysis.
Comparison between animals of different ages. Despite our care to standardize the process of preparing tissue and images, the window of termination densities varied from case to case and, as a consequence, the width of the density ranges was different in the different animals. However, the approach used was the only one that allowed a quantitative comparison of the relative distribution of label in the different animals. Examples of the pattern and density of labeling in the gray matter in two cases (adult case 3 and 5 months) are shown in Figure 2, A and B, respectively. The density histograms show that the window of terminations was slightly different in the two cases (85–220 and 120–230, respectively).
Fig. 2.

Comparison of densitometry for two cases. The “window of terminations” within the spinal gray matter contralateral to the cortical injection is shown for an adult (case 3, same data as Figs. 1B, 6D) in A and the 5-month-old infant monkey (case 5) inB. Differences in labeling in the dorsal horn and in the ventromedial part of the intermediate zone were probably attributable to differences in the extent of the injection sites in the two animals (see text). The density histograms show that the width of the window of terminations (dashed lines) was slightly different in the two cases: 85–220 gray levels in A and 120–230 inB. As a consequence, the five ranges (arrowheads) had slightly different widths.
Corticospinal termination densities within hand muscle motor nuclei. Using an X-Y plotter attached to the microscope stage, the locations of all motoneurons were determined (1) in each nitroprusside/TMB-reacted section with phase contrast, and (2) in the consecutive paratungstate/TMB-reacted section (counterstained with Neutral Red) with bright field. This allowed direct and precise delineation of the motoneuronal cell groups. The locations of motor nuclei supplying the hand and finger muscles, reconstructed from the data of Jenny and Inukai (1983), were then superimposed on each drawing, as shown in Figure 3. In Figure 3(left), the overall area occupied by these nuclei is shown on diagrams of the hemispinal gray matter from caudal C7 to caudal Th1. The rostro-caudal variation in the number of motoneurons in these selected motor nuclei reported by Jenny and Inukai (1983) correlated very closely with our areal measurements of these nuclei (Fig. 3,right), with an increase from caudal C7 to rostral Th1 and then a significant decrease in caudal Th1. These area measurements were taken from three of our cases (2.5 and 5 month and adult case 3).
Fig. 3.

Rostrocaudal variations of the number of motoneurons of selected hand and finger muscles (from Jenny and Inukai, 1983) and of the area occupied by these motor nuclei as computed in this study. Left, Diagrams of the hemispinal gray matter in the spinal segments from C7 to Th1 and including both caudal (C) and rostral (R) half-segments of C8 and Th1. The dotted line encloses the overall area occupied by the motor nuclei (solid lines) of eight selected hand and finger muscles, whose numbers are indicated inbrackets. 1, 1st dorsal interosseous;2, lateral lumbrical; 3, adductor pollicis; 4, flexor and abductor pollicis brevis;5, flexor digitorum profundus and superficialis;6, extensor digitorum communis and extensor digiti secundi proprius, abductor and extensor pollicis longus;7, flexor carpi ulnaris; 8, extensor carpi ulnaris; reconstructed from Figures 6, 7, 8 of Jenny and Inukai (1983). Right, Rostrocaudal variation, from C7 to Th1, of the number of motoneurons (open circles) of these eight selected hand and finger muscles (from Fig. 4 of Jenny and Inukai, 1983) and the overall area in pixels (filled squares) occupied by these motor nuclei in the present study. Area measurements are mean ± SD of data from three cases (2.5 months, 5 months, and adult case 3).
On each nitroprusside-reacted section from caudal C7 to caudal Th1, the region of lamina IX containing these motor nuclei was selected and its area measured. The proportion of this selected area occupied by densitometrically defined corticospinal terminations was calculated. The proportion of the same area occupied by the densest 40% of these terminations was also determined.
RESULTS
Injection sites
Our objective was to allow WGA-HRP uptake throughout the hand representation of the primary motor cortex (area 4). In all animals, the injection was located just medial to the genu of the central sulcus (Fig. 4, inset). The bulk of the injection always involved all layers of area 4 within the rostral bank of the central sulcus and onto the adjoining precentral gyrus. In all cases, it also slightly encroached on the immediately underlying white matter (Figs. 4, 5, Table 2).
Table 2.
Volume of 10% WGA-HRP (in μl) injected into the primary motor cortex hand area in the different cases
| Case | Age | WGA-HRP (μl) | Hand area | Area 4 | Area 3a | Area 3b | |
|---|---|---|---|---|---|---|---|
| More medial | More rostral | ||||||
| 7 | 5 d | 4.0 | + | + | + | ||
| 15 | 1 month | 4.6 | + | + | + | ||
| 11 | 2.5 months | 4.6 | + | ||||
| 2 | 3 months | 8.1 | + | ||||
| 5 | 5 months | 4.9 | + | + | |||
| 4 | 7 months | 4.7 | + | ||||
| 9 | 9 months | 5.6 | + | ||||
| 8 | 11 months | 5.5 | + | + | + | ||
| 10 | 13 months | 5.6 | + | + | + | ||
| 3 | 3 years | 8.7 | + | + | + | + | |
| 6 | 3 years | 4.6 | + | + | |||
Spread of the injection site to adjacent regions of M1 and to areas 3a and 3b is indicated.
There were some minor variations in the extent of the injection site in the different cases: in three cases (1, 5, and 11 months) the injection spread slightly more medially along the central sulcus, whereas in adult cases 3 and 6 (3 years) the injection spread slightly more rostrally onto the convexity of the precentral gyrus, and in two cases (5 d and 13 months) it extended up to the area 4/6 border. In some animals (5 d, 11 and 13 months, and 3 years, case 3), there was minor involvement of area 3a in the fundus of the central sulcus with spread into the immediately underlying white matter in two of them (11 months and 3 years, case 3). Finally, in four cases, needle tracks reached the lumen of the central sulcus and there was minor involvement of area 3b, layers I–III (5 and 7 months), or layers I–V (1 month and 3 years, case 3).
Despite these minor variations, the main injection site involving the hand region of area 4 differed only slightly from one case to another. It was possible, therefore, to carry out a detailed quantitative comparison of the corticospinal projections in the different cases.
Distribution of labeling in the spinal cord
Funicular trajectories of the labeled fibers
The great majority of labeling within the white matter was seen, at all ages, in the contralateral dorsolateral funiculus. At C1–C2, the fibers were in a tight bundle, but at lower cervical levels, a fringe of fibers extended ventrally along the lateral edge of the funiculus, forming a crescent-shaped distribution (see Fig.6). These more ventral fibers were not seen below Th2. Most corticospinal fibers that penetrated the gray matter left the more dorsal part of the tract and entered the gray matter through the lateral border of laminae V–VII, and then fanned out within the spinal gray. However, from C7 to Th1 many fibers were seen leaving the most ventral tip of the tract and entered lamina IX directly. An example is shown in Figure 8. These two different routes of entry into the gray matter were seen even in the youngest infants. In some cases, small numbers of fibers were also observed in the ipsilateral dorsolateral funiculus and in the ventromedial funiculus on both sides; labeling in these funiculi appeared to depend on the precise location of the injection site (see below). As in the cat (Satomi et al., 1991), ipsilateral fibers, located all along the ventral median fissure (anterior corticospinal tract), were more numerous than those on the contralateral side, which were grouped in the dorsal part of the ventromedial funiculus. There were a very small number of “aberrant” corticospinal fibers in the base of the dorsal funiculus (c.f. data from cat: Kuypers and Tuerk, 1964; Satomi et al., 1989). Below Th2, all labeled fibers were restricted to the contralateral dorsolateral funiculus.
Fig. 6.
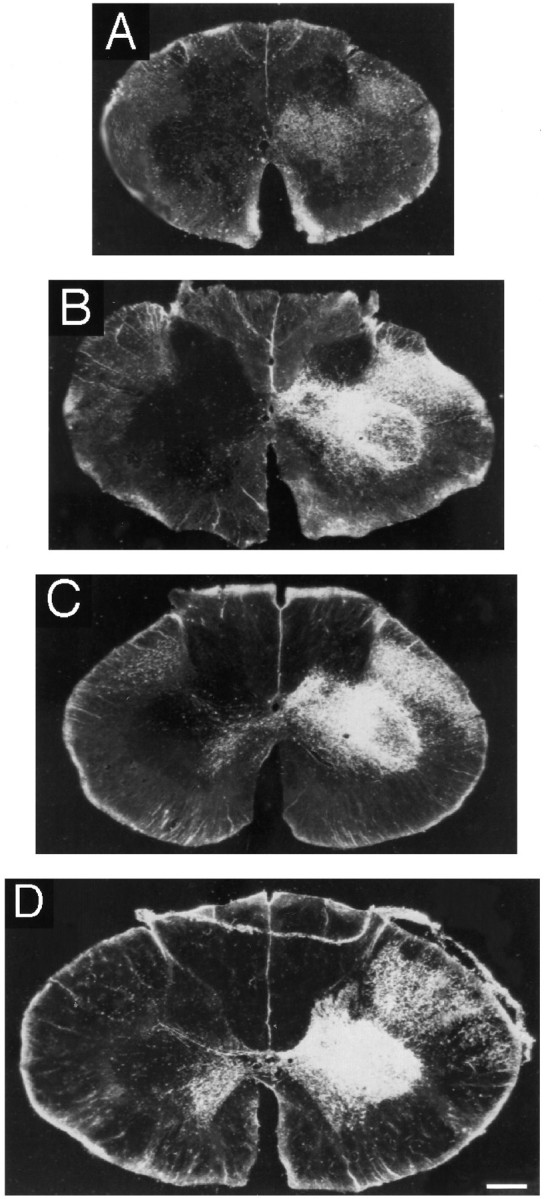
Photomicrographs under dark-field illumination and polarized light of representative spinal cord sections at the Th1 level in four different cases after injection of WGA-HRP into the hand area of the primary motor cortex (right side). The left side of the cord is shown on the right. A, 5 d;B, 2.5 months; C, 5 months;D, adult (case 3). Note the increasing intensity of labeling with age in the dorsal part of lamina IX, the location of the lateral motoneuronal cell groups innervating hand muscles. Scale bar, 500 μm.
Fig. 8.
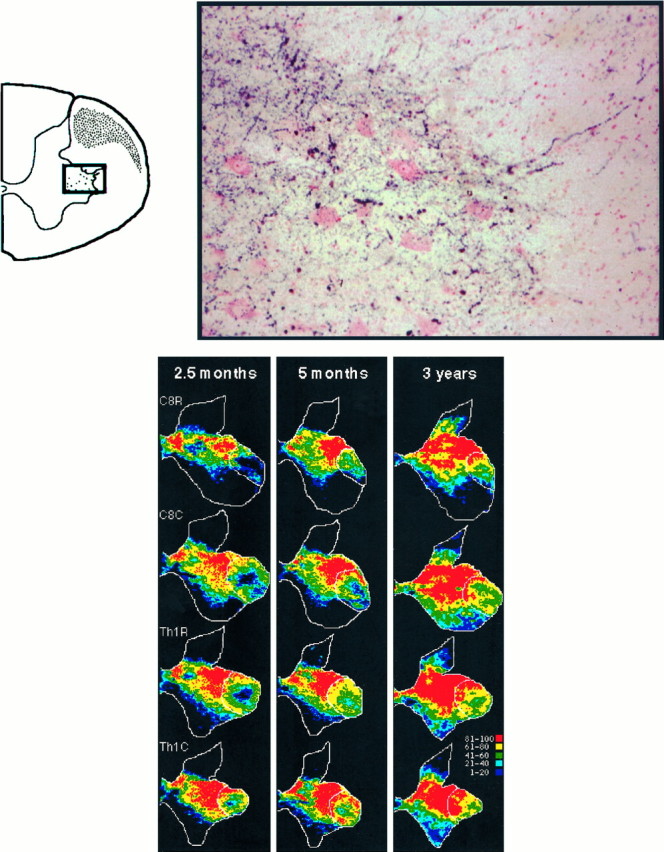
Top. Labeled corticospinal fibers terminating among the motoneurons innervating hand and finger muscles in an adult monkey. High-power color photomicrograph (location indicated by inset) under bright-field illumination of a paratungstate/TMB-reacted section (Th1 level of the adult case 6). The motoneurons have been lightly counterstained with Neutral Red. Note the labeled axons coming from the ventral tip of the crescent-shaped bundle of fibers in the lateral funiculus (hatched area ininset) and reaching directly the dorsolateral group of motoneurons (dots in inset).
General description of the pattern of corticospinal terminations within the spinal gray matter
The bulk of the terminal labeling within the spinal gray matter was focused, at all ages, in C8–Th1, with smaller amounts present in C1–C7. There was a sharp decrease in gray matter labeling in rostral Th2. In C1, heavy labeling was focused in contralateral lamina VI and the medial part of lamina V (Bortoff and Strick, 1993), as in the cat (Armand et al., 1985), with much lighter labeling in the lateral parts of V and VII and no labeling of the intervening tissue. From C2 to C4, this labeling of lateral V–VII increased in density and extended to all parts of lamina VII except its central part (n. cervicalis centralis). In C4–C5, the density of labeling in all parts of laminae V–VII became relatively uniform, except in the central region. This pattern of labeling was similar in C5–C6 with some decrease in density in the medial part of V and VI. In C7, the overall density of labeling increased and extended into the most ventral part of lamina VII, and this pattern of labeling was seen until caudal Th1 (see Fig. 6). In Th2–Th3, there was only light labeling in medial V–VI and none in the intermedio-medial column and Clark’s column. The lateral part of lamina VII was lightly labeled, but the intermedio-lateral column was not.
The relative densities of labeling in the different parts of the spinal intermediate zone were comparable at the different ages, including the 5 d infant monkey. However, there was a big increase in the overall density of labeling from birth to 2.5 months, with smaller increases until adulthood. These changes in increase in the density of intermediate zone labeling can be seen in Figures 6 and 9. The labeled fibers within the contralateral dorsolateral funiculus had a rather dust-like appearance in infants (5 d and 1, 2.5, and 3 months) in contrast to the heavy grained labeling seen in older animals. This presumably reflects the thinner axons of the infant cases [see companion paper (Olivier et al., 1997)].
Fig. 9.
Bottom. Density of corticospinal projections from the hand area of the primary motor cortex to C8–Th1 in the 2.5-month-old, 5-month-old, and 3-year-old (case 3) cases. For each monkey, four sections have been selected in each half-segment (R, rostral; C, caudal); these sections had a distribution that most closely matched the mean value on the 6–12 sections taken from that half-segment (see Materials and Methods). The color scale corresponds to the five equal-density ranges of the window of termination (see Figs. 1, 2). The region of lamina IX occupied by the hand and finger motor nuclei (see Fig. 3) is delineated by a white line. Note the caudal-to-rostral increase in density of labeling among the hand muscle motor nuclei.
The most striking change with age was the progressive invasion and increasing density within the dorsolateral motor nuclei in C8–Th1, which is analyzed in detail below.
Variations in labeling resulting from differences in injection site
Further confirmation of injection within area 4 was obtained by examining variations in the pattern of labeled corticospinal projections in the different cases. As in the cat (Armand et al., 1985), bilateral terminal labeling in lamina VIII was observed in animals in which slightly more medially (1, 5, and 11 months) or rostrally located portions of area 4 (5 d, 13 months, and 3 years, cases 3 and 6) were involved (c.f. Kuypers and Brinkman, 1970) (see Figs. 4, 5). In these seven animals, a few (5 d and 11 and 13 months) or a significant number (1, 5 months, and 3 years, cases 3 and 6) of labeled fibers were present in the ipsilateral dorsolateral and ventromedial funiculi. Furthermore, in the three cases in which slightly more medially located portions of area 4 were involved (1, 5, and 11 months), a few labeled fibers reached the lumbosacral enlargement (Kuypers and Brinkman, 1970), and even in the 1 and 5 month cases, sparse but well labeled fibers were observed bilaterally in the gray matter of S3. These bilateral corticospinal terminations to the sacral and coccygeal segments seem to be a characteristic feature of corticospinal projections from this more medial zone in both monkey and cat (Tigges et al., 1979) (J. Armand, unpublished observations). Contralateral labeling in the most dorsal laminae of the dorsal horn could have resulted from spread of the injection to area 3. Thus, in cases in which there was minor involvement of area 3a (see Table 2), some sparsely labeled fibers were observed in Rexed laminae IV and III. In cases in which there was spread to 3a and/or 3b (1 month and 3 years, case 3), labeled fibers could be traced in all parts of laminae V–VI and the medial parts of III–IV in caudal C6. Further caudally, this dorsal horn labeling extended dorsally to reach laminae I–II in caudal Th1 (Cheema et al., 1984) (see Fig. 9).
Corticospinal terminations among the motor nuclei of hand and finger muscles
General description. The motor nuclei innervating intrinsic hand muscles and the long flexor and extensors of the digits are located in the dorsolateral region of lamina IX and extend from the mid-C7 segment to the caudal half of Th1 (Sherrington, 1898; Jenny and Inukai, 1983). As pointed out above, the gray matter of these segments had denser terminal labeling than other spinal levels in all cases.
Figure 8 shows a high-power color photomicrograph of the appearance of WGA-HRP-labeled projections among the motoneurons of the hand and finger motor nuclei in the C8 segment in one of the adults (case 6). It can be seen that the corticospinal terminals are densely distributed among the motoneurons, which have been lightly counterstained with Neutral Red. Of particular interest are the labeled axons entering directly the most dorsal margin of lamina IX, in which these motoneurons are located. These axons left the most ventral tip of the crescent-shaped lateral corticospinal tract (hatched area in inset).
Figure 7 shows representative sections from the caudal C8 segment, i.e., at the point at which the number of motoneurons innervating these muscles is at a maximum (see Fig. 3,right). The location of motoneurons is depicted by open circles. The black stipple indicates the entire window of termination density (see Materials and Methods), i.e., it encompasses all of the labeling within the gray matter. In the adult case, terminal labeling was particularly heavy in the dorsolateral part of the intermediate zone and, although less dense, was also present throughout the dorsolateral group of motoneurons. There was no labeling in the vicinity of the ventral motoneurons.
Fig. 7.
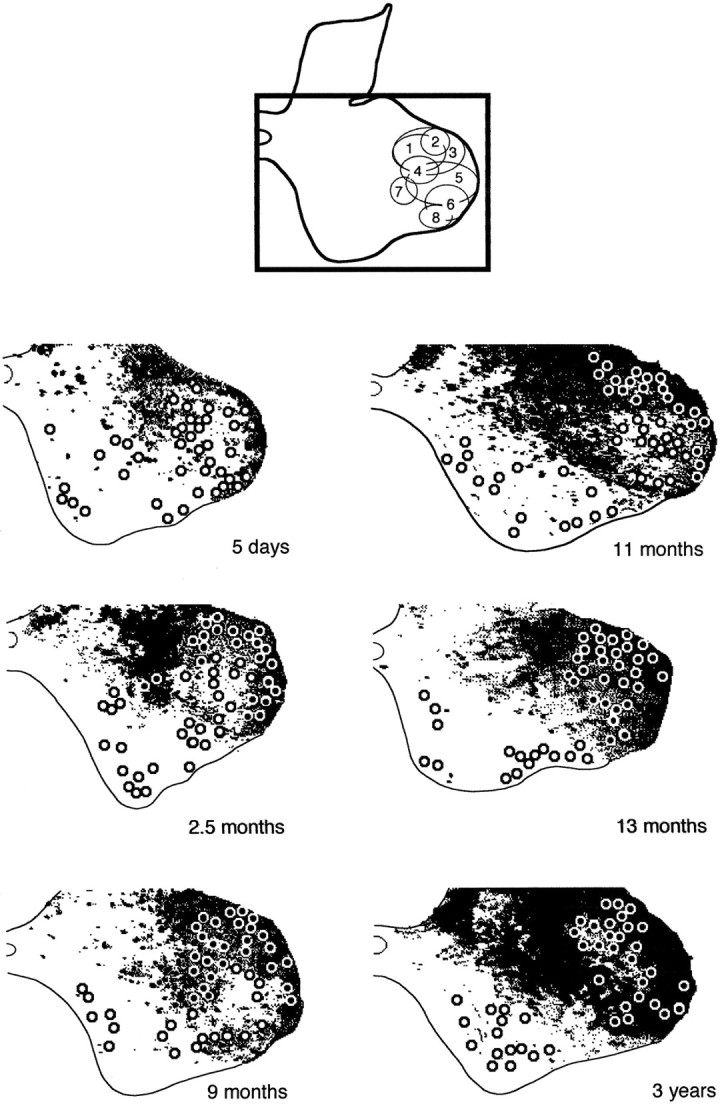
Corticospinal anterograde labeling in the gray matter at the C8–Th1 junction at different ages: 5 d, 2.5, 9, 11, and 13 months, and 3 years (case 3). The black frame at the top (from Fig. 9 in Jenny and Inukai, 1983) indicates the region of gray matter represented belowand also shows the distribution of selected hand muscle motor nuclei (for numbering, see Fig. 3). The corticospinal terminal labeling (inblack) and the location of motoneurons (circles) have been obtained from digitized paratungstate/TMB-reacted sections.
The labeling of terminals in the 5-d-old monkey was very faint compared with all of the other cases. There was some sparse labeling among the dorsolateral motor nuclei, which was most noticeable along the dorsal margin, and fainter and more scattered in the center of these motor nuclei. No labeling was observed among the ventral motoneurons in this case or in any of the other infant cases. In the 2.5-month-old monkey, there was heavy labeling within lamina VII, which formed a distinctive ring around the dorsolateral motor nuclei, and this dense labeling extended into the most dorsal motoneurons, in contrast to a more diffuse labeling among the others.
In the 9- and 11-month-old monkeys, labeling was similar to the 2.5-month-old animal, with further encroachment of fibers into the dorsolateral group of motoneurons. In the 13-month-old monkey, the characteristic ring around the dorsal motoneurons was completely in-filled. However, Figure 7 shows that the labeling within lamina IX was still less extensive and intense than in the adult case.
Quantitative densitometric analysis
The single sections shown in Figure 7 give a useful overall impression of the infiltration of the hand motor nuclei by corticospinal projections over a protracted developmental period. However, further analysis was needed to measure the density of labeling within different regions of the spinal gray and any variations in this pattern across the different segments that innervate the hand and finger muscles. This densitometric analysis entailed averaging the results from 6–12 sections taken from the five half-segments containing the hand motor nuclei (caudal C7 to caudal Th1; see Materials and Methods). The sections shown in Figure 9 are from the 2.5 month, 5 month, and adult (case 3) and were selected as having a distribution that most closely matched the mean value for that segment and that case. On each section, the region of lamina IX occupied by the hand motor nuclei is delineated by a white line, and the color scale indicates the different density ranges of labeling within the window of termination, with the densest labeling indicated by red (81–100%) and yellow (61–80%). In the adult monkey, it can be seen that the heaviest projections terminated among the dorsolateral motor nuclei and that this was particularly marked in the most caudal region (caudal Th1 segment). Most of the dorsolateral motoneurons in this region supply the intrinsic hand muscles (Jenny and Inukai, 1983) (R. Lemon and R. Muir, unpublished observations). It can be seen that the motor nuclei in this segment appear to be the earliest to receive a significant corticospinal projection. Thus, in the 2.5-month-old monkey, the heaviest projections (red) have just encompassed some of the most dorsally located Th1 hand motoneurons, whereas those similarly located within the C8 segment receive only sparse projections. In the 5-month-old monkey, the densest projections have reached the C8 motoneurons but have by this stage advanced still further into the hand motor nuclei at Th1.
These changes are plotted graphically in Figure 10. The bars show the proportion of the selected area of lamina IX containing the motor nuclei of the hand and finger muscles that received corticospinal projections (open bars) and the densest 40% of these projections (hatched bars). The caudo-rostral gradient in the density of these projections is evident at all ages. In the adult, a large proportion (70% in rostral Th1 and 81% in caudal Th1) of the hand motor nuclei located in the Th1 segment received dense corticospinal projections, whereas it was much lower (20%) in caudal C7. In the youngest animal for which this analysis was done (1 month), none of the densest projections were found in the motor nuclei at C7, in contrast to 40% of the nuclei at Th1. A substantial innervation (>17%) of the most rostral motoneurons was not seen until 5 months, at which age ∼73% of the most caudal nuclei were innervated by the densest projections. The results indicate that all of the hand motor nuclei receive some corticospinal innervation by 5 months, but that the distribution of the densest projections seen in the adult has still not been achieved even at 11 months.
Fig. 10.

Proportion of the selected area of lamina IX containing the motor nuclei of the hand and finger muscles that received corticospinal projections (open bars) and the densest 40% of these projections (hatched bars) in the different cases: 1, 2.5, 5, 9, and 11 months and 3 years (case 3). For each half-segment (R, rostral; C, caudal) from caudal C7 (C7C) to caudal Th1 (Th1C), the mean ± SD was computed from data gathered from 6–12 sections.
It is evident from Figure 10 that the developmental time course of the densest projections lagged behind those of the less well labeled projections, but otherwise there were close parallels between them. Thus, the progression in labeling seen for the weakly labeled projections at 1 month is very similar to the pattern for the densest labeling at 9 months, and the implication is that this pattern reflects the growth of early innervating projections rather than the arrival of new fibers.
The age-related changes in the density of corticospinal projections to the different segments are summarized in Figure 11. This emphasizes the especially strong projection to the most caudal segments. The very rapid increase in the area occupied by this projection during the 1–5 month postnatal period is particularly striking. The time constants of the best fit for these points were only 3.2 and 4.3 months for the rostral and caudal parts of Th1, respectively, compared to 8.4 and 12.6 months for C8.
Fig. 11.

Age-related changes in the density of corticospinal projections to C8–Th1. The proportion of the selected area of lamina IX containing the motor nuclei of the hand and finger muscles that received the densest 40% of corticospinal projections reached adult value earlier in caudal Th1 (Th1C) than in rostral C8 (C8R). The time constant of the best fit for these points was 3.2 and 4.3 months for the caudal and rostral parts of Th1, respectively, compared to 8.4 and 12.6 months for the caudal and rostral parts of C8, respectively.
DISCUSSION
Postnatal development of corticospinal projections
Our study shows that in the macaque monkey there are major postnatal changes in the pattern and density of corticospinal projections from the hand area of the primary motor cortex. Thus, although we know that fibers of the corticospinal tract have reached all levels of the spinal cord white matter by birth (Kuypers, 1962;Biber et al., 1978) (this study), the penetration of the spinal gray matter by these fibers is far from complete at birth. Our results suggest that the unique feature of the primate corticospinal tract, namely direct CM projections to the spinal motor nuclei, is not present to a significant extent at birth. We have also demonstrated that the maturation of these projections is protracted, lasting at least into the second year of postnatal life. In contrast, corticospinal projections are distributed to the same regions of the intermediate zone at birth as in the adult (c.f. Kuypers, 1962), although they also show marked increases in density during the first postnatal months. Given the widespread influence of the corticospinal tract on spinal interneurons and motoneurons, it is likely that this protracted development is of great importance for the maturation of sensorimotor function in the young primate. It is interesting to note that an important feature of postnatal corticospinal development is the continuous expansion of CM projections within lamina IX, whereas it is the retraction of exuberant projections that characterizes the development of other sensory and motor systems (Innocenti et al., 1977) (see O’Leary, 1992). Interestingly, Kuang and Kalil (1994) have demonstrated that, in the hamster, exuberant corticospinal projections arising from the visual cortex never formed connections in the spinal cord and that specificity in corticospinal connectivity is achieved by selective growth of axon collaterals to their appropriate spinal targets, rather than by remodeling of exuberant terminal projections. In subprimates (Martin et al., 1982) and in human (Weidenheim et al., 1992), the corticospinal system develops later than other descending motor pathways originating in the brainstem. Because, from an evolutionary point of view, the brainstem systems are much “older” (see ten Donkelaar, 1982), it is possible that the relatively late maturation of the CM system may reflect, in part, the late appearance of this system in evolutionary history.
Anterograde labeling of corticospinal terminations by WGA-HRP
We have assumed that regions within the gray matter that were most heavily labeled with WGA-HRP corresponded to the regions of heaviest corticospinal termination. However, it is possible that some of this labeling consists of reaction product in fibers passing through the gray rather than terminating in it. For instance, fibers entering the gray matter through the lateral border of laminae V–VII could explain some of the reaction product found along the dorsal margin of the hand motor nuclei in the youngest cases (see Figs. 8, 9). In addition to these fibers of passage, reaction product could be associated with collaterals, preterminal arborizations, and terminations. Thus, increases in density of labeling within the hand motor nuclei could represent new fibers entering the region or growth of terminal arborization. Increases could also reflect aberrant projections, such as have been reported in subprimates (Cabana and Martin, 1985; Curfs et al., 1994), although we argue below that there is no convincing evidence for such projections in the postnatal primate.
Corticospinal projection from M1 to the motor nuclei innervating hand and finger muscles
These projections are considered to be of particular importance for the capacity to perform relatively independent finger movements (RIFM; see introductory remarks). In both the adult and the infant macaque, it is known that many of the CM projections to the cervical enlargement originate from M1 (Kuypers and Brinkman, 1970; Galea and Darian-Smith, 1995). Our results show that the projection to the hand motor nuclei is extremely sparse in the newborn monkey (Figs. 6, 7): such projections only reach the most dorsal hand motoneurons located in the most caudal segments (Th1) of the cervical enlargement (Stanfield and Asanuma, 1993). This particular finding, obtained using an anterograde labeling method, confirms that of Kuypers (1962) using the older degeneration technique. However, we have also observed that even in the neonate there are thin-labeled axons arising from the ventral tip of the lateral corticospinal tract and entering the dorsolateral motor nuclei directly, in a manner similar to that in the adult (see Fig. 8). In the neonate, we have also observed a very fine-grained labeling throughout the dorsolateral, but not in the ventral motor nuclei. These additional findings probably reflect the increased sensitivity of the WGA-HRP method to visualize thin fibers compared to the Nauta degeneration technique used by Kuypers (1962).
We have emphasized the much more protracted period of development of the corticospinal system than the 6–8 months suggested by previous investigations (Kuypers, 1962; Lawrence and Hopkins, 1976;Galea and Darian-Smith, 1995). Our data clearly show that an “adult-like” pattern of termination (Kuypers, 1962) is certainly not achieved by 8 months. Although it was only possible to study one case at each developmental age, all of the data points fit into a clear and continuous progression (Figs. 10, 11), and this gives greater confidence that each case contributed a representative insight into that particular stage of development. Each data point was itself derived from data gathered from 6–12 different sections from the specific segmental level in that case.
Our analysis has revealed a gradient of termination density within the hand motor nuclei that, perhaps surprisingly, runs from caudal to rostral. This gradient is maintained throughout development (Fig. 10) and persists into the adult. The projections to the more rostral segments also appear to infiltrate the motor nuclei more slowly than those lying more caudally (Fig. 11). This is in contrast to the retrograde labeling study of Galea and Darian-Smith (1995), who suggested a simultaneous innervation of all segments. Because the more caudal segments contain the densest aggregations of motoneurons supplying the intrinsic hand muscles (Jenny and Inukai, 1983), our result may reflect a preferential innervation of the intrinsic hand muscles, which are known to receive the strongest CM projection (seePorter and Lemon, 1993). It may also reflect changes in the size and orientation of motoneuron dendritic trees during the developmental period (Scheibel and Scheibel, 1970; Rose et al., 1995).
Corticospinal projections and cortico-motoneuronal function
Because our window of labeled corticospinal terminations covered a large range of densities (see Figs. 1, 2), including the very weakest labeling, it is perhaps not surprising that when calculating the proportion of the hand motor nuclei occupied by such labeling, we found that this measure saturated at a very early stage (already at 2.5 months in caudal Th1 and at 9 months more rostrally). In contrast, if we examine the area penetrated by the densest 40% of the projections, this measure did not saturate, even in the adult.
There are two reasons why it is probable that the distribution of these densest projections best correlates with the distribution of the CM projection. First, a rather sparse pattern of corticospinal projections to lamina IX has been described in a variety of subprimates such as the cat (Cheema et al., 1984), raccoon (Wirth et al., 1974), and rat (Liang et al., 1991), for which there is no good electrophysiological evidence of monosynaptic EPSPs, despite intensive investigation (Baldissera et al., 1981; Gugino et al., 1990; Babalian et al., 1993). A much stronger projection appears to underpin the large, fast-rising EPSPs characteristic of the CM system of Old World primates (Kuypers, 1981;Olivier et al., 1996). Second, in the adult, the distribution of the densest 40% of labeling, rather than that of all labeling, appears to fit best with the known variations in CM input to different motor nuclei: it is strongest to the caudally located intrinsic hand muscles and weakest to the more medial and ventral motoneuron pools innervating more proximal muscles (see above).
It is well known that the dendritic trees of spinal motoneurons extend well beyond the limits of lamina IX. In theory, corticospinal projections terminating outside lamina IX (i.e., in the adjacent intermediate zone) could also have direct CM terminations (see Porter and Lemon, 1993). However, it is not known whether there are any corticospinal terminations on these distal dendrites. In species such as the cat, where there are dense projections to the intermediate zone, but no CM connections, the corticospinal fibers must in some way avoid the distal dendrites of motoneurons. Morphometric analysis of motoneuron dendritic structure has not revealed any preferential orientation of the dendrites toward the intermediate zone, although there is a slight tendency, in some motoneurons, for the dendrites to be orientated in the rostro-caudal direction (Ulfhake et al., 1988). Interestingly, the collaterals of a small sample of single CM axons labeled intra-axonally by Lawrence et al. (1985) showed a clear rostro-caudal organization, presumably paralleling the columns of target motoneurons they innervate. Few of these collaterals were distributed outside lamina IX.
If this analysis is correct, our data would suggest that it is not until 2.5 months that functional CM connections are present to any significant extent: by this stage, between 23.7 and 51.7% of the hand motor nuclei in C8 and Th1 receive dense corticospinal projections. At 1 month, only the caudal Th1 segment (which contains the smallest number of motoneurons; Fig. 3) receives a comparable proportion (40.4%, still very low compared with the adult value of 80.9%).
Lack of aberrant corticospinal projections from M1 in the postnatal period
We could find no evidence for any aberrant projections in the neonatal case or in any of the other infant cases. In other words, all of the corticospinal projections that we observed were found in those regions of the spinal gray matter in which they are found in the mature adult. We did not observe, for example, any aberrant projections to the ipsilateral gray matter, such as were reported in the kitten (Theriault and Tatton, 1989; Alisky et al., 1992); nor did we observe any early innervation of the more ventral motoneurons, which might subsequently have been withdrawn. Other postnatal studies in monkeys have also failed to find any evidence for exuberant or aberrant projections (Kuypers, 1962; Biber et al., 1978; Sloper et al., 1983).
However, the lack of aberrant connections may simply reflect the relatively advanced stage of the primate CNS at birth (Passingham, 1985). Galea and Darian-Smith (1995) injected different types of fluorescent retrograde tracers into the spinal cord of young macaque monkeys, including several premature cases. Their results showed that the pattern of corticospinal projections from the different cortical regions in the newborn and adult macaque was “strikingly similar.” However, in infants up to 3 months of age, they did find exuberant projections from cortical areas that skirted those giving rise to the projection in the adult. These areas included extensive regions of the cingulate gyrus, prefrontal cortex (area 12), lateral premotor cortex, and peri-insular and intraparietal cortex. Thus, we cannot be sure that injection of these exuberant areas might reveal aberrant corticospinal projections.
Galea and Darian-Smith (1995) also reported a much larger relative number (300%) of corticospinal neurons late in the neonate than in adulthood, favoring the idea that many of the neurons labeled from the cord in the infant cases withdrew their corticospinal axon collaterals during development. These findings are in keeping with observations made in the neonatal rodent CNS (see O’Leary, 1992), although in this case the exuberance of the projections is far more marked, with corticospinal projections extending all the way from the frontal to the occipital pole (D’Amato and Hicks, 1978). Similar results have been observed in other subprimates (see, for example, Kalil, 1985; Stanfield and O’Leary, 1985) (for review, see Armand et al., 1996). Any exuberance in the numbers or density of corticospinal neurons in the neonatal monkey does not appear to produce heavier anterograde labeling than at later ages; in fact, quite the reverse is true (see Fig. 6). Furthermore, transient corticospinal neurons and/or transient spinal axonal collaterals of neurons projecting in the adult at supraspinal levels did not appear to distribute terminals in regions of the gray matter other than those found in the adult (Galea and Darian-Smith, 1995). Up to 3 months of age, cortical neurons could be retrogradely labeled only by tracer injections in the spinal intermediate zone, and not within the dorsal or ventral horns.
CONCLUSION
Our findings suggest that there are major and protracted postnatal changes in the influence over spinal mechanisms that the primary motor cortex exerts through its corticospinal projections. This is particularly true for the motoneurons controlling hand and finger muscles. These anatomical results are consistent with our neurophysiological observations [see companion paper (Olivier et al., 1997)]: if cortico-motoneuronal projections are present in the newborn infant, we can conclude that their influence is likely to be very weak relative to the adult.
Footnotes
This work was supported by the Wellcome Trust, Brain Research Trust, Action Research, and a Royal Society–Centre National de la Recherche Scientifique exchange grant. We acknowledge the expert assistance of Rosalyn Cummings, Nora Philbin, Michael Simpson, John Bashford, Jeremy Skepper, Natalia Ognjenovic, and Chris Seers.
Correspondence should be addressed to Prof. Roger Lemon, Sobell Department of Neurophysiology, Institute of Neurology, Queen Square, London WC1N 3BG, UK.
Dr. Olivier’s present address: NEFY 5449, Laboratory of Neurophysiology, University of Louvain, Avenue Hippocrate 54, B-1200 Brussels, Belgium.
REFERENCES
- 1.Alisky JM, Swink TD, Tolbert DL. The postnatal spatial and temporal development of corticospinal projections in the cat. Exp Brain Res. 1992;88:265–276. doi: 10.1007/BF02259101. [DOI] [PubMed] [Google Scholar]
- 2.Armand J, Holstege G, Kuypers HGJM. Differential corticospinal projections in the cat: an autoradiographic tracing study. Brain Res. 1985;343:351–355. doi: 10.1016/0006-8993(85)90754-1. [DOI] [PubMed] [Google Scholar]
- 3.Armand J, Edgley SA, Lemon RN, Olivier E. Protracted postnatal development of corticospinal projections from the primary motor cortex to hand motoneurones in the macaque monkey. Exp Brain Res. 1994;101:178–182. doi: 10.1007/BF00243230. [DOI] [PubMed] [Google Scholar]
- 4.Armand J, Olivier E, Edgley S, Lemon RN. The structure and function of the developing corticospinal tract: some key issues. In: Wing AH, Haggard P, Flanagan JR, editors. Hand and brain. The neurophysiology and psychology of hand movements. Academic; San Diego: 1996. pp. 125–145. [Google Scholar]
- 5.Babalian A, Liang F, Rouiller EM. Cortical influences on cervical motoneurons in the rat: recordings of synaptic responses from motoneurons and compound action potential from corticospinal axons. J Neurosci Res. 1993;16:301–310. doi: 10.1016/0168-0102(93)90041-n. [DOI] [PubMed] [Google Scholar]
- 6.Baldissera F, Hultborn H, Illert M. Integration in spinal neuronal systems. In: Brookhart JB, Mountcastle VB, editors. Handbook of physiology—the nervous system II. American Physiological Society; Bethesda, MD: 1981. pp. 509–595. [Google Scholar]
- 7.Bennett KMB, Lemon RN. Corticomotoneuronal contribution to the fractionation of muscle activity during precision grip in the monkey. J Neurophysiol. 1996;75:1826–1842. doi: 10.1152/jn.1996.75.5.1826. [DOI] [PubMed] [Google Scholar]
- 8.Biber MP, Kneisley LW, LaVail JH. Cortical neurons projecting to the cervical and lumbar enlargements of the spinal cord in young and adult monkeys. Exp Neurol. 1978;59:492–508. doi: 10.1016/0014-4886(78)90240-6. [DOI] [PubMed] [Google Scholar]
- 9.Bortoff GA, Strick PL. Corticospinal terminations in two New World primates: further evidence that corticomotoneuronal connections provide part of the neural substrate for manual dexterity. J Neurosci. 1993;13:5105–5118. doi: 10.1523/JNEUROSCI.13-12-05105.1993. [DOI] [PMC free article] [PubMed] [Google Scholar]
- 10.Cabana T, Martin GF. Corticospinal development in the North American opossum: evidence for a sequence in the growth of cortical axons in the spinal cord and for transient projections. Dev Brain Res. 1985;23:69–80. doi: 10.1016/0165-3806(85)90007-0. [DOI] [PubMed] [Google Scholar]
- 11.Cheema SS, Rustioni A, Whitsel BL. Light and electron microscopic evidence for a direct corticospinal projection to superficial laminae of the dorsal horn in cats and monkeys. J Comp Neurol. 1984;225:276–290. doi: 10.1002/cne.902250211. [DOI] [PubMed] [Google Scholar]
- 12.Colebatch JG, Gandevia SC. The distribution of muscular weakness in upper motor neuron lesions affecting the arm. Brain. 1989;112:749–763. doi: 10.1093/brain/112.3.749. [DOI] [PubMed] [Google Scholar]
- 13.Curfs MHJM, Gribnau AAM, Dederen PJWC. Selective elimination of transient corticospinal projections in the rat cervical spinal cord gray matter. Dev Brain Res. 1995;78:182–190. doi: 10.1016/0165-3806(94)90025-6. [DOI] [PubMed] [Google Scholar]
- 14.D’Amato CJ, Hicks SP. Normal development and post-traumatic plasticity of corticospinal neurons in rats. Exp Neurol. 1978;60:557–569. doi: 10.1016/0014-4886(78)90010-9. [DOI] [PubMed] [Google Scholar]
- 15.Dum RP, Strick PL. The origin of corticospinal projections from the premotor areas in the frontal lobe. J Neurosci. 1991;11:667–689. doi: 10.1523/JNEUROSCI.11-03-00667.1991. [DOI] [PMC free article] [PubMed] [Google Scholar]
- 16.Flament D, Hall EJ, Lemon RN. The development of cortico-motoneuronal projections investigated using magnetic brain stimulation in the infant macaque. J Physiol (Lond) 1992;447:755–768. doi: 10.1113/jphysiol.1992.sp019027. [DOI] [PMC free article] [PubMed] [Google Scholar]
- 17.Galea MP, Darian-Smith I. Postnatal maturation of the direct corticospinal projections in the macaque monkey. Cereb Cortex. 1995;5:518–540. doi: 10.1093/cercor/5.6.518. [DOI] [PubMed] [Google Scholar]
- 18.Gugino LD, Rowinski MJ, Stoney SD. Motor outflow to cervical motoneurons from raccoon motorsensory cortex. Brain Res Bull. 1990;24:833–837. doi: 10.1016/0361-9230(90)90147-r. [DOI] [PubMed] [Google Scholar]
- 19.Heffner RS, Masterton RB. The role of the corticospinal tract in the evolution of human digital dexterity. Brain Behav Evol. 1983;23:165–183. doi: 10.1159/000121494. [DOI] [PubMed] [Google Scholar]
- 20.Innocenti GM, Fiore I, Caminiti R. Exuberant projection into the corpus callosum from the visual cortex of newborn cats. Neurosci Lett. 1977;4:237–242. doi: 10.1016/0304-3940(77)90185-9. [DOI] [PubMed] [Google Scholar]
- 21.Jenny AB, Inukai J. Principles of motor organization of the monkey cervical spinal cord. J Neurosci. 1983;3:567–575. doi: 10.1523/JNEUROSCI.03-03-00567.1983. [DOI] [PMC free article] [PubMed] [Google Scholar]
- 22.Jones EG, Porter R. What is area 3a? Brain Res Rev. 1980;2:1–43. doi: 10.1016/0165-0173(80)90002-8. [DOI] [PubMed] [Google Scholar]
- 23.Jones EG, Coulter JD, Hendry SHC. Intracortical connectivity of architectonic fields in the somatic sensory motor and parietal cortex in monkeys. J Comp Neurol. 1978;181:291–348. doi: 10.1002/cne.901810206. [DOI] [PubMed] [Google Scholar]
- 24.Kalil K. Development, organization and processing in somatosensory pathways, pp 87–96. Liss; New York: 1985. Development and plasticity of the sensorimotor cortex and pyramidal tract. [Google Scholar]
- 25.Kuang RZ, Kalil K. Development of specificity in corticospinal connections by axon collaterals branching selectively into appropriate spinal targets. J Comp Neurol. 1994;344:270–282. doi: 10.1002/cne.903440208. [DOI] [PubMed] [Google Scholar]
- 26.Kuypers HGJM. Corticospinal connections: postnatal development in the rhesus monkey. Science. 1962;138:678–680. doi: 10.1126/science.138.3541.678. [DOI] [PubMed] [Google Scholar]
- 27.Kuypers HGJM. Anatomy of the descending pathways. In: Brookhart JM, Mountcastle VB, editors. Handbook of physiology—the nervous system II. American Physiological Society; Bethesda, MD: 1981. pp. 597–666. [Google Scholar]
- 28.Kuypers HGJM, Brinkman J. Precentral projections to different parts of the spinal intermediate zone in the rhesus monkey. Brain Res. 1970;24:29–48. doi: 10.1016/0006-8993(70)90272-6. [DOI] [PubMed] [Google Scholar]
- 29.Kuypers HGJM, Tuerk JD. The distribution of the cortical fibers within the nuclei cuneatus and gracilis in the cat. J Anat. 1964;98:143–162. [PMC free article] [PubMed] [Google Scholar]
- 30.Lawrence DG, Hopkins DA. The development of motor control in the rhesus monkey: evidence concerning the role of corticomotoneuronal connections. Brain. 1976;99:235–254. doi: 10.1093/brain/99.2.235. [DOI] [PubMed] [Google Scholar]
- 31.Lawrence DG, Kuypers HGJM. The functional organization of the motor system in the monkey. I. The effects of bilateral pyramidal lesions. Brain. 1968;91:1–14. doi: 10.1093/brain/91.1.1. [DOI] [PubMed] [Google Scholar]
- 32.Lawrence DG, Porter R, Redman SJ. Corticomotoneuronal synapses in the monkey: light microscopic localization upon motoneurons of intrinsic muscles of the hand. J Comp Neurol. 1985;232:499–510. doi: 10.1002/cne.902320407. [DOI] [PubMed] [Google Scholar]
- 33.Lemon RN. Cortical control of the primate hand. Exp Physiol. 1993;78:263–301. doi: 10.1113/expphysiol.1993.sp003686. [DOI] [PubMed] [Google Scholar]
- 34.Lemon RN, Mantel GWH, Muir RB. Corticospinal facilitation of hand muscles during voluntary movement in the conscious monkey. J Physiol (Lond) 1986;381:497–527. doi: 10.1113/jphysiol.1986.sp016341. [DOI] [PMC free article] [PubMed] [Google Scholar]
- 35.Liang F, Moret M, Wiesendanger M, Rouiller EM. Corticomotoneuronal connections in the rat: evidence from double-labeling of motoneurons and corticospinal axon arborizations. J Comp Neurol. 1991;311:356–366. doi: 10.1002/cne.903110306. [DOI] [PubMed] [Google Scholar]
- 36.Martin GF, Cabana T, DiTirro FJ, Ho RH, Humbertson AO. The development of descending spinal connections: studies using the North American opossum. In: Kuypers HGJM, Martin GF, editors. Anatomy of descending pathways to the spinal cord, Vol 57. Elsevier; Amsterdam: 1982. pp. 131–144. [DOI] [PubMed] [Google Scholar]
- 37.Matsumura M, Sawaguchi T, Oishi T, Ueki K, Kubota K. Behavioral deficits induced by local injection of bicuculline and muscimol into the primate motor and premotor cortex. J Neurophysiol. 1991;65:1542–1553. doi: 10.1152/jn.1991.65.6.1542. [DOI] [PubMed] [Google Scholar]
- 38.Mesulam M-M. Principles of horseradish peroxidase neurohistochemistry and their applications for tracing neural pathways: axonal transport, enzyme histochemistry and light microscopic analysis. In: Mesulam M-M, editor. Tracing neural connections with horseradish peroxidase. Wiley; Chichester, UK: 1982. pp. 1–151. [Google Scholar]
- 39.Muir RB, Lemon RN. Corticospinal neurons with a special role in precision grip. Brain Res. 1983;261:312–316. doi: 10.1016/0006-8993(83)90635-2. [DOI] [PubMed] [Google Scholar]
- 40.O’Leary DDM. Development of connectional diversity and specificity in the mammalian brain by the processing of collateral projections. Curr Opin Neurobiol. 1992;2:70–77. doi: 10.1016/0959-4388(92)90165-h. [DOI] [PubMed] [Google Scholar]
- 41.Olivier E, Maier MA, Baker SN, Philbin N, Morris T, Lemon RN. Electrophysiological evidence for direct corticomotoneuronal (CM) connections in the squirrel monkey (Saimiri sciureus). J Physiol (Lond) 1996;494:64. [Google Scholar]
- 42.Olivier E, Edgley SA, Armand J, Lemon RN. An electrophysiological study of the postnatal development of the corticospinal system in the macaque monkey. J Neurosci. 1997;17:267–276. doi: 10.1523/JNEUROSCI.17-01-00267.1997. [DOI] [PMC free article] [PubMed] [Google Scholar]
- 43.Palmer E, Ashby P. Corticospinal projections to upper limb motoneurones in humans. J Physiol (Lond) 1992;448:397–412. doi: 10.1113/jphysiol.1992.sp019048. [DOI] [PMC free article] [PubMed] [Google Scholar]
- 44.Passingham RE. Rates of brain development in mammals including man. Brain Behav Evol. 1985;26:167–175. doi: 10.1159/000118773. [DOI] [PubMed] [Google Scholar]
- 45.Phillips CG. Proceedings of the 3rd International Congress of Primatology, pp 2–23. Karger; Zurich: 1971. Evolution of the corticospinal tract in primates with special reference to the hand. [Google Scholar]
- 46.Porter R, Lemon RN. Corticospinal function and voluntary movement, pp 186–193, 122–125. Oxford UP; New York: 1993. [Google Scholar]
- 47.Rose PK, Jones T, Nirula R, Corneil T. Innervation of motoneurons based on dendritic orientation. J Neurophysiol. 1995;73:1319–1322. doi: 10.1152/jn.1995.73.3.1319. [DOI] [PubMed] [Google Scholar]
- 48.Satomi H, Takahashi K, Kosaka I, Aoki M. Reappraisal of projection levels of the cortico-spinal fibers in the cat, with special reference to the fibers descending through the dorsal funiculus: a WGA-HRP study. Brain Res. 1989;492:255–260. doi: 10.1016/0006-8993(89)90908-6. [DOI] [PubMed] [Google Scholar]
- 49.Satomi H, Takahashi K, Mizuguchi A, Aoki M. An observation on hitherto unknown corticospinal fibers that descend between the tractus corticospinalis lateralis and ventralis in the cat. Neurosci Lett. 1991;129:168–172. doi: 10.1016/0304-3940(91)90453-z. [DOI] [PubMed] [Google Scholar]
- 50.Scheibel ME, Scheibel AB. Developmental relationship between spinal motoneuron dendrite bundle and patterned activity in the hind limb of cats. Exp Neurol. 1970;29:328–335. doi: 10.1016/0014-4886(70)90062-2. [DOI] [PubMed] [Google Scholar]
- 51.Sessle BJ, Wiesendanger M. Structural and functional definition of the motor cortex in the monkey (Macaca fascicularis). J Physiol (Lond) 1982;323:245–265. doi: 10.1113/jphysiol.1982.sp014071. [DOI] [PMC free article] [PubMed] [Google Scholar]
- 52.Sherrington CS. Experiments in examination of the peripheral distribution of the fibres of the posterior roots of some spinal nerves. Philos Trans R Soc [Biol] 1898;190:45–186. [Google Scholar]
- 53.Sloper J, Brodal P, Powell TPS. An anatomical study of the effects of unilateral removal of sensorimotor cortex in infant monkeys on the subcortical projections of the contralateral sensorimotor cortex. Brain. 1983;106:707–716. doi: 10.1093/brain/106.3.707. [DOI] [PubMed] [Google Scholar]
- 54.Stanfield BB, Asanuma C. The distribution of corticospinal axons within the spinal gray of infant rhesus monkeys. Soc Neurosci Abstr. 1993;19:673. [Google Scholar]
- 55.Stanfield BB, O’Leary DDM. The transient corticospinal projection from the occipital cortex during the postnatal development of the rat. J Comp Neurol. 1985;238:236–248. doi: 10.1002/cne.902380210. [DOI] [PubMed] [Google Scholar]
- 56.ten Donkelaar JJ. Organization of descending pathways to the spinal cord in amphibians and reptiles. In: Kuypers HGJM, Martin GF, editors. Anatomy of descending pathways to the spinal cord, Vol 57. Elsevier; Amsterdam: 1982. pp. 25–26. [DOI] [PubMed] [Google Scholar]
- 57.Theriault E, Tatton WG. Postnatal redistribution of pericruciate motor cortical projections within the kitten spinal cord. Dev Brain Res. 1989;45:219–237. doi: 10.1016/0165-3806(89)90041-2. [DOI] [PubMed] [Google Scholar]
- 58.Tigges J, Nakagawa S, Tigges M. Efferents of area 4 in a South American monkey (Saimiri). I. Terminations in the spinal cord. Brain Res. 1979;171:1–11. doi: 10.1016/0006-8993(79)90727-3. [DOI] [PubMed] [Google Scholar]
- 59.Ulfhake B, Cullheim S, Franson P. Postnatal development of cat hind limb motoneurons. I. Changes in length, branching structure, and spatial distribution of dendrites of cat triceps surae motoneurons. J Comp Neurol. 1988;278:69–87. doi: 10.1002/cne.902780105. [DOI] [PubMed] [Google Scholar]
- 60.Weidenheim KM, Kress Y, Isaak Epshteyn MS, Rashbaum WK, Lyman WD. Early myelination in the human fetal lumbosacral spinal cord: characterization by light and electron microscopy. J Neuropathol Exp Neurol. 1992;51:142–149. doi: 10.1097/00005072-199203000-00004. [DOI] [PubMed] [Google Scholar]
- 61.Weinberg RJ, Van Eyck SL. A tetramethylbenzidine/tungstate reaction for horseradish peroxidase histochemistry. J Histochem Cytochem. 1991;39:1143–1148. doi: 10.1177/39.8.1906909. [DOI] [PubMed] [Google Scholar]
- 62.Wirth FP, O’Leary JL, Smith JM, Jenny AB. Monosynaptic corticospinal-motoneuron path in the raccoon. Brain Res. 1974;77:344–348. doi: 10.1016/0006-8993(74)90799-9. [DOI] [PubMed] [Google Scholar]