

Abstract
Several genes have been implicated in the pathogenesis of early-onset familial Alzheimer’s disease. A majority of the autosomal dominant cases are linked to recently identified mutations in the presenilin-1 gene on chromosome 14. The native presenilin-1 protein in primates has not been well characterized, and its precise localization is unknown. We have studied the native presenilin-1 protein in monkey brain and peripheral tissues by using a monoclonal antibody specific for the N-terminal domain of human presenilin-1. Western blots detect polypeptide species of ∼49 and ∼32 kDa from COS-7 and PC12 cells transfected with full-length human presenilin-1 cDNA and from in vitro translations of the normal human presenilin-1 mRNA. A 32 kDa polypeptide is detected in monkey peripheral tissues, with the highest expression in testis and lung. In all brain regions the 32 kDa band is the predominant form of presenilin-1, and it is found in particulate subfractions. Light microscopic immunocytochemistry reveals presenilin-1 staining in all brain regions, with the strongest labeling in neurons and neuropil. In addition, weaker immunoreactivity is also present in glia and blood vessels. Neuronal staining shows significant variability, with particularly intense labeling of certain cell types, including large neocortical and hippocampal pyramidal neurons, magnocellular basal forebrain neurons, brainstem motoneurons, and some populations of interneurons. By electron microscopic immunocytochemistry, highly selective presenilin-1 staining is seen on the cytoplasmic surfaces of membranous organelles, which suggest localization to the endoplasmic reticulum–Golgi intermediate compartment, a subdomain of the endoplasmic reticulum, and some coated transport vesicles.
Keywords: presenilin, Alzheimer’s disease, immunocytochemistry, electron microscopy, endoplasmic reticulum, intermediate compartment, transport vesicles, coated vesicles, monoclonal antibody
Alzheimer’s disease (AD) is a common and devastating neurodegenerative disorder that causes progressive cognitive and behavioral deterioration. The disease is genetically heterogeneous, and the study of several autosomal dominant familial AD (FAD) variants has led to identification of three genes that carry pathogenic mutations. The amyloid precursor protein (APP) gene is linked to chromosome 21-linked FAD (Chartier-Harlin et al., 1991; Goate et al., 1991; Murrell et al., 1991), and recently the genes associated with chromosome 14- and chromosome 1-linked FAD have been identified (Levy-Lahad et al., 1995; Rogaev et al., 1995; Sherrington et al., 1995). Presenilin-1 (PS1) and presenilin-2 (PS2) are highly homologous genes (67% amino acid identity; Levy-Lahad et al., 1995; Rogaev et al., 1995) that encode a novel family of membrane-associated proteins.
Northern blot and in situ hybridization studies of presenilin mRNAs show widespread expression in brain and peripheral tissues of both humans and rodents (Rogaev et al., 1995; Sherrington et al., 1995; Kovacs et al., 1996; Suzuki et al., 1996). Recent studies of PS1 protein have revealed endoproteolytic cleavage resulting in N- and C-terminal fragments of ∼27 and ∼17 kDa, respectively (Thinakaran et al., 1996). Moreover, mutations in PS1 seem to alter the endoproteolytic processing, leading to an abnormal accumulation of the full-length protein (Mercken et al., 1996; Thinakaran et al., 1996). The light microscopic distribution of native PS1 in mouse brain (Elder et al., 1996; Moussaoui et al., 1996) and the localization of epitope-tagged presenilins in transfected cells (Kovacs et al., 1996) have been reported. However, little is known about the presenilin proteins in primates. Given the species selectivity of AD pathology, a detailed examination of the native proteins in primate brain, including precise subcellular localization, is critical for providing insights into normal presenilin functions and their role in AD.
To facilitate our study of PS1, we have generated a monoclonal antibody specific for the N terminus of human PS1. This antibody has been used to characterize PS1 in human brain and in cases of familial and sporadic AD in which the protein is localized to neurofibrillary tangles and senile plaques (Levey et al., 1997). Here, we report on the characterization of the antibody and its use in examining the native PS1 protein in normal nonhuman primate brain and peripheral tissues. By Western blotting, PS1 is detected in a variety of tissues and brain regions as a membrane-associated polypeptide that migrates with an approximate Mr of 32 kDa. Light microscopic immunocytochemistry confirms widespread neuronal localization of PS1. However, our analysis also reveals a broader distribution, which includes non-neuronal elements in brain. Extension of these studies to the ultrastructural localization of PS1 demonstrates the presence of highly selective labeling on the cytoplasmic surface of a population of coated vesicles and a smooth endoplasmic reticulum (SER)-like compartment. Moreover, the distribution in neuronal cell bodies suggests localization to the ER–Golgi intermediate compartment. These findings have a number of implications for PS1 function.
MATERIALS AND METHODS
Isolation of presenilin cDNAs. PS1 and PS2 were cloned from a human amygdala cDNA library (Clontech, Palo Alto, CA) by PCR. Oligonucleotides were designed to be specific for either PS1 or PS2 and contained a unique restriction site to facilitate subcloning. The sequences of the oligonucleotide primers were ggcggggaagcttatatacctaat and cgggaatctagactttgttag or accaagtgtccgggatccagacctctctgcggc and caatgaaaattccctcgagcttgcagcctgtggcac for PS1 or PS2, respectively. The resulting fragments were subcloned independently into pCDNA3 (Invitrogen, San Diego, CA), and the sequences were verified by dideoxy sequencing (Sequenase, Amersham, Arlington Heights, IL). The PS1 clone contains all known exons (Clark et al., 1995) and codes for a full-length protein of 467 amino acids. Our full-length PS2 clone contains 50 base pairs of 5′ untranslated and 30 base pairs of 3′ untranslated sequence, and it is predicted to encode a protein of 448 amino acids.
Bacterial expression of presenilin fusion proteins. Fusion proteins were generated for use in antibody production and characterization of antibody specificity. Two constructs were made encoding glutathione S-transferase (GST) fused to overlapping regions of the N terminus of PS1 (amino acids 2–70 and 21–80, respectively) by subcloning PCR fragments into pGEX-2T (Pharmacia, Piscataway, NJ). The PCR fragments were obtained by amplifying the corresponding regions of human PS1 cDNA with the introduction of in-frame BamHI and EcoRI sites and stop codons. The oligonucleotides used were PS12–70: gttgctccaggatccgagttacctgcaccgttgtcc and ttaattgaattcctaatcttcttcctcatcttgctcc; PS121–80: ttaattggatcccacctgagcaatactgtacg and gagcatgaattcctacttggcgccatatttcaatgt. The N-terminal region of PS2 (amino acids 1–76) (Levy-Lahad et al., 1995) was used to produce another fusion protein for evaluation of specificity of PS1 antibodies. This region was amplified from the PS2 full-length clone by PCR with specific oligonucleotides (tccagaggcggatccatgctcacattcatggcctct and gtatttgaggaattctcattcctccaggcctggcggccg) that again introducedBamHI and EcoRI sites at the 5′ and 3′ ends, respectively. The recombinant proteins GST–PS12–70, GST–PS121–80, and GST–PS21–76 were expressed in Escherichia coli strain BL21(DE3)pLysS and purified by affinity chromatography with glutathione agarose, using methods previously described (Smith and Johnson, 1988; Levey et al., 1991).
Monoclonal antibody production. A hybridoma cell line was generated that secretes a monoclonal antibody reactive with the N terminus of human PS1. Briefly, a female Sprague Dawley rat was immunized over a 4 month period with repeated intradermal and intraperitoneal injections of GST–PS121–80 fusion protein (100 μg). Three days after a final intravenous boost, the spleen was harvested and lymphoid cells were isolated by centrifugation via Ficoll-Hypaque (Pharmacia). The rat spleen cells were fused with the murine nonsecreting myeloma cell line Sp2/0 at a 2:1 ratio, using 50% polyethylene glycol 1500, and then plated in selection media (DMEM, 20% fetal bovine serum, 2 mml-glutamine, 50 U/ml penicillin, 50 μg/ml streptomycin, 0.1 mmhypoxanthine, 0.0004 mm aminopterin, and 0.016 mm thymidine) at a final concentration of 500,000 cells/ml in 96-well microtiter plates. Hybridomas were screened by immunoblotting with GST and GST–PS121–80. A single hybridoma cell line was isolated after repeated cloning at limiting dilutions. Culture supernatants were concentrated 20- to 30-fold by ammonium sulfate precipitation and dialyzed into PBS.
Transfection of mammalian cells. African green monkey kidney COS-7 and rat adrenal pheochromocytoma PC12 cells were transiently or stably transfected with PS1 cDNA cloned behind the cytomegalovirus (CMV) promoter in pCDNA3. Briefly, the cells were plated onto 10 cm dishes at a density of 10,000/cm2 (COS-7) or 50,000/cm2 (PC12) and grown in a 37°C incubator with 5% carbon dioxide. After 24 hr, 20 μg of plasmid DNA was added to each plate in a 1 ml solution of (in mm): 25 BES, 140 sodium chloride, 0.750 sodium phosphate, and 125 calcium chloride, pH 6.95; then the cells were returned to a 37°C incubator with 3% carbon dioxide for an additional 18–24 hr. The media were replaced with fresh growth media and returned to 5% carbon dioxide. COS-7 cells transiently expressing PS1 were grown for 48 hr and harvested for Western blot analysis. Stable PC12 transfectants were selected with 400 μg/ml Geneticin (Life Technologies, Gaithersburg, MD), and single colonies were isolated. Clonal cell lines were established by limiting dilution cloning to ensure growth from an individual cell.
In vitro translation. Translation of both PS1 and PS2 RNA was performed in vitro with rabbit reticulocyte lysates (Promega, Madison, WI). Briefly, RNA transcripts of both PS1 and PS2 were made by runoff transcription (mCAP RNA capping kit, Stratagene, La Jolla, CA) as per the manufacturer’s protocol and translated with or without canine pancreatic microsomal membranes. Reactions were in a total volume of 25 μl and provided sufficient protein so that 2 μl was suitable for use in Western blotting experiments.
Western blotting. Western blotting studies were performed to assess antibody specificity and presenilin expression. Preparations of PC12 cells, COS-7 cells, in vitro translation products, and brain tissues were denatured in SDS loading buffer. Samples were separated by SDS-polyacrylamide gel electrophoresis (SDS-PAGE with 12% acrylamide) and transferred to polyvinylidene fluoride membranes (Immobilon P, Millipore, Bedford, MA) electrophoretically. The blots were blocked (30 min) in 5% nonfat dried milk, 0.1% Tween-20, and 20 mm Tris-saline, pH 7.4, at room temperature and incubated overnight at 4°C with primary antibody [PS1 N-terminus monoclonal 1:500; anti-synaptophysin monoclonal 1:200,000 (SY38, Pierce, Rockford, IL)]. Then they were rinsed several times and incubated for 1 hr with horseradish peroxidase-conjugated goat anti-mouse IgG (1:10,000 in blocking buffer); immunoreactive proteins were visualized by enhanced chemiluminescence (ECL, Amersham). When needed for reprobing, blots were stripped by incubating in SDS buffer (2% SDS, 100 mmβ-mercaptoethanol, and 62.5 mm Tris-HCl, pH 6.8) for 30 min at 75°C. For controls, PS1 antibody was preincubated for 1 hr at room temperature with 100 μg/ml GST–PS121–80 fusion protein. The preadsorbed antibody was used at a final dilution of 1:500.
Tissue fractionation. A technique for subcellular fractionation of brain tissue was adapted from a method for synaptosome purification (Gray and Whittaker, 1962). Fresh tissue was homogenized on ice in a solution of 0.32 m sucrose, 10 mmTris, pH 8.0, 1 μg/ml aprotinin, 1 μg/ml leupeptin, and 1 μg/ml pepstatin A in a Wheaton glass tissue grinder. The crude nuclear pellet was centrifuged at 1000 × g for 10 min. A washed nuclear pellet, P1, was obtained by resuspension and centrifugation of the crude pellet in 0.32 m sucrose buffer. The supernatant, S1, was transferred to a fresh tube and centrifuged at 10,000 × g for 20 min to obtain a crude P2 pellet and a S2 fraction. The crude P2 pellet was washed three times by resuspension and centrifugation. The washed P2 was resuspended in 0.32 m sucrose solution and layered on a step gradient containing 1.2 and 0.8 m sucrose. The gradient was centrifuged for 3 hr at 53,000 × g at 4°C in a Beckman ultracentrifuge. Fraction P2–0.32 m, containing predominantly small myelin fragments, was collected from the 0.32–0.80m sucrose interface. Fraction P2–0.80 m, enriched in synaptosomes, was collected from the 0.8–1.2 msucrose interface. Fraction P2–1.20 m, containing mitochondria and lysosomes, pelleted through the densest layer of the gradient. P2–0.32 m, P2–0.80 m, and P3 fractions were pelleted by 100,000 × g centrifugation of P2–0.32 m, P2–0.80 m, and S2 fractions, respectively, for 1 hr in 0.32 m sucrose. The P3 pellet contained microsomal membranes, and the S3 fraction consisted mainly of ribosomes and soluble proteins (Gray and Whittaker, 1962).
Immunocytochemistry. Rhesus monkeys (n = 4), weighing 5–11 kg, were perfused with 3 or 4% paraformaldehyde, combined in one case with 0.05% glutaraldehyde. These and all other animals used in this study were maintained in accordance with United States Public Health Service and National Institutes of Health guidelines for the care and use of laboratory animals. For light microscopy, blocks were frozen on dry ice and sectioned at 40 μm on a freezing microtome. For electron microscopy, blocks of forebrain, motor cortex, hippocampus, and cerebellum were sectioned at 40 μm on a vibratome (Technical Products International, St. Louis, MO). Immunocytochemical processing was performed with free-floating sections and immunoperoxidase methods previously described (Levey et al., 1991). The monoclonal antibody to PS1 was used at 1:100–500 dilution from concentrated culture supernatants. Control sections were processed in parallel, in which the primary antibody was either omitted or preadsorbed with the GST–PS121–80 fusion protein (100 μg/ml); preadsorption with the GST carrier protein (100 μg/ml) alone had no effect on staining. Biotinylated goat anti-rat IgG (1:200 dilution; Vector Labs, Burlingame, CA) and avidin-biotinylated horseradish peroxidase complex (Vectastain Elite, Vector Labs) were used to localize the primary antibody. Immunoreactivity was visualized with 0.05% 3,3′-diaminobenzidine tetrahydrochloride (DAB) and 0.01% H2O2 in 50 mm Tris, pH 7.6. Sections for light microscopy were slide-mounted, air-dried, dehydrated through a graded alcohol series and xylene, and, finally, coverslipped for microscopic examination. Sections for electron microscopic immunocytochemistry were post-fixed in 1% osmium tetroxide, stained with 2% uranyl acetate, dehydrated through graded alcohol and propylene oxide, and embedded in Eponate 12 resin. Ultrathin sections were cut on a Reichert Ultracut S ultramicrotome (Leica, Deerfield, IL) and collected on mesh copper grids for examination on a JEOL JEM-100C transmission electron microscope.
RESULTS
Specificity of a monoclonal antibody to the N terminus of PS1
To characterize the native PS1 protein, we developed a rat monoclonal antibody raised against a fusion protein antigen containing a divergent hydrophilic region of the N terminus (GST–PS121–80) of human PS1 (Sherrington et al., 1995). On Western blots, the antibody reacted strongly with the antigen and another overlapping fusion protein containing amino acids 2–70 of PS1 (GST–PS12–70), indicating that the recognized epitope lies between residues 21–70 (Fig.1A). As expected, given the divergence in this region of the presenilins (∼20% identity), the antibody showed no detectable cross-reactivity with the N terminus of PS2 (GST–PS21–76).
Fig. 1.

Characterization of anti-human PS1 monoclonal antibody by Western blot analysis. A, Purified samples (∼20 ng) of glutathione S-transferase (GST), two GST–PS1 fusion proteins, and a GST–PS2 fusion protein were blotted and probed with our anti-PS1 monoclonal antibody (α-PS1, left panel) and then stripped and reprobed with an antibody specific for GST (α-GST, right panel). The subscripts refer to amino acid residues of either PS1 or PS2 incorporated in the fusion protein constructs. The monoclonal antibody recognized the immunogen (GST–PS121–80) and another fusion protein containing overlapping sequences (GST–PS12–70) but did not bind to GST or a fusion protein containing the N terminus of PS2. Anti-GST antibody bound GST and all fusion proteins. Degradation of theGST–PS12–70 peptide or early termination of translation products resulted in three fragments, two of which were recognized by our PS1 antibody. B, In vitrotranslation was performed with no added mRNA (−), full-length PS1 mRNA (PS1), or full-length PS2 mRNA (PS2), in the presence or absence of microsomes (microsomes +, −). Equal aliquots of each reaction mixture (2 μl) were immunoblotted and probed with our monoclonal antibody to PS1. Control reactions without exogenous mRNA or with PS2 mRNA produced no immunoreactive material. Translation of PS1 mRNA produced a strongly immunoreactive band at ∼49 kDa and weaker bands at ∼32 and ∼26 kDa. Synthesis of each polypeptide was enhanced by the presence of microsomal membranes. C, Homogenates (25 μg/lane) of transfected rat PC12 (PC12–PS1) and monkey COS-7 (COS7–PS1) cells expressing the human PS1 gene were immunoblotted and probed with anti-PS1 antibody (left panel). Two primary immunoreactive bands were seen at 49 and 32 kDa. The smaller polypeptide was more abundant in transfected PC12 cells, whereas the larger band predominated in transfected COS-7 cells. Control lanes from untransfected parent cells (PC12, COS7) did not contain immunoreactive bands, but on overexposed blots the 32 kDa band was seen in untransfected COS-7 cell homogenates. Preadsorption of the monoclonal antibody with GST–PS121–80 eliminated all bands (right panel).
Western blot analysis also revealed strong antibody reactivity with the human protein expressed by in vitro translation of PS1 mRNA (Fig. 1B). The major immunoreactive protein was ∼49 kDa. This is somewhat smaller than the predicted size of the full-length protein encoded by the PS1 cDNA (467 amino acids,Mr 52,664; Sherrington et al., 1995), but it is similar to the Mr of PS1 recently reported by others, using antibodies to the loop region and different epitopes at the N terminus (Elder et al., 1996; Mercken et al., 1996; Moussaoui et al., 1996; Thinakaran et al., 1996). Less intense immunoreactive bands of ∼32 and ∼26 kDa were also present in the PS1 translation products. Expression of each of these polypeptides was facilitated by the introduction of microsomes (Fig. 1B). The monoclonal antibody did not react with the PS2 polypeptide (Fig.1B), the presence of which was confirmed by radiolabeling of the translation products and autoradiography (data not shown). Thus, our monoclonal antibody reacted selectively with full-length PS1 protein produced by cell-free translation as well as with truncated polypeptides bearing the N-terminal epitope.
Expression of PS1 protein in mammalian cells
PS1 protein was expressed in rat pheochromocytoma PC12 cells and in African green monkey kidney COS-7 cells and analyzed by Western blotting (Fig. 1C). The monoclonal antibody reacted strongly with both a 49 kDa protein and a more abundant 32 kDa polypeptide in PC12 cells stably transfected with the human PS1 cDNA. In COS-7 cells transiently transfected with PS1 cDNA, the dominant immunoreactive species were a doublet at 49 kDa and a 32 kDa polypeptide. In addition, several faint bands between 35–40 kDa sometimes were seen (Fig.2A, lane 1). On overexposed blots, a 32 kDa protein was detectable in untransfected COS-7 cells but at much lower levels than in the transfected cells. Because COS-7 cells express PS1 mRNA, as verified by PCR (data not shown), the 32 kDa band in untransfected cells likely represents endogenous monkey PS1 protein. In contrast, no endogenous PS1 immunoreactivity was detectable in untransfected PC12 cells. This finding implies that if PC12 cells express the rat PS1 homolog, then there is divergence between rodent and human species in the region recognized by our antibody. This possibility was confirmed by Western blot and immunocytochemical analysis of rat brain (data not shown), suggesting the epitope is in a region of the N terminus (amino acids 21–46) that is unique to the human PS1 (Takahashi et al., 1996). Finally, immunoreactivity in PC12 and COS-7 cells was depleted by preadsorption of the monoclonal antibody with the antigen, confirming the immunological specificity of binding (Fig. 1C).
Fig. 2.

PS1 in monkey peripheral tissues. Homogenates (50 μg/lane) were immunoblotted and probed with anti-PS1 antibody. Homogenate from COS7–PS1 (25 μg) was run for comparison. PS1 immunoreactivity in tissue homogenates was seen only as a 32 kDa band. The strongest bands were found in testis and lung, whereas PS1 protein was undetectable in pancreas and muscle. The 32 kDa band in all samples, as well as the 49 kDa band present in transfected COS-7 cells, was eliminated by preadsorption with GST–PS1 fusion protein (right panel, arrowhead). A nonspecific band at ∼95 kDa, present in muscle and lung (asterisk), was unaffected by preadsorption.
PS1 distribution in peripheral tissues
Northern blot results have indicated that PS1 is transcribed in a wide variety of peripheral tissues (Rogaev et al., 1995; Sherrington et al., 1995; Kovacs et al., 1996; Suzuki et al., 1996). To assess the distribution of PS1 protein, we prepared a broad range of monkey tissues for immunoblot analysis with the PS1 monoclonal antibody. In all tissues in which PS1 was detected, the antibody recognized a predominant band that comigrated with the 32 kDa band in PS1-transfected COS-7 cells (Fig. 2, left panel). Preadsorption of the primary antibody with PS1 fusion protein depleted this band in all samples, demonstrating specificity of binding (Fig. 2,right panel). Although higher molecular weight species, including the presumed full-length protein at ∼49 kDa, were seen in PS1-transfected COS-7 cells, only the 32 kDa band was seen in the monkey tissue samples. Even in samples in which the 32 kDa species was quite abundant, the full-length protein was not detected.
Different tissues showed significant variability in the abundance of PS1 protein, and it did not always parallel the reported mRNA levels (Kovacs et al., 1996; Suzuki et al., 1996). The highest levels of PS1 protein were found in samples from testis and lung. In contrast, PS1 was not detectable in pancreas or skeletal muscle. Other tissues that were examined (liver, kidney, spleen, salivary glands, and heart) revealed an intermediate range of PS1 immunoreactivity. An additional prominent band migrating at ∼95 kDa was seen in skeletal muscle and lung samples (Fig. 2, asterisk). However, preadsorption of the primary antibody failed to eliminate this band, indicating that it represents a nonspecific band produced by the detection system. These results suggest that the PS1 protein, as well as mRNA, is present in a variety of non-neural tissues. The differences between patterns of mRNA and protein expression implies potential differences in translation efficiency, mRNA stability, or protein half-life in different tissues. Furthermore, in peripheral tissues, Western blotting detects a 32 kDa polypeptide, but the full-length PS1 is not visualized. This suggests that the native PS1 produced in a variety of monkey tissues is processed efficiently into a 32 kDa polypeptide that contains the N-terminal epitope recognized by our antibody. It should be noted that the C-terminal 17 kDa peptide, which recently was reported (Thinakaran et al., 1996), could be present in these tissues as well; however, because of the epitope specificity of our antibody, this band would not be detected.
PS1 distribution in monkey brain
To determine the abundance of PS1 in different brain regions, we dissected a variety of cortical and subcortical structures from monkey brain and analyzed them for PS1 by Western blotting. Our antibody detected PS1 immunoreactivity in all brain regions, primarily as a 32 kDa polypeptide, and labeled a much fainter band at ∼49 kDa (Fig.3A). Both bands comigrated with the two major bands from PS1-transfected COS-7 cells. However, the lower band in brain was somewhat broader and had a slightly slower electrophoretic mobility than the corresponding band in PS1-transfected COS-7, suggesting potential differences in post-translational modifications. There were only slight differences in the band intensity across different brain regions. Notably, two regions that have been reported to contain high levels of PS1 mRNA in rat brain by in situhybridization, hippocampus and cerebellum (Kovacs et al., 1996; Suzuki et al., 1996), did not contain disproportionately high levels of PS1 protein. Thus, PS1 was found at similar levels throughout the monkey brain, suggesting a role in general neuronal function rather than a region- or cell type-specific activity.
Fig. 3.

PS1 in monkey brain and analysis of brain subfractions. A, Homogenates from different regions of monkey brain (50 μg) and COS7–PS1 (25 μg) were blotted and probed with anti-PS1 antibody. A strong band at ∼32 kDa and a much weaker band at ∼49 kDa comigrating with theCOS7–PS1 bands can be seen in all samples, but thelower band seems to have slightly slower electrophoretic mobility in brain samples. Comparable signal was found from all brain regions. B, Monkey cortex homogenate was fractionated by sucrose gradient centrifugation, and 50 μg of each subfraction was analyzed by immunoblotting. The blot was probed with anti-PS1 antibody (α-PS1; top panel), stripped, and reprobed with an antibody to the synaptic vesicle integral membrane protein synaptophysin (α-SY; bottom panel). Both synaptophysin and PS1 immunoreactivity were enriched in particulate fractions, especially the synaptosome-enriched fraction (P2–0.80 m) and the microsomal pellet (P3). PS1 immunoreactivity was undetectable in the high-speed supernatant (S3) but was present in the washed nuclear pellet (P1). Conversely, synaptophysin was present in S3, but was undetectable inP1.
To extend the localization of PS1 in brain, we followed the PS1 immunoreactivity on Western blots with subcellular fractions of monkey cortex (Fig. 3B, top panel). The same blot was stripped and reprobed for synaptophysin immunoreactivity (Fig.3B, bottom panel) to allow comparison of PS1 distribution with that of a well characterized integral membrane protein from synaptic vesicles (Wiedenmann and Franke, 1985). PS1 and synaptophysin were enriched in certain particulate fractions, most notably the synaptosome-enriched fraction (Fig. 3B, P2–0.80m) and the high-speed microsomal pellet (Fig.3B, P3). However, there are clear differences between PS1 and synaptophysin distribution in brain subfractions. Significant PS1 immunoreactivity persisted in the washed nuclear pellet, whereas synaptophysin immunoreactivity did not (Fig. 3B, P1). Conversely, synaptophysin remained faintly detectable in the high-speed supernatant (Fig. 3B, S3), whereas PS1 did not. These results suggest a localization of PS1 to a nonsynaptic vesicle membrane compartment that is enriched in an intermediate density P2 subfraction and high-speed microsomal pellet (P3). Potential organelle associations based on these results would include plasma membrane, ER, and Golgi apparatus (Gray and Whittaker, 1962). However, more specific immunoblot localization of PS1 will require comparison of its distribution relative to other organelle-specific markers.
PS1 immunocytochemical localization in monkey brain
The distribution of PS1 was defined further by immunocytochemical localization at the light and electron microscopic levels. Light microscopy revealed widespread distribution of PS1 immunoreactivity in all regions of monkey brain, including cerebral cortex, hippocampal formation, striatum, basal forebrain, thalamus, brainstem, and cerebellum (Fig. 4). Preadsorption with PS1 fusion protein eliminated antibody staining in all regions (Fig.4F). The low-power survey revealed a preponderance of immunoreactivity in gray matter. At the resolution of light microscopy, areas of neuropil appeared to be somewhat diffusely stained, with some variations in the intensity of immunoreactivity from region to region (Fig. 4). In the cerebral cortex, the neuropil in superficial layers was more intensely immunoreactive than in deeper layers (Figs. 4,5A). There has been a report of prominent axonal staining in some brainstem areas in rodents (Elder et al., 1996), but no significant accumulation of PS1 immunoreactivity was seen in any cortical or subcortical white matter tracts in monkey brains (Fig.4).
Fig. 4.

Regional light microscopic distribution of native PS1 protein in monkey brain. Sections of monkey brain at various levels were stained for PS1 immunoreactivity. Labeling was seen in all sections and was concentrated in areas of gray matter. Coronal sections are shown at the level of the caudate head (A), anterior commissure (B), anterior thalamus (C), hippocampus and lateral geniculate (D), and the cerebellum and pons (E). Preadsorption of the anti-PS1 monoclonal antibody with GST–PS121–80 eliminated all staining, demonstrating the specificity of the immunocytochemical reaction (F). Cd, Caudate;Pu, putamen; ac, anterior commissure;Am, amygdala; Th, thalamus;GP, globus pallidus; LGN, lateral geniculate; SN, substantia nigra; Hi, hippocampus; ERC, entorhinal cortex; Cb, cerebellum; Pn, pontine nuclei.
Fig. 5.
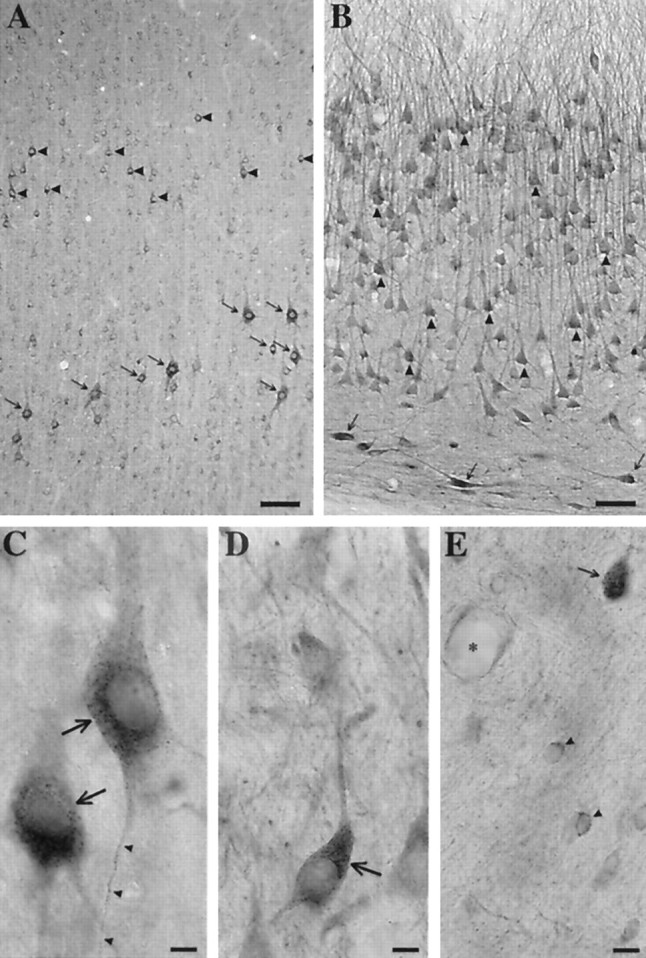
Cellular distribution of native PS1 protein in monkey brain. A, PS1 immunoreactivity in monkey frontal cortex is concentrated in neurons. Virtually every neuron appeared to possess some staining for PS1, but the staining was most intense in pyramidal neurons in layer 3 (arrowheads) and layer 5 (arrows). Scale bar, 100 μm. B, Hippocampal CA3 pyramidal neurons (arrowheads) stained for PS1 in the cell bodies and primary dendrites. In addition, intensely stained interneurons at the oriens–alveus border were seen frequently (arrows). Scale bar, 50 μm.C, Higher magnification views of cortical pyramidal neurons from monkey frontal cortex (arrows) revealed punctate labeling, which was concentrated in a perinuclear distribution. In this plane of focus, punctate staining can be followed into a slender basilar process (arrowheads). Scale bar, 20 μm. D, Similar intense and punctate staining was seen in other cell types, including neurons in the nucleus basalis magnocellularis (arrow). Scale bar, 20 μm.E, Non-neuronal cells, including glia (arrowheads) and blood vessels (asterisk), labeled weakly for PS1. A small neuron, slightly out of the plane of focus (arrow), demonstrates the typically more intense staining seen in neurons. Scale bar, 20 μm.
Although there were considerable differences in the intensity of labeling among cell populations, virtually all neurons showed some PS1 immunoreactivity. Light staining also was found in glial cells (Fig.5E, arrowheads), and there appeared to be weak labeling of at least some blood vessels (Fig. 5E, asterisk). In neuronal somata, the PS1 antibody produced punctate staining that typically was most intense around the nucleus but extended throughout the cell body (Fig. 5). Moreover, the labeling extended into neuronal processes, and, in some planes of sectioning, immunoreactivity could be followed well into the lengths of both dendrites and axons (Fig. 5C, arrowheads). Select neurons in a number of brain regions, including pyramidal neurons in layers 3 and 5 of cerebral cortex (Fig. 5A), displayed dramatic staining for PS1. In particular, large pyramidal neurons in the deep layers of frontal cortex frequently stained intensely (Fig. 5A,C, arrows). Other large neurons, including magnocellular basal forebrain neurons (Fig. 5D) and motor neurons of brainstem nuclei (data not shown), showed similar immunoreactivity. However, intense PS1 immunoreactivity was not seen in all large neurons. Large cerebellar Purkinje cells demonstrated only low levels of staining for PS1 (data not shown); conversely, some small neurons, including interneurons in the entorhinal cortex and hippocampus, showed strong PS1 labeling (Fig. 5B, arrows). The pattern of PS1 immunoreactivity in monkey brain is heterogeneous, and some of the more intensely stained neurons correspond to vulnerable populations affected in AD (Terry et al., 1981; Hof et al., 1990). However, the regional and cellular patterns of PS1 expression are more widespread than the pathology in the disease.
At the ultrastructural level, PS1 immunoreactivity was found in neuronal cell bodies, neuronal processes in the neuropil, glial cells, and some blood vessels. In both neuronal and glial cell bodies, pockets of PS1 labeling were seen on the cytoplasmic face of smooth membranous profiles, which frequently clustered adjacent to the Golgi apparatus (Figs. 6, 7A). Many of the labeled organelles were small- to intermediate-sized vesicles or elongated tubulovesicular profiles suggestive of SER (Fig.6A,B). Rarely, the cis-Golgi stacks were labeled (Fig. 6C), but the remainders of the Golgi stacks were devoid of immunoreactivity (Figs. 6D,E,7A). Most of the labeled membranes possessed a smooth surface. However, our PS1 antibody also labeled some coated vesicles that were seen near the Golgi and, occasionally, seen in continuity with Golgi membranes (Fig. 6D,E, arrows). It should be noted that PS1-labeled vesicles were not exclusive to neurons or the Golgi apparatus. Figure 7B shows a forming coated pit in an endothelial cell (asterisk) with adjacent PS1-immunoreactive vesicles (arrowheads). Within neuronal cell bodies, PS1 was distributed to tubulovesicular profiles, smooth vesicles, coated vesicles, and cis-Golgi stacks; other morphologically identifiable organelles, such as the nucleus, rough ER, lysosomes, and mitochondria, did not have detectable PS1 immunoreactivity. The pattern of immunoreactivity in cell bodies reveals a specific association with a population of transport vesicles and indicates a distribution in the ER–Golgi intermediate compartment (Hauri and Schweizer, 1992; Rexach et al., 1994; Krijnse-Locker et al., 1995).
Fig. 6.

Ultrastructural localization of PS1 in hippocampal neurons. A, B, Vesicular (arrows) and tubular (asterisk) membrane profiles stained with diaminobenzidine reaction products often were seen in clusters within neuronal cell bodies. Although these stained profiles were often near the Golgi apparatus, the Golgi stacks themselves were mainly devoid of immunoreactivity (C–E). C, Occasional examples of PS1 staining of the Golgi stacks were seen on the cis-Golgi, facing the nucleus (asterisk). D,E, In addition, occasional labeled vesicles were found in continuity with a Golgi stack (arrow). These profiles, as well as some free vesicles near the Golgi, appeared to possess a cytoplasmic coat material typical of coated transport vesicles (C and E,arrowheads). Nuc, Nucleus. Scale bars, 100 nm.
Fig. 7.
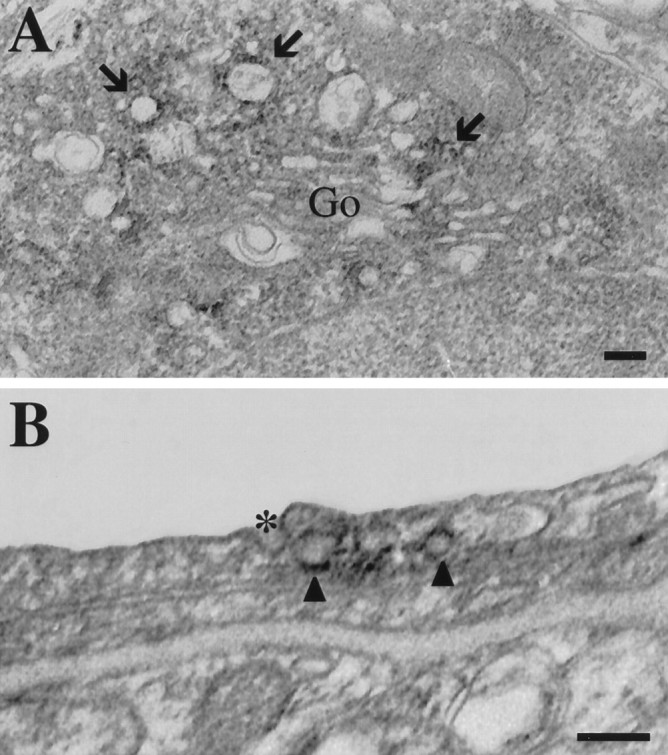
Ultrastructural localization of PS1 in glia and blood vessels in frontal cortex. A, The distribution of PS1 immunoreactivity in glial cells was similar to that in neuronal cell bodies. Labeling was present on vesicular profiles (arrows), which tended to cluster near the Golgi apparatus. As in neurons, the Golgi stacks themselves were unstained (Go, Golgi apparatus). Scale bar, 100 nm.B, Labeled vesicular profiles (arrowheads) were seen adjacent to a coated pit in an endothelial cell (asterisk). These vesicles also appeared to possess cytoplasmic coats, but they were somewhat indistinct because of the presence of diaminobenzidine reaction products on the cytoplasmic membrane surfaces. Scale bar, 100 nm.
In the neuropil, PS1 staining labeled dendritic spines and occasional presynaptic elements (Fig. 8). As in the cell bodies, labeling was seen on the cytoplasmic surface of membranous organelles. In dendritic spines, these structures generally had the appearance of smooth tubular membranes or vesicles (Fig. 8A,B), which morphologically resemble a dendritic SER subcompartment that has been described previously (Satoh et al., 1990; Takei et al., 1992). Labeling in presynaptic elements was seen less frequently, but PS1 immunoreactivity was seen occasionally on the cytoplasmic surfaces of some vesicles (Fig. 8C,D). The vast majority of synaptic vesicles was unlabeled, and clusters of presynaptic vesicles at synaptic junctions apposed to postsynaptic densities generally lacked PS1 staining (e.g., Fig. 8A,B). It is possible that PS1 may be present on a very small subpopulation of synaptic vesicles. Alternatively, the labeled membranes may represent nonsynaptic vesicle components of the presynaptic terminal, such as elements of the SER network, which is known to extend into distal axons and terminals (Takei et al., 1992; Terasaki et al., 1994; Krijnse-Locker et al., 1995). Taken as a whole, these ultrastructural observations in monkey brain suggest a localization of PS1 to a subcompartment of the SER in both cell bodies and processes.
Fig. 8.

Ultrastructural localization of PS1 in the neuropil. A, B, The majority of neuropil staining was seen in dendrites and dendritic spines. The immunoreactivity localized to tubulovesicular profiles (asterisks), which likely represent elements of the SER (PSD, postsynaptic density). C, D, Labeling was seen occasionally within presynaptic elements identified by the presence of typical synaptic vesicles. Staining is seen on vesicular profiles (arrows), typically localized just beneath the plasma membrane. Note that the vast majority of synaptic vesicles was unlabeled, and the labeled vesicles did not appear to be at sites of synaptic contacts, as indicated by the lack of postsynaptic densities on the apposed membranes. Scale bar, 100 nm.
DISCUSSION
Mutations in the PS1 gene cause aggressive, early-onset AD via an unknown mechanism. A better understanding of the normal function of PS1 may provide important clues to the nature of the dysfunction(s), which leads to the pathological changes in this disease. The present study provides a detailed immunochemical examination of primate PS1 with a highly sensitive monoclonal antibody specific for the human PS1 N-terminal domain. Western blots identify a 32 kDa PS1 polypeptide that is widely expressed in brain and peripheral tissues. The immunocytochemical results reveal labeling of neurons in all brain regions and weaker immunoreactivity in non-neuronal cells. Our electron microscopic immunocytochemical studies strongly suggest that PS1 is localized to a population of transport vesicles, a subdomain of the SER, and the ER–Golgi intermediate compartment. These findings have a number of implications regarding the expression, processing, and possible functions of PS1 protein.
The Western blot results raise several issues regarding PS1 processing. The 49 kDa band observed in various expression systems almost certainly represents the full-length PS1 protein. It approximates the calculated size for the 467-amino-acid polypeptide (Mr of 52,664) and corresponds to the size reported in other studies (Elder et al., 1996; Kovacs et al., 1996; Mercken et al., 1996; Sahara et al., 1996; Thinakaran et al., 1996). The predominant protein in cell free translation systems and transiently transfected COS-7 cells is the 49 kDa polypeptide, but in stably transfected PC12 cells and monkey tissues the 32 kDa polypeptide predominates. We also have detected low levels of an endogenous 32 kDa PS1-immunoreactive peptide in untransfected COS-7 cells. However, our N-terminal antibody does not recognize the rat PS1 homolog and, therefore, does not detect PS1 in untransfected PC12 cells. Because both the 49 and 32 kDa species seen in our expression systems derive from a full-length human PS1 cDNA, we can exclude the possibility that the various polypeptides arise by alternative splicing (Clark et al., 1995; Rogaev et al., 1995; Anwar et al., 1996; Sahara et al., 1996). Recently, endoproteolytic cleavage of PS1 resulting in regulated accumulation of N- and C-terminal derivatives has been reported in transgenic mice (Thinakaran et al., 1996). More extensive study will be necessary to better characterize the endoproteolytic cleavage events, the distribution of full-length, N-, and C-terminal PS1 species, and the potential functional implications of these observations.
The detection of PS1 protein in peripheral tissues was not unexpected. The original reports of PS1 and PS2 transcription in a variety of tissues (Rogaev et al., 1995; Sherrington et al., 1995), have been confirmed by subsequent Northern blot and in situhybridization studies (Kovacs et al., 1996; Sahara et al., 1996; Suzuki et al., 1996). Although the relative level of PS1 protein does not parallel that of the mRNA exactly, they are both widespread in peripheral tissues. It is noteworthy that the highest levels of both PS1 mRNA (Suzuki et al., 1996) and protein (Fig. 2) have been found in testis. The only known genes with significant homology to the presenilins are spe-4 (L’Hernault and Arduengo, 1992) andsel-12 (Levitan and Greenwald, 1995) fromCaenorhabditis elegans. The SEL-12 protein has not yet been characterized, but SPE-4 is known to play a role in the packaging of major sperm protein during spermatogenesis (L’Hernault and Arduengo, 1992). The abundance of PS1 mRNA and protein in testis suggests the possibility that PS1 may play an analogous role in spermatogenesis.
The precise localization of PS1 may yield important information in discerning the function of the protein. Our examination of various brain regions by Western blot analysis reveals no obvious differences in PS1 abundance. Immunocytochemical analysis, however, shows clear variability in the intensity of labeling of individual cells. Although some of the most intensely stained cells correspond to populations vulnerable to pathological changes in AD, including neocortical and hippocampal pyramidal neurons and magnocellular basal forebrain neurons (Terry et al., 1981; Whitehouse et al., 1981; Hof et al., 1990), PS1 is not limited to these cell types. At the light microscopic level, punctate immunoreactivity is most concentrated in neuronal cell bodies, proximal dendrites, and areas of neuropil. Weaker labeling is present in non-neuronal cells in the brain (i.e., glia and blood vessels), and we do not detect significant axonal staining in any areas of cortical or subcortical white matter. This pattern of immunocytochemical staining is similar to that seen in normal human brain (Levey et al., 1997).
Recently, two groups have reported immunocytochemical localization of PS1 in rodent brains, using polyclonal antibodies raised to synthetic peptides from the large internal loop region of PS1 (Elder et al., 1996; Moussaoui et al., 1996). Both groups report widespread distribution in brain regions, similar to our findings in primate brain; however, there are some significant differences. The immunoreactivity in rodent brains was exclusive to neurons, and no staining was seen in glia or blood vessels. Within neurons, the pattern of labeling reported by Moussaoui et al. (1996) was similar to ours. In contrast, Elder et al. (1996) reported a marked concentration of PS1 in the apical dendrites of olfactory bulb mitral cells, neocortical pyramidal cells, hippocampal pyramidal cells, and cerebellar Purkinje cells, with much weaker staining of cell bodies and axons in these cells. Neurons in the brainstem and spinal cord showed more prominent staining in the cell body and axon (Elder et al., 1996). The source of these differences is not clear, but they may be attributable to the epitope specificity of the antibodies. The endoproteolytic cleavage of PS1 is suspected to occur between amino acid residues 260–320 in or near the proximal loop domain (Thinakaran et al., 1996). This could produce significant differences between N-terminal- and loop-specific antibodies.
Both presenilins are highly hydrophobic molecules and have been presumed to be integral membrane proteins. Our fractionation and electron microscopic immunocytochemistry studies confirm this hypothesis. In previous immunofluorescence studies, PS1 and PS2 were localized to ER and Golgi in transiently transfected neuroglioma cells overexpressing epitope-tagged proteins (Kovacs et al., 1996). More recently, PS1 overexpressed in a neuronal cell line infected with recombinant virions was localized to SER and rough ER by confocal microscopy (Cook et al., 1996). At the ultrastructural level, our antibody localizes the N terminus of native PS1 in monkey brain to the cytoplasmic face of membranous organelles in cell bodies and in the neuropil. Within neuronal cell bodies much of the PS1 immunoreactivity is found on tubulovesicular membranes, which are most likely elements of the SER. However, the entire network of ER membranes does not appear homogeneously stained, and rough ER does not seem to possess significant amounts of PS1. In the Golgi apparatus, the Golgi stacks themselves are seldom stained, but occasional staining is seen on the presumptive cis-Golgi (facing the nucleus). This pattern of immunoreactivity suggests that PS1 may be localized selectively in the ER–Golgi intermediate compartment involved in intracellular protein trafficking (Hauri and Schweizer, 1992; Rexach et al., 1994;Krijnse-Locker et al., 1995). The possibility of a role for PS1 in intracellular transport functions is supported by the identification of PS1-immunoreactive coated vesicles. The specific molecular identification of these coated vesicles will require additional study, but their association with Golgi stacks suggests that they may be coat protomer complex I coated vesicles (Aridor et al., 1995; Rothman and Wieland, 1996; Schekman and Orci, 1996). These indications of a role for PS1 in intracellular transport are even more intriguing when considered in light of reports that mutations in the presenilins affect the processing and secretion of Aβ peptide (Martins et al., 1995;Borchelt et al., 1996; Duff et al., 1996; Scheuner et al., 1996). The localization of PS1 to intracellular transport vesicles and the ER–Golgi intermediate compartment offers a possible intersection between APP and PS1, which may be important in understanding the pathogenesis of AD.
By both light and electron microscopic immunocytochemistry, PS1 immunoreactivity extends beyond neuronal cell bodies. Labeled vesicular profiles occasionally are found within presynaptic elements. However, a vast majority of synaptic vesicles are not stained, and PS1 and synaptophysin have different distributions in subcellular fractions. These results suggest that the immunoreactivity in presynaptic terminals does not reside on synaptic vesicles, so the identification of PS1-positive profiles in presynaptic terminals will require additional study. Most PS1 immunoreactivity in the neuropil is seen within dendritic spines on smooth tubulovesicular profiles. The morphological appearance of these organelles and their characteristic localization in dendritic spines suggests that they are components of the SER network (Satoh et al., 1990; Takei et al., 1992). The SER in neurons has been characterized as an intricate communicating network that extends from the cell body into the terminal segments of dendritic and axonal processes (Broadwell and Cataldo, 1984; Terasaki et al., 1994). Furthermore, a significant body of evidence suggests that these membranes are heterogeneous and contain biochemically and functionally distinct domains, including molecular specializations involved in calcium regulation (Satoh et al., 1990; Takei et al., 1992). Our EM immunocytochemical results suggest a distribution for PS1 in a subdomain of the SER. Additional studies aimed at colocalization of PS1 and various molecular markers for SER subdomains should permit a more precise definition of PS1 distribution and provide additional clues to its cellular function.
Footnotes
This work was supported by National Institutes of Health Grant NS01902-01 (J.L.). We thank David Rye, Margaret Tigges, and the Yerkes Primate Center for providing monkey tissues used in this study.
Correspondence should be addressed to James J. Lah, Department of Neurology, Emory University School of Medicine, Woodruff Memorial Research Building, Suite 6000, P.O. Drawer V, Atlanta, GA 30322.
REFERENCES
- 1.Anwar R, Moynihan T, Ardley H, Brindle N, Coletta P, Cairns N, Markham A, Robinson P. Molecular analysis of the presenilin 1 (S182) gene in “sporadic” cases of Alzheimer’s disease: identification and characterization of unusual splice variants. J Neurochem. 1996;66:1774–1777. doi: 10.1046/j.1471-4159.1996.66041774.x. [DOI] [PubMed] [Google Scholar]
- 2.Aridor M, Bannykh S, Rowe T, Balch W. Sequential coupling between COPII and COPI vesicle coats in endoplasmic reticulum to Golgi transport. J Cell Biol. 1995;131:875–893. doi: 10.1083/jcb.131.4.875. [DOI] [PMC free article] [PubMed] [Google Scholar]
- 3.Borchelt DR, Thinakaran G, Eckman CB, Lee MK, Davenport F, Ratovitsky T, Prada C-M, Kim G, Seekins S, Yager D, Slunt HH, Wang R, Seeger M, Levey AI, Gandy SE, Copeland NG, Jenkins NA, Price DL, Younkin SG, Sisodia SS. Familial Alzheimer’s disease-linked presenilin 1 variants elevate Aβ1–42/1–40 ratio in vitro and in vivo. Neuron. 1996;17:1005–1013. doi: 10.1016/s0896-6273(00)80230-5. [DOI] [PubMed] [Google Scholar]
- 4.Broadwell R, Cataldo A. The neuronal endoplasmic reticulum: its cytochemistry and contribution to the endomembrane system. II. Axons and terminals. J Comp Neurol. 1984;230:231–248. doi: 10.1002/cne.902300208. [DOI] [PubMed] [Google Scholar]
- 5.Chartier-Harlin MC, Crawford F, Houlden H, Warren A, Hughes D, Fidani L, Goate A, Rossor M, Roques P, Hardy J, Mullan M. Early-onset Alzheimer’s disease caused by mutations at codon 717 of the beta-amyloid precursor protein gene. Nature. 1991;353:844–846. doi: 10.1038/353844a0. [DOI] [PubMed] [Google Scholar]
- 6.Clark R, Hutton M, Fuldner F, Froelich S, Karran E, Talbot C, Crook R, Lendon C, Prihar GCH, Korenblat K, Martinez A, Wragg M, Busfield F, Behrens M, Myers A, Norton J, Morris J, Mehta N, Pearson C, Lincoln S, Baker M, Duff K, Zehr C, Perez-Tur J, Houlden H, Ruiz A, Ossa J, Lopera F, Arcos M, Madrigal L, Collinge J, Humphreys C, Ashworth A, Sarner S, Fox N, Harvey R, Kennedy A, Roques P, Cline R, Philips C, Venter J, Forsell L, Axelman K, Lilius L, Johnston J, Cowburn R, Viitanen M, Winblad B, Kosik K, Haltia M, Poyhonen M, Dickson D, Mann D, Neary D, Snowden J, Lantos P, Lannfelt L, Rossor M, Roberts G, Adams M, Hardy J, Goate A. The structure of the presenilin 1 (S182) gene and identification of six novel mutations in early onset AD families. Nat Genet. 1995;11:219–222. doi: 10.1038/ng1095-219. [DOI] [PubMed] [Google Scholar]
- 7.Cook D, Sung J, Golde T, Felsenstein K, Wojczyk B, Tanzi R, Trajanowski J, Lee V-Y, Doms R. Expression and analysis of presenilin 1 in a human neuronal system: localization in cell bodies and dendrites. Proc Natl Acad Sci USA. 1996;93:9223–9228. doi: 10.1073/pnas.93.17.9223. [DOI] [PMC free article] [PubMed] [Google Scholar]
- 8.Duff K, Eckman C, Zehr C, Yu X, Prada C-M, Perez-Tur J, Hutton M, Buee L, Harigaya Y, Yager D, Morgan D, Gordon MN, Holcomb L, Refolo L, Zenk B, Hardy J, Younkin S. Increased amyloid-β42(43) in brains of mice expressing mutant presenilin 1. Nature. 1996;383:710–713. doi: 10.1038/383710a0. [DOI] [PubMed] [Google Scholar]
- 9.Elder G, Tezapsidis N, Carter J, Shioi J, Bouras C, Li H-C, Johnston J, Efthimiopoulos S, Friedrich VLJ, Robakis N. Identification and neuron-specific expression of the S182/presenilin I protein in human and rodent brains. J Neurosci Res. 1996;45:308–320. doi: 10.1002/(SICI)1097-4547(19960801)45:3<308::AID-JNR13>3.0.CO;2-#. [DOI] [PubMed] [Google Scholar]
- 10.Goate A, Chartier-Harlin MC, Mullan M, Brown J, Crawford F, Fidani L, Guiffra L, Haynes A, Irving N, James L, Mant R, Newton P, Rooke K, Roques P, Talbot C, Paricak-Vance M, Roses A, Williamson R, Rossor M, Owen M, Hardy J. Segregation of a missense mutation in the amyloid precursor protein gene with familial Alzheimer’s disease. Nature. 1991;349:704–706. doi: 10.1038/349704a0. [DOI] [PubMed] [Google Scholar]
- 11.Gray E, Whittaker V. The isolation of nerve endings from brain: an electron microscopic study of cell fragments derived by homogenization and centrifugation. J Anat. 1962;96:79–87. [PMC free article] [PubMed] [Google Scholar]
- 12.Hauri H, Schweizer A. The endoplasmic reticulum-Golgi intermediate compartment. Curr Opin Cell Biol. 1992;4:600–608. doi: 10.1016/0955-0674(92)90078-Q. [DOI] [PMC free article] [PubMed] [Google Scholar]
- 13.Hof P, Cox K, Morrison J. Quantitative analysis of a vulnerable subset of pyramidal neurons in Alzheimer’s disease. I. Superior frontal and inferior temporal cortex. J Comp Neurol. 1990;301:44–54. doi: 10.1002/cne.903010105. [DOI] [PubMed] [Google Scholar]
- 14.Kovacs D, Fausett H, Page K, Kim T-W, Moir R, Merriam D, Hollister R, Hallmark O, Mancini R, Felsenstein K, Hyman B, Tanzi R, Wasco W. Alzheimer-associated presenilins 1 and 2: neuronal expression in brain and localization to intracellular membranes in mammalian cells. Nat Med. 1996;2:224–229. doi: 10.1038/nm0296-224. [DOI] [PubMed] [Google Scholar]
- 15.Krijnse-Locker J, Parton R, Fuller S, Griffiths G, Dotti C. The organization of the endoplasmic reticulum and intermediate compartment in cultured rat hippocampal neurons. Mol Biol Cell. 1995;6:1315–1332. doi: 10.1091/mbc.6.10.1315. [DOI] [PMC free article] [PubMed] [Google Scholar]
- 16.L’Hernault S, Arduengo P. Mutation of a putative sperm membrane protein in Caenorhabditis elegans prevents sperm differentiation but not its associated meiotic divisions. J Cell Biol. 1992;119:55–68. doi: 10.1083/jcb.119.1.55. [DOI] [PMC free article] [PubMed] [Google Scholar]
- 17.Levey A, Kitt C, Simonds W, Price D, Brann M. Identification and localization of muscarinic acetylcholine receptor proteins in brain with subtype-specific antibodies. J Neurosci. 1991;11:3218–3226. doi: 10.1523/JNEUROSCI.11-10-03218.1991. [DOI] [PMC free article] [PubMed] [Google Scholar]
- 18.Levey A, Heilman C, Lah J, Nash N, Rees H, Wakai M, Mirra S, Rye D, Nochlin D, Bird T, Mufson E (1997) Presenilin-1 protein expression in familial and sporadic Alzheimer’s disease. Ann Neurol, in press. [DOI] [PubMed]
- 19.Levitan D, Greenwald I. Facilitation of lin-12-mediated signalling by sel-12, a Caenorhabditis elegans S182 Alzheimer’s disease gene. Nature. 1995;377:351–354. doi: 10.1038/377351a0. [DOI] [PubMed] [Google Scholar]
- 20.Levy-Lahad E, Wasco W, Poorkaj P, Romano D, Oshima J, Pettingell W, Yu C, Jondro P, Schmidt S, Wang K, Crowley A, Fu Y, Guenette S, Galas D, Nemens E, Wijsman E, Bird T, Schellenberg G, Tanzi R. Candidate gene for the chromosome 1 familial Alzheimer’s disease locus. Science. 1995;269:973–977. doi: 10.1126/science.7638622. [DOI] [PubMed] [Google Scholar]
- 21.Martins R, Turner B, Carroll R, Sweeney D, Kim K, Wisniewski H, Blass J, Gibson G, Gandy S. High levels of amyloid-β protein from S182 (Glu246) familial Alzheimer’s cells. NeuroReport. 1995;7:217–220. [PubMed] [Google Scholar]
- 22.Mercken M, Takahashi H, Honda T, Sato K, Murayama M, Nakazato Y, Noguchi K, Imahori K, Takashima A. Characterization of human presenilin 1 using N-terminal specific monoclonal antibodies: evidence that Alzheimer mutations affect proteolytic processing. FEBS Lett. 1996;389:297–303. doi: 10.1016/0014-5793(96)00608-4. [DOI] [PubMed] [Google Scholar]
- 23.Moussaoui S, Czech C, Pradier L, Blanchard V, Bonici B, Gohin M, Imperato A, Revah F. Immunohistochemical analysis of presenilin-1 expression in the mouse brain. FEBS Lett. 1996;383:219–222. doi: 10.1016/0014-5793(96)00250-5. [DOI] [PubMed] [Google Scholar]
- 24.Murrell J, Farlow M, Ghetti B, Benson MD. A mutation in the amyloid precursor protein associated with hereditary Alzheimer’s disease. Science. 1991;254:97–99. doi: 10.1126/science.1925564. [DOI] [PubMed] [Google Scholar]
- 25.Rexach M, Latterich M, Schekman R. Characteristics of endoplasmic reticulum-derived transport vesicles. J Cell Biol. 1994;5:1133–1148. doi: 10.1083/jcb.126.5.1133. [DOI] [PMC free article] [PubMed] [Google Scholar]
- 26.Rogaev E, Sherrington R, Rogaeva E, Levesque G, Ikeda M, Liang Y, Chi H, Lin C, Holman K, Tsuda T, Mar L, Sorbi S, Nacmias B, Placentini S, Amaducci L, Chumakov I, Cohen D, Lannfelt L, Fraser P, Rommens J, George-Hyslop PS. Familial Alzheimer’s disease in kindreds with missense mutations in a gene on chromosome 1 related to the Alzheimer’s disease type 3 gene. Nature. 1995;376:775–778. doi: 10.1038/376775a0. [DOI] [PubMed] [Google Scholar]
- 27.Rothman J, Wieland F. Protein sorting by transport vesicles. Science. 1996;272:227–234. doi: 10.1126/science.272.5259.227. [DOI] [PubMed] [Google Scholar]
- 28.Sahara N, Yahagi Y, Takagi H, Kondo T, Okochi M, Usami M, Shirasawa T, Mori H. Identification and characterization of presenilin I-467, I-463, and I-374. FEBS Lett. 1996;381:7–11. doi: 10.1016/0014-5793(96)00054-3. [DOI] [PubMed] [Google Scholar]
- 29.Satoh T, Ross C, Villa A, Supattapone S, Pozzan T, Snyder S, Meldolesi J. The inositol 1,4,5,-trisphosphate receptor in cerebellar Purkinje cells: quantitative immunogold labeling reveals concentration in an ER subcompartment. J Cell Biol. 1990;111:615–624. doi: 10.1083/jcb.111.2.615. [DOI] [PMC free article] [PubMed] [Google Scholar]
- 30.Schekman R, Orci L. Coat proteins and vesicle budding. Science. 1996;271:1526–1533. doi: 10.1126/science.271.5255.1526. [DOI] [PubMed] [Google Scholar]
- 31.Scheuner D, Eckman C, Jensen M, Song X, Citron M, Suzuki N, Bird T, Hardy J, Hutton M, Kukul W, Larson E, Levy-Lahad E, Viitanen M, Peskind E, Poorkaj P, Schellenberg G, Tanzi R, Wasco W, Lannfelt L, Selkoe D, Younkin S. Secreted amyloid beta-protein similar to that in the senile plaques of Alzheimer’s disease is increased in vivo by the presenilin 1 and 2 and APP mutations linked to familial Alzheimer’s disease. Nat Med. 1996;2:864–870. doi: 10.1038/nm0896-864. [DOI] [PubMed] [Google Scholar]
- 32.Sherrington R, Rogaev E, Liang Y, Rogaeva E, Levesque G, Ikeda M, Chl H, Lin C, Li G, Holman K, Tsuda T, Mar L, Foncin J-F, Bruni A, Montesi M, Sorbi S, Rainero I, Pinessi L, Nee L, Chumakov I, Pollen D, Brookes A, Sanseau P, Pollnsky R, Wasco W, Silva HD, Haines J, Pericak-Vance M, Tanzi R, Roses A, Fraser P, Rommens J, George-Hyslop PS. Cloning of a gene bearing missense mutations in early-onset familial Alzheimer’s disease. Nature. 1995;375:754–760. doi: 10.1038/375754a0. [DOI] [PubMed] [Google Scholar]
- 33.Smith DB, Johnson KS. Single-step purification of polypeptides expressed in Escherichia coli as fusions with glutathione S-transferase. Gene. 1988;67:31–40. doi: 10.1016/0378-1119(88)90005-4. [DOI] [PubMed] [Google Scholar]
- 34.Suzuki T, Nishiyama K, Murayama S, Yamamoto A, Sato S, Kanazawa I, Sakaki Y. Regional and cellular presenilin 1 gene expression in human and rat tissues. Biochem Biophys Res Commun. 1996;219:708–713. doi: 10.1006/bbrc.1996.0299. [DOI] [PubMed] [Google Scholar]
- 35.Takahashi H, Murayama M, Takashima A, Mercken M, Nakazato Y, Noguchi K, Imahori K. Molecular cloning and expression of the rat homologue of presenilin-1. Neurosci Lett. 1996;206:113–116. doi: 10.1016/s0304-3940(96)12449-6. [DOI] [PubMed] [Google Scholar]
- 36.Takei K, Stukenbrok H, Metcalf A, Mignery G, Sudhof T, Volpe P, Camilli PD. Ca2+ stores in Purkinje neurons: endoplasmic reticulum subcompartments demonstrated by the heterogeneous distribution of the InsP3 receptor, Ca2+–ATPase, and calsequestrin. J Neurosci. 1992;12:489–505. doi: 10.1523/JNEUROSCI.12-02-00489.1992. [DOI] [PMC free article] [PubMed] [Google Scholar]
- 37.Terasaki M, Slater N, Fein A, Schmidek A, Reese T. Continuous network of endoplasmic reticulum in cerebellar Purkinje neurons. Proc Natl Acad Sci USA. 1994;91:7510–7514. doi: 10.1073/pnas.91.16.7510. [DOI] [PMC free article] [PubMed] [Google Scholar]
- 38.Terry R, Peck A, DeTeresa R, Schecter R, Horoupian D. Some morphometric aspects of the brain in senile dementia of the Alzheimer’s type. Ann Neurol. 1981;10:184–192. doi: 10.1002/ana.410100209. [DOI] [PubMed] [Google Scholar]
- 39.Thinakaran G, Borchelt D, Lee M, Slunt H, Spitzer L, Kim G, Ratovitsky T, Davenport F, Nordstedt C, Seeger M, Hardy J, Gandy S, Levey A, Jenkins N, Copeland N, Price D, Sisodia S. Endoproteolysis of presenilin 1 and regulated accumulation of processed derivatives in vivo. Neuron. 1996;17:181–190. doi: 10.1016/s0896-6273(00)80291-3. [DOI] [PubMed] [Google Scholar]
- 40.Whitehouse PJ, Price DL, Clark AW, Coyle JT, DeLong MR. Alzheimer disease: evidence for selective loss of cholinergic neurons in the nucleus basalis. Ann Neurol. 1981;10:122–126. doi: 10.1002/ana.410100203. [DOI] [PubMed] [Google Scholar]
- 41.Wiedenmann B, Franke W. Identification and localization of synaptophysin, an integral membrane glycoprotein of Mr 38,000 characteristic of presynaptic vesicles. Cell. 1985;41:1017–1028. doi: 10.1016/s0092-8674(85)80082-9. [DOI] [PubMed] [Google Scholar]