

Abstract
Unilateral transection of the excitatory perforant path results in the acute deafferentation of a segregated zone on the distal dendrites of hippocampal dentate gyrus granule cells (i.e., outer molecular layer), followed by sprouting, reactive synaptogenesis, and a return of physiological and behavioral function. To investigate cellular mechanisms underlying NMDA receptor plasticity in response to such extensive synaptic reorganization, we quantitatively evaluated changes in intensity levels of NMDAR1 immunofluorescence and NMDAR1 mRNA hybridization within subcellular compartments of dentate gyrus granule cells 2, 5, and 9 d after perforant path lesions. There were no significant changes in either measure at 2 d postlesion. However, at 5 and 9 d postlesion, during the period of axonal sprouting and synaptogenesis, there was an increase in NMDAR1 immunolabeling that was restricted to the dendritic segments of the denervated outer molecular layer and the granule cell somata. In contrast, NMDAR1 mRNA levels at 5 and 9 d postlesion increased throughout the full extent of the molecular layer, including both denervated and nondenervated segments of granule cell dendrites. These findings reveal that NMDAR1 mRNA is one of a limited population of mRNAs that is transported into dendrites and further suggest that in response to terminal proliferation and sprouting, increased mRNA transport occurs throughout the full dendritic extent, whereas increased local protein synthesis is restricted to denervated regions of the dendrites whose afferent activity is perturbed. These results begin to elucidate the dynamic postsynaptic subcellular regulation of receptor subunits associated with synaptic plasticity after denervation.
Keywords: excitatory amino acid receptors, immunocytochemistry, hippocampus, entorhinal cortex, plasticity, confocal microscopy
Plasticity of neurotransmitter receptor number or distribution is a key component of the compensatory neuronal response to denervation and changes in afferent activity (Klein et al., 1989). Although classically associated with the peripheral nervous system (Lømo and Rosenthal, 1972; Frank et al., 1975), receptor plasticity of this kind has also been demonstrated in the CNS. For example, in several regions, including neocortex, hippocampus, and cerebellum, the number of GluR binding sites and/or levels of GluR subunit mRNAs are influenced by exposure to pharmacological agents (Williams et al., 1992; Bessho et al., 1994), the induction of long-term potentiation (LTP) (Maren et al., 1993; Thomas et al., 1994a), the induction of seizure activity (Friedman et al., 1994; Kamphuis et al., 1994; Gold et al., 1996), and deafferentation (Geddes et al., 1985; Ulas et al., 1990). One subtype of ionotropic GluR, the NMDA receptor (NMDAR), is thought to play a key role in synaptic plasticity, particularly that associated with development of connectivity (Shatz, 1990) and induction of LTP, a cellular model of learning and memory (Bliss and Lømo, 1973;Bliss and Collingridge, 1993). Additionally, alterations in the number of NMDAR binding sites occur during aging (Tamura et al., 1991; Wenk and Walker, 1991), which may reflect changes in subunit distribution. We have recently shown in aged monkeys that the immunofluorescence intensity of the obligatory subunit NMDAR1 is decreased within the segments of granule cell dendrites that receive the perforant path input from the entorhinal cortex (EC), in comparison with more proximal dendritic segments that do not receive this input (Gazzaley et al., 1996a). Based on this finding, we hypothesized that intradendritic levels of NMDAR1 are dynamic and modifiable by alterations in the afferent activity of the perforant path.
To explore this hypothesis, we focus in the present study on the dynamic regulation of NMDAR1 in rat dentate gyrus after synaptic reorganization induced by unilateral transection of the perforant path input from the EC. This produces a well-characterized pattern of synaptic reorganization confined to the distal two-thirds of the molecular layer, which corresponds to the outer molecular layer (OML), where EC inputs terminate (Steward, 1976). The pattern of synaptic reorganization includes a period of massive (∼90%) synapse loss (Matthews et al., 1976; Steward and Vinsant, 1983), followed by a period of terminal proliferation (sprouting) of excitatory afferents from commissural/associational pathways (Zimmer, 1973) and the contralateral EC (Steward et al., 1974), and reactive synaptogenesis (Steward and Vinsant, 1983) culminating in a degree of physiological and behavioral recovery (Loesche and Steward, 1977; Reeves and Smith, 1987; Reeves and Steward, 1988). Thus, this paradigm allows investigation of receptor changes during terminal degeneration and subsequent sprouting within spatially restricted segments of dendrites.
Given the functional importance of the perforant path input to the dentate gyrus for memory processing (Skelton and McNamara, 1992; Vnek et al., 1995), and the high vulnerability of this input to pathological changes during aging and in Alzheimer’s disease (Hyman et al., 1984;Lippa et al., 1992; review, Hof and Morrison, 1994), understanding compensatory changes in NMDAR1 levels or distribution after perturbations of the perforant path may be crucial for understanding mechanisms of memory loss associated with aging and disease. Although previous studies evaluating GluR plasticity after unilateral EC lesioning have used autoradiographic techniques to assess alterations in various GluR ligand binding sites (Geddes et al., 1985; Ulas et al., 1990), such studies do not reveal details of the cellular and molecular mechanisms that may be the basis of physiological and behavioral recovery. The specific goals of this study, therefore, are to characterize temporal and spatial aspects of the regulation and localization of NMDAR1 protein and mRNA in the dentate gyrus after unilateral transection of the perforant path.
MATERIALS AND METHODS
Animals, surgery, and tissue processing. A total of 38 male Sprague Dawley rats weighing ∼500 gm were used in this study. Of these, 24 animals received a unilateral transection of the angular bundle; 5 were sham-lesioned and 9 control animals were not operated on. All animals were cared for and treated in strict accordance with institutional and National Institutes of Health guidelines. Animals were anesthetized with 30% chloral hydrate and placed into a Kopf stereotaxic frame. Stereotaxic transections of the perforant path (angular bundle) were made with an extendable Scouten wire knife (Kopf, Tujunga, CA) as described previously (Laping et al., 1994; Schauwecker et al., 1996). The retracted knife was inserted into the brain 1 mm anterior and 6.3 mm lateral to lambda, to a level 5 mm ventral from the surface. The knife was extended 2.5 mm medially, raised 4 mm, and then retracted. This procedure was repeated at a position 1 mm anterior and 5.3 mm lateral to lambda. Five rats received sham lesions at identical coordinates. In these animals, the wire shank was lowered to the same depth as above, but the retracted blade was not extended. For all operated animals, the craniotomy was covered with Gel-foam and the skin and fascia sutured. The lesioned rats were perfused transcardially at 2 (n = 9), 5 (n = 9), and 9 (n = 6) d after surgery, and the shams (n = 5) were perfused 5 d after surgery. All animals were deeply anesthetized with 30% chloral hydrate and perfused transcardially first with ice-cold 1% paraformaldehyde in 0.1m PBS for 1 min, followed by 10 min of cold 4% paraformaldehyde in PBS. The brains were immediately removed, blocked, and post-fixed in cold 4% paraformaldehyde in PBS for 6 hr. Sections from the rostral hippocampus were then cut in a coronal plane on a vibratome at a setting of 50 μm for immunocytochemistry. The rest of the block was cryoprotected in 20% sucrose solution and frozen. Sections (40 μm thick) were cut from the remaining rostral hippocampus on a sliding microtome and stored in 4% paraformaldehyde in PBS at 4°C for in situ hybridization. A caudal block from each animal containing the EC was sectioned in a horizontal plane for cresyl violet staining of the lesion site.
Hippocampal cultures. Hippocampi were dissected from 18-d-old fetal Sprague Dawley rats, and cell cultures were prepared as described previously (Goslin and Banker, 1991). Cells were plated at a density of 50,000 cells per 60 mm plastic Petri dish on poly-l-lysine-coated glass coverslips and co-cultured with a monolayer of cortical astroglia in a sandwich-type configuration, in which neurons and glia are separated by small paraffin dots. Cytosine arabinoside (5 μm) was added to inhibit proliferation of glial cells. Cultures were maintained for up to 4 weeks in modified Eagle’s medium containing N2 supplements, 1 mmsodium pyruvate, and 0.1% ovalbumin.
Immunocytochemistry and histochemistry. One series of sections through the rostral hippocampus of each rat was incubated for 48 hr with a monoclonal antibody (mAB) to NMDAR1 (54.1; 1:250) (Siegel et al., 1994). A second series was incubated for 48 hr with an mAB to synaptophysin (1:10) (Wiedenmann and Franke, 1985). All sections were then washed three times in PBS, transferred to a solution containing biotinylated anti-mouse IgG heavy and light chain (1:200; Vector Laboratories, Burlingame, CA) for 2 hr, washed again in PBS, and transferred to a solution of FITC-conjugated avidin (1:200; Vector Laboratories) for 1 hr. Double-label immunocytochemistry was performed by incubating sections in a solution containing a cocktail of mAB 54.1 (1:250) and a polyclonal antibody to glial fibrillary acidic protein (GFAP) (1:25; Promeda, Foster City, CA) for 48 hr. After three washes, the sections were incubated with biotinylated anti-mouse IgG H&L and Texas red conjugated anti-rabbit IgG H&L for 2 hr and then washed and incubated with FITC-conjugated avidin for 1 hr. Sections were mounted and coverslipped with Vectashield (Vector Laboratories) to reduce fluorescence quenching. Histochemical staining for cytochrome oxidase (CO) activity was performed on a third series of sections according to a protocol described previously (Wong-Riley, 1979). A fourth series of sections through the lesion site were stained with cresyl violet.
In situ hybridization and quantitative analysis. Sections were hybridized with [35S]-labeled sense and antisense cRNA probes that were transcribed from PBS (KS+) containing a cDNA corresponding to the second cytoplasmic loop of the cloned rat NMDAR1 cDNA sequence (Moriyoshi et al., 1991) (gift of Dr. S. Sealfon), using T3 and T7 RNA polymerase. In RNase protection assays, antisense NMDAR1 recognizes a single mRNA of the predicted size (Gore et al., 1996).In situ hybridization was performed as described previously (Benson et al., 1992). Briefly, sections were pretreated with 1 μg/ml proteinase K in 0.1 m Tris and 0.25% acetic anhydride in 0.1 m triethanolamine and washed in saline sodium citrate 2 × (SSC). Sections were preincubated in hybridization buffer (10% dextran sulfate, 50% deionized formamide, 50 × Denhardt’s solution, 0.3 mg/ml herring sperm DNA, 0.15 mg/ml wheat germ tRNA, and 20 mm DTT) for 1 hr at 50°C, then transferred to hybridization solution containing an additional 20 mm DTT and 10,000 cpm/μl [35S]-labeled antisense or sense riboprobes for 24 hr at 50°C. Sections were washed in 4 × SSC with 5 mmDTT, treated in 20 μg/ml ribonuclease A for 30 min at 45°C, and then washed in decreasing concentrations of SSC solutions (2 ×, 0.5 ×, and 0.1 ×) with 5 mm DTT for 30 min each at 60°C. Sections were mounted and exposed to β max hyperfilm (Amersham, Arlington Heights, IL) for 3–7 d. Slides were then dipped in Kodak NTB-2 emulsion (Eastman Kodak, Rochester, NY), diluted 1:1, exposed at 4°C, and developed using Kodak D19. The sections were counterstained with cresyl violet.
In situ hybridization of neuronal cultures was performed as described previously (Kleiman et al., 1990) with [35S]-labeled sense and antisense cRNA probes corresponding to the NMDAR1 cDNA sequence, as described above, as well as with sense and antisense rat β-actin riboprobes that were transcribed from pGEM3Z containing a Sau3A/EcoRI fragment complementary to 387 bp of the 5′ end of rat β-actin cDNA (gift of Dr. J. L. Roberts). Cells were fixed in 4% paraformaldehyde/4% sucrose in PBS and stored in 70% EtOH. Cells were washed briefly in PBS containing 5 mm MgCl2, followed by 0.2m Tris/0.1 m glycine, pH 7.4, then preincubated for 1 hr at 42°C in hybridization buffer consisting of 50% deionized formamide, 0.3 m NaCl, 20 mm Tris, pH 8.0, 5 mm EDTA, 1 × Denhardt’s solution, 10% dextran sulfate, and 10 mm DTT. Each coverslip was incubated overnight at 55°C in 100 μl of hybridization buffer containing 10 mg/ml tRNA and 4 × 10⁶ cpm of probe. After hybridization, coverslips were rinsed in 2 × SSC/10 mm β-mercaptoethanol (BME)/1 mm EDTA, treated with RNase A (2 μg/ml in 500 mm NaCl/10 mm Tris, pH 8) for 30 min at room temperature, washed in 2 × SSC/10 mm BME/1 mm EDTA, and then washed for 2 hr at 55°C in 0.1 × SSC/10 mm BME/1 mm EDTA. Coverslips were rinsed in 0.5 × SSC, dehydrated through graded alcohols, and allowed to dry. For autoradiography, coverslips were mounted on slides and dipped in Kodak NTB-2 emulsion and allowed to expose for 2–4 weeks at 4°C, whereupon they were developed in Kodak D19 developer.
The autoradiographic films of the tissue sections were analyzed by measuring the optical density of hybridization in the OML, the inner molecular layer (IML), and the CA1 stratum radiatum (CA1-sr) field using an automated paint function that covered the region of interest (Imaging Research, Ontario, Canada). Measurements were taken from the contralateral and ipsilateral sides from four sections per animal, three to four animals per group. Optical density analysis of film autoradiograms was identical to that described previously (Gazzaley et al., 1996b). For each animal, an intensity value for each of the three regions (IML, OML, CA1-sr), from both the ipsilateral and contralateral sides, was calculated as the mean of a single value obtained on each of the four sections. A mean value for each of the five groups, from each region, was obtained from the individual animal values. Within-group, side-to-side comparisons were analyzed with paired Student’st tests, at a significance level of <0.05, and across-group comparisons were analyzed with a one-way ANOVA and a Scheffé’spost hoc test, at a significance level of <0.05.
Confocal microscopy and quantitative immunofluorescence analysis.Quantification of NMDAR1 immunofluorescence intensity was performed according to a previously published method (Gazzaley et al., 1996a,b). Briefly, a Zeiss LSM 410 inverted confocal microscope was used to obtain high-magnification fields of regions within the dentate gyrus from five animals per group and three sections per animal, from both the ipsilateral and contralateral sides. All confocal parameters, including brightness and contrast, were kept constant throughout the study. For each section, five fields within the granule cell layer (GCL), the IML (dendritic field immediately distal to the GCL), and the OML (midpoint between the GCL border and the hippocampal fissure) were randomly chosen within a centrally located region of the suprapyramidal blade of the dentate gyrus. Each field was scanned only once to reduce fluorescence quenching and at the same predetermined z-axis distance from the surface of the section. An image analysis program (Zeiss, Thornwood, NY) was used to determine the average pixel intensity within the field, in which the contribution of unlabeled portions of the field were removed by a visually established pixel intensity threshold. Thus, the average pixel intensity of the portion of the field above threshold represented the immunofluorescence intensity within either the cellular processes of the molecular layer or the granule cell bodies. For each animal, an intensity value was then computed from each of the three regions (GCL, IML, OML), from both ipsilateral and contralateral sides, by determining the mean of the 15 individual field values (5 field values obtained from each of three sections). A mean value in all five groups, from each region, was obtained from the individual values determined for each animal. Within-group, side-to-side comparisons were analyzed with paired Student’s t tests at a significance level of <0.05, and across-group comparisons were analyzed with a one-way ANOVA and a Scheffé’s post hoc test, at a significance level of <0.05.
RESULTS
Perforant path transections
To denervate the OML of the dentate gyrus, we performed knife cut transections of the angular bundle. This transection effectively lesions the perforant path arising from both the lateral and the medial EC (Fig. 1A). The extent of the lesion in all animals was determined by evaluating horizontal sections of the EC stained with cresyl violet (Fig. 1A) and coronal sections of the dentate gyrus histochemically stained for cytochrome oxidase (Fig. 1B,C) or processed immunocytochemically for synaptophysin (Fig. 2). Previous studies have revealed that the intensity of CO staining decreased in the OML as early as 16 hr postlesion (Borowsky and Collins, 1989), and the density of terminals containing synaptophysin, an integral membrane glycoprotein of synaptic vesicles, decreases within the OML as early as 2 d postlesion (Masliah et al., 1991). A time course of the NMDAR changes was established by perfusing animals at 2, 5, and 9 d postlesion. Two days corresponds to the time of maximal deafferentation (Matthews et al., 1976), 5 d to the onset of terminal proliferation (Steward and Vinsant, 1983), and 9 d to onset of new synapse formation (Steward and Vinsant, 1983). In all animals used in this study, the extent of the transection and the effects on the dentate gyrus as determined by CO and synaptophysin staining were consistent. The ipsilateral (lesioned) dentate gyrus of rats evaluated at 2, 5, and 9 d postlesion exhibited massive synapse loss in the OML, as revealed by a decrease in the number of synaptophysin-positive puncta (Fig.2G,K,O) and a prominent decrease in the intensity of CO staining in this lamina (Fig.1B, asterisk). In contrast, the patterns of synaptophysin and CO staining in the contralateral (unlesioned) dentate gyrus of all animals were indistinguishable from those in the dentate gyrus of unoperated and sham-lesioned control animals (Fig.2A,E,I,M).
Fig. 1.
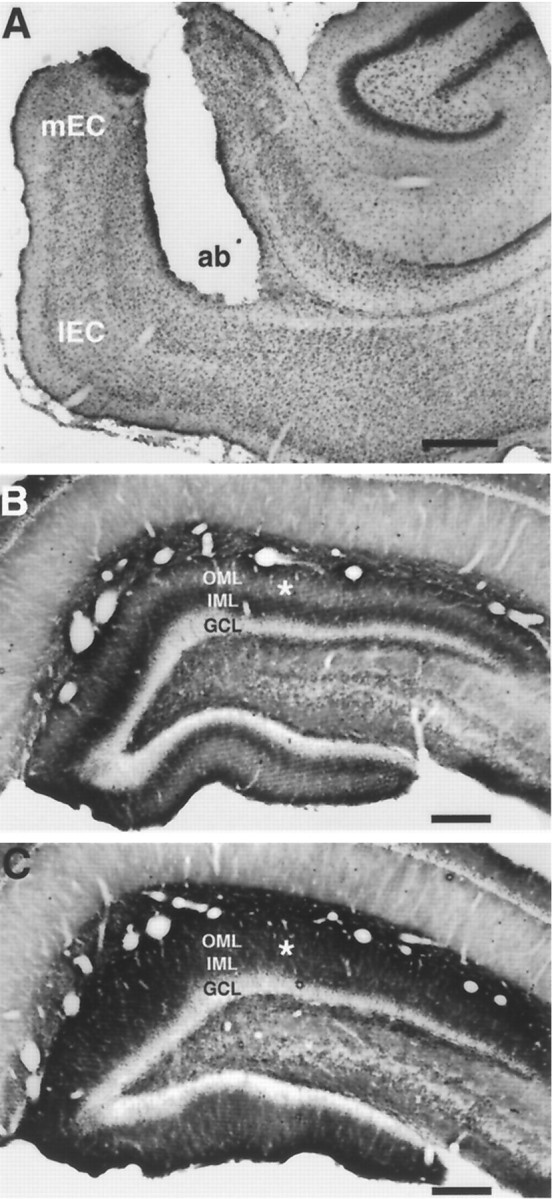
Photomicrographs of representative sections through the entorhinal cortex (A) and dentate gyrus (B, C) of a rat examined 5 d postlesion. A, Horizontal Nissl-stained section showing the extent of the lesion of the angular bundle (ab), which transects the perforant path arising from both the medial (mEC) and lateral (lEC) entorhinal cortex. B, C, Coronal CO-stained sections through the ipsilateral (B) and contralateral (C) sides. Note the decreased intensity of staining in the OML (asterisks) on the side ipsilateral to the lesion (B) in comparison with that of the OML of the contralateral side (C).OML, Outer molecular layer; IML, inner molecular layer; GCL, granule cell layer. Scale bars:A, 500 μm; B, C, 250 μm.
Fig. 2.

Digitized confocal microscopic images of NMDAR1 (B, D, F,H, J, L, N,P) and synaptophysin (SYN;A, C, E, G,I, K, M, O) immunofluorescence in the dentate gyri of an unoperated control animal (Ctrl, A–D) and animals examined 2 (E–H), 5 (I–L), and 9 (M–P) d postlesion. The series on the left represent fields from the nonlesioned, contralateral side; the series on theright represent fields from the lesioned, ipsilateral side. Note that the pattern of synaptophysin-positive puncta is uniform across the entire molecular layer (OML andIML) in both sides of the control animal (A, C) and in the contralateral side of the 2 d (E), 5 d (I), and 9 d (M) animals. In contrast, an overt decrease in synaptophysin immunofluorescence is evident in the OML compared with the IML on the ipsilateral side in the 2 d (G), 5 d (K), and 9 d (O) animals. NMDAR1 immunofluorescence is relatively uniform throughout the entire molecular layer (OML andIML) in the control animal (B,D) and the contralateral side of all the lesioned animals (F, J, N). In the 2 d postlesion animal, a similar, homogeneous pattern is evident across the molecular layer on the ipsilateral side (H). In contrast, an overt increase in the immunofluorescence intensity of the OML compared with the IML is apparent in the ipsilateral side of the animals 5 (L) and 9 d (P) postlesion. Scale bar, 30 μm.
Qualitative evaluation of NMDAR1 immunofluorescence
NMDAR1 immunofluorescence in the dentate gyri of unoperated and sham-lesioned controls was intense in the granule cell somata and their dendrites throughout the entire extent of the molecular layer, whereas nuclei were unstained (Fig. 2B,D). The intensity of immunofluorescence was slightly elevated in the IML relative to the OML (Fig. 2B,D). These observations are consistent with previous descriptions of NMDAR1 immunostaining in the rat dentate gyrus (Petralia et al., 1994). In animals killed 2 d postlesion, the intensity of staining across the ipsilateral molecular layer (Fig. 2H) appeared identical to that observed in the contralateral molecular layer (Fig.2F) or in comparison with the molecular layer of the control animals (Fig. 2B,D). However, at both 5 and 9 d postlesion, there was an overt increase in the staining intensity of processes in the ipsilateral OML relative to the ipsilateral IML (Fig. 2L,P). The immunofluorescence intensity at 5 and 9 d postlesion across the contralateral molecular layer (Fig.2J,N) did not appear different from the pattern in control animals (Fig.2B,D). To verify the qualitative impressions of NMDAR1 immunofluorescence intensity changes, we performed a series of quantitative evaluations of the same animals.
Quantitative evaluation of NMDAR1 immunofluorescence: within-group comparisons of ipsilateral versus contralateral regions
Given previous evidence that shrinkage occurs within the denervated region of the molecular layer (Caceres and Steward, 1983), the impression of an intensity increase in the OML could be the result of either an increase in the density of dendrites with normal staining or an actual increase in the staining intensity within individual dendrites. To distinguish between these two possibilities, we determined quantitatively the average immunofluorescence intensity within individual cellular profiles using high-magnification confocal images of the IML and OML. The intensity values obtained are thus independent of area, and the negative contribution of unlabeled portions of the field was subtracted by establishing a pixel intensity threshold (see Materials and Methods) (Gazzaley et al., 1996a,b). Within-group comparisons of comparable regions in the ipsilateral versus contralateral dentate gyrus were performed, because the contralateral OML receives a very limited crossed projection from the opposite EC (Steward et al., 1976) and is thus only subtly deafferented by this lesion (Davis et al., 1988). A series of paired Student’st tests of the ipsilateral OML versus the contralateral OML revealed no difference between sides in either control group (sham and unoperated groups) or the group of animals 2 d postlesion, although in the 2 d postlesion animals, there was a trend toward an increase in the ipsilateral side. In contrast, statistically significant increases in the staining intensity of the ipsilateral OML was evident at both 5 and 9 d postlesion in comparison with the respective contralateral OML. Such changes were specific to the denervated OML, because comparisons of the ipsilateral IML versus the contralateral IML in control groups and all of the lesioned groups demonstrated no significant differences in intensity levels. Comparisons of the immunofluorescence intensity within granule cell somata revealed an increase in the ipsilateral side relative to the contralateral side at 5 and 9 d postlesion but no differences at the earlier time point or in control groups. Thus, the only significant differences in the intensity of NMDAR1 immunofluorescence between sides was an intensity increase in the OML and granule cell bodies at 5 and 9 d postlesion in the denervated ipsilateral side.
To verify the change in the ipsilateral OML, we compared the ratios of the intensity of the OML/IML between the ipsilateral and contralateral sides for all groups. The staining intensity value of the IML serves as a nonvarying denominator, because ipsilateral versus contralateral comparisons revealed no significant differences in IML intensity levels between the sides in any group. In agreement with comparisons of the absolute intensity values (see above), comparisons of the OML/IML ratios revealed a significant increase in the ipsilateral OML/IML ratio compared with the contralateral OML/IML ratio at 5 and 9 d postlesion, whereas no change was observed in either control group or the 2 d postlesion group (Fig. 3).
Fig. 3.

Bar graphs comparing ratios of NMDAR1 immunofluorescence intensity values of the OML/IML in unoperated (Control), sham, 2 d, 5 d, and 9 d postlesion groups. Statistical comparisons were performed both within groups (ipsilateral vs contralateral sides; Student’s unpairedt test) and across groups (ANOVA and Scheffé’s test). Statistical analyses revealed that ipsilateral OML/IML ratios of both the 5 and the 9 d group were significantly increased (asterisks; p < 0.05) compared with either the corresponding contralateral OML/IML ratios (within-group comparisons) or each of the ipsilateral ratios from the control, sham, and 2 d groups (across-group comparisons). There were no other statistically significant differences either between contralateral and ipsilateral sides or for either side compared across the groups. Note that the quantitative data expressed here and in Figure 7 are ratios that reflect relative differences in mRNA and protein levels and not absolute concentrations. Values represent the mean ± SEM of 5 rats per group (30 measurements per rat).
Quantitative evaluation of NMDAR1 immunofluorescence: across-group comparisons
To compare the NMDAR1 immunofluorescence intensity in the OML between lesioned and control groups and between the lesioned groups at different time points after lesioning, the ratios of the intensity of the OML/IML were used. Statistical analyses (ANOVA and post hocScheffé’s test) of the ipsilateral OML/IML intensity ratios demonstrated that both the 5 and 9 d groups were significantly increased compared with either control group or the 2 d group, but were not significantly different from one another (Fig. 3). The OML/IML ratios of the control groups and the 2 d postlesion group were also not significantly different from each other (Fig. 3). Such changes were specific for the lesioned side, because comparisons of the contralateral OML/IML ratios revealed no differences across any of the groups. Thus, the immunofluorescence intensity in the ipsilateral OML of the 5 and 9 d postlesion groups is not only elevated in comparison with the contralateral OML (see above) but also relative to the OML of the control groups, whereas no significant differences are detectable in the 2 d postlesion group in either within-group (ipsilateral vs contralateral) or across-group comparisons (Fig. 3). These quantitative data are thus consistent with the qualitative observations reported above and demonstrate that the visual impression of an intensity increase in the denervated OML arises from an actual increase in the staining intensity within individual cellular profiles.
Determining the contribution of NMDAR1 immunoreactive astrocytes to immunofluorescence intensity measurements
To evaluate the presence of NMDAR1 in astrocytes of the dentate gyrus, as well as their potential contribution to intensity changes, we simultaneously immunolabeled sections from control and lesioned brains using antibodies to NMDAR1 and GFAP. Confocal microscopy revealed that astrocytes within the molecular layer of the contralateral and ipsilateral sides were immunoreactive for NMDAR1. Qualitative confocal laser scanning microscopic evaluation of the contralateral OML of lesioned animals and the OML of control animals revealed that the intensity of NMDAR1 immunofluorescence within GFAP-labeled astrocytes was either equivalent to or greater than the intensity of the surrounding dendritic profiles (Fig.4A,B). In contrast, NMDAR1 immunofluorescence intensity within astrocytes in the ipsilateral OML of lesioned animals was sometimes equivalent, but often less intensely stained, than surrounding dendrites (Fig.4C,D). This reveals that any contribution to NMDAR1 immunofluorescence intensity levels by astrocytes would actually decrease the average intensity measurement of the profiles in the ipsilateral OML. In addition, NMDAR1 immunoreactive processes that were GFAP-negative (i.e., dendrites) could be followed from the IML to the OML, whereupon crossing this border, the immunofluorescence intensity would increase (Fig. 4E). Thus, although we have not assessed whether there is an overall change in NMDAR1 immunofluorescence intensity within the astrocytes in response to lesion, we are confident that the intensity alterations we report here are occurring within the granule cell dendrites.
Fig. 4.

Pairs of digitized confocal microscope images taken through the OML of the contralateral (A,B) or ipsilateral (C, D) side from a rat examined 5 d postlesion showing NMDAR1-immunoreactive astrocytes identified by double-labeling immunofluorescence for GFAP (red, A,C) or NMDAR1 (green,B, D). In the contralateral OML field (A, B), the intensity of NMDAR1 immunofluorescence in the processes of astrocytes (arrows) is equivalent to, or greater than, the staining intensity of the surrounding dendrites. In contrast, in the ipsilateral (lesioned) OML field (C, D), the intensity of NMDAR1 immunofluorescence in processes of astrocytes (arrows) is much less in comparison with that of the surrounding dendrites. Asterisks denote the corresponding positions of astrocytic nuclei in each pair.E, Image showing section spanning the ipsilateral molecular layer (IML and OML) taken from the same 5 d postlesion animal. In this image, immunofluorescence for both GFAP (red) and NMDAR1 (green) is shown simultaneously. Note a greater intensity of NMDAR1 immunofluorescence in GFAP-negative processes (i.e., dendrites) in the OML compared with the IML. A single NMDAR1-labeled dendrite (arrows) can be followed continuously from the IML into the OML, where the intensity of the NMDAR1 immunofluorescence increases. Scale bar, 10 μm.
Qualitative evaluation of NMDAR1 mRNA hybridization intensity
In both control and lesioned animals, an intense NMDAR1 mRNA hybridization signal was localized over the somata of the dentate gyrus granule cells and the pyramidal cells of the CA fields, as has been described previously in rat brain (Moriyoshi et al., 1991). In both unoperated and sham-lesioned controls, a very light hybridization signal was observed across the molecular layer of the dentate gyrus and the stratum radiatum of the CA fields, which could be attributed to either very low levels of dendritic mRNA or labeling of astrocytes (Fig. 5C). In animals 2 d postlesion, an identical hybridization pattern was evident in both the ipsilateral and contralateral dentate gyrus. At 5 and 9 d postlesion, however, an increased hybridization signal for NMDAR1 mRNA intensity was apparent over the entire dentate gyrus molecular layer of the side ipsilateral to the lesion (Fig. 5B). By contrast, the stratum radiatum of the CA field (Fig. 5B) and the contralateral dentate gyrus molecular layer (Fig. 5A) appeared unchanged relative to control animals (Fig. 5C). Additionally, at 5 and 9 d postlesion, a subtle increase in mRNA hybridization intensity in the stratum lacunosum moleculare of CA1 was observed in the ipsilateral side (Fig. 5B) relative to the contralateral side (Fig.5A). On emulsion-dipped slides counterstained with cresyl violet, clusters of silver grains indicating the presence of probe hybridized to NMDAR1 mRNA were concentrated over neurons (identified by their lightly stained nuclei) throughout the granule and pyramidal cell layers. In the dentate gyrus molecular layers of both control and lesioned animals, a small number of darkly stained nuclei, indicative of glial cells, were also overlain by clusters of silver grains (Fig.5D). However, in the dentate gyrus molecular layer ipsilateral to the perforant path lesion, the majority of the silver grains were diffusely distributed throughout the neuropil, occupying the spaces lying between such darkly Nissl-stained and more lightly stained nuclei (Fig. 5D), suggesting that NMDAR1 mRNA is present within dendrites.
Fig. 5.
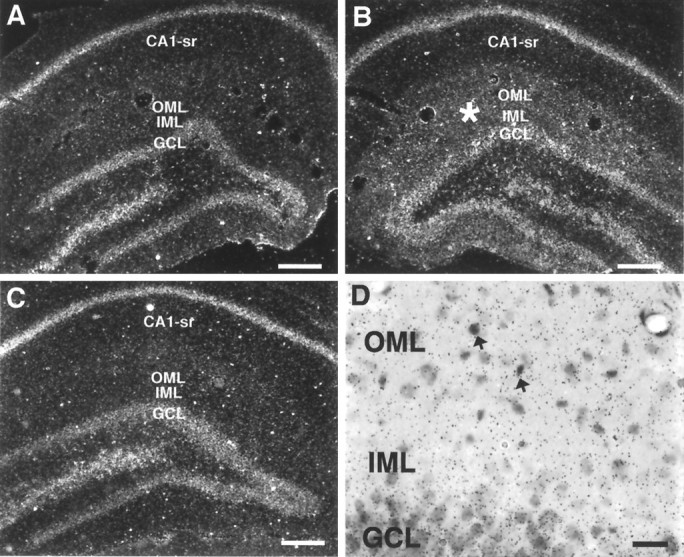
Photomicrographs showing cRNA probe hybridization to NMDAR1 mRNA in sections through the contralateral (A) and ipsilateral (B, D) side of the hippocampus in a rat examined 5 d postlesion, or through one side of a control animal (C). In dark-field images (A–C), note the greater hybridization intensity of both the OML and IML (asterisk) in the ipsilateral side (B) relative to the contralateral side (A) or the control animal (C). D, Higher-magnification bright-field image of a section through the molecular layer, counterstained with cresyl violet. Clustered silver grains overlay darkly Nissl-stained glia (arrows). Silver grains were also diffusely localized throughout the neuropil of the molecular layer, overlying spaces between labeled nuclei.CA1-sr, CA1 stratum radiatum. Scale bars:A–C, 250 μm; D, 25 μm
To verify the subcellular, and possibly dendritic, distribution of NMDAR1 mRNA, in situ hybridization histochemistry was performed on rat hippocampal neurons grown in culture. When grown at low density, the cell somata and dendrites can be clearly distinguished. In emulsion autoradiograms of cultures hybridized with antisense NMDAR1 mRNA, label was distributed in neuronal somata and throughout dendritic trees (Fig.6A,B). Not every dendritic tree was labeled to the same extent, and every branch was not labeled equally. By contrast, label showing hybridization of antisense actin mRNA was confined to neuronal somata (Fig.6C,D). In addition to labeled neurons, both actin and NMDAR1 mRNAs were expressed in astrocytes (data not shown). Sense strand controls showed no label above background.
Fig. 6.
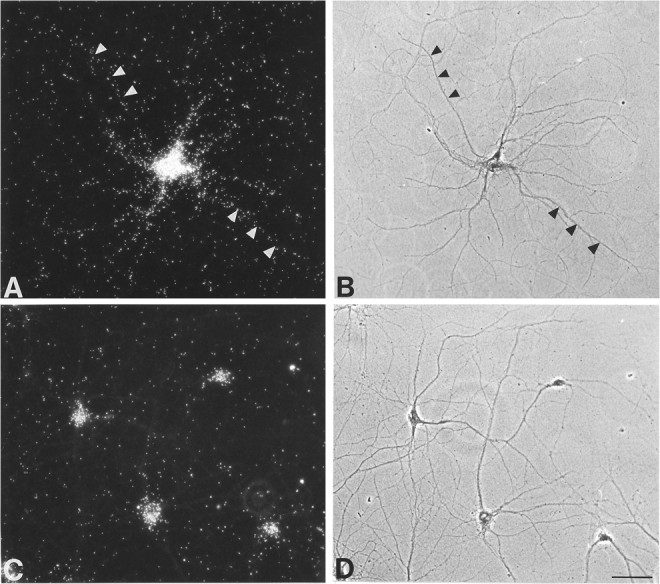
Pairs of photomicrographs showing cRNA probe hybridization to NMDAR1 mRNA (A) or actin mRNA (C) in cultured rat hippocampal neurons visualized under dark-field (A, C) or phase-contrast optics (B, D). NMDAR1 mRNA hybridization is evident within neuronal somata and along dendrites, two of which are shown by arrowheads. Actin mRNA is confined to the neuronal somata (C). Scale bar, 50 μm.
Quantitative evaluation of NMDAR1 mRNA hybridization intensity: within-group comparisons of ipsilateral versus contralateral regions
Differences in hybridization patterns observed in the film autoradiograms were investigated quantitatively by densitometric analysis. Intensity levels were measured in the dentate gyrus OML, IML, and CA1-sr. Somatic layers were not analyzed, because hybridization levels frequently exceeded the linear range of the film. Within-group, ipsilateral versus contralateral molecular layer comparisons revealed an increase in hybridization intensity 5 d postlesion within the ipsilateral OML and IML compared with the contralateral OML and IML, respectively. There was no change detected in the CA1-sr at this time point. In contrast to the increases in the ipsilateral IML and OML detected at 5 d postlesion, analysis of both control groups and the 2 and 9 d postlesion groups revealed no differences in hybridization intensity levels in the OML, IML, or CA1-sr between ipsilateral and contralateral sides. However, in the 9 d postlesion group, there was a trend toward an increased hybridization intensity in the ipsilateral OML and IML relative to the contralateral side.
To further evaluate changes in the OML and IML hybridization intensity between sides, intensity ratios of OML/CA1-sr and IML/CA1-sr were used, because the CA1-sr intensity level did not change between sides at any time point (see above) and, therefore, serves as a nonvarying denominator. This analysis confirmed an increase in both the OML and the IML of the ipsilateral side as compared with the contralateral side at 5 d postlesion, with no change in the control groups or the 2 d postlesion group (Fig.7A,B). However, comparisons of the OML/CA1-sr and IML/CA1-sr ratios between the ipsilateral and contralateral sides at 9 d postlesion revealed a statistically significant increase (Fig.7A,B), suggesting that a change affecting both the OML and the IML is indeed occurring 9 d postlesion. Although there was a nonsignificant trend toward increased intensity levels of the ipsilateral OML and IML at 9 d when the absolute intensity values of the ipsilateral and contralateral sides were compared (see above), it is likely that the use of a nonvarying denominator in the ratio comparisons decreased the variability and, thus, revealed a change occurring at 9 d postlesion.
Fig. 7.
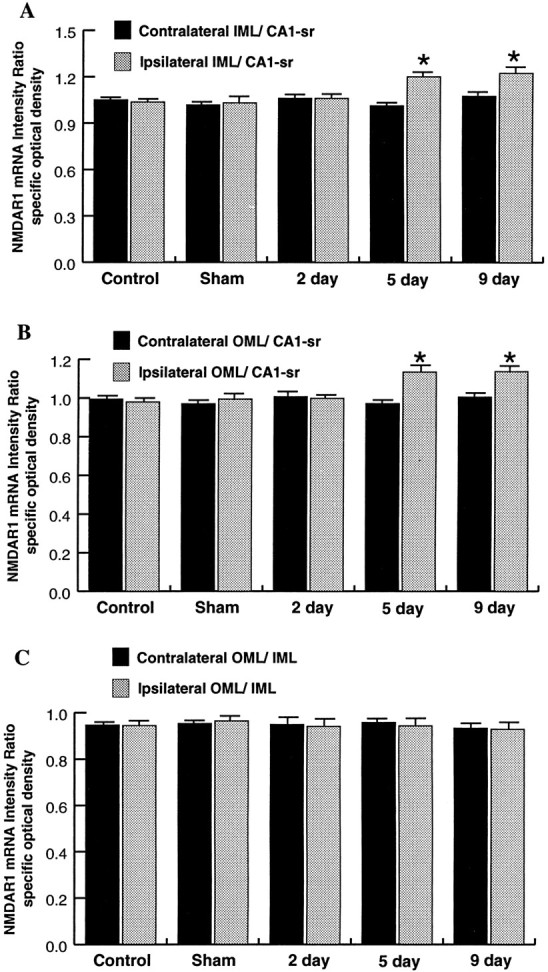
Bar graphs comparing ratios of NMDAR1 mRNA hybridization intensity values of the IML/CA1-sr (A), the OML/CA1-sr (B), and the OML/IML (C) for all control and lesioned groups. Statistical comparisons were performed both within groups (ipsilateral vs contralateral sides; Student’s unpaired t test) and across groups (ANOVA and Scheffé’s test). Comparisons of either the IML/CA1-sr (A) or the OML/CA1-sr (B) ratios showed that the ipsilateral values at 5 and 9 d (asterisks, p < 0.05) are increased compared either with the corresponding contralateral side (within-group comparisons) or with any of the ipsilateral ratios of the other groups (across-group comparisons). There were no other statistically significant differences, either between contralateral and ipsilateral sides of the same groups or for comparisons of corresponding sides across groups. Additionally, there were no statistically significant differences in the OML/IML ratios (C) in either within-group or across-group comparisons. Values represent the mean ± SEM for four rats.
Quantitative evaluation of NMDAR1 mRNA hybridization intensity: across-group comparisons
To compare NMDAR1 mRNA hybridization intensity levels in the OML and IML across groups, the OML/CA1-sr and IML/CA1-sr ratios were used. Analysis of the ipsilateral ratios revealed an increase of both the OML/CA1-sr and the IML/CA1-sr ratios at 5 and 9 d postlesion compared with either control group or the 2 d postlesion group (Fig. 7A,B). Additionally, the ratios were not significantly different from one another at 5 and 9 d or among the controls and the 2 d group (Fig.7A,B). A similar analysis using ratios taken from the side contralateral to the lesion demonstrated no differences across the OML/CA1-sr or the IML/CA1-sr ratios for any of the groups analyzed (Fig. 7A,B). Thus, at 5 and 9 d postlesion, the hybridization intensity of the ipsilateral OML and IML increases compared with the contralateral OML and IML (see above) (within-group comparisons) and the OML and IML of control animals.
Additional statistical analyses demonstrated no difference in the OML/IML ratios at any postlesion time point for either within-group comparisons or across-group comparisons (Fig. 7C), revealing that postlesion increases in hybridization intensity levels of the OML and IML were of similar magnitude and, therefore, did not produce a differential pattern of hybridization intensity across the molecular layer as was evident for NMDAR1 immunofluorescence.
DISCUSSION
The objective of this study was to investigate cellular and molecular mechanisms underlying NMDA receptor plasticity in response to denervation and subsequent synaptic reorganization. There were three principal findings based on quantitative immunofluorescence andin situ hybridization methods for localizing NMDAR1 to dentate gyrus granule cells after transection of the perforant path. First, changes in NMDAR1 immunofluorescence intensity and mRNA hybridization levels were evident only on the side ipsilateral to the lesion and occurred with a similar time course. Second, perforant path transection induced an overt increase in immunofluorescence intensity within dentate gyrus granule cell somata and the portion of their distal dendrites that lay within the denervated OML, although we cannot rule out an additional contribution by changing intensity levels in astrocytes. Third, lesion-induced changes in NMDAR1 mRNA hybridization levels were manifested by the novel appearance of significant hybridization throughout the full extent of the dentate gyrus molecular layer, which, when combined with correlative mRNA localization studies of cultured hippocampal neurons, suggest that NMDAR1 mRNA is a member of a limited population of mRNAs that can be localized within dendrites. Thus, these data indicate that NMDAR1 mRNA and protein exhibit spatially distinct patterns of lesion-induced changes, which suggests that whereas mRNA transport increases throughout the entire dendritic extent, cellular mechanisms exist that control the intradendritic distribution or modification of NMDAR1 protein within a limited region of dendrites whose afferent activity is perturbed. Such mechanisms may include local protein synthesis and increased dendritic protein transport. Finally, the time course of such changes suggests that NMDAR1 regulation may be more intimately related to the period of terminal proliferation and synaptogenesis than to the earlier period of terminal degeneration.
Localization of NMDAR1 mRNA within dendrites
The present data suggest that NMDAR1 mRNA is one of a select population of mRNAs that is translocated into dendrites. Others of this kind include MAP2 (Garner et al., 1988), the α-subunit of CaM kinase II (Burgin et al., 1990; Benson et al., 1992), Arc (Link et al., 1995;Lyford et al., 1995), and the inositol 1,4,5-triphosphate receptor (Furuichi et al., 1993). A previous single cell PCR study has shown that NMDAR1 mRNA is present within dendrites (Miyashiro et al., 1994), which is consistent with results showing clear dendritic localization of NMDAR1 mRNA within dendrites of cultured hippocampal neurons (Benson 1997; present study). However, previous localization studies in vivo have not shown any evidence of a dendritic distribution (Moriyoshi et al., 1991; Laurie and Seeburg, 1994). This discrepancy most likely reflects very low basal levels of dendritic NMDAR1 mRNA, which become suprathreshold for overt detectability after perforant path lesion.
NMDAR1 mRNA hybridization was also visualized within astrocytes bothin vivo and in vitro, suggesting that the lesion-induced increase in hybridization intensity may have been partially attributable to changes within astrocytes. It has been demonstrated previously that EC lesions induce astrocyte hypertrophy within the molecular layer that is largely confined to the denervated OML (Jensen et al., 1994). However, the striking increase in NMDAR1 mRNA hybridization levels throughout the full extent of the molecular layer after perforant path transection and the diffuse distribution of numerous silver grains throughout the neuropil suggest a major contribution to such increases by granule cell dendrites. However, we cannot exclude the possibility of an accompanying change in mRNA hybridization levels within astrocytes, which may be the basis for the apparent increase in CA1 stratum lacunosum moleculare.
Potential mechanisms underlying protein and mRNA alterations
Both NMDAR1 protein and mRNA changes were first detected at 5 d postlesion, which suggests that such initial changes may have been induced by terminal proliferation, since this time point is before the major onset of new synapse formation (Steward and Vinsant, 1983). Terminal proliferation may induce receptor changes through the release of diffusable elements, since certain soluble factors produced by CNS tissue have been demonstrated to increase the number of acetylcholine receptors and promote clustering in muscle fibers (Jessell et al., 1979; Schaffner and Daniels, 1982). Such increases were maintained through at least 9 d postlesion, which is during the early period of reactive synaptogenesis. Thus, a longer time course will be pursued in future studies to evaluate whether receptor levels return to control levels after the majority of synapses have been replaced. However, preliminary observations on two animals revealed that receptor levels remain elevated 17 d postlesion (A. Gazzaley, D. Benson, G. Huntley, and J. Morrison, unpublished observations). A previous autoradiographic study of ligand binding to the NMDAR in the dentate gyrus after EC lesioning also detected an increase in binding levels in the OML of the ipsilateral side, but only after 21 d postlesion and not limited to the ipsilateral OML (Ulas et al., 1990). The discrepancy in the time course may represent a difference in the sensitivity of the techniques used and/or differential changes affecting other NMDAR subunits (e.g., 2A–D). It is also possible that the observed changes in immunofluorescence and hybridization levels may represent a response to denervation, which was either delayed or did not attain a magnitude sufficient to be detected by the techniques used, at 2 d postlesion.
NMDAR1 immunofluorescence is primarily a reflection of the cytoplasmic pool of the NMDAR1 subunit protein within the dendrites and soma. Immunoelectron microscopic analyses of NMDAR1 immunolabeling in hippocampal and neocortical pyramidal neurons have revealed dense patches of NMDAR1 labeling throughout the somatodendritic cytoplasm often associated with microtubules, rough endoplasmic reticulum, and the Golgi apparatus, suggesting that the cytoplasmic patches of labeling may represent the synthesis and transport pools of the protein (Huntley et al., 1994; Petralia et al., 1994). The increases in NMDAR1 immunofluorescence intensity may represent increases in protein concentration primarily within these cytoplasmic pools, because a previous study has demonstrated that immunofluorescence intensity is a reflection of protein concentration (Good et al., 1992). It is likely, although still speculative, that such changes reflect increases in synaptically localized receptors, because previous studies using this lesion paradigm have revealed subsequent increases in NMDAR ligand binding (Ulas et al., 1990).
Previous studies, along with the findings presented in this paper, suggest that the increase in NMDAR1 immunofluorescence within the OML of the lesioned side is at least partially the result of increased local protein synthesis of the NMDAR1 subunit within the denervated dendritic segments of the molecular layer. Electron microscopy has shown that granule cell dendrites contain polyribosomes, which are located predominantly under the base of dendritic spines (Steward and Levy, 1982) and which are in association with membranous cisterns that may represent the functional equivalent of rough endoplasmic reticulum (Steward and Reeves, 1988). A study of synaptodendrosomes, subcellular fractions of pinched-off axon terminals and dendrites, revealed incorporation of radiolabeled amino acids in newly synthesized proteins, some of which become incorporated as components of the synaptic membrane (Rao and Steward, 1991). Interestingly, one such synaptic membrane protein had a molecular weight of 116 kDa, equivalent to that of NMDAR1 found within synaptic plasma membrane fractions (Brose et al., 1993). Most convincingly, Torre and Steward (1996)demonstrated recently that dendrites isolated from their parent cell body can both synthesize and glycosylate proteins, a necessary step in the post-translational processing of membrane-spanning neurotransmitter receptors (Torre and Steward, 1992, 1996). Thus, taken together, these data establish the presence of protein synthetic and processing machinery within dendrites.
Local protein synthesis may be important during synaptic plasticity resulting from alterations in afferent drive (Steward and Levy, 1982), which is supported by an increased incidence of polyribosomes beneath dendritic spines within the denervated dendritic segments of the dentate gyrus after EC lesioning (Steward, 1983). Additionally, increases in ribosomal RNA (Philips et al., 1987) and in the incorporation of radiolabeled amino acids (Fass and Steward, 1983;Philips et al., 1987) occur exclusively within the denervated OML. The time course of such observations are maximal during the period of terminal proliferation and occur exclusively within the OML, which coincides with the increase in NMDAR1 immunofluorescence observed in the present study and, thus, supports the idea that a lamina-specific increase in NMDAR1 protein might result in part from increased local protein synthesis. In support of this hypothesis, a recent study demonstrated that growth factor-induced synaptic plasticity is dependent on local protein synthesis (Kang and Schuman, 1996). It is also possible that the increased intensity in the denervated lamina may be the result of increased transport of NMDAR1 protein synthesized in the soma, since immunofluorescence intensity increased in granule cell somata at 5 and 9 d postlesion.
Unlike NMDAR1 immunofluorescence, NMDAR1 mRNA hybridization levels increased throughout the full extent of the molecular layer after perforant path transection. Similarly, EC lesions do not differentially affect the distribution across the molecular layer of two other dendritic mRNAs, those encoding MAP2 (Steward and Wallace, 1994) and αCAMKII (Benson et al., 1992; Steward and Wallace, 1994). Likewise, LTP induction in the perforant path induces an increase in dendritic Arc mRNA (Link et al., 1995; Lyford et al., 1995) and αCAMKII mRNA (Thomas et al., 1994b) equally in both the IML and the OML. Thus, although the activation of the protein synthetic machinery may be specific for isolated postsynaptic zones that have been deafferented, the increase in mRNA hybridization appears to be broadly distributed throughout the entire dendrite. Increased levels of mRNA in the dendrites may be the result of an increased rate of dendritic transport or by an alteration in mRNA stability. It is also possible that the observed increase in hybridization intensity reflects changes in the accessibility of the probe to the mRNA.
Functional significance
Both physiological (Reeves and Steward, 1988) and behavioral recovery (Loesche and Steward, 1977; Reeves and Smith, 1987) from unilateral EC lesions have been documented to occur during the time period examined. From these studies, it was hypothesized that the early phase of physiological recovery, before the major onset of new synapse formation, may be the result of an increase in the number of receptors, producing an increase in the activity of surviving synapses similar to denervation supersensitivity in muscle fibers (Reeves and Steward, 1988). The present data support this hypothesis by suggesting that increases in the concentration of NMDARs, and possibly other GluR subtypes (Geddes et al., 1985; Ulas et al., 1990), may facilitate this early return of function. Findings suggest that the initial establishment of long-term facilitation in Aplysia involves a redistribution of the reserve pool of excitatory amino acid receptors to supply newly formed synaptic sites, whereas later stages may require increased protein synthesis of receptors to replenish the reserve pool (Trudeau and Castellucci, 1995).
The results of this study are consistent with our initial hypothesis that NMDAR1 protein and mRNA levels are modifiable by changes in afferent activity. It is likely that the response of selectively modulating receptor concentrations within the dendrites is not limited to overt experimental manipulations such as lesions, but is a standard, albeit more subtle, component of the postsynaptic response to modifications in afferent activity that occur during normal brain functioning and synaptic plasticity.
Footnotes
This work was supported by the Charles A. Dana Foundation, the Alexander and Alexandrine Sinsheimer Foundation, National Institutes of Health Grants AG06647 (J.H.M.) and NS34659 (G.W.H.), and National Science Foundation Grant IBN-9419900 (D.L.B.). A.H.G. is a Dana Scholar. We thank Dr. Nancy Weiland from Rockefeller University for assistance with image analysis of in situ hybridization autoradiograms.
Correspondence should be addressed to Dr. J. H. Morrison, Fishberg Research Center for Neurobiology, The Mount Sinai School of Medicine, Box 1065, One Gustave L. Levy Place, New York, NY 10029-6574.
REFERENCES
- 1.Benson DL (1997) Dendritic compartmentalization of an NMDA receptor mRNA in cultured hippocampal neurons. NeuroReport, in press. [DOI] [PubMed]
- 2.Benson DL, Gall CM, Isackson PJ. Dendritic localization of type II calcium calmodulin-dependent protein kinase mRNA in normal and reinnervated rat hippocampus. Neuroscience. 1992;46:851–857. doi: 10.1016/0306-4522(92)90189-9. [DOI] [PubMed] [Google Scholar]
- 3.Bessho Y, Nawa H, Nakanishi S. Selective up-regulation of an NMDA receptor subunit mRNA in cultured cerebellar granule cells by K+-induced depolarization and NMDA treatment. Neuron. 1994;12:87–95. doi: 10.1016/0896-6273(94)90154-6. [DOI] [PubMed] [Google Scholar]
- 4.Bliss TVP, Collingridge GL. A synaptic model of memory: long-term potentiation in the hippocampus. Nature. 1993;361:31–39. doi: 10.1038/361031a0. [DOI] [PubMed] [Google Scholar]
- 5.Bliss TVP, Lømo T. Long-lasting potentiation of synaptic transmission in the dentate area of the anesthetized rabbit following stimulation of the perforant path. J Physiol (Lond) 1973;232:331–356. doi: 10.1113/jphysiol.1973.sp010273. [DOI] [PMC free article] [PubMed] [Google Scholar]
- 6.Borowsky IW, Collins RC. Histochemical changes in enzymes of energy metabolism in the dentate gyrus accompany deafferentation and synaptic reorganization. Neuroscience. 1989;33:253–262. doi: 10.1016/0306-4522(89)90204-2. [DOI] [PubMed] [Google Scholar]
- 7.Brose N, Gasic GP, Vetter DE, Sullivan JM, Heinemann SF. Protein chemical characterization and immunocytochemical localization of the NMDA receptor subunit NMDAR1. J Biol Chem. 1993;268:22663–22671. [PubMed] [Google Scholar]
- 8.Burgin KE, Waxham MN, Rickling S, Westgate SA, Mobley WC, Kelly PT. In situ hybridization histochemistry of Ca2+/calmodulin-dependent protein kinase in developing rat brain. J Neurosci. 1990;10:1788–1798. doi: 10.1523/JNEUROSCI.10-06-01788.1990. [DOI] [PMC free article] [PubMed] [Google Scholar]
- 9.Caceres A, Steward O. Dendritic reorganization in the rat denervated dentate gyrus of the rat following entorhinal cortical lesions: a Golgi and electron microscopic analysis. J Comp Neurol. 1983;214:387–403. [Google Scholar]
- 10.Davis L, Vinsant SL, Steward O. Ultrastructural characterization of synapses of the crossed temporodentate pathway in rats. J Comp Neurol. 1988;267:190–202. doi: 10.1002/cne.902670204. [DOI] [PubMed] [Google Scholar]
- 11.Fass B, Steward O. Increases in protein-precursor incorporation in the denervated neuropil of the dentate gyrus during reinnervation. Neuroscience. 1983;3:653–664. doi: 10.1016/0306-4522(83)90181-1. [DOI] [PubMed] [Google Scholar]
- 12.Frank E, Gautvik K, Sommerschild H. Cholinergic receptors at denervated mammalian motor end-plates. Acta Physiol Scand. 1975;95:66–76. doi: 10.1111/j.1748-1716.1975.tb10026.x. [DOI] [PubMed] [Google Scholar]
- 13.Friedman LK, Pellegrini-Giampietro DE, Sperber EF, Bennet MVL, Moshe SL, Zukin SR. Kainate-induced status epilepticus alters glutamate and GABA’A receptor gene expression in adult rat hippocampus: an in situ hybridization study. J Neurosci. 1994;14:2697–2707. doi: 10.1523/JNEUROSCI.14-05-02697.1994. [DOI] [PMC free article] [PubMed] [Google Scholar]
- 14.Furuichi T, Samon-Chazottes D, Fujino I, Yamada N, Hasegawa M, Miyawaki A, Yoshikawa S, Guenet J-L, Mikoshiba K. Widespread expression of inositol 1,4,5-triphosphate receptor type 1 gene (Insp3r1) in the mouse central nervous system. Receptors Channels. 1993;1:11–24. [PubMed] [Google Scholar]
- 15.Garner CC, Tucker RP, Matus A. Selective localization of messenger RNA for the cytoskeletal protein protein MAP2 in dendrites. Nature. 1988;336:674–677. doi: 10.1038/336674a0. [DOI] [PubMed] [Google Scholar]
- 16.Gazzaley AH, Siegel SJ, Kordower JH, Mufson EJ, Morrison JH. Circuit-specific alterations of N-methyl-d-aspartate receptor subunit 1 in the dentate gyrus of aged monkeys. Proc Natl Acad Sci USA. 1996a;93:3121–3125. doi: 10.1073/pnas.93.7.3121. [DOI] [PMC free article] [PubMed] [Google Scholar]
- 17.Gazzaley AH, Weiland NG, McEwen BS, Morrison JH. Differential regulation of NMDAR1 mRNA and protein by estradiol in the rat hippocampus. J Neurosci. 1996b;16:6830–6838. doi: 10.1523/JNEUROSCI.16-21-06830.1996. [DOI] [PMC free article] [PubMed] [Google Scholar]
- 18.Geddes JW, Monaghan DT, Cotman CW, Lott IT, Kim RC, Chui HC. Plasticity of hippocampal circuitry in Alzheimer’s disease. Science. 1985;230:1179–1181. doi: 10.1126/science.4071042. [DOI] [PubMed] [Google Scholar]
- 19.Gold SJ, Hennegriff M, Lynch G, Gall CM. Relative concentrations and seizure-induced changes in mRNAs encoding three AMPA receptor subunits in hippocampus and cortex. J Comp Neurol. 1996;365:541–555. doi: 10.1002/(SICI)1096-9861(19960219)365:4<541::AID-CNE3>3.0.CO;2-4. [DOI] [PubMed] [Google Scholar]
- 20.Good MJ, Hage WJ, Mummery CL, De Latt SW, Boonstra J. Localization and quantification of epidermal growth factor receptors on single cells by confocal laser scanning microscopy. J Histochem Cytochem. 1992;40:1353–1361. doi: 10.1177/40.9.1506672. [DOI] [PubMed] [Google Scholar]
- 21.Gore AC, Wu TJ, Rosenberg JJ, Roberts JL. Gonadotropin-releasing hormone and NMDA receptor gene expression and colocalization change during puberty in female rats. J Neurosci. 1996;16:5281–5289. doi: 10.1523/JNEUROSCI.16-17-05281.1996. [DOI] [PMC free article] [PubMed] [Google Scholar]
- 22.Goslin K, Banker G. Rat hippocampal neurons in low density culture. In: Banker G, Goslin K, editors. Culturing nerve cells. MIT; Cambridge: 1991. pp. 251–282. [Google Scholar]
- 23.Hof P, Morrison JH. The cellular basis of cortical disconnection in Alzheimer’s disease and related dementing conditions. In: Terry RD, Katzman R, Bick KL, editors. Alzheimer’s disease. Raven; New York: 1994. pp. 197–229. [Google Scholar]
- 24.Huntley GW, Vickers JC, Janssen W, Brose N, Heinemann SF, Morrison JH. Distribution and synaptic localization of immunocytochemically identified NMDA receptor subunit proteins in sensory-motor and visual cortices of monkey and human. J Neurosci. 1994;14:3603–3619. doi: 10.1523/JNEUROSCI.14-06-03603.1994. [DOI] [PMC free article] [PubMed] [Google Scholar]
- 25.Hyman BT, Van Hoesen GW, Damasio AR, Barnes CL. Alzheimer’s disease: cell-specific pathology isolates the hippocampal formation. Science. 1984;225:1168–1170. doi: 10.1126/science.6474172. [DOI] [PubMed] [Google Scholar]
- 26.Jensen MB, Gonzalez B, Castellano B, Zimmer J. Microglial and astroglial reactions to anterograde axonal degeneration: a histochemical and immunocytochemical study of the adult rat fascia dentata after entorhinal perforant path lesions. Exp Brain Res. 1994;98:245–260. doi: 10.1007/BF00228413. [DOI] [PubMed] [Google Scholar]
- 27.Jessell TM, Siegel RE, Fishbach GD. Induction of acetylcholine receptor on cultured skeletal muscle by a factor extracted from the serum and spinal cord. Proc Natl Acad Sci USA. 1979;76:5397–5401. doi: 10.1073/pnas.76.10.5397. [DOI] [PMC free article] [PubMed] [Google Scholar]
- 28.Kamphuis W, De Rijk TC, Talamini LM, Lopes da Silva FH. Rat hippocampal kindling induces changes in the glutamate receptor mRNA expression patterns in the dentate granule neurons. Eur J Neurosci. 1994;6:1119–1127. doi: 10.1111/j.1460-9568.1994.tb00609.x. [DOI] [PubMed] [Google Scholar]
- 29.Kang H, Schuman EM. A requirement for local protein synthesis in neurotrophin-induced hippocampal synaptic plasticity. Science. 1996;273:1402–1406. doi: 10.1126/science.273.5280.1402. [DOI] [PubMed] [Google Scholar]
- 30.Kleiman R, Banker G, Steward O. Differential subcellular localization of particular mRNAs in hippocampal neurons in culture. Neuron. 1990;5:821–830. doi: 10.1016/0896-6273(90)90341-c. [DOI] [PubMed] [Google Scholar]
- 31.Klein WL, Sullivan J, Skorupa A, Aguilar JS. Plasticity of neuronal receptors. FASEB J. 1989;3:2132–2140. doi: 10.1096/fasebj.3.10.2546848. [DOI] [PubMed] [Google Scholar]
- 32.Laping NJ, Morgan TE, Nichols NR, Rozovsky I, Young-Chan CS, Zarow C, Finch CE. Transforming growth factor-β1 induces neuronal and astrocytic genes: tubulin α1, glial fibrillary acidic protein and clusterin. Neuroscience. 1994;58:563–572. doi: 10.1016/0306-4522(94)90081-7. [DOI] [PubMed] [Google Scholar]
- 33.Laurie DJ, Seeburg PH. Regional and developmental heterogeneity in splicing of the rat brain NMDAR1 mRNA. J Neurosci. 1994;14:3180–3194. doi: 10.1523/JNEUROSCI.14-05-03180.1994. [DOI] [PMC free article] [PubMed] [Google Scholar]
- 34.Link W, Konietzko U, Kauselmann G, Krug M, Schwanke B, Frey U, Kuhl D. Somatodendritic expression of an immediate early gene is regulated by synaptic activity. Proc Natl Acad Sci USA. 1995;92:5734–5738. doi: 10.1073/pnas.92.12.5734. [DOI] [PMC free article] [PubMed] [Google Scholar]
- 35.Lippa CF, Hamos JE, Pulaski-Salo D, Degennaro LJ, Drachman DA. Alzheimer’s disease and aging: effects on perforant pathway perikarya and synapses. Neurobiol Aging. 1992;13:405–411. doi: 10.1016/0197-4580(92)90115-e. [DOI] [PubMed] [Google Scholar]
- 36.Loesche J, Steward O. Behavioral correlates of denervation and reinnervation of the hippocampal formation of the rat: recovery of alternation performance following unilateral entorhinal cortex lesions. Brain Res Bull. 1977;2:31–39. doi: 10.1016/0361-9230(77)90022-3. [DOI] [PubMed] [Google Scholar]
- 37.Lømo T, Rosenthal J. Control of Ach sensitivity by muscle activity in the rat. J Physiol (Lond) 1972;221:493–513. doi: 10.1113/jphysiol.1972.sp009764. [DOI] [PMC free article] [PubMed] [Google Scholar]
- 38.Lyford GL, Yamagata K, Kaufmann WE, Barnes CA, Sanders LK, Copeland NG, Gilbert DJ, Jenkins NA, Lanahan AA, Worley PF. Arc, a growth factor and activity-regulated gene, encodes a novel cytoskeleton-associated protein that is enriched in neuronal dendrites. Neuron. 1995;14:433–445. doi: 10.1016/0896-6273(95)90299-6. [DOI] [PubMed] [Google Scholar]
- 39.Maren S, Georges T, Standley S, Baudry M, Thompson R. Postsynaptic factors in the expression of long-term potentiation (LTP): increased glutamate receptor binding following LTP induction in vivo. Proc Natl Acad Sci USA. 1993;90:9654–9658. doi: 10.1073/pnas.90.20.9654. [DOI] [PMC free article] [PubMed] [Google Scholar]
- 40.Masliah E, Fagan AM, Terry RD, DeTeresa R, Mallory M, Gage FH. Reactive synaptogenesis assessed by synaptophysin immunoreactivity is associated with GAP-43 in the dentate gyrus of the adult rat. Exp Neurol. 1991;113:131–142. doi: 10.1016/0014-4886(91)90169-d. [DOI] [PubMed] [Google Scholar]
- 41.Matthews DA, Cotman C, Lynch G. An electron microscopic study of lesion-induces synaptogenesis in the dentate gyrus of the adult rat. I. Magnitude and time course of degeneration. Brain Res. 1976;115:1–21. doi: 10.1016/0006-8993(76)90819-2. [DOI] [PubMed] [Google Scholar]
- 42.Miyashiro K, Dichter M, Eberwine J. On the nature and differential distribution of mRNAs in hippocampal neurites: implications for neuronal functioning. Proc Natl Acad Sci USA. 1994;91:10800–10804. doi: 10.1073/pnas.91.23.10800. [DOI] [PMC free article] [PubMed] [Google Scholar]
- 43.Moriyoshi K, Masu M, Takahiro I, Shigemoto R, Mizuno N, Nakanishi S. Molecular cloning and characterization of the rat NMDA receptor. Nature. 1991;354:31–37. doi: 10.1038/354031a0. [DOI] [PubMed] [Google Scholar]
- 44.Petralia RS, Yokotani N, Wenthold RJ. Light and electron microscope distribution of the NMDA receptor subunit NMDAR1 in the rat nervous system using a selective anti-peptide antibody. J Neurosci. 1994;14:667–696. doi: 10.1523/JNEUROSCI.14-02-00667.1994. [DOI] [PMC free article] [PubMed] [Google Scholar]
- 45.Philips L, Nostrandt SJ, Chikaraishi DM, Steward O. Increases in ribosomal RNA within the denervated neuropil of the dentate gyrus during reinnervation: evaluation by in situ hybridization using cDNA probes complementary to ribosomal RNA. Mol Brain Res. 1987;2:251–261. doi: 10.1016/0169-328x(87)90032-5. [DOI] [PubMed] [Google Scholar]
- 46.Rao A, Steward O. Evidence that protein constituents of postsynaptic membrane specializations are locally synthesized: analysis of proteins synthesized within synaptosomes. J Neurosci. 1991;11:2881–2895. doi: 10.1523/JNEUROSCI.11-09-02881.1991. [DOI] [PMC free article] [PubMed] [Google Scholar]
- 47.Reeves TM, Smith DC. Reinnervation of the dentate gyrus and recovery of alternation behavior following entorhinal cortex lesions. Behav Neurosci. 1987;101:179–186. doi: 10.1037//0735-7044.101.2.179. [DOI] [PubMed] [Google Scholar]
- 48.Reeves TM, Steward O. Changes in the firing properties of neurons in the dentate gyrus with denervation and reinnervation: implications for behavioral recovery. Exp Neurol. 1988;107:37–49. doi: 10.1016/0014-4886(88)90076-3. [DOI] [PubMed] [Google Scholar]
- 49.Schaffner AE, Daniels MP. Conditioned medium from cultures of embryonic neurons contains a high molecular weight factor which induces acetylcholine aggregation on cultured myotubules. J Neurosci. 1982;2:623–632. doi: 10.1523/JNEUROSCI.02-05-00623.1982. [DOI] [PMC free article] [PubMed] [Google Scholar]
- 50.Schauwecker PE, Cheng H-W, Serquinia RMP, Mori N, McNeill TH. Lesion-induced sprouting of commissural/associational axons and induction of GAP-43 mRNA in hilar and CA3 pyramidal neurons in the hippocampus are diminished in aged rats. J Neurosci. 1996;15:2462–2470. doi: 10.1523/JNEUROSCI.15-03-02462.1995. [DOI] [PMC free article] [PubMed] [Google Scholar]
- 51.Shatz CJ. Impulse activity and the patterning of connections during CNS development. Neuron. 1990;5:745–756. doi: 10.1016/0896-6273(90)90333-b. [DOI] [PubMed] [Google Scholar]
- 52.Siegel SJ, Janssen WG, Gasic GP, Jahn R, Heinemann SF, Morrison JH. Regional, cellular and ultrastructural distribution of N-methyl-d-aspartate receptor subunit 1 in monkey hippocampus. Proc Natl Acad Sci USA. 1994;91:564–568. doi: 10.1073/pnas.91.2.564. [DOI] [PMC free article] [PubMed] [Google Scholar]
- 53.Skelton RW, McNamara RK. Bilateral knife cuts to the perforant path disrupt spatial learning in the Morris water maze. Hippocampus. 1992;2:73–80. doi: 10.1002/hipo.450020110. [DOI] [PubMed] [Google Scholar]
- 54.Steward O. Topographic organization of the projections from the entorhinal area to the hippocampal formation of the rat. J Comp Neurol. 1976;167:285–314. doi: 10.1002/cne.901670303. [DOI] [PubMed] [Google Scholar]
- 55.Steward O. Alterations in polyribosomes associated with dendritic spines during the reinnervation of the dentate gyrus of the adult rat. J Neurosci. 1983;3:177–178. doi: 10.1523/JNEUROSCI.03-01-00177.1983. [DOI] [PMC free article] [PubMed] [Google Scholar]
- 56.Steward O, Levy WB. Preferential localization of polyribosomes under the base of dendritic spines in granule cells of the dentate gyrus. J Neurosci. 1982;2:284–291. doi: 10.1523/JNEUROSCI.02-03-00284.1982. [DOI] [PMC free article] [PubMed] [Google Scholar]
- 57.Steward O, Reeves TM. Protein synthetic machinery beneath postsynaptic sites on CNS neurons: association between polyribosomes and other organelles at the synaptic site. J Neurosci. 1988;8:176–184. doi: 10.1523/JNEUROSCI.08-01-00176.1988. [DOI] [PMC free article] [PubMed] [Google Scholar]
- 58.Steward O, Vinsant SL. The process of reinnervation in the dentate gyrus of adult rats: a quantitative electron microscopic analysis of terminal proliferation and reactive synaptogenesis. J Comp Neurol. 1983;214:370–386. [Google Scholar]
- 59.Steward O, Wallace CS. mRNA distribution within dendrites: relationship to afferent innervation. J Neurobiol. 1994;26:447–458. doi: 10.1002/neu.480260316. [DOI] [PubMed] [Google Scholar]
- 60.Steward O, Cotman CW, Lynch G. Growth of a new fiber projection in the brain of the adult rat: reinnervation of the dentate gyrus by the contralateral entorhinal cortex following ipsilateral entorhinal lesion. Exp Brain Res. 1974;20:45–66. doi: 10.1007/BF00239017. [DOI] [PubMed] [Google Scholar]
- 61.Steward O, Cotman C, Lynch G. A quantitative autoradiographic and electrophysiological study of the reinnervation of the dentate gyrus by the contralateral entorhinal cortex following ipsilateral entorhinal lesions. Brain Res. 1976;114:181–200. doi: 10.1016/0006-8993(76)90665-x. [DOI] [PubMed] [Google Scholar]
- 62.Tamura M, Yoned Y, Ogita K, Shimizu J, Nagata Y. Age-related decreases of the N-methyl-d-aspartate receptor complex in the rat cerebral cortex and hippocampus. Brain Res. 1991;542:83–90. doi: 10.1016/0006-8993(91)91001-h. [DOI] [PubMed] [Google Scholar]
- 63.Thomas KL, Davis S, Laroche S, Hunt SP. Regulation of the expression of NRI NMDA glutamate receptor subunits during hippocampal LTP. NeuroReport. 1994a;6:119–123. doi: 10.1097/00001756-199412300-00031. [DOI] [PubMed] [Google Scholar]
- 64.Thomas KL, Laroche S, Errington ML, Bliss TVP, Hunt SP. Spatial and temporal changes in signal transduction pathways during LTP. Neuron. 1994b;13:737–745. doi: 10.1016/0896-6273(94)90040-x. [DOI] [PubMed] [Google Scholar]
- 65.Torre ER, Steward O. Demonstration of local protein synthesis within dendrites using a new cell culture system that permits the isolation of living axons and dendrites from their cell bodies. J Neurosci. 1992;12:762–772. doi: 10.1523/JNEUROSCI.12-03-00762.1992. [DOI] [PMC free article] [PubMed] [Google Scholar]
- 66.Torre ER, Steward O. Protein synthesis within dendrites: glycosylation of newly synthesized proteins in dendrites of hippocampal neurons in culture. J Neurosci. 1996;16:5967–5978. doi: 10.1523/JNEUROSCI.16-19-05967.1996. [DOI] [PMC free article] [PubMed] [Google Scholar]
- 67.Trudeau L-E, Castellucci VF. Postsynaptic modifications in long-term facilitation in Aplysia: upregulation of excitatory amino acid receptors. J Neurosci. 1995;15:1275–1284. doi: 10.1523/JNEUROSCI.15-02-01275.1995. [DOI] [PMC free article] [PubMed] [Google Scholar]
- 68.Ulas J, Monaghan DT, Cotman CW. Plastic response of hippocampal excitatory amino acid receptors to deafferentation and reinnervation. Neuroscience. 1990;34:9–17. doi: 10.1016/0306-4522(90)90300-s. [DOI] [PubMed] [Google Scholar]
- 69.Vnek N, Gleason TC, Kromer LF, Rothblat LA. Entorhinal-hippocampal connections and object memory in the rat: acquisition versus retention. J Neurosci. 1995;15:3193–3199. doi: 10.1523/JNEUROSCI.15-04-03193.1995. [DOI] [PMC free article] [PubMed] [Google Scholar]
- 70.Wenk GW, Walker LC. Loss of NMDA, but not GABA-A, binding in the brains of aged rats and monkeys. Neurobiol Aging. 1991;12:93–98. doi: 10.1016/0197-4580(91)90047-n. [DOI] [PubMed] [Google Scholar]
- 71.Wiedenmann B, Franke WW. Identification and localization of synaptophysin, an integral membrane glycoprotein of Mr 38,000 characteristic of presynaptic vesicles. Cell. 1985;41:1017–1028. doi: 10.1016/s0092-8674(85)80082-9. [DOI] [PubMed] [Google Scholar]
- 72.Williams K, Dichter MA, Molinoff PB. Up-regulation of N-methyl-d-aspartate receptors on cultured cortical neurons after exposure to antagonists. Mol Pharmacol. 1992;42:147–151. [PubMed] [Google Scholar]
- 73.Wong-Riley MTT. Changes in the visual system of monocularly sutured or enucleated kittens demonstrable with cytochrome oxidase histochemistry. Brain Res. 1979;171:11–28. doi: 10.1016/0006-8993(79)90728-5. [DOI] [PubMed] [Google Scholar]
- 74.Zimmer J. Extended commissural, ipsilateral projections in postnatally deentorhinated hippocampus and fascia dentata demonstrated in rats by silver impregnation. Brain Res. 1973;64:293–311. doi: 10.1016/0006-8993(73)90185-6. [DOI] [PubMed] [Google Scholar]