Abstract
Two different modes of cell division are adopted by progenitor cells to generate the neurons and glia of the cerebral cortex: they either divide symmetrically to generate other progenitors or a pair of postmitotic cells or divide asymmetrically to generate both a progenitor and a postmitotic cell. In this study we used a lineage marker, the BAG retrovirus, in embryonic day 16 rats in combination with bromodeoxyuridine (BrdU) to identify patterns of cell generation in the cerebral cortex, and investigated the relationship between the phenotype of cells and the history of their lineages. The location, phenotype and birth order of clonally related cells were studied in the subsequent 3 weeks. Only pyramidal neurons and/or astrocytes formed discrete clusters in which several generations of family members were present, whereas nonpyramidal neurons were found exclusively in pairs or as single cells. Analysis of BrdU levels in these cells showed that nonpyramidal neurons were originally part of larger clones and were found dispersed in the neocortex because of tangential migration of their progenitors, dispersion of postmitotic cells, or death of clonal relatives. These results suggest that both symmetrical and asymmetrical division can be adopted by progenitor cells to generate cortical neurons and glial cells and that cell extrinsic events contribute to the isolation of nonpyramidal neurons.
Keywords: neocortex, development, retrovirus, cell birthdate, BrdU, rat, neurons, glia
The neurons and glia of the mammalian cerebral cortex are generated by proliferating neuroepithelial cells in the telencephalic ventricular and subventricular zones (Boulder Committee, 1970). As neurogenesis proceeds, the mitotic potential of progenitor cells becomes gradually restricted, resulting in more postmitotic cells being produced at the later stages of corticogenesis (Takahashi et al., 1995). The two main classes of cortical neurons, the pyramidal and nonpyramidal cells, are produced throughout the period of neurogenesis (Miller, 1985), with no apparent relation between time of birth and neuronal subtype.
Lineage studies in the rat cortex (Parnavelas et al., 1991; Grove et al., 1993; Luskin et al., 1993) demonstrated that clusters of clonally related neurons were composed of cells of the same phenotype. However, a large number of clonally related cells do not migrate in tandem along the same radial glial fibers, and clonal relatives may be found at some distance from each other (Walsh and Cepko, 1992, 1993). Different types of cells were present in dispersed clones, but cells that migrated together invariably showed the same phenotype (Reid et al., 1995). One interpretation of these findings is that widespread clones are generated by migrating progenitors that give rise to committed precursors in different locations in the proliferative zone (Reid et al., 1995). Alternatively, concerted migration may expose sibling cells to the same cues, which may influence the development of cell phenotype.
In invertebrates, cell fate specification is highly correlated with birth order. The most common mechanism used to establish different fates for sibling cells is through the asymmetrical localization of cell determinants during mitosis (for review, see Doe and Spana, 1995). Is the asymmetrical localization of determinants relevant to the production of different cell types in the cortex as it is in theDrosophila CNS? A number of studies, including population studies on the generation of cortical cells (reviewed in Caviness et al., 1995) and lineage studies with recombinant retroviruses (Kornack and Rakic, 1995), have shown that cells undergoing either symmetrical or asymmetrical divisions, in which daughter cells adopt different fates, coexist in the ventricular zone neuroepithelium throughout corticogenesis.
To gain information on the organization of cortical cell lineages, we used a lineage marker in combination with bromodeoxyuridine (BrdU) to analyze the pattern of cell generation in the cerebral cortex of the rat. We found that cells born soon after the incorporation of retrovirus and BrdU were almost exclusively pyramidal neurons of layers V and IV, whereas labeled nonpyramidal cells of all layers, as well as pyramidal neurons of the upper layers, were generated during the subsequent cell cycles; glial cells were the last to be born. Analysis of the clusters of clonally related cells in the cortex of 2-week-old rats provides evidence for both asymmetrical and symmetrical divisions coexisting in the same lineage during the generation of pyramidal neurons, with a prevalence of asymmetrical divisions in radial arrays and of symmetrical divisions in horizontal arrays. In contrast, labeled nonpyramidal neurons were found either as isolated cells or pairs of clonally related neurons, and their low content of BrdU indicated that they were part of larger clones.
MATERIALS AND METHODS
Retrovirus and BrdU injections. The ψ BAG retrovirus, which carries the lacZ reporter gene (Price et al., 1987), was injected into the telencephalic ventricles of rat embryos at embryonic day (E) 16 as described previously (Mione et al., 1994). The day in which a vaginal plug was found in pregnant rats was considered as E1. The injections of 0.5–1 μl of retroviral suspension, at a dilution of 105 colony-forming units/ml, containing polybrene (0.005%) and fast green (0.01%), were made through a 33 gauge needle. After closure of the abdominal wall, pregnant rats were given injections of BrdU (50 mg/kg, i.p., dissolved in sterile saline containing 0.007 N NaOH). A number of studies suggest that in dividing mammalian cells, retroviral integration takes place at the first mitosis after infection (Miller et al., 1990; Roe et al., 1993;Hajihosseini et al., 1994). Because of the unknown and probably variable length of time required for the incorporation and expression of the reporter gene (Cepko et al., 1993) and the asynchronous pattern of cell division of cortical progenitor cells (Takahashi et al., 1994), it was necessary to make BrdU available for the entire length of the cell cycle during which the integration of the reporter gene was presumably taking place. In addition, the intervals between BrdU injections were designed to reduce the variability in the amount of BrdU taken up by asynchronously cycling cells. Five injections of BrdU were performed at 3.5 hr intervals. Some brains were examined 48 hr after the injections of retrovirus and BrdU, and all β-galactosidase (β-gal+) cells were found to be labeled with BrdU.
Histology. The brains of injected rats were examined 3 d (at E19), 6 d (at birth, P0), or 20 d (2 weeks postnatally, P14) after the injections. Animals (including embryos) were perfused through the heart with 4% paraformaldehyde in 0.1 mphosphate buffer, pH 7.4. Brains were dissected out and postfixed in the same solution for a total of 2 hr. Brains of 12 E19 rat embryos (from 3 different mothers), 5 newborn animals, and 14 2-week-old rats were cryoprotected, embedded in OCT (Miles), and frozen in liquid nitrogen. Serial coronal sections (7 μm thick for embryos and newborn rats, and 15 μm thick for postnatal rats) were cut with a cryostat and collected on poly-L-lysine coated slides. Sections were immunostained for β-gal using a polyclonal β-gal antiserum (a gift of Dr. J. Price, Smith Kline Beecham, Harlow, United Kingdom; Williams et al., 1991), at a dilution of 1:1000. Incubation in primary antibody was followed by donkey anti-rabbit biotinylated antiserum (Amersham, Amersham, United Kingdom), and streptavidin Texas Red (Amersham) as third layer, both diluted 1:250. After treatment with 2 N HCl for 1 hr to expose single strands of DNA containing BrdU (Nowakowski et al., 1989), sections were incubated overnight with a mouse monoclonal anti-BrdU antibody (Sigma, Poole, UK), diluted 1:1,000, and the reaction was successively revealed using a goat anti-mouse FITC-conjugated antiserum (Sigma). Sections were coverslipped with Citifluor (Canterbury, UK) and viewed with a Leica fluorescence microscope equipped with a drawing tube.
β-gal+ cells were mapped in camera lucida drawings of serially arranged sections. Labeled cells were assigned to individual clusters (a group of closely spaced β-gal+ cells contained within 540 μm in both the rostrocaudal and mediolateral planes) or pairs (two-cell clusters) or classified as isolated β-gal+ cells (cells separated from other labeled cells by at least 540 μm in all planes). Five clusters or pairs, of the 104 examined, had β-gal+ cells that spanned a distance of more than 540 μm (marked with asterisks in Tables 1–4). For these clusters, the absence of other labeled cells in the vicinity and the spread along the main axis of the cluster (i.e., lateral for horizontal clusters and vertical for radial clusters) suggested that all the cells in these expanded clusters were clonally related. We restricted our analysis to brains with a low infection rate (for discussion see Mione et al., 1994); in these brains, all β-gal+ cells found in the cerebral cortex from the frontal to the occipital pole were studied. However, only clusters, pairs, or isolated β-gal+ cells located within AP coordinates bregma +3.2 mm to −5.8 mm (Paxinos and Watson, 1986) are reported here, because of the documented deviation of the glial fibers from the radial orientation in the more posterior and lateral areas of the neocortex (Misson et al., 1991).
Brains of four 2-week-old rats were sectioned with a Vibratome. Coronal sections, 100 μm thick, were collected in serial order and incubated overnight in X-Gal to reveal β-gal+ cells (Sanes et al., 1986). Brains containing labeled cells were processed for electron microscopy and flat-embedded in Araldite as described previously (Luskin et al., 1993). After classification, performed as described for cryostat sections, a number of β-gal+ cells in selected clusters, pairs, or isolated cells were cut from the Vibratome sections, mounted on Araldite stubs, and sectioned with an ultramicrotome. Several adjacent sections through the same cell were obtained and processed for GABA, glutamate, and BrdU-immunohistochemistry as described previously (Mione et al., 1994).
Quantification of BrdU labeling in β-gal+cells. Cells labeled for BrdU and β-gal were examined with a Leica TCS 4D confocal microscope, and the digitized images were evaluated by computer using a standard image analysis program (PC Image, Foster Findlay Associates, Newcastle, UK). For each preparation, the maximum degree of BrdU labeling was taken to be that of the nuclei of layer V neurons, which are born at E16 (Bayer and Altman, 1991) and corresponded to 70–100% immunofluorescent nuclear area. β-gal+ cells displaying such high BrdU nuclear labeling were considered to be born immediately after the incorporation of retrovirus (and BrdU). Accordingly, cells with less than 50% immunofluorescent nuclear area were classified as born after a further division; cells with less than 25% immunofluorescent nuclear area were classified as born after 2 cell divisions, and cells with less than 12% immunofluorescent nuclear area were classified as born after 3 or more divisions. Quantification of BrdU levels was carried out in optical sections of labeled cells, followed by three-dimensional reconstruction. In the vast majority of cases, the entire nucleus of double labeled cells was contained within one section and available for such analysis without further manipulation. This approach offered several advantages compared with classical birthdate studies with [3H]thymidine autoradiography followed by grain counting (see Acklin and van der Kooy, 1993). First, it was possible to visualize both the somata and processes of β-gal-labeled cells, which was necessary for phenotypic classification. Second, it reduced the problems connected with assessing the degree of labeling from a single thin section, as is often done in [3H]thymidine autoradiography. The reliability and consistency of this approach were evaluated previously in cultures of embryonic cortical cells, where clonally related cells remain closely apposed and are easy to study (Mione et al., 1996). In cultures exposed to both retrovirus and BrdU for 6 hr, and examined 48 hr after the double exposure, we found that BrdU was clearly detectable in all clonally related cells at least up to the 16-cell stage, equivalent to 4 cell divisions (not shown), thus confirming the reliability of the double labeling protocol.
Preliminary experiments were carried out in these cultures to evaluate the degree of BrdU immunostaining in cells generated after one, two, or three cell divisions. Briefly, primary cultures of E16 rat cortices were prepared as described previously (Mione et al., 1996). Cultures were exposed to 103 colony-forming units of BAG retrovirus on their second day in vitro for a total of 2 hr, and to 30 min pulses of 10−5 M BrdU every 3.5 hr for a total of 12 hr. Cultures were fixed 1, 2, or 3 d after exposure to BAG retrovirus and immunostained for β-gal and BrdU as described above. All members of the 21 clones found in these cultures were evaluated for their degree of BrdU immunoreactivity. The results were as follows: in single-cell clones (n = 5), BrdU levels were between 50% and 100%; in 8 of 10 two-cell clones, BrdU levels were between 25% and 50% in both cells. In the other eight clones, the amount of BrdU immunoreactivity was consistent with the number of generations, as deduced from the number of cells in that lineage. There was evidence of cell loss in four clones.
RESULTS
We examined 719 β-gal-labeled cells in the cortices of 18 two-week-old rats given injections of retrovirus at E16 and found that they were distributed either in clusters of three or more cells, pairs, or single cells. These cells formed 64 discrete clusters, 40 pairs, and 130 single β-gal+ cells. The location, phenotypes, and percent of BrdU-immunoreactive nuclear area of all cells are shown in Tables 1–4. Often, clonally related cells were distributed in radial or horizontal arrays, similar to what has been reported for the primate cortex (Kornack and Rakic, 1995). The analysis of the degree of BrdU labeling of these cells revealed the occurrence of asymmetrical divisions in the radial arrays, and of symmetrical divisions in the horizontal clusters.
Horizontal clusters
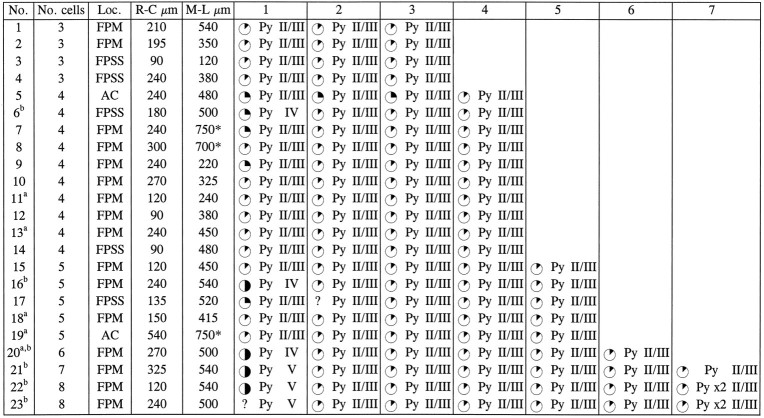
The majority of cells within these clusters resided in the same layer, usually II/III (Fig.1A,B). In the 18 brains examined, 23 clusters, representing 36% of all cortical clusters, could be classified as horizontal (Table 1). In cryostat-cut sections stained with β-gal antiserum, all cells within the horizontal clusters had morphological features of pyramidal neurons with similar size and staining pattern. In semithin sections, all clonally related cells of the horizontal clusters were immunoreactive for the neurotransmitter glutamate, a marker of cortical pyramidal neurons (Fig. 1C,D).
Fig. 1.
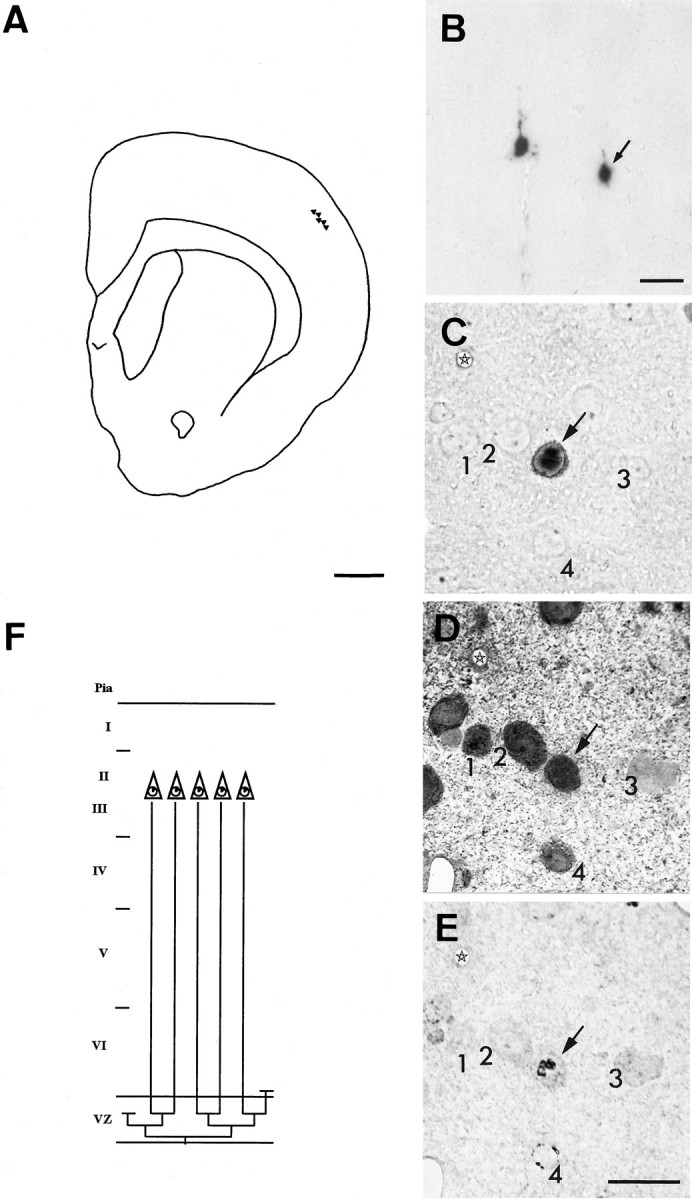
Horizontal clusters. A, Camera lucida drawing showing the location of β-gal+cells of cluster 18 (Table 1). These cells were all located in layers II and III and distributed within two consecutive 100-μm-thick Vibratome sections. Glutamate immunoreactivity was used as a marker of pyramidal neurons. Two of the cells of this cluster are displayed inB, and one (arrow) is shown in adjacent semithin sections (C–E): unstained (C) or after immunostaining for glutamate (D) or BrdU (E). The other cells of this cluster were all immunoreactive for glutamate and displayed similar low levels of BrdU immunoreactivity. None of the cells was immunoreactive for GABA, a marker of nonpyramidal neurons. Four neighboring neurons (1–4) are shown in all three sections as landmarks. Asterisks mark the same blood vessel.F, A possible family tree for this cluster. To obtain five neurons with <12% BrdU-immunoreactive nuclear area, the progenitor cells must have divided symmetrically at least three times (corresponding clonal size, 8 cells) after incorporation of retrovirus and BrdU. Only five cells were found, which suggests that at least one postmitotic [line ending above the ventricular zone (VZ)] and one progenitor cell (line ending within the VZ) were lost (through death or migration) from this cluster. Scale bars: A, 1 mm;B–E, 20 μm.
Table 1.
Cell-type composition, location, and degree of BrdU labeling in horizontal clusters of β-gal+cells
Data from 36 cortical hemispheres of 2-week-old rats given injections of retrovirus and BrdU at E16 are reported here.
Cells were studied either in double-immunostained cryostat sections orain adjacent semithin sections. Horizontal clusters are defined as groups of β-gal+ cells located predominantly in the same layer and within 540 μm in both rostrocaudal (R-C) and mediolateral (M-L) dimensions. Clusters extending for >540 μm are marked with an asterisk.
Clusters including one cell located in a different layer. Cortical areas (FPM, fronto-parieto-motor cortex; FPSS, fronto-parieto-somatosensory cortex; AC, anterior cingulate cortex) were defined according to Paxinos and Watson (1986); laminar location was assigned according to Krieg (1946). Cells were classified as pyramidal neurons (Py) according to morphological features, which included size and shape of the cell body and dendritic processes, axonal morphology when applicable, and nuclear size and shape (Peters and Jones, 1984). In semithin sections, cells were classified on the basis of their immunoreactivity for glutamate. For the level of BrdU immunoreactive nuclear area: ✺ = 25–50%; = 12–25%; = <12%; ? = unknown.
Analysis of BrdU labeling indicated that clonally related cells located in the same layer were born at the same time, typically four divisions after the incorporation of retrovirus and BrdU for layer II/III neurons (Fig. 1E). Five of these clusters contained a single early-born pyramidal neuron (BrdU labeling, ∼50%) located in layer V, as well as several late-born pyramidal cells in layers II and III. In almost all horizontal clusters, there was evidence of cell loss. For example, a level of BrdU immunoreactivity of <12% found in β-gal+ cells of layers II and III was compatible with 4 cell divisions after retrovirus and BrdU incorporation, which is equivalent to a final number of 16 cells, or 9 cells in the clusters that included 1 early-born neuron. However, no clusters matched the expected size: a representative family tree of a horizontal cluster including the missing cells is shown in Figure1F.
Radial clusters
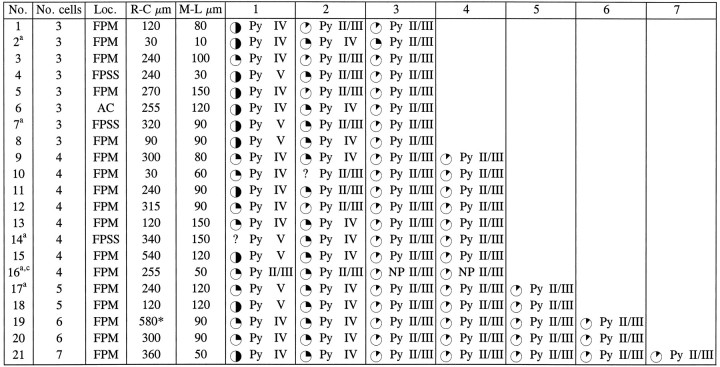
These clusters were composed of cells located in different layers and arranged radially with little lateral displacement. Twenty-one clusters (representing 33% of all cortical clusters found in 18 brains) showed such a distribution. These clusters were composed exclusively of pyramidal neurons (Table 2) located in different layers, from layer V to layers II and III. Cells within these clusters, visualized with β-gal immunohistochemistry, showed different morphology and size, corresponding to the features of deep layer and upper layer pyramidal neurons (Fig.2A–D). In the clusters examined with postembedding immunohistochemistry, cells were immunoreactive for glutamate. Various levels of BrdU labeling were displayed by the pyramidal neurons of the radial clusters, higher (∼50%) for cells located in the infragranular layers (Fig. 2D) and progressively lower for cells located in more superficial layers (Fig.2B,C). There was also evidence of cell loss, although the extent of it was less pronounced than in the horizontal clusters. A representative family tree of a radial cluster is shown in Figure 2E.
Table 2.
Cell-type composition, location, and level of BrdU labeling in radial clusters of β-gal+cells
|
Data from 36 cortical hemispheres of 2-week-old rats given injections of retrovirus and BrdU at E16 are reported here.
Cells were studied either in double-immunostained cryostat sections orain adjacent semithin sections.
Radial clusters are defined as clusters of β-gal+ cells located in different layers and arranged radially. A cluster extending for >540 μm in the rostrocaudal direction is marked with an asterisk.
Cluster including cells with different phenotype. Cortical areas were defined according to Paxinos and Watson (1986); laminar location was assigned according to Krieg (1946). Cells were classified as pyramidal neurons (Py) or nonpyramidal neurons (NP) according to morphological features, which included size and shape of the cell body and dendritic processes, axonal morphology when applicable, and nuclear size and shape (Peters and Jones, 1984). In semithin sections, cells were classified on the basis of their immunoreactivity for GABA or glutamate. For the level of BrdU-immunoreactive nuclear area: ✺ = 25–50%; =12–25%; =<12%; ? = unknown.
Fig. 2.
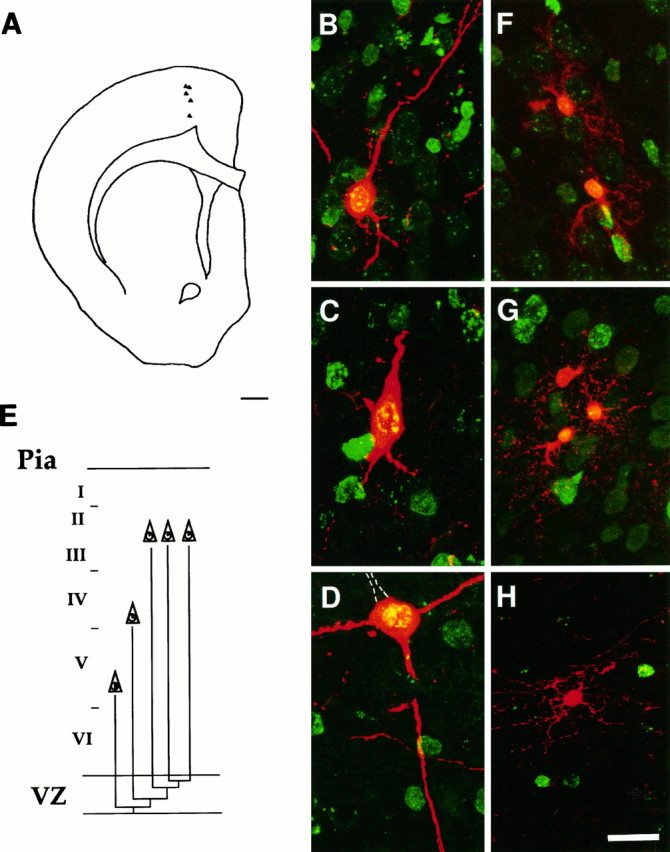
Radial clusters. A, Camera lucida drawing showing the location of β-gal+ cells of cluster 18 (see Table 2). Cells were located in different layers, from layers V to II, but displayed very little lateral displacement.B–D, Laser scanning confocal micrograph of cells located in layer II (B), layer IV (C), or layer V (D). β-gal+ cells were stained (red) with a polyclonal β-gal antiserum, followed by streptavidin–Texas Red, whereas BrdU immunoreactivity (green) was detected with a monoclonal antiserum followed by FITC. Coexistence appears yellow. All cells displayed morphological features of pyramidal neurons, with visible basal and/or apical dendrites. The cell depicted in Dhad a prominent apical dendrite (dotted lines) in the adjacent section. The levels of BrdU immunoreactivity were higher in the cell located in layer V (D, immunoreactive nuclear area, ∼50%) and progressively lower for the cell located in layer IV (C, immunoreactive nuclear area, 12–25%) and II (B, immunoreactive nuclear area, <12%).E, A possible family tree of this cluster. To obtain five neurons with these levels of BrdU, the progenitors must have undergone three asymmetrical and one symmetrical division after the incorporation of retrovirus and BrdU to give rise to postmitotic daughters during the first three divisions and two terminal postmitotic cells from the last symmetrical division. Glial clusters usually showed a clear radial alignment; the cells were grouped in several subunits and distributed along different layers. F–H, Examples of confocal micrographs of clonally related glial cells stained with β-gal+ antiserum and Texas Red. In F andG, small clusters of β-gal+ astrocytes can be recognized by their thin, spider-like processes. InH, an oligodendrocyte, part of cluster 7 (see Table 3), shows the characteristic parallel processes. The levels of BrdU immunoreactivity (here visualized with FITC) were very low in all glial cells, indicating that their progenitors must have divided several times after retroviral and BrdU incorporation before these cells were born. Scale bars: A, 1 mm; B–H, 20 μm.
Glial clusters
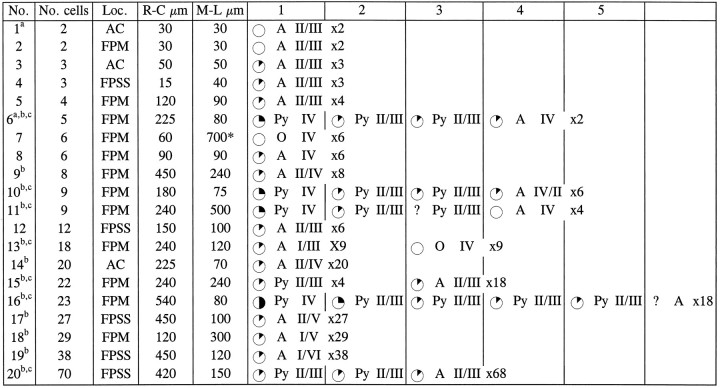
Twenty clusters included cells with glial morphology. In most of these clusters, cells were distributed radially. Twelve radial clusters were composed exclusively of astrocytes, and six included both astrocytes and pyramidal neurons (Table 3). Astrocytes were arranged in subclusters, each composed of several cells that were radially aligned, sometimes spanning the entire thickness of the cortex. These cells were readily identified as such, both in cryostat-cut sections stained with β-gal antiserum (Fig.2F,G) and in semithin sections stained for GFAP (not shown). They were also characterized by very low, sometimes undetectable levels of BrdU immunoreactivity (Fig.2F,G). In mixed clusters that included both neurons and astrocytes, pyramidal neurons always had higher BrdU labeling than did their sibling astrocytes (Table 3). We also encountered two clusters that contained oligodendrocytes (identified on the basis of the parallel orientation of their processes, see Fig.2H), one of which also included a number of astrocytes. However, the levels of BrdU immunoreactivity were too low to establish a hierarchy of birth order between the two cell types.
Table 3.
Cell-type composition, location, and degree of BrdU labeling in clusters containing β-gal+ glial cells
|
Data from 36 cortical hemispheres of 2-week-old rats given injections of retrovirus and BrdU at E16 are reported here.
Cells were studied either in double-immunostained cryostat sections orain adjacent semithin sections. Glial clusters are defined as groups of β-gal+ cells located within 540 μm in both rostrocaudal and mediolateral dimensions, which are composed exclusively of, or contain, glial cells. A cluster extending for >540 μm is marked with an asterisk.
Clusters that include cells located in different layers.
Clusters that include cells with different phenotype. Cortical areas were defined according to Paxinos and Watson (1986); laminar location was assigned according to Krieg (1946). Cells were classified as pyramidal neurons (Py), astrocytes (A), or oligodendrocytes (O) according to morphological features, which included size and shape of the cell body and cellular processes, axonal morphology when applicable, and nuclear size and shape (Peters and Jones, 1984; Peters et al., 1991). For the level of BrdU-immunoreactive nuclear area: ✺ = 25–50%; = 12–25%; = <12%; ○ = unlabeled; ? = unknown.
Two-cell clusters
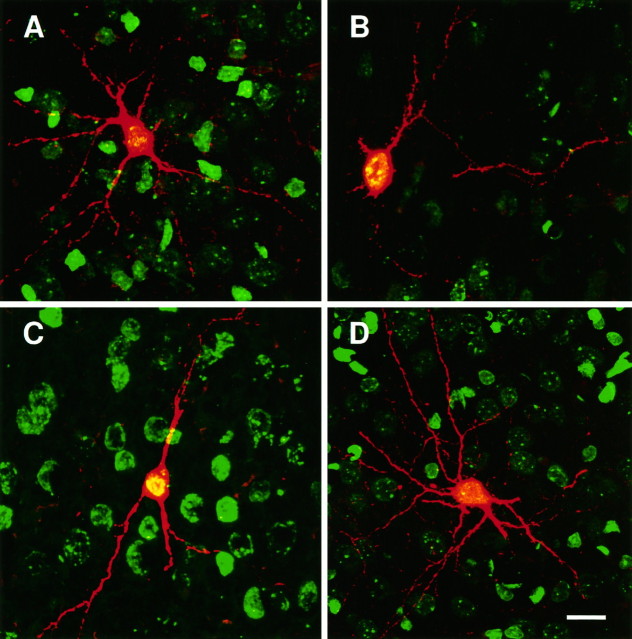
Most β-gal+ neurons were found in pairs. We assumed that cells within these clusters were clonally related because their separation was less than 540 μm in the mediolateral and rostrocaudal dimensions, and were often located in the same layer as if they had been generated by the final division of their immediate precursors. Accordingly, it was common to find that both cells in these clusters showed similar degrees of BrdU immunoreactivity. This suggested that two-cell clusters were generated by symmetrical divisions, although only a few of these divisions had taken place immediately after the incorporation of retrovirus. In fact, the level of BrdU immunoreactivity found in these cells (Fig.3A,B) suggested that most two-cell clusters were part of larger clones (Table 4).
Fig. 3.
Two cell clusters and isolated cells. An example of a two-cell cluster, composed of nonpyramidal (A) and pyramidal (B) neurons (cluster 21 in Table 4). Confocal micrographs showing β-gal immunoreactivity in red(Texas Red) and BrdU immunoreactivity in green (FITC). Coexistence is shown in yellow. The pyramidal cell was characterized by the presence of dendritic spines along the apical dendrite, whereas the nonpyramidal neuron showed intense staining of its many dendrites. BrdU levels were low in both cells, suggesting that they may have been generated by the same division or the same order of divisions after the incorporation of retrovirus and BrdU by their ancestor. C, D, Examples of isolated β-gal+ cells, double-immunostained for β-gal (Texas Red) and BrdU (FITC) in the cortex of 2-week-old rats given injections of retrovirus and BrdU at E16. Only isolated pyramidal neurons, like the cell depicted in C, were characterized by high levels of BrdU immunoreactivity. The majority of isolated β-gal+ cells, however, was nonpyramidal neurons (D), which displayed low levels of BrdU immunoreactivity. Scale bars, 20 μm.
Table 4.
Cell-type composition, location, and levels of BrdU labeling in two-cell clusters
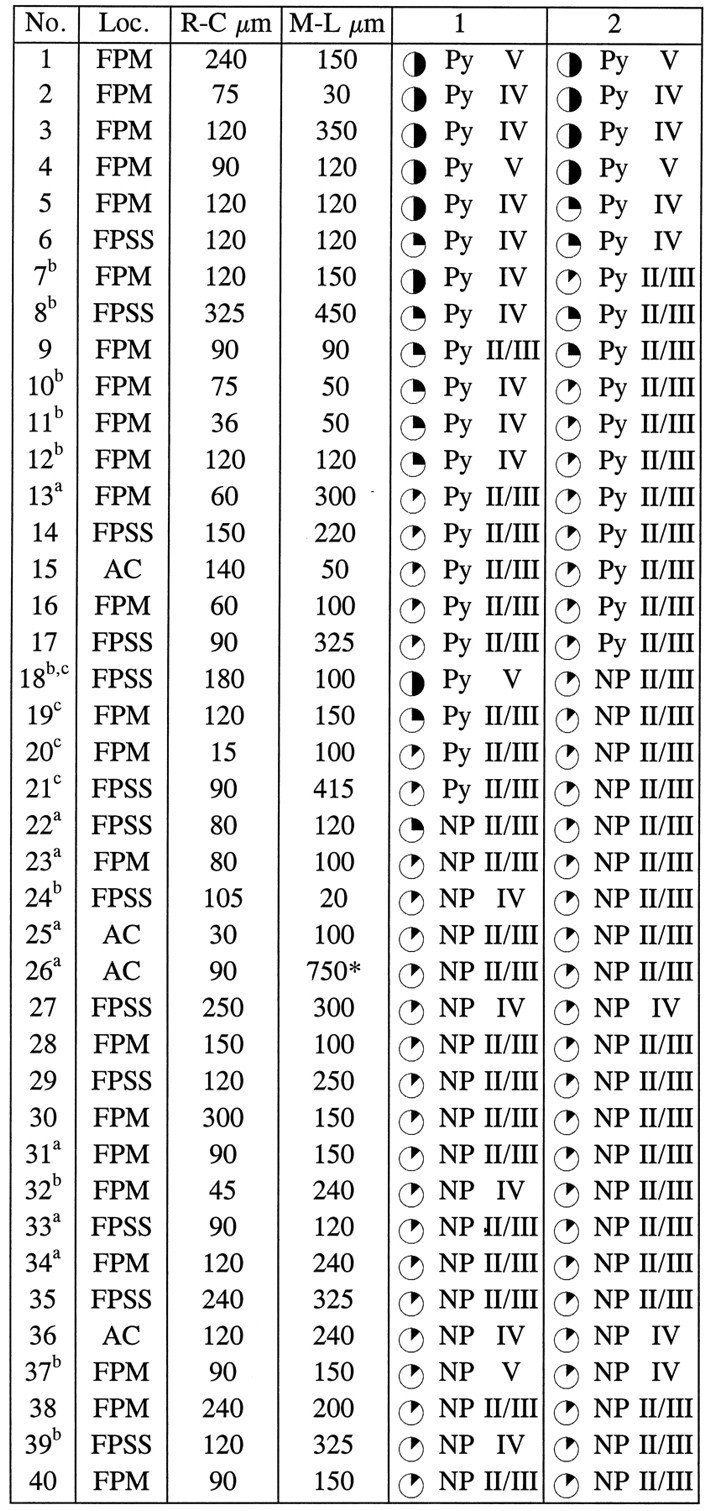
|
Data from 36 cortical hemispheres of 2-week-old rats given injections of retrovirus and BrdU at E16 are reported here.
Cells were studied either in double-immunostained cryostat sections orain adjacent semithin sections. Two-cell clusters are defined as pairs of β-gal+ cells located within 540 μm in both rostrocaudal and mediolateral dimensions. A cluster extending for >540 μm is marked with an asterisk.
Clusters that include cells located in different layers.
Clusters that include cells with different phenotype. Cortical areas were defined according to Paxinos and Watson (1986); laminar location was assigned according to Krieg (1946). Cells were classified as pyramidal neurons (Py) or nonpyramidal neurons (NP) according to morphological features, which included size and shape of the cell body and cellular processes, axonal morphology when applicable, and nuclear size and shape (Peters and Jones, 1984). In semithin sections, cells were classified on the basis of their immunoreactivity for GABA or glutamate. For the level of BrdU-immunoreactive nuclear area: ✺ = 25–50%; = 12–25%; = <12%.
Almost one-half of the two-cell clusters were composed of nonpyramidal neurons. In cryostat-cut sections stained with β-gal antiserum, nonpyramidal neurons showed extensive dendritic staining (Fig.3A), allowing for unequivocal classification; in Araldite-embedded sections, these neurons were immunoreactive for GABA. Clonally related nonpyramidal cells displayed similar low levels of BrdU immunoreactivity and were often located in the same layer. The laminar location was not necessarily the one expected for the low level of BrdU immunoreactivity found in these cells (see Table 4). For example, some clusters were observed in the infragranular layers (see clusters 27, 36, and 37 in Table 4), with both cells displaying very low levels of BrdU immunoreactivity. In contrast, pyramidal cells were consistently found in the correct layer for the level of BrdU immunoreactivity, both in two-cell clusters and in larger clusters (see previous paragraphs). Five two-cell clusters composed of pyramidal neurons were located in the infragranular layers and displayed high levels of BrdU immunoreactivity (Table 4). This suggested that these cells were also generated by symmetrical divisions of their immediate precursors, and these terminal divisions had taken place immediately after the incorporation of retrovirus and BrdU. Four two-cell clusters were composed of one pyramidal and one nonpyramidal neuron either born at the same time (see clusters 20 and 21 in Table 4 and Fig.3A,B) or with the pyramidal neuron born earlier (clusters 18 and 19 in Table 4).
Isolated cells
One hundred thirty isolated β-gal+ cells were found in the cortex of 18 two-week-old rats given injections of retrovirus at E16. These cells were separated by at least 540 μm from any other β-gal+ cell. Isolated β-gal+ cells may be the result of the integration of the reporter gene into the postmitotic daughter of an infected progenitor cell (Hajihosseini et al., 1994) or cells that had migrated away from their relatives. Alternatively, isolated β-gal+ cells may be the only survivors of larger clones (or the only cells still expressing the reporter gene; Cepko et al., 1993).
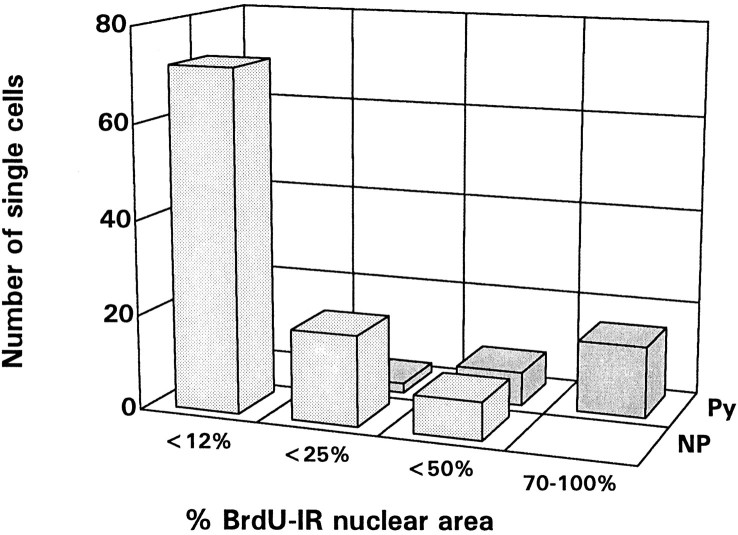
As a result, cells that had become postmitotic immediately after the integration of retrovirus and BrdU were marked by high levels of BrdU immunoreactivity (50–100% of immunofluorescent nuclear area). We found that only 15 of the 130 isolated β-gal+ cells found in the cortex of 2-week-old rats were characterized by high levels of BrdU immunoreactivity. Such cells were considered as clones and represented 11% of the total number of isolated β-gal+cells. It was of interest that high levels of BrdU immunoreactivity, indicative of the incorporation of retrovirus and BrdU into progenitors immediately before the generation of postmitotic daughters, were found only in isolated β-gal+ pyramidal neurons (Fig.3C). In cryostat-cut sections, 85% of the 87 isolated β-gal+ cells showed features of nonpyramidal neurons with less than 12% of their nuclear area being BrdU immunoreactive, supporting the notion that many isolated β-gal+ cells were originally part of larger clones (Fig. 3D). Similar findings were obtained from the study of the 43 isolated β-gal+ cells in semithin sections (Fig.4A–D).
Fig. 4.
An isolated bipolar β-gal+ cell from the cortex of a 2-week-old rat is shown in A (Vibratome section) and in B–D in adjacent semithin sections (arrows), either unstained (B) or after immunostaining for GABA (C) or BrdU (D). This cell was GABA immunoreactive (a marker of nonpyramidal neurons), as were many other isolated β-gal+ cells at this age, and displayed 12–25% BrdU-immunoreactive nuclear area. Three neighboring neurons (1–3) and blood vessels (asterisks) are shown as landmarks. Scale bars, 20 μm.
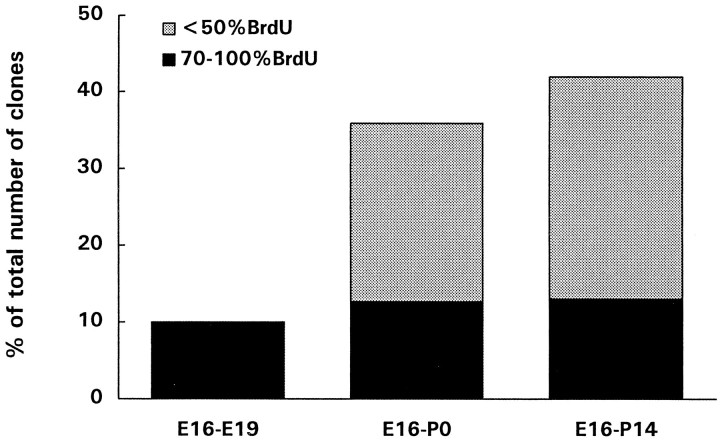
We hypothesized that these isolated labeled cells with low levels of BrdU could be the result of tangential migration or death/switching off of the reporter gene in their clonal relatives. If isolated β-gal+ cells were the result of epigenetic events, including tangential migration or death of clonal relatives, then their relative number should be much lower in brains examined shortly after the injection of retrovirus, when migration of β-gal+cells has just started and the wave of cell death that affects postmitotic neurons is not at its peak (that is at 2–3 weeks of age,Ferrer et al., 1992). We have indeed confirmed previous findings (Mione et al., 1994) showing that isolated β-gal+ cells represented only 10% of the total number of clones 72 hr after the injection of retrovirus and BrdU, as opposed to over 40% in 2-week-old rats (Fig. 5). Moreover, whereas all isolated β-gal+ cells present in E19 rat brains were heavily labeled with BrdU, only a fraction of the isolated β-gal+cells present in 2-week-old rats were heavily labeled (Fig.6).
Fig. 5.
Histogram showing the percentages of isolated β-gal+ cells over the total number of clusters and pairs at different ages, after the injection of retrovirus and BrdU at E16, and the proportion of these cells that displayed high levels of BrdU immunoreactivity (dark bars). Isolated β-gal+ cells were studied in E19 rat embryos (3 d after injections), in newborn rats, and in 2-week-old rats. Less than 10% of the clones found at E19 were composed of a single cell, all of which displayed high levels of BrdU immunoreactivity. At later times after the injections, isolated β-gal+ cells increased in number, possibly as a result of tangential migration and/or death of clonal relatives. However, the number of single-cell clones (isolated cells with high levels of BrdU immunoreactivity) remained constant and represented ∼10% of all clusters at any age examined. The results obtained are pooled from at least five animals for each age group.
Fig. 6.
The phenotype and BrdU levels of 130 isolated β-gal+ cells found in the cortex of 18 two-week-old rats given injections of retrovirus and BrdU at E16 are plotted here. A vast majority of cells were nonpyramidal neurons with low levels of BrdU immunoreactivity (light gray bars). Isolated nonpyramidal neurons with intermediate levels of BrdU immunoreactivity were also found. However, all isolated β-gal+ cells with 70–100% BrdU-immunoreactive nuclear area, indicative of single-cell clones, were pyramidal cells (dark bars).
DISCUSSION
Analysis of BrdU levels in clonally related cells and characterization of their phenotypes revealed that cortical pyramidal neurons may be generated through asymmetrical division (most early-born cells), symmetrical division (some early- and most late-born cells), and a combination of the two. Their distribution in clusters suggests that they follow a pattern of radial migration. In contrast, nonpyramidal neurons, which were found exclusively as isolated cells or pairs, were born relatively late within the lineages of progenitor cells labeled at E16. Glial cells were the last to be born and formed discrete clusters. The present study provides new information about the organization of cell lineages in the cerebral cortex and argues that the composition of cortical clones as observed in lineage studies is determined by both inherited and extrinsic mechanisms.
Symmetrical and asymmetrical divisions of cortical progenitor cells
In all cases in which clonally related cells maintained a close spatial relationship with each other, it was possible to analyze the order of birth of sibling cells using the level of BrdU immunoreactivity. The results were consistent with the laminar position of the cells. Two types of clusters were seen, defined as radial and horizontal, based on the spatial distribution of the constituent cells. The family trees of radial neuronal clusters were indicative of asymmetrical divisions of cortical progenitor cells, in which postmitotic neurons were produced from early divisions.
The results presented here indicate that asymmetrically dividing lineages give rise to pyramidal neurons in both infragranular and supragranular layers. These cells project to different targets (for review see O’Leary and Koester, 1993) and express different molecular phenotypes (Frantz et al., 1994a,b). The absence of a lineage-dependent laminar specification was suggested in previous studies with recombinant retroviruses (Luskin et al., 1988; Walsh and Cepko, 1988;Grove et al., 1993; Luskin et al., 1993; Mione et al., 1994), but other authors (Fishell et al., 1990; Krushel et al., 1993) have hypothesized the existence of lineages dedicated to the production of neurons for either the infragranular or the supragranular layers. Such a hypothesis is compatible with horizontal clusters, and with the finding that in many two-cell clusters both neurons reside in the same or adjacent layers (Table 4). In horizontal clusters, the location and low level of BrdU immunoreactivity in clonally related cells suggest that their progenitors have undergone some proliferative mitoses before giving rise to postmitotic neurons. A similar pattern of distribution has recently been described in the monkey cerebral cortex (Kornack and Rakic, 1995) and was interpreted as being produced by symmetrically dividing cells. On the basis of the levels of BrdU immunoreactivity and the number of cells in these clusters, we envisaged that a larger number of cells were lost from horizontal than from radial clusters either through cell death (see Blaschke et al., 1996; Thomaidou et al., 1997) and/or dispersion.
Asymmetrical divisions have been related to the segregation of cell fate determinants into only one of the newly generated progeny (reviewed by Doe and Spana, 1995). The mechanism for this has been studied intensively in Drosophila, where some lineages (e.g., the lineages of neuroblasts; Spana and Doe, 1995) are largely invariant. Recently, a mouse homolog of Drosophila Numb has been found to be asymmetrically distributed during mitosis in cortical cell progenitors (Zhong et al., 1996). Moreover, m-Numb was found to physically interact with Notch1, a transmembrane protein, that together with Delta conveys cell-extrinsic mechanisms of fate determination (reviewed by Artavanis-Tsakonas, 1995). Notch1 has recently been found to be asymmetrically restricted to the apical cells in horizontally cleaved mitoses (Chenn and McConnell, 1995).
Radial and nonradial migration
Results from our analysis of BrdU levels suggested that the vast majority of isolated β-gal+ cells and of two-cell clusters were part of larger clones and that they had settled at some distance from their clonal relatives. Dispersion of clonally related cells during migration has been reported previously (Austin and Cepko, 1990; Walsh and Cepko, 1993), and Reid et al. (1995) have hypothesized the existence of migrating progenitors that give rise to one to two daughters in different locations in the ventricular zone to explain the observed periodical distance between subunits of the same clone. The present findings of isolated β-gal+ cells and pairs that were born some divisions after the incorporation of the retroviral lineage marker support the model proposed by these authors. According to this model, our results suggest that subunits generated by the last divisions of these migrating progenitors are composed predominantly of nonpyramidal neurons.
In addition to the horizontal migration of progenitor cells in the proliferative zones (Fishell et al., 1993; Reid et al., 1995), displacement of some clonally related cells may be a result of tangential migration of postmitotic neurons at the level of the subventricular or intermediate zone. Evidence from both in vitro and in vivo studies suggests that migrating neurons can slide from one glial process to another (Misson et al., 1991) and may even ignore radial glial fibers during their migration to the cortical plate (Roberts et al., 1993; O’Rourke et al., 1995). Experiments with X-chromosome-linked mosaics (Tan and Breen, 1993; Tan et al., 1995) also suggested the possibility of tangential migration to explain the mixing of cortical cells with different genotypes, although the intermingling of progenitor cells in the proliferative zone was also considered (Rakic, 1995).
Radial and nonradial migratory routes may expose young neurons to yet unknown but probably different cues that may be important for the acquisition of a specific phenotype. Lineage experiments in the chick optic tectum have provided evidence that different migratory paths are related to the phenotypic choices of clonally related cells (Gray and Sanes, 1991). Similar results have been obtained in the chick spinal cord, where early circumferentially migrating cells develop features of commissural interneurons (Leber and Sanes, 1995). Reese et al. (1995)have reported that in the retina of X-inactivated transgenic mice, only specific subtypes of retinal cells were displaced from the vertical columns of cells with the same genotype. Cell type-specific migratory routes may be a selective mechanism to sort out different phenotypes generated by multipotential progenitors. The proportion of progenitors and/or postmitotic cells that are engaged in nonradial migration is between 12 and 30% (O’Rourke et al., 1992, 1995; Tan et al., 1995). Moreover, O’Rourke et al. (1995) have provided evidence that the tangentially migrating cells in the intermediate zone of newborn ferrets are neurons. These data are compatible with the reported proportion of nonpyramidal neurons present in the mammalian cerebral cortex (15–30%; Parnavelas et al., 1977; Rockel et al., 1980; Lin et al., 1986; Meinecke and Peters, 1987).
Our findings that isolated β-gal+ cells are predominantly nonpyramidal neurons that have lost contact with their clonal relatives suggest that there may be a relationship between horizontal migration, either of young neurons or of their immediate precursors, and the development of the nonpyramidal phenotype. Among the different cortical cell types, nonpyramidal neurons show less distinctive regional features than their neighbor pyramidal cells (DeFelipe and Farinas, 1992). In addition, many neurochemical and morphological aspects of the nonpyramidal phenotype become evident relatively late in cortical development (Parnavelas et al., 1978; Del Rio et al., 1992; Lavdas et al., 1996). These aspects of the biology of interneurons are in agreement with both a late birth, at least within lineages, and the lack (or different complement) of cell–cell communication (through gap junctions, for example) in horizontally migrating cells, that may be an important determinant of cell identity in radially migrating clusters of pyramidal neurons.
Order of birth of cortical cell types
The organization of cortical cell lineages in the mammalian brain, as studied with lineage markers, has been hindered by the dispersal and/or death of clonal relatives at various stages of their development. The use of genetic tags to correctly assign labeled cells to defined clones (Walsh and Cepko, 1992, 1993) has proved useful in revealing the extent of dispersion of clonal relatives. However, this approach has dealt with only a small sample of cells and provides no information about the generation, migration, and differentiation in cortical lineages. In an earlier study in adult rats (Mione et al., 1994), we found that very large clusters (up to 100 cells) of β-gal+ cells were composed of glia, clusters of 2–23 β-gal+ cells were composed of pyramidal neurons, whereas nonpyramidal cells were typically found in pairs. More recently, when we examined developing (1- to 3-week-old) rats, we observed a number of mixed clusters composed of pyramidal and nonpyramidal neurons (Lavdas et al., 1996), which suggested the existence of common progenitors for the two main classes of cortical neurons. Clusters composed of cells with different phenotypes have also been reported by others (Price and Thurlow, 1988; Walsh and Cepko, 1992; Luskin et al., 1993). Although the number of mixed clusters was too low in the present study to draw definitive conclusions about the order of birth of different cell types, we noted that in mixed pyramidal/nonpyramidal clusters, pyramidal cells were born earlier or at the same time as their sibling nonpyramidal neurons; in mixed pyramidal/astrocyte clusters, the neurons were always born earlier than the glial cells. Similarly, in the population of labeled cells as a whole, all the early-born cells were pyramidal neurons, whereas nonpyramidal neurons and glial cells were characterized by progressively lower levels of BrdU. The association of each class of labeled cells with a restricted and distinct range of BrdU labeling suggests that in the mammalian cerebral cortex, as in neural crest lineages (for review see Anderson, 1989), the generation of different cell types from multipotential progenitors is a highly regulated process.
Footnotes
This work was supported by the Wellcome Trust. We are grateful to Dr. Jack Price for the generous gift of the β-gal antiserum. We thank Peter Boardman for technical assistance, and we thank Bagi Nadarajah and Kate Whitley for help with the confocal microscope.
Correspondence should be addressed to Dr. Marina Mione, Department of Anatomy and Developmental Biology, University College London, Gower Street, London WC1E 6BT, UK.
REFERENCES
- 1.Acklin SE, van der Kooy D. Clonal heterogeneity in the germinal zone of the developing rat telencephalon. Development. 1993;118:175–192. doi: 10.1242/dev.118.1.175. [DOI] [PubMed] [Google Scholar]
- 2.Anderson DJ. The neural crest lineage problem: neuropoiesis? Neuron. 1989;3:1–12. doi: 10.1016/0896-6273(89)90110-4. [DOI] [PubMed] [Google Scholar]
- 3.Artavanis-Tsakonas S, Matsuno K, Fortini ME. Notch signaling. Science. 1995;268:225–232. doi: 10.1126/science.7716513. [DOI] [PubMed] [Google Scholar]
- 4.Austin CP, Cepko CL. Cellular migration patterns in the developing mouse cerebral cortex. Development. 1990;110:713–732. doi: 10.1242/dev.110.3.713. [DOI] [PubMed] [Google Scholar]
- 5.Bayer SA, Altman J. Neocortical development. Raven; New York: 1991. [Google Scholar]
- 6.Blaschke AJ, Staley K, Chun J. Widespread programmed cell death in proliferative and postmitotic regions of the fetal cerebral cortex. Development. 1996;122:1165–1174. doi: 10.1242/dev.122.4.1165. [DOI] [PubMed] [Google Scholar]
- 7.Boulder Committee. Embryonic vertebrate central nervous system: revised terminology. Anat Rec. 1970;166:257–261. doi: 10.1002/ar.1091660214. [DOI] [PubMed] [Google Scholar]
- 8.Caviness VS, Jr, Takahashi T, Nowakowski RS. Numbers, time and neocortical neurogenesis: a general developmental and evolutionary model. Trends Neurosci. 1995;18:379–383. doi: 10.1016/0166-2236(95)93933-o. [DOI] [PubMed] [Google Scholar]
- 9.Cepko CL, Ryder EF, Austin CP, Walsh C, Fekete DM. Lineage analysis using retrovirus vectors. Methods Enzymol. 1993;225:933–960. doi: 10.1016/0076-6879(93)25059-b. [DOI] [PubMed] [Google Scholar]
- 10.Chenn A, McConnell SK. Cleavage orientation and the asymmetric inheritance of Notch1-immunoreactivity in mammalian neurogenesis. Cell. 1995;82:631–641. doi: 10.1016/0092-8674(95)90035-7. [DOI] [PubMed] [Google Scholar]
- 11.DeFelipe J, Farinas I. The pyramidal neuron of the cerebral cortex: morphological and chemical characteristics of the synaptic inputs. Progr Neurobiol. 1992;39:563–607. doi: 10.1016/0301-0082(92)90015-7. [DOI] [PubMed] [Google Scholar]
- 12.Del Rio JA, Soriano E, Ferrer I. Development of GABA-immunoreactivity in the neocortex of the mouse. J Comp Neurol. 1992;326:501–526. doi: 10.1002/cne.903260403. [DOI] [PubMed] [Google Scholar]
- 13.Doe CQ, Spana EP. A collection of cortical crescents: asymmetric protein localization in CNS precursor cells. Neuron. 1995;15:991–995. doi: 10.1016/0896-6273(95)90088-8. [DOI] [PubMed] [Google Scholar]
- 14.Ferrer I, Soriano E, del Rio JA, Alcantara S, Auladell C. Cell death and removal in the cerebral cortex during development. Progr Neurobiol. 1992;39:1–43. doi: 10.1016/0301-0082(92)90029-e. [DOI] [PubMed] [Google Scholar]
- 15.Fishell G, Rossant J, van der Kooy D. Neuronal lineages in chimeric mouse forebrain are segregated between compartments and in the rostrocaudal and radial planes. Dev Biol. 1990;141:70–83. doi: 10.1016/0012-1606(90)90102-o. [DOI] [PubMed] [Google Scholar]
- 16.Fishell G, Mason CA, Hatten ME. Dispersion of neural progenitors within the germinal zones of the forebrain. Nature. 1993;362:636–640. doi: 10.1038/362636a0. [DOI] [PubMed] [Google Scholar]
- 17.Frantz GD, Bohner AP, Akers RM, McConnell SK. Regulation of the POU domain gene SCIP during cerebral cortical development. J Neurosci. 1994a;14:472–485. doi: 10.1523/JNEUROSCI.14-02-00472.1994. [DOI] [PMC free article] [PubMed] [Google Scholar]
- 18.Frantz GD, Weimann JM, Levin ME, McConnell SK. Otx1 and Otx2 define layers and regions in developing cerebral cortex and cerebellum. J Neurosci. 1994b;14:5725–5740. doi: 10.1523/JNEUROSCI.14-10-05725.1994. [DOI] [PMC free article] [PubMed] [Google Scholar]
- 19.Gray GE, Sanes JR. Migratory paths and phenotypic choices of clonally related cells in the avian optic tectum. Neuron. 1991;6:211–225. doi: 10.1016/0896-6273(91)90357-6. [DOI] [PubMed] [Google Scholar]
- 20.Grove EA, Williams BP, Li DQ, Hajihosseini M, Friedrich A, Price J. Multiple restricted lineages in the embryonic rat cerebral cortex. Development. 1993;117:553–561. doi: 10.1242/dev.117.2.553. [DOI] [PubMed] [Google Scholar]
- 21.Hajihosseini M, Iavachev L, Price J. Evidence that retroviruses integrate into post-replication host DNA. EMBO J. 1994;12:4969–4974. doi: 10.1002/j.1460-2075.1993.tb06190.x. [DOI] [PMC free article] [PubMed] [Google Scholar]
- 22.Kornack DR, Rakic P. Radial and horizontal deployment of clonally related cells in the primate neocortex: relationship to distinct mitotic lineages. Neuron. 1995;15:311–321. doi: 10.1016/0896-6273(95)90036-5. [DOI] [PubMed] [Google Scholar]
- 23.Kreig WJS. Connections of the cerebral cortex. I. The albino rat. B. Structure of the cortical areas. J Comp Neurol. 1946;84:277–324. doi: 10.1002/cne.900840302. [DOI] [PubMed] [Google Scholar]
- 24.Krushel LA, Johnston JG, Fishell G, Tibshirani R, van der Kooy D. Spatially localized neuronal cell lineages in the developing mammalian forebrain. Neuroscience. 1993;53:1035–1047. doi: 10.1016/0306-4522(93)90487-z. [DOI] [PubMed] [Google Scholar]
- 25.Lavdas AA, Mione MC, Parnavelas JG. Neuronal clones in the cerebral cortex show morphological and neurotransmitter heterogeneity during development. Cereb Cortex. 1996;6:490–497. doi: 10.1093/cercor/6.3.490. [DOI] [PubMed] [Google Scholar]
- 26.Leber SM, Sanes JR. Migratory paths of neurons and glia in the embryonic chick spinal cord. J Neurosci. 1995;15:1236–1248. doi: 10.1523/JNEUROSCI.15-02-01236.1995. [DOI] [PMC free article] [PubMed] [Google Scholar]
- 27.Lin C-S, Lu SM, Schmechel DE. Glutamic acid decarboxylase and somatostatin immunoreactivities in the rat visual cortex. J Comp Neurol. 1986;244:369–383. doi: 10.1002/cne.902440309. [DOI] [PubMed] [Google Scholar]
- 28.Luskin MB, Pearlman AL, Sanes JR. Cell lineage in the cerebral cortex of the mouse studied in vivo and in vitro with a recombinant retrovirus. Neuron. 1988;1:635–647. doi: 10.1016/0896-6273(88)90163-8. [DOI] [PubMed] [Google Scholar]
- 29.Luskin MB, Parnavelas JG, Barfield JA. Neurons, astrocytes, and oligodendrocytes of the rat cerebral cortex originate from separate progenitor cells: an ultrastructural analysis of clonally related cells. J Neurosci. 1993;13:1730–1750. doi: 10.1523/JNEUROSCI.13-04-01730.1993. [DOI] [PMC free article] [PubMed] [Google Scholar]
- 30.Meinecke DL, Peters A. GABA immunoreactive neurons in rat visual cortex. J Comp Neurol. 1987;261:388–404. doi: 10.1002/cne.902610305. [DOI] [PubMed] [Google Scholar]
- 31.Miller MW. Cogeneration of retrogradely labeled corticocortical projection and GABA-immunoreactive local circuit neurons in cerebral cortex. Dev Brain Res. 1985;23:187–192. doi: 10.1016/0165-3806(85)90040-9. [DOI] [PubMed] [Google Scholar]
- 32.Miller DG, Adam MA, Miller AD. Gene transfer by retrovirus occurs only in cells that are actively replicating at the time of infection. Mol Cell Biol. 1990;10:4239–4292. doi: 10.1128/mcb.10.8.4239. [DOI] [PMC free article] [PubMed] [Google Scholar]
- 33.Mione MC, Danevic C, Boardman P, Harris B, Parnavelas JG. Lineage analysis reveals neurotransmitter (GABA or glutamate) but not calcium-binding protein homogeneity in clonally related cortical neurons. J Neurosci. 1994;14:107–123. doi: 10.1523/JNEUROSCI.14-01-00107.1994. [DOI] [PMC free article] [PubMed] [Google Scholar]
- 34.Mione MC, Pappas IS, Lavdas A, Parnavelas JG. Lineage analysis of β-galactosidase-positive neurones: postembedding immunohistochemistry and double immunofluorescence. Neurosci Protocol. 1996;30:1–15. [Google Scholar]
- 35.Misson JP, Austin CP, Takahashi T, Cepko CL, Caviness VS., Jr The alignment of migrating neural cells in relation to the murine neopallial radial glial fiber system. Cereb Cortex. 1991;1:221–229. doi: 10.1093/cercor/1.3.221. [DOI] [PubMed] [Google Scholar]
- 36.Nowakowski RS, Lewin SB, Miller MW. Bromodeoxyuridine immunohistochemical determination of the lengths of the cell cycle and the DNA-synthetic phase for an anatomically defined population. J Neurocytol. 1989;18:311–318. doi: 10.1007/BF01190834. [DOI] [PubMed] [Google Scholar]
- 37.O’Leary DM, Koester SE. Development of projection neuron types, axon pathways, and patterned connections of the mammalian cortex. Neuron. 1993;10:991–1006. doi: 10.1016/0896-6273(93)90049-w. [DOI] [PubMed] [Google Scholar]
- 38.O’Rourke NA, Dailey ME, Smith SJ, McConnell SK. Diverse migratory pathways in the developing cerebral cortex. Science. 1992;258:299–302. doi: 10.1126/science.1411527. [DOI] [PubMed] [Google Scholar]
- 39.O’Rourke NA, Sullivan DP, Kaznowski CE, Jacobs AA, McConnell SK. Tangential migration of neurons in the developing cerebral cortex. Development. 1995;121:2165–2176. doi: 10.1242/dev.121.7.2165. [DOI] [PubMed] [Google Scholar]
- 40.Parnavelas JG, Lieberman AR, Webster KE. Organization of neurons in the visual cortex, area 17, of the rat. J Anat. 1977;124:305–322. [PMC free article] [PubMed] [Google Scholar]
- 41.Parnavelas JG, Bradford R, Mounty EJ, Lieberman AR. The development of non-pyramidal neurons in the visual cortex of the rat. Anat Embryol. 1978;155:1–14. doi: 10.1007/BF00315726. [DOI] [PubMed] [Google Scholar]
- 42.Parnavelas JG, Barfield JA, Franke E, Luskin MB. Separate progenitor cells give rise to pyramidal and nonpyramidal neurons in the rat telencephalon. Cereb Cortex. 1991;1:463–468. doi: 10.1093/cercor/1.6.463. [DOI] [PubMed] [Google Scholar]
- 43.Paxinos G, Watson C. The rat brain in stereotaxic coordinates, Ed 2. Academic; Sydney: 1986. [DOI] [PubMed] [Google Scholar]
- 44.Peters A, Jones EG. Classification of cortical neurons. In: Peters A, Jones EG, editors. Cerebral cortex, Vol 1. Plenum; New York: 1984. pp. 107–122. [Google Scholar]
- 45.Peters A, Palay SL, Webster H deF. The fine structure of the nervous system, Ed 3. Oxford University Press; Oxford: 1991. [Google Scholar]
- 46.Price J, Thurlow L. Cell lineage in the rat cerebral cortex: a study using retroviral-mediated gene transfer. Development. 1988;104:473–482. doi: 10.1242/dev.104.3.473. [DOI] [PubMed] [Google Scholar]
- 47.Price J, Turner D, Cepko C. Lineage analysis in the vertebrate nervous system by retrovirus-mediated gene transfer. Proc Natl Acad Sci USA. 1987;84:156–160. doi: 10.1073/pnas.84.1.156. [DOI] [PMC free article] [PubMed] [Google Scholar]
- 48.Reese BE, Harvey AR, Tan SS. Radial and tangential dispersion patterns in the mouse retina are cell-class specific. Proc Natl Acad Sci USA. 1995;92:2494–2498. doi: 10.1073/pnas.92.7.2494. [DOI] [PMC free article] [PubMed] [Google Scholar]
- 49.Rakic P. Radial versus tangential migration of neuronal clones in the developing cerebral cortex. Proc Natl Acad Sci USA. 1995;92:11323–11327. doi: 10.1073/pnas.92.25.11323. [DOI] [PMC free article] [PubMed] [Google Scholar]
- 50.Reid CB, Liang I, Walsh C. Systematic widespread clonal organization in cerebral cortex. Neuron. 1995;15:299–310. doi: 10.1016/0896-6273(95)90035-7. [DOI] [PubMed] [Google Scholar]
- 51.Roberts JS, O’Rourke NA, McConnell SK. Cell migration in cultured cerebral cortical slices. Dev Biol. 1993;155:396–408. doi: 10.1006/dbio.1993.1038. [DOI] [PubMed] [Google Scholar]
- 52.Rockel AJ, Hiorns RW, Powell TP. The basic uniformity in structure of the neocortex. Brain. 1980;103:221–244. doi: 10.1093/brain/103.2.221. [DOI] [PubMed] [Google Scholar]
- 53.Roe T, Reynolds TC, Yu G, Brown PO. Integration of murine leukemia virus DNA depends on mitosis. EMBO J. 1993;12:2099–108. doi: 10.1002/j.1460-2075.1993.tb05858.x. [DOI] [PMC free article] [PubMed] [Google Scholar]
- 54.Sanes JR, Rubenstein JL, Nicolas JF. Use of a recombinant retrovirus to study post-implantation cell lineage in mouse embryos. EMBO J. 1986;5:3133–3142. doi: 10.1002/j.1460-2075.1986.tb04620.x. [DOI] [PMC free article] [PubMed] [Google Scholar]
- 55.Spana EP, Doe CQ. The prospero transcription factor is asymmetrically localized to the cell cortex during neuroblast mitosis in Drosophila. Development. 1995;121:3187–3195. doi: 10.1242/dev.121.10.3187. [DOI] [PubMed] [Google Scholar]
- 56.Takahashi T, Nowakowski RS, Caviness VS., Jr Mode of cell proliferation in the developing mouse neocortex. Proc Natl Acad Sci USA. 1994;91:375–379. doi: 10.1073/pnas.91.1.375. [DOI] [PMC free article] [PubMed] [Google Scholar]
- 57.Takahashi T, Nowakowski RS, Caviness VS., Jr The cell cycle of the pseudostratified ventricular epithelium of the embryonic murine cerebral wall. J Neurosci. 1995;15:6046–6057. doi: 10.1523/JNEUROSCI.15-09-06046.1995. [DOI] [PMC free article] [PubMed] [Google Scholar]
- 58.Tan SS, Breen S. Radial mosaicism and tangential cell dispersion both contribute to mouse neocortical development. Nature. 1993;362:638–640. doi: 10.1038/362638a0. [DOI] [PubMed] [Google Scholar]
- 59.Tan SS, Faulkner-Jones B, Breen SJ, Walsh M, Bertram JF, Reese BE. Cell dispersion patterns in different cortical regions studied with an X-inactivated transgenic marker. Development. 1995;121:1029–1039. doi: 10.1242/dev.121.4.1029. [DOI] [PubMed] [Google Scholar]
- 60.Thomaidou D, Mione MC, Cavanagh JFR, Parnavelas JG (1997) Apoptosis and its relation to the cell cycle in the developing cerebral cortex. J Neurosci, in press. [DOI] [PMC free article] [PubMed]
- 61.Walsh C, Cepko CL. Clonally related cortical cells show several migration patterns. Science. 1988;241:1342–1345. doi: 10.1126/science.3137660. [DOI] [PubMed] [Google Scholar]
- 62.Walsh C, Cepko CL. Widespread dispersion of neuronal clones across functional regions of the cerebral cortex. Science. 1992;255:434–440. doi: 10.1126/science.1734520. [DOI] [PubMed] [Google Scholar]
- 63.Walsh C, Cepko CL. Clonal dispersion in proliferative layers of developing cerebral cortex. Nature. 1993;362:632–635. doi: 10.1038/362632a0. [DOI] [PubMed] [Google Scholar]
- 64.Williams BP, Read J, Price J. The generation of neurons and oligodendrocytes from a common precursor cell. Neuron. 1991;7:685–693. doi: 10.1016/0896-6273(91)90381-9. [DOI] [PubMed] [Google Scholar]
- 65.Zhong W, Feder JN, Jiang M-M, Jan LY, Jan Yn. Asymmetric localization of a mammalian numb homolog during cortical neurogenesis. Neuron. 1996;17:43–53. doi: 10.1016/s0896-6273(00)80279-2. [DOI] [PubMed] [Google Scholar]


