Abstract
Proteolipid protein (PLP) has been postulated to play a critical role in the early differentiation of oligodendrocytes (OLs) in addition to its known role as a structural component of myelin. To identify this early function, we blocked the synthesis of PLP in glial cultures with antisense oligodeoxynucleotides that targeted the PLP initiation codon. Primary glial cultures were incubated with phosphorothioate-protected oligodeoxynucleotides (S-ODNs) for up to 11 d. PLP in OLs was reduced >90%. OLs treated with antisense S-ODNs appeared strikingly healthy as judged by (1) immunocytochemical staining for myelin glycolipids and myelin basic protein, (2) their prolonged survival compared with untreated cultures, and (3) their ability to re-establish membrane sheets after removal of the S-ODNs.
Our studies show that PLP is required for elaboration and stability of the myelin membrane sheets made by most OLs, but it is not necessary for the network of processes established by OLs. More importantly, the number of OLs in the antisense-treated cultures was nearly sevenfold greater after a 10–11 d incubation with S-ODNs than in control cultures. The number of proliferating OL progenitors was not increased in the antisense-treated cultures, indicating that the increase in the number of OLs was attributable to prolonged OL survival. The tissue culture studies reveal that the absence of PLP/DM20 has the positive effect of promoting OL survival but the negative effect of preventing their full differentiation. This finding clarifies many of the paradoxical findings seen in the PLP mutants, the PLP overexpressers, and the PLP− animals.
Keywords: oligodendrocytes, myelin, proteolipid protein, antisense, neuroglia, survival
In the CNS, myelin is a modification of the oligodendroglial plasma membrane that is spiralled around and extended along the axon to form a multilamellar structure. Proteolipid protein (PLP) and DM20, which is an alternatively spliced isoform of the PLP gene (Nave et al., 1987), constitute ∼50% of the protein in myelin (Greenfield et al., 1971). It is generally accepted that one of the biological functions of PLP is to maintain the structural integrity of the myelin membrane (Duncan et al., 1987; Boison and Stoffel, 1994;Nave, 1994; Boison et al., 1995).
Evidence from many different studies strongly suggests that PLP plays another role in early oligodendrocyte (OL) differentiation (Knapp et al., 1986; Skoff and Knapp, 1990; Vermeesch et al., 1990) that is critical for continued oligodendrocyte differentiation. This role is probably more important for OL differentiation than its function as an adhesive molecule. The evidence for early OL differentiation is that the phenotype of OLs is abnormal in the PLP mutants long before aberrant myelin is formed or before compact myelin is made in normal animals.
A striking and functionally significant defect observed in most of the PLP mutants is a dramatic increase in the number of dying OLs (Knapp et al., 1986; Jackson and Duncan, 1988). Their death begins several hours after mitosis (Vermeesch et al., 1990). This finding is significant because compaction of the myelin sheath does not occur until 2–3 d after mitosis (Skoff et al., 1976; Vermeesch et al., 1990). The death of many OLs in the PLP mutants before myelination strongly suggests a dissociation between death and myelin sheath compaction. Additional evidence for the dissociation between these two PLP defects is illustrated by one PLP mutant, rumpshaker (rsh), which has a normal life span. rsh has very little OL death, yet it exhibits abnormal myelin periodicity (Griffiths et al., 1990;Schneider et al., 1992). Alone, abnormal periodicity of the myelin sheath is not lethal, because a null mutation for PLP exhibits abnormal compaction of myelin, but the mice have a normal lifespan (Boison et al., 1995). In contrast to the PLP− mice, a modest transcriptional overexpression of the PLP gene produces a phenotype that mimics most of the properties of the dysmyelinating mutants and is lethal (Readhead et al., 1994). The picture portrayed by the PLP overexpressers, PLP− animals, and the PLP mutants is that slight overexpression of the gene and amino acid substitutions in PLP/DM20 proteins is lethal; in contrast, the absence of PLP/DM20 is not. Paradoxical as this information may seem, mutations of the PLP gene in Pelizaeus–Merzbacher (P–M) disease, the human counterpart to the animal mutants, dramatically confirm the animal observations. Conservative amino acid substitutions of PLP are almost always lethal (Hodes et al., 1993), and gene duplications are highly lethal (Ellis and Malcolm, 1994), but a male with a deletion of the gene was still alive at the age of 35 (Raskind et al., 1991). The conclusion drawn from these mutants is that no PLP/DM20 is potentially better than a mutated variety of PLP/DM20 or even a slight overexpression. Our study with antisense phosphorothioate-protected oligodeoxynucleotides (S-ODNs) to PLP to block its synthesis helps to unravel the paradoxical functions of this gene. We show that PLP/DM20 has positive and negative roles in OL differentiation. Without it, OLs fail to elaborate membrane sheets in culture that resemble myelin sheaths of the animal, but they also survive much longer than normal OLs.
MATERIALS AND METHODS
Following our routine laboratory procedures (Knapp et al., 1987), we used mixed glial primary cultures to prepare cortical cells from 0 to 3 d postnatal B6CBA mice (Jackson Laboratories, Bar Harbor, ME). Poly-l-lysine-coated 12-mm-diameter coverslips were plated with 250,000 cells. The cultures were fed with DMEM containing 10% heat-inactivated fetal calf serum (FCS), 2 mm glutamine, and 25 μg/ml gentamicin. The medium was changed every 3 d until the application of ODNs. For most experiments, the application of ODNs began between 12 and 14 din vitro (DIV), because at this age many OLs have large membrane sheets containing PLP and myelin basic protein (MBP).
To determine whether blocking the synthesis of PLP interferes with the elaboration of membrane sheets, we applied antisense ODNs to primary cultures at 9 DIV (a time point before almost all OLs have begun to elaborate sheets and before expression of PLP in OLs). To study whether mature OLs with membrane sheets could recover from the effects of the antisense, we incubated older 22 DIV primary cultures with antisense for several days and then returned to normal medium for an additional 3 d.
To confirm that the effects of the antisense on OLs were not mediated by astrocytes (ASs), we prepared enriched OLs from 7–9 d in vitro primary cultures from Petri dishes, following the procedure of Feutz et al. (1995). Briefly, the OLs growing on the astrocyte bed layer were collected by syringing the medium over the cells with a 10 ml syringe and centrifuging the suspension for 7 min at 900 rpm. The collected OLs were resuspended in AS-conditioned medium and plated onto poly-l-lysine-coated coverslips at 20,000 cells per coverslip. To prepare astrocyte-conditioned medium, we placed defined DMEM containing glucose (1.0 mg/ml), transferrin (10 μg/ml), and insulin (5 μg/ml) on cultures of astrocytes overnight; then the medium was collected, passed through a 0.22 μm filter, and stored at −70°C. Cultures were grown under the same conditions as described above.
From each mouse, ∼24 coverslips were prepared and divided into control and experimental groups. However, two to four brains were usually pooled so that many different time points involving normal, sense-, and antisense-treated coverslips could be compared in one experiment. At appropriate time points (see Immunostaining below), the coverslips were immunostained with different antibodies. The data obtained from the experimental coverslips were compared directly with the control data of the same animal(s) used in the same experiment.
Oligonucleotide synthesis and purification. Both unprotected (O-) and S-ODNs were synthesized on an Applied Biosystems Model 394 (Foster City, CA) at the Wayne State University School of Medicine macromolecular core facility. The first few studies used O-ODNs at various concentrations that ranged from 10 to 100 μm. At high concentrations, they were toxic; at low concentrations, they had no apparent specific effects on OLs. S-ODNs were purified by reverse-phase chromatography with Oligo-Pak oligonucleotide purification columns (Chromatography Division, Millipore, Bedford, MA) following the manufacturer’s recommendations. Purified ODNs were scanned by UV spectrophotometry to measure absorbance at 260 nm.
The 27-mer antisense, sense, and random S-ODNs and 23-mer antisense and sense S-ODNs were used in initial experiments to determine whether antisense S-ODNs had specific effects on OLs, as compared with the O-ODNs and control S-ODNs. The two antisense constructs targeted the region of the initiation codon: the 23-mer antisense ODN (5′- AGC CCA TGT CTT TGG CAC TCT GA -3′) spanned nucleotides (nts) −16→+7 and the 27-mer (5′- GCA CAA CAC TCT AAC AAG CCC ATG TCT -3′) spanned nts −4→+23 (Macklin et al., 1987). A search of GenBank and EMBL databases showed identical bases for only the targeted PLP sequence. The closest homology to the 23-mer ODN is a sequence in the human immunoglobulin heavy chain gene with three base substitutions. The sense control maintains structural features, whereas the random sequence maintains the composition with the same number of CGs and ATs as the antisense construct but does not maintain structural features such as stem loops (Stein and Krieg, 1994).
Oligonucleotide treatment of cultures. The 23- and 27-mer S-ODNs, ranging from 1 to 25 μm, were applied to 12–14 DIV cultures three times over a 48 hr period to test for toxicity and effects on OL structure and AS organization. Two different concentrations, 2.5 and 5 μm, of sense, antisense, random, and antisense did not result in toxicity, but the antisense caused specific changes in OL morphology. The cultures received one dose of antisense, sense, or random S-ODNs at 0 hr and then an additional dosage every 24 hr. The untreated controls were changed with the same medium at the same time.
Immunostaining. Staining with the A007 antibody (Bansal et al., 1992) was performed from 1 to 11 d after the cells were incubated with S-ODNs. Most cultures were rinsed with 10% FCS–DMEM, incubated with the primary antibody A007 at room temperature (RT) for 30 min, rinsed in PBS (5 min), and incubated with the goat anti-mouse IgM antibody (Boehringer Mannheim, Indianapolis, IN) conjugated with rhodamine at 1:100 (RT, 30 min). Then cells were fixed in 4% paraformaldehyde (pH 7.2 in PBS; RT, 10 min).
Other cultures were fixed with 4% paraformaldehyde, rinsed, incubated with a MBP monoclonal antibody at 1:100 in PBS (MBP-99, Sternberger Monoclonals, Baltimore, MD) at RT for 1 hr, rinsed in PBS (5 min), incubated with goat anti-mouse IgG rhodamine (RT, 30 min), rinsed in PBS (5 min), and incubated with a rabbit anti-PLP antibody polyclonal antibody that recognizes the C terminus (Vermeesch et al., 1990) at RT for 3 hr. The anti-PLP antibody was diluted in 0.25% Triton X-100 (1:25) and rinsed, and a secondary goat anti-rabbit IgG FITC was applied (1:50; RT, 1 hr).
Bromodeoxyuridine (BrdU), which is incorporated into the DNA of proliferating cells during the synthesis phase of the cell cycle, was added to coverslips at a final concentration of 10 μm16–18 hr before immunostaining. Cultures were incubated with a monoclonal antibody A2B5 (Eisenbarth et al., 1979) at RT for 1 hr, rinsed, incubated with goat anti-mouse IgG rhodamine (RT, 30 min), and then processed for BrdU immunocytochemistry. Coverslips were fixed in 70% EtOH (−20°C, 30 min) and then rehydrated before being placed in 1.0N HCl (10 min) to denature the DNA. The HCl was neutralized in Na-borate buffer (0.1 m, pH 8.5) before the application of BrdU antiserum (1:10; RT, 1 hr). BrdU immunostaining was visualized with goat anti-mouse IgG1-FITC (Southern Biotechnology, Alabaster, AL) (1:10; RT, 45 min). Coverslips were mounted and viewed as above. Unless otherwise indicated, secondary antibodies were obtained from Boehringer-Mannheim.
Quantification of MBP and PLP fluorescence. The attached cell analysis system (ACAS) interactive laser cytometer (Meridian Instruments, Okemos, MI) was used to quantify the total amount of fluorescence in individual OLs 2 and 5 d after treatment. Preliminary to comparing fluorescence between control and antisense-treated OLs, the strongest stained PLP+/MBP+ cells on a control, normal coverslip were scanned, and then photomultiplier tube and scan strength settings were set so that the maximum fluorescent value of these cells was just barely into the white zone (4000) of the color bar. The photomultiplier tube and scan strength settings then were kept constant for all cells on both control and experimental coverslips. Color values within the range (250→4000) of the color bar are linear (Meridian Instruments). The various colors of the color bar are related linearly to the density of fluorescing molecules, provided that the gain setting on the photomultiplier tube and the acousto-optic modulator (AOM) is kept constant for all scans within a particular experiment. The detector response at any given AOM setting is directly proportional to the fluorescent intensity of the chromophore, which is, in turn, directly proportional to the number of fluorescent dye molecules. Quenching (which will result in nonlinearity of the detector response) is highly unlikely to occur in this application for a number of physical reasons, and the reader is referred to technical reviews of quantitative fluorescence in glial cells (Entwistle and Noble, 1992a,b). For quantitative purposes of this study, fluorescent values measured for a pixel on a cell focused in the z-axis (nonconfocal mode) include the sum of the values above and below the z-axis, because the photomultiplier tube is not capable of discerning focused from nonfocused light when it amplifies photons. Thus, the fluorescent value calculated for each cell indicates the total amount of fluorescence in a cell and not in an arbitrary focal plane. Using the control and antisense-treated coverslips, we selected the first 10–13 cells that exhibited fluorescence with the sampling, starting in the center of the coverslip where OLs were most differentiated. With a 40× oil objective, PLP- and MBP-positive cells were outlined and scanned by the ACAS single-image program.
RESULTS
Phenotypic properties of OLs in culture
The mature phenotype of OLs in culture is exhibited by the elaboration of large membrane sheets that mimic the appearance of an unfurled myelin sheath (Knapp et al., 1987, 1988; Dyer and Benjamins, 1988). After the first week of primary culture, OLs begin to assume the mature phenotype, and by the second week, many OLs exhibit the phenotype of a differentiated myelinating cell, including the expression of PLP. Accordingly, the second week was chosen to assess the effects of blocking PLP production on OL development, because phenotypic changes should be easily detectable. The A007 antibody, which recognizes OL-specific glycolipids, especially sulfatide (Bansal et al., 1992), was selected to monitor phenotypic changes because it precedes the appearance of galactocerebroside in immature OLs and remains expressed by mature OLs (Skoff et al., 1994).
Characterization of glial cultures treated with ODNs
Preliminary experiments with primary cultures that used antisense or sense unprotected (O-) ODNs at high concentration (10–100 μm) caused disruption of the astrocyte bed layer and cell death; at lower concentrations, they had no discernible specific effects on astrocytes and OLs. This finding is in agreement with many tissue culture studies using O-ODNs that showed they usually were ineffective agents in blocking mRNA translation (Mirabelli et al., 1991). The remainder of the experiments used phosphorothioate (S-) protected ODNs. The 23- and 27-mer S-ODNs ranging from 1 to 25 μm were applied to the cultures three times over a 48 hr period to test for toxicity and to look for specific effects on OL and astrocyte phenotype. At a 25 μm concentration, all S-ODNs (sense, random, and antisense) caused partial retraction of the AS bed layer by 48 hr. Occasionally, 5 μm caused retraction of some ASs after long-term exposure (5 d or longer in S-ODNs). Application of 1, 2.5, or 5 μm concentrations of sense, random, and antisense S-ODNs for 48 hr had no apparent deleterious effects on astrocytes or OLs, but the percentage of OLs with sheets that were treated with the antisense S-ODNs to PLP was reduced sharply (Fig. 1). The 2.5 μm concentration was used in the remainder of the studies, because the PLP-antisense produced specific effects on OLs and it very rarely had any harmful effects on astrocytes, even in long-term exposure.
Fig. 1.
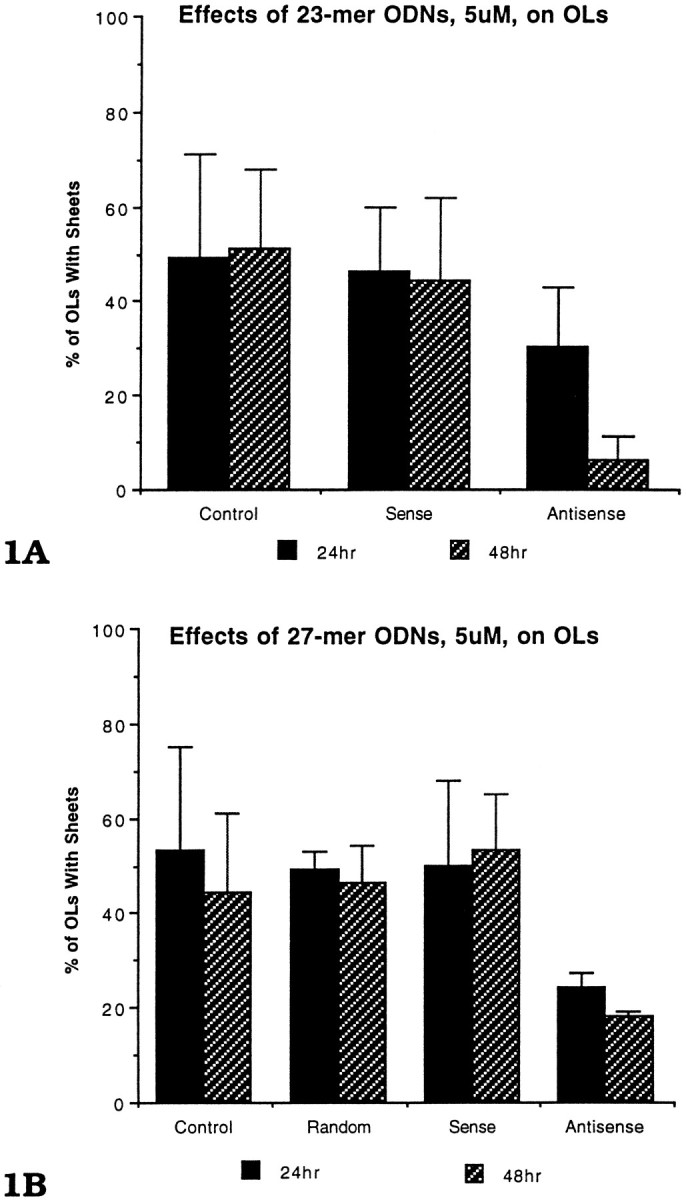
The effects of (1A) 23-mer and (1B) 27-mer S-ODNs on OLs with membrane sheets. DIV primary cultures (12–14) were immunostained with the A007 antibody after a 24 or 48 hr exposure to 5.0 μm S-ODNs. Both 23-mer and 27-mer antisense S-ODNs led to a reduction in the percentage of OLs with membrane sheets after a 24 and 48 hr exposure. The data for each time point were based on four different experiments; two to four mouse brains were pooled for each experiment. Each time point is the mean ± SE for the four experiments. At each time point, 3–10 coverslips were counted for each group (Control,Random, Sense, Antisense). All A007+ OLs (500–1000 OLs) on every coverslip were counted.
Incorporation of S-ODNs into OLs was demonstrated serendipitously by using the ApopTag kit (Oncor, Gaithersburg, MD) while trying to compare the survival of OLs in antisense with controls. This kit detects free 3′ DNA ends, which are abundant in apoptotic cells. The majority of glia in both sense and antisense coverslips were stained positively with the kit, whereas only an occasional cell was stained in control, untreated coverslips (Skoff, 1995). In cultures incubated with S-ODNs, reaction product was localized to cytoplasmic granule-like structures with very little nuclear staining, whereas in apoptotic cells staining was predominantly nuclear (Skoff, 1995). Obviously, the terminal deoxynucleotidyl transferase used in the kit detects the free 3′ DNA ends of the ODNs and provides a simple and quick method to detect incorporation of ODNs into cells.
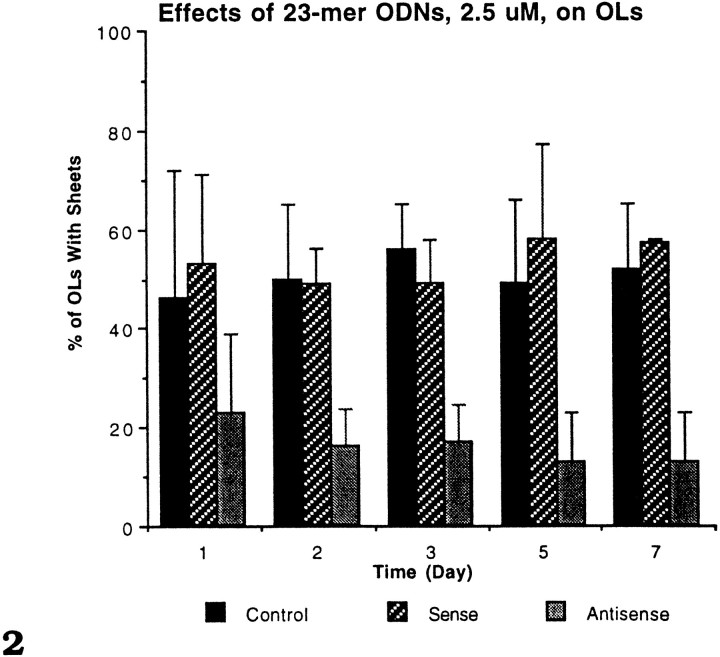
Within 48 hr of S-ODN treatment, OLs treated with 5 μmantisense ODN showed marked morphological changes, as compared with controls (Fig. 1A,B). The number of OLs with membrane sheets incubated with either the 23- or 27-mer antisense was reduced to less than one-half that of controls (15–20 vs 45–50%). Neither the random nor sense constructs led to a reduction in the number of OLs with membrane sheets; rather, their values were comparable to the untreated controls. The 23-mer antisense S-ODN appeared slightly more effective than the 27-mer S-ODN at 48 hr (15 vs 20%) and was used in subsequent experiments. Even after 7 d of 2.5 μmantisense treatment, the percentage of OLs with sheets remained depressed at 16%, whereas the percentage of OLs in the controls and the antisense-treated cultures with sheets remained ∼60% (Fig.2). The results shown in Figure 2 were very reproducible and involved over 70 animals and analysis of >1000 coverslips.
Fig. 2.
The effects of 23-mer S-ODNs on OLs with membrane sheets. DIV primary cultures (12–14) were incubated with 2.5 μm sense or antisense S-ODNs for 1–7 d (13–21 DIV) and then immunostained with the A007 antibody. Exposure to antisense, but not sense, S-ODNs led to a reduction in the percentage of OLs with membrane sheets from 1–7 d of treatment. Each time point is the mean ± SE for seven different experiments. An average of eight coverslips was counted for each group at each time point, and all of the A007+ OLs (500–1500 OLs) on every coverslip were counted. The difference in the percentage of OLs with membrane sheets treated with PLP antisense as compared with control or sense-treated cultures was significant (p < 0.05, one-tailed t test) at 5 and 7 d.
The phenotype of OLs in the antisense-treated cultures
OLs in cultures treated with S-ODNs to PLP exhibited four basic phenotypes after antisense treatment. The most numerous subgroup of OLs was similar to immature OLs found in younger cultures (Fig.3A–D). These OLs had numerous small processes that formed a lacy network with each other. In contrast to OLs in normal cultures, however, the antisense-treated OLs had an abundance of processes that ended in club-like structures or that had bulbous structures along their length. Often, small spicules projected from these processes. OLs with this immature morphology were conspicuous in cultures that were treated with the antisense ODNs to PLP, regardless of whether the antisense was applied starting with 1-, 2-, or 3-week-old cultures. Another group of OLs had long thick processes but no membrane sheets interconnecting these processes, such as would be seen in normal OLs with this large a cell body (Fig.3F). At least some of these OLs had membrane sheets before application of S-ODNs (see below). Other OLs exhibited a mixed phenotype with one or two small membrane sheets, but they also had numerous long filopodia that sometimes ended in club-like extensions (Fig. 3E). Finally, a consistent finding in all of the antisense-treated cultures was a small percentage (10–15%) of OLs that had large membrane sheets and appeared phenotypically normal as judged by the A007 immunostaining. However, in double-immunostaining experiments that used MBP and PLP antibodies, such cells were MBP+ and PLP− (Fig.4A,B). This finding indicates that some OLs can differentiate and elaborate membrane sheets with no immunocytochemically detectable amounts of PLP. By phase-contrast microscopy, OLs treated with antisense in both primary cultures and in enriched preparations (Fig. 4C) phenotypically appeared strikingly healthy and viable as judged by their birefringence, intactness of processes, and length of their processes. Interestingly, incubation of enriched cultures with antisense for 35 d revealed many healthy OLs, leaving the impression that these cells could live indefinitely in the presence of antisense.
Fig. 3.
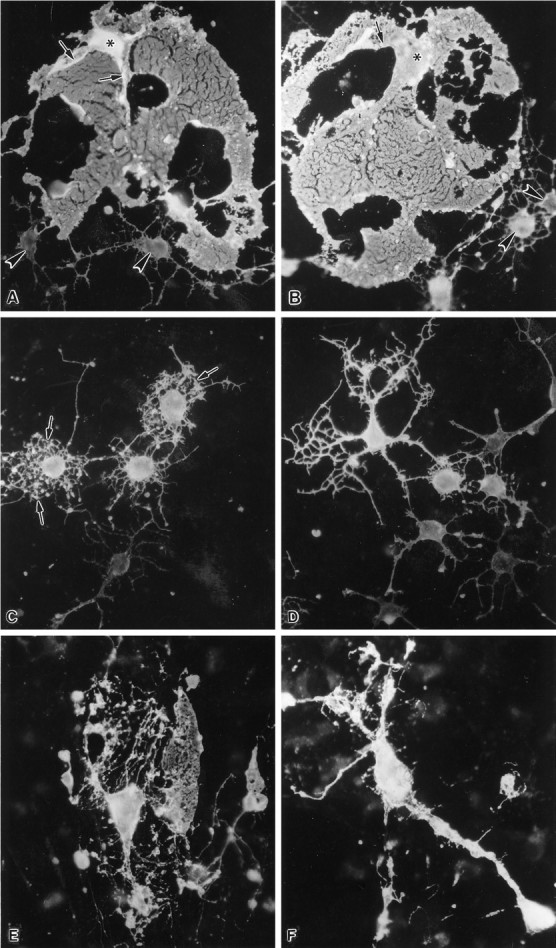
The effects of 23-mer antisense to PLP on OL morphology in primary cultures. A, B, OLs in control and primary cultures, 14 DIV, stained with the OL-specific A007 antibody. The cell bodies (asterisks) of two mature OLs have large, elaborate membrane sheets that originate from cellular processes (arrows). Several immature OLs (arrowheads) that have thin, branching processes are also present in these pictures. C, D, OLs treated with 23-mer antisense, 2.5 μm for 7 d, beginning at 7 DIV and stained with the A007 antibody at 14 DIV.C, Three brightly fluorescent OLs and one lightly fluorescent OL have numerous short processes that form an interconnected lacy network. Numerous small globular structures (arrows) are located along or at the tips of these processes. D, Fluorescent intensity of OLs in these cultures ranges from dim to very bright. The brightly fluorescent cell has thick interconnecting processes. The pictures of the OLs shown in Figures 3A–D were prepared and cultured from the same mouse brains. E, F, Primary cultures treated with 23-mer antisense, 2.5 μm, beginning at 14 DIV and continuing for 7 d (21 DIV). The A007+ OLs illustrate the range of morphologies seen with antisense treatment.E, One OL retains a membrane sheet but has abnormally long, thin processes that end in globular structures. F, Another OL has stout and long processes that are very brightly fluorescent but show no membrane sheets. Magnification, 450×.
Fig. 4.

A, B, An OL in a primary culture (20 DIV), treated with 23-mer antisense to PLP, 2.5 μm, beginning at 13 DIV. This cell is (A) MBP+ and (B) PLP−. The cell body (asterisk) has several membrane sheets visualized with MBP immunostaining. The patchy staining of the membrane sheets seen here using antibodies to myelin proteins is attributable to treatment of the cells with Triton X-100, which is required to maximize immunostaining for myelin proteins. Magnification, 450×.C, Phase-contrast micrograph of an enriched culture treated with 23-mer PLP antisense for 10 d beginning 3 d after enrichment. Several phase-bright cells with long processes are characteristic features of OLs visualized with phase-contrast microscopy. The length of their processes and the extensive branching of a few of these cells are characteristic of healthy OLs.
Effects of PLP antisense ODNs on myelin protein expression
A critical experiment with antisense studies is to demonstrate that the targeted protein is drastically reduced. The amount of PLP in cultured murine OLs is low and can be detected only with Western blots using purified OLs grown in flasks or by pooling mixed glial cells grown in flasks (Duchala et al., 1995; R. P. Skoff, unpublished studies). Accordingly, quantitative fluorescence microscopy (Entwistle and Noble, 1992a,b) was used to evaluate the reduction of PLP in control versus antisense-treated coverslips. With fluorescently tagged secondary antibodies, the total amount of fluorescence was quantified (see Materials and Methods for details) in individual OLs using an ACAS laser cytometer (Meridian Instruments) after 2 and 5 d of antisense treatment. Immunostaining of control and antisense coverslips using PLP antibodies was performed with coverslips prepared from the same animal; the immunostaining was performed at the same time and with identical reagents; parameters for fluorescent quantification were likewise identical.
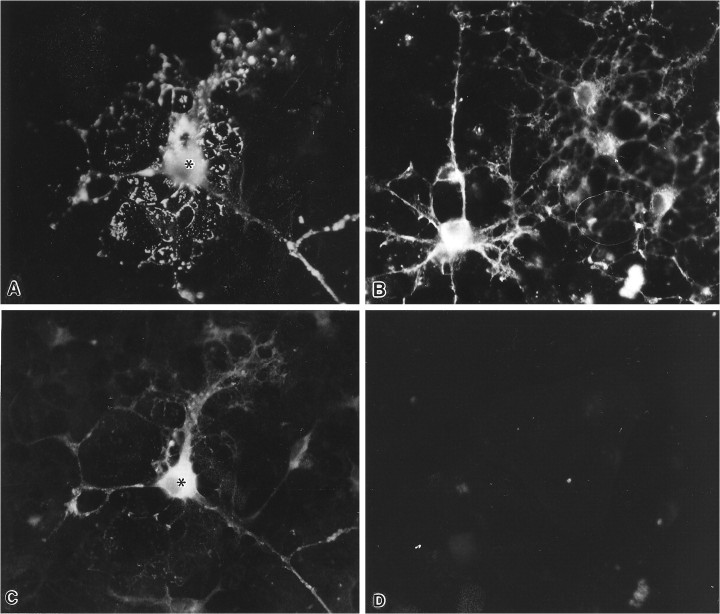
Visual comparison of PLP immunostaining in OLs revealed gross reductions in the intensity of PLP immunostaining between the antisense-PLP-treated coverslips and controls (Fig. 5). The reduction between the two groups became more striking with longer exposure to antisense S-ODNs to PLP and presumably is attributable to blocking translation of new PLP and to breakdown of PLP synthesized before S-ODN application. To provide a quantitative estimate of the difference, we digitally outlined the first 10–13 cells that stained with PLP antibodies on a coverslip, and the total fluorescence per cell was calculated with the ACAS. Individual OLs in the antisense-treated cultures had ∼60% less fluorescence 2 d after treatment (data not shown) and 90% less fluorescence 5 d after treatment than the controls (Table 1, Fig. 6). A reduction of 90% for PLP in the antisense-treated cultures is probably a low estimate, because only antisense-treated cells that exhibited fluorescence were compared. Many newly generated immature OLs failed to synthesize detectable levels of PLP, and mature OLs also lost detectable fluorescence (see below).
Fig. 5.
Shown are OLs in a primary culture incubated with S-ODNs to PLP beginning at 13 DIV and continuing for 7 d (20 DIV); they were immunostained for MBP (A, B) and PLP (C, D). An OL in a control culture is positive for both MBP (A) and PLP (C). The intense staining of the OL cell body and light staining of its processes and membrane sheets are a consistent finding using PLP antibodies. Note the differential immunostaining pattern using MBP and PLP antibodies. OLs treated with 23-mer antisense to PLP for 7 d are strongly positive for MBP (B) but lack PLP staining (D). The vast majority of the OLs in the antisense-treated cultures typically lacks membrane sheets and appears immature. Magnification, 450×.
Table 1.
PLP+ oligodendrocytes from 18 DIV mouse cerebral primary culture after 5 d of treatment with 2.5 μm, 23-mer antisense
| Experiment number | Control × fl/cell1-a | Antis-Tr1-b × fl/cell | Average reduction (%) |
|---|---|---|---|
| 21 | 20,821,273 | 2,159,327 | 90 |
| (10 cells) | (11 cells) | ||
| 22 | 13,490,593 | 1,504,026 | 89 |
| (11 cells) | (11 cells) |
The average amount of fluorescence (fl) per PLP+ cell.
Antisense-treated cells.
Fig. 6.
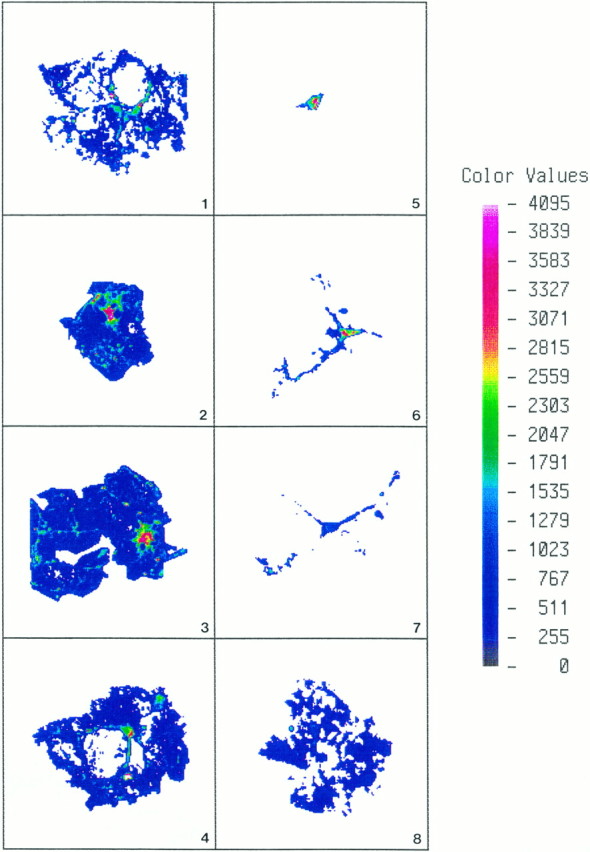
OLs immunostained for PLP in a primary culture (19 DIV) were outlined digitally with the ACAS laser cytometer, and fluorescent quantification was performed. Quantitative parameters (see Materials and Methods) for the normal cells (1–4) were standardized first, and then the same exact parameters were applied to cells (5–8) treated with antisense to PLP for 5 d, beginning at 14 DIV. Fluorescent intensity is linear (seecolor bar), with white andred the most fluorescent. Cell bodies of OLs (1–4) on the control coverslips were very brightly fluorescent, whereas their processes and large membrane sheets were less so. The intensity of pixels in the cell body versus intensity of pixels in the membrane sheet was ∼10-fold greater. The differential in fluorescent staining between cell body and sheets using PLP antibodies can be compared in Figure 5. Individual OLs in the antisense cultures (5–7) had stout and long processes but usually lacked membrane sheets; only rarely did an OL (8) in the cultures treated with antisense for 5 d have large elaborate membrane sheets that were PLP+.
The drastic reduction in PLP in the antisense-treated OLs was not observed for MBP. MBP in the antisense-treated cultures was reduced ∼50% (Table 2). In one experiment (no. 22), the coverslip was immunostained for both PLP and MBP so that a direct quantitative comparison between these two myelin proteins could be made in the same cell. Visual observation of fluorescent intensity in these cells gave the impression that MBP was reduced only negligibly or even increased in some OLs. This impression occurred probably because fluorescence is more intense within a smaller area of the antisense-treated OLs as opposed to the untreated OLs. Indeed, when the fluorescent intensity per pixel is compared between treated and untreated OLs, the intensity is often greater in the treated cells (data not shown).
Table 2.
MBP+ oligodendrocytes from 18 DIV mouse cerebral primary culture after 5 d of treatment with 2.5 μm, 23-mer antisense
| Experiment number | Control × fl/cell2-a | Antis-Tr2-b × fl/cell | Average reduction (%) |
|---|---|---|---|
| 22 | 17,039,785 | 7,960,596 | 53.3 |
| (13 cells) | (12 cells) | ||
| 23 | 26,390,886 | 14,136,099 | 46.4 |
| (12 cells) | (12 cells) |
The average amount of fluorescence (fl) per MBP+ cell.
Antisense-treated cells.
Not only does the antisense treatment cause a reduction in the level of PLP in individual OLs, but it also prevents or retards the expression of PLP in immature OLs (Fig. 7A). In normal cultures the immature OLs (recognized by the A007 Ab) gradually accumulate PLP as they mature. As predicted, in both sense and control cultures the percentage of A007+ cells expressing PLP gradually increased from ∼10% at the beginning of the experiment (12–14 DIV) to nearly 60% 5 d later (17–19 DIV). In contrast, the percentage of A007+ cells that expresses PLP in the antisense-treated cultures remained ∼10%. The finding that the antisense treatment prevents expression of PLP in immature OLs also was confirmed by using younger cultures that contained primarily immature OLs (see below).
Fig. 7.
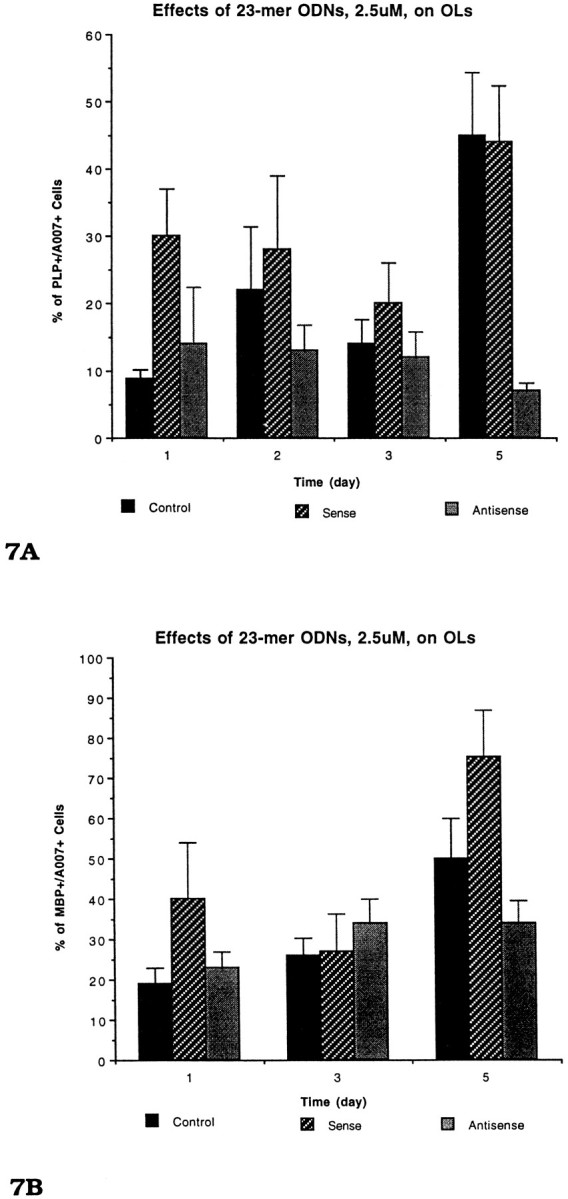
The effects of 23-mer PLP-antisense on (A) PLP and (B) MBP expression in OLs in primary cultures. Coverslips were incubated with 23-mer antisense to PLP, beginning on 13 DIV and continuing for 6 d (19 DIV). Coverslips were double-immunostained with A007 and PLP or MBP antibodies. The percentage of PLP+ OLs treated with antisense for 5 d remained below 10%, but the percentage of MBP+ OLs increased to 35%. The data for each time point were based on four different experiments; an average of three coverslips was counted for each group at each time point.
In contrast to the arrest of PLP expression in the antisense-treated cultures, the expression of MBP in these cultures followed a normal pattern of differentiation (Fig. 7B). The percentage of A007+ cells in the control and sense-treated cultures that expressed MBP increased from ∼16% (12–14 DIV) to ∼70–85% (17–19 DIV; Fig. 7B). In the antisense-treated cultures, the percentage of MBP+/A007+ cells increased to ∼40%. This finding indicates that many immature OLs, in the presence of antisense, are competent to continue to differentiate and to express MBP (Figs. 4, 5). These results further indicate that the effects of the antisense on membrane sheet production are not attributable to downregulation of all myelin proteins but, rather, are a result of reduction of the targeted protein.
Effects of antisense ODNs to PLP on formation and stability of membrane sheets
The reduction in the number of membrane sheets found in the cultures treated with S-ODNs to PLP could be attributable to the inability of immature OLs to elaborate membrane sheets, and/or it also may be required for the stability of the membrane sheets. It is difficult to decipher whether one or both of these events is occurring, because the OLs are at all stages of differentiation after the first week of culture. The hypothesis that PLP is required for membrane stability is suggested by the observation of many broken disrupted membrane sheets within the first 2 d after antisense S-ODN application. The idea that PLP also is required for their elaboration is suggested by the finding of many immature OLs lacking sheets in the older cultures.
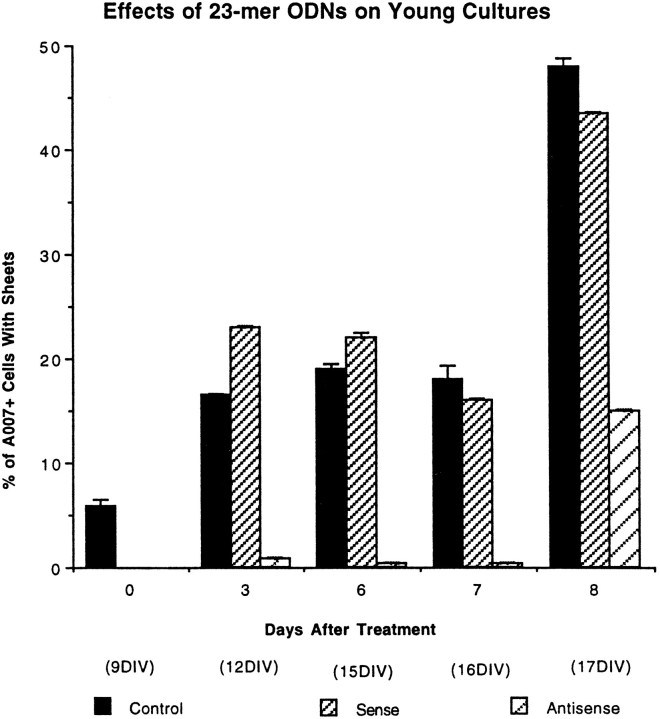
To determine whether PLP is required for the elaboration of membrane sheets, we treated cultures enriched in OLs with antisense ODNs to PLP before they had established membrane sheets. At 9 DIV, 6% of the normal cultures had sheets; by 17 DIV, ∼45% of the normal and sense-treated cultures had sheets when stained with the A007 antibody (Fig. 8). In contrast, OLs exposed to antisense did not make membrane sheets during the next week (Fig. 8), and only 15% made membrane sheets by 17 DIV. This finding indicates that PLP is required for elaboration of membrane sheets by most OLs.
Fig. 8.
The effects of 23-mer S-ODNs on membrane sheet formation by young OLs. Nine DIV primary cultures were incubated with sense or antisense S-ODNs and immunostained with the A007 antibody from 9 to 17 DIV. Sheet formation by OLs was prevented during the first week of antisense treatment but increased to 15% after 8 d of treatment. Each time point is the mean ± SE of three different experiments.
To determine whether OLs lose their membrane sheets after the application of S-ODNs, we visually tracked individual OLs that had already established membrane sheets with the ACAS laser cytometer over a 24 hr interval. OLs were labeled with DiO, which is a vital fluorescent carbocyanine dye that intercalates throughout the membranes of all cells (Honig and Hume, 1986). The rationale for using a vital dye is that visualization of membrane sheets by phase-contrast microscopy is usually very difficult. Because the DiO gets incorporated into the membranes of all cells, including astrocytes, it is essential to prepare cultures enriched in OLs.
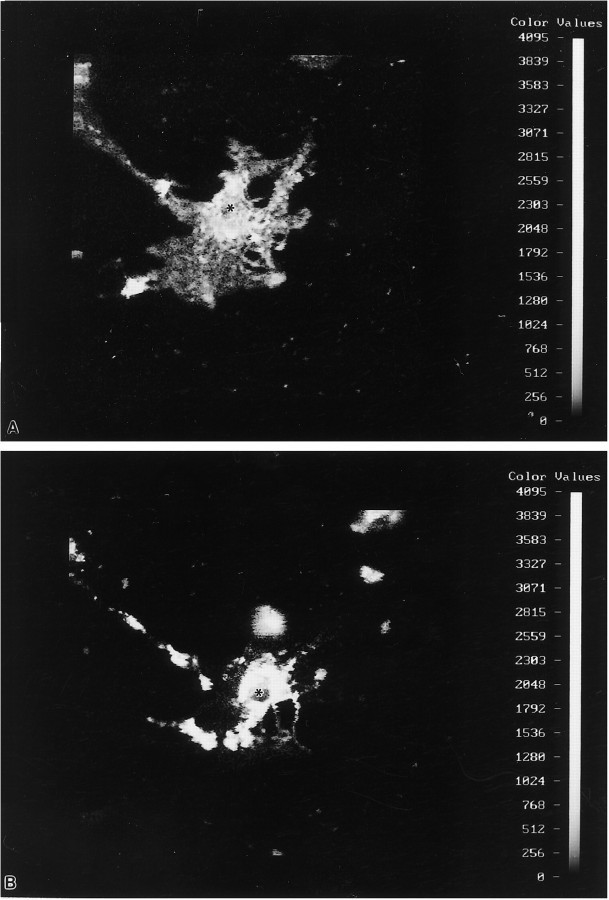
Enriched OL cultures were prepared by collecting the OLs from 8–9 DIV primary cultures and then replating the OLs onto another coverslip (see Materials and Methods). Approximately 2 d later, the OLs had elaborated membrane sheets. Antisense S-ODNs to PLP were applied at this time, immediately scanned, and then rescanned 8 and 24 hr later. OLs with large membrane sheets treated with antisense S-ODNs usually retracted their membrane sheets (Fig. 9), whereas controls rarely did. It should be noted that mature, normal OLs in culture exhibit considerable motility and are capable of rearranging their processes and sheets in culture over several days (Knapp et al., 1993). Although the control DiO-labeled OLs sometimes showed rearrangement of their sheets and processes, they did not retract their membrane sheets to the extent of the antisense ODN-treated OLs. This experiment shows that PLP is required for the stability of membrane sheets in culture.
Fig. 9.
Pseudo-gray digitally imaged scans using the ACAS laser cytometer of an OL labeled with DiO. The OL is from a coverslip of enriched OLs that were obtained from a 9 DIV primary culture. After replating (48 hr), the coverslip was loaded with 10 μmDiO and scanned 1 hr (A) and 24 hr (B) later. Partial retraction of the membrane sheet surrounding the cell body (asterisk) occurred within 24 hr. The more intense fluorescence around the nucleus (asterisk) and a few processes 1 d later may represent endocytosis of the membrane.
The effects of antisense S-ODNs to PLP are reversible
To test further for viability of the antisense-treated cultures and to determine whether OLs retain their capacity to make sheets, we removed antisense S-ODNs to PLP from the cultures for 3 d after a 3 d regimen of antisense treatment (Fig.10A). After 3 d of antisense treatment of older cultures (23 DIV), 20% of the treated cultures had sheets versus 60% for controls, percentages similar to that found in the other control and antisense cultures. After 3 d of being returned to normal media, 50% of OLs in the antisense-treated cultures had acquired sheets. The percentage of OLs in the normal cultures is reduced somewhat as compared with 3 d earlier, and this reduction is most likely attributable to the fact that the mature OLs are dying in the older cultures. After the 3 d withdrawal, the OLs in the antisense-treated cultures appeared to have a normal phenotype. It is difficult to conclude from this antisense experiment whether the increase in OLs with sheets is attributable to mature OLs reacquiring their sheets or to immature OLs now synthesizing new sheets. However, the fact that the older cultures (23 DIV) used in this experiment contain primarily mature sheet-bearing OLs strongly suggests that some mature OLs remake their sheets.
Fig. 10.
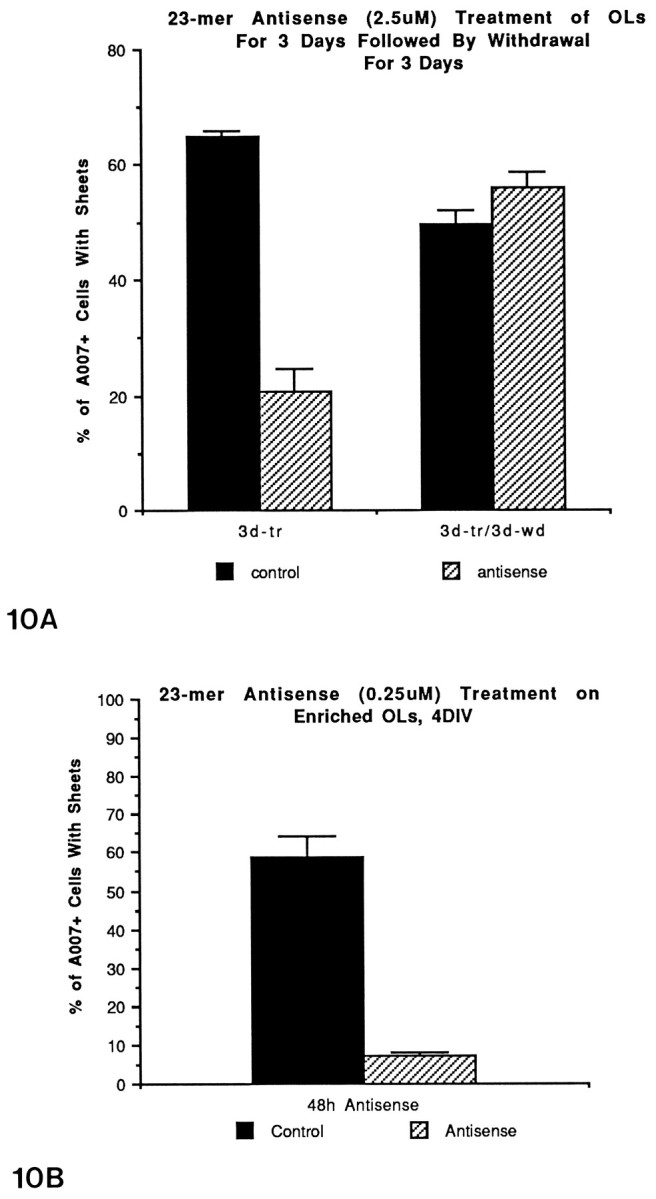
A, The effects of 23-mer S-ODNs on numbers of OLs with membrane sheets after withdrawal of S-ODNs. Primary cultures (22 DIV) were treated for 3 d (25 DIV), followed by a 3 d withdrawal (28 DIV), and then the cultures were immunostained with the A007 antibody. Withdrawal of antisense led to an increase in the percentage of OLs with sheets similar to control. B, Effects of 23-mer S-ODNs to PLP on the number of membrane sheets formed by OLs in enriched cultures. OLs from 9 DIV primary cultures were collected and replated onto coverslips for 2 d. At this time antisense ODNs were applied for an additional 2 d and then immunostained with the A007 antibody.
The effects of antisense S-ODNs to PLP are directly on oligodendrocytes
The possibility that the effects of the antisense ODNs on OLs were attributable to a secondary effect mediated by astrocytes was examined by using enriched cultures of OLs. OLs from 9 DIV primary cultures were collected (Feutz et al., 1995) from the astrocytic bed layer, cultured for 2 d before the addition of S-ODNs, and then grown for an additional 2 d. The number of glia on the enriched coverslips was approximately one-tenth that of the primary cultures, so the concentration of the S-ODNs was reduced to 0.25 μm to prevent toxicity. OLs in the control-enriched cultures rapidly differentiated, and within 48 hr of replating 60% of the A007+ cells had sheets (Figs. 10B,11). With antisense treatment, only 6% of the OLs had sheets at this time point (Figs. 10B, 11). The enriched cultures contained at least 75% OLs; the vast majority of the OLs grew directly on the poly-l-lysine-coated coverslips and were not in direct contact with the astrocytes. This experiment indicates that the phenotypic changes seen in the OLs are not mediated by an indirect nonspecific effect through astrocytes. The reduction in the percentage of OLs with sheets in these antisense-treated cultures was not attributable to toxicity, because the numbers of OLs in the antisense-treated cultures already were increased slightly above the values for the controls (see section below).
Fig. 11.
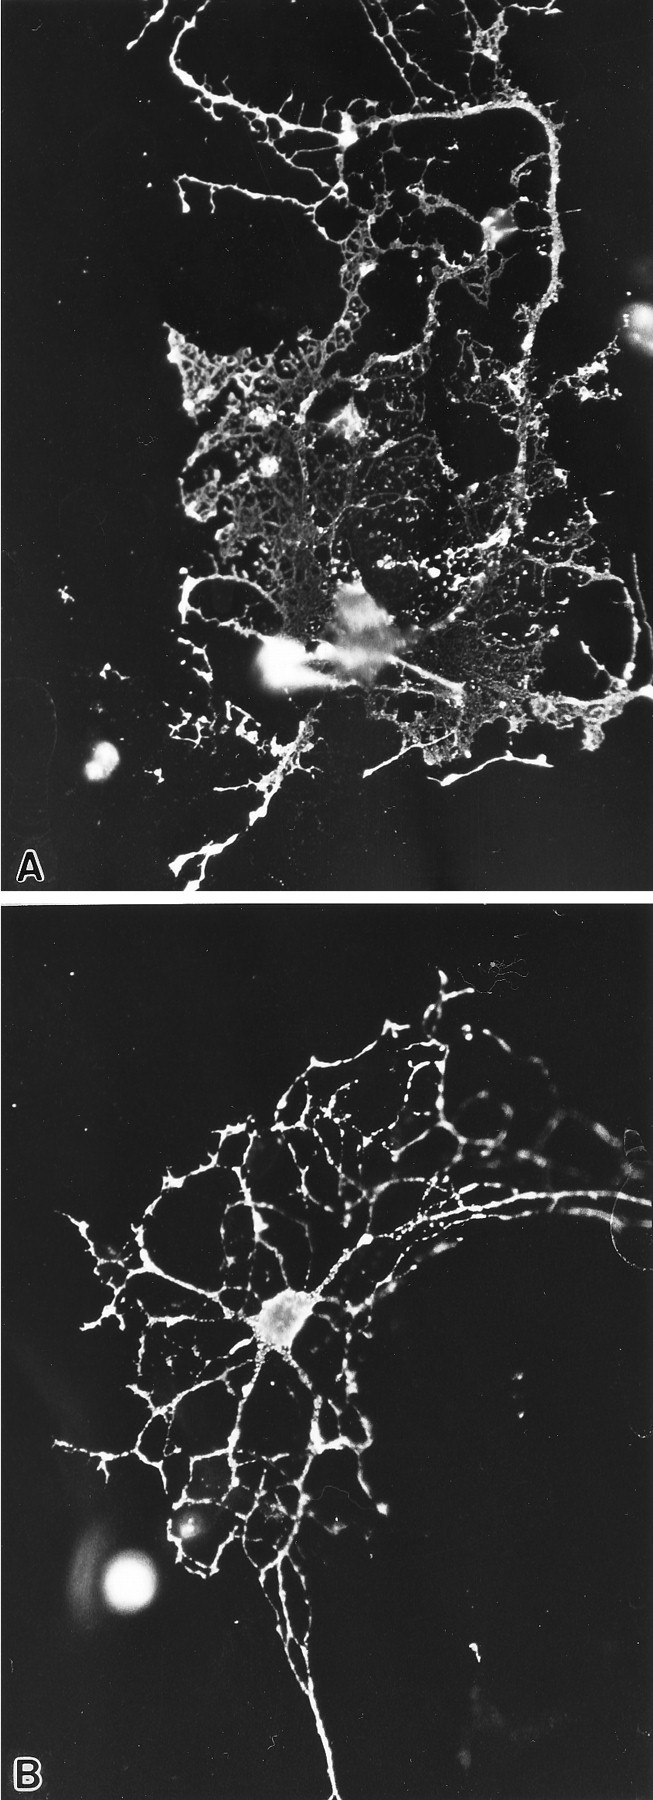
OLs in enriched cultures that were derived from 9 DIV primary cultures (see Materials and Methods), grown for an additional 4 d in defined medium, and then immunostained with the A007 antibody. The OL in a control coverslip (A) has several large membrane sheets and a long process with numerous spicules arising from it. The OL treated with 23-mer antisense for 2 d (B) has a fairly elaborate network of processes but lacks the interconnecting membrane sheets. Magnification, 450×.
Effect of antisense S-ODNs to PLP on OL cell number
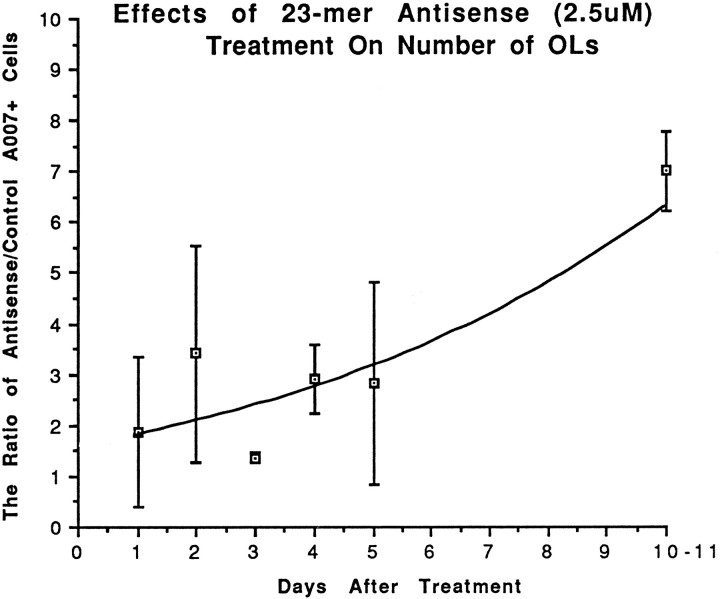
After 4 d of antisense treatment, the numbers of OLs in the antisense-treated cultures were noticeably different from the numbers seen in control or sense-treated coverslips. Quantification of the number of A007+ cells showed that the ratio of A007+ cells in antisense-treated versus control increased threefold over control values 5 d after the beginning of treatment and sevenfold after 11 d (Fig. 12). The difference in the number of A007+ cells between controls and antisense-treated cultures at 10–11 d was highly significant (p < 0.002, one-tailed t test). A 2.5-fold increase in the number of OLs in antisense-treated cultures also was observed when the younger (9–17 DIV) cultures were treated with PLP antisense. Eleven days after antisense treatment, the OLs appeared quite healthy because they immunostained strongly with A007 and MBP antibodies; many had intact processes, and some even had membrane sheets (Fig. 13). Most of the OLs, however, appeared immature with numerous processes and few sheets. In contrast, OLs in the control cultures began to die, as evidenced by weak immunostaining or short fragmented processes (Fig. 14). The presence of many dying normal OLs between 20–30 DIV typically is found by investigators using primary glial cultures and is prognostic of their disappearance from the cultures shortly after the first month.
Fig. 12.
The effects of 23-mer antisense on OL cell number after 1–11 d of treatment. Each time point is based on 3–12 experiments; an average of 12 coverslips was counted for control and antisense coverslips at each time point, and the ratio of antisense to control A007+ cells for each experiment was calculated.p < 0.002 at 10–11 DIV, one-tailedt test; statistical analysis based on absolute numbers of A007+ cells.
Fig. 13.
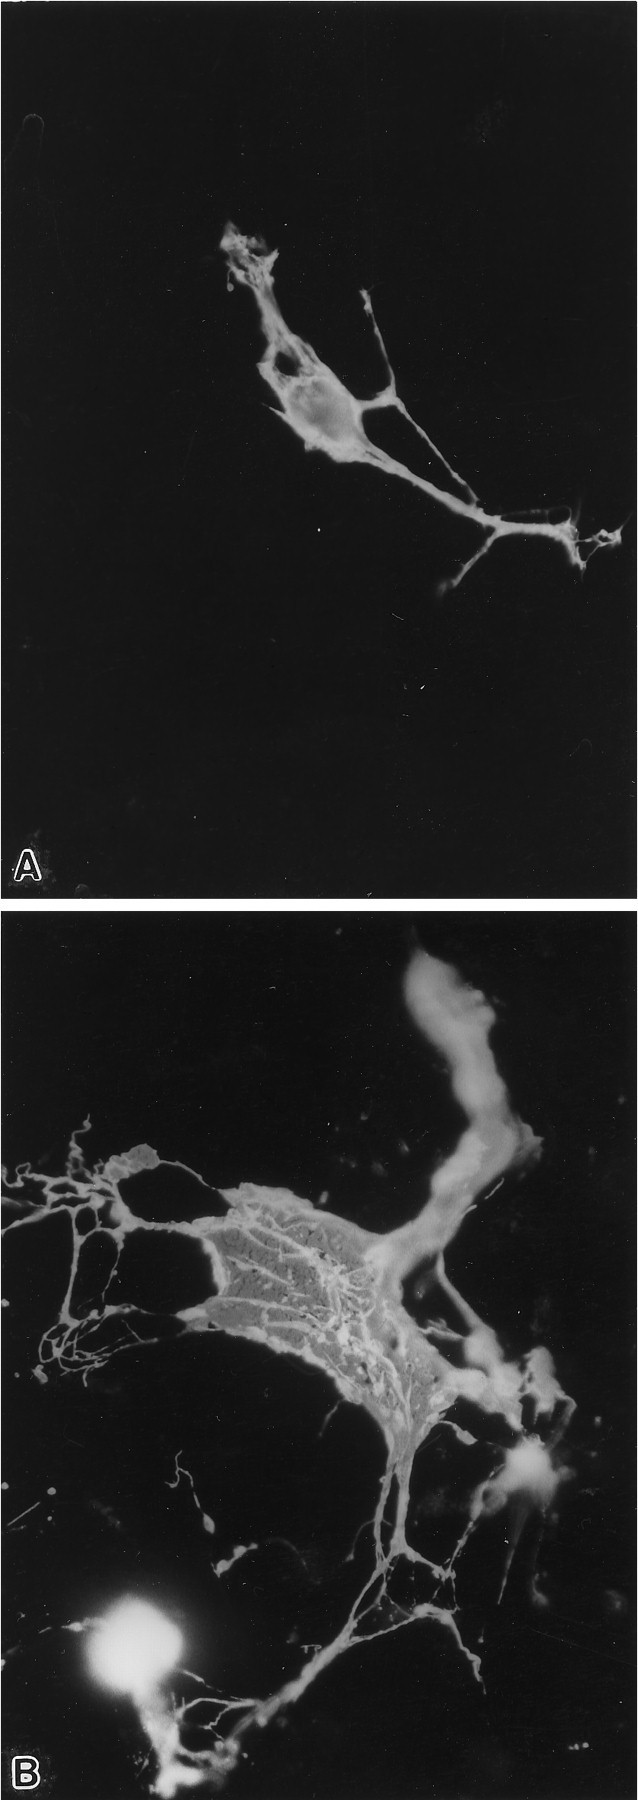
Two OLs, 25 DIV, immunostained for A007. After 3 weeks of culture, OLs in normal cultures (A) begin to die; this is exhibited by a reduction in the number of OLs that have membrane sheets or a network of processes. In the antisense-treated cultures (B), some OLs never completely lose their membrane sheets and have intact membrane sheets, even after 11 d of exposure to antisense. Magnification, 450×.
Fig. 14.
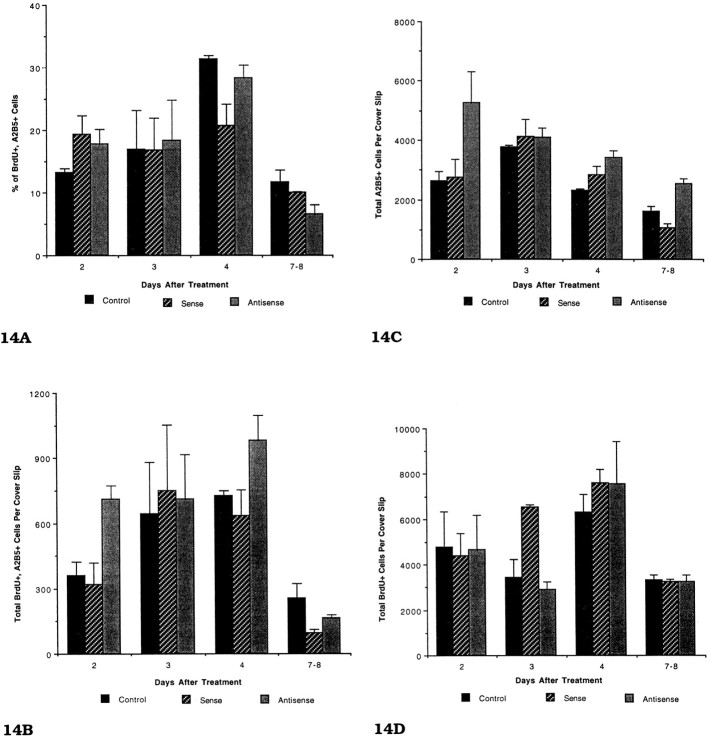
The effects of sense and antisense 23-mer S-ODNs on proliferation of OL progenitors (A–C) and ASs (D). Cells were incubated with 10 μm BrdU for 24 hr; they were immunostained first with the A2B5 antibody, fixed, and immunostained for BrdU. All of the A2B5+ cells per coverslip were counted. Each time point is the mean ± SE, based on at least three experiments. The same data were used for preparing Figure 14B–D. No statistical differences were found for the different groups (Fig.14A–D) using an unpaired one-tailed t test. B, The effects of sense and antisense 23-mer S-ODNs on the total number of proliferating (BrdU+) OL progenitors (A2B5+) after a 7–8 d exposure. C, The effects of sense and antisense 23-mer S-ODNs on total numbers of A2B5+ cells per coverslip after a 7–8 d exposure. D, The effects of sense and antisense 23-mer S-ODNs on the total number of BrdU+ cells per coverslip. A comparison of the total number of proliferating A2B5+ cells (Fig. 14B) with the total number of proliferating glia shows that the vast majority of proliferating cells on the coverslips is astrocytes. The PLP antisense has no apparent significant effect on either AS or OL proliferation, as compared with control and sense-treated cultures.
Two explanations can account for the difference in numbers of OLs between controls and antisense-treated coverslips. Either the lifespan of OLs is extended, or proliferation of OLs and their progenitors is increased. To determine whether proliferation was increased, we combined BrdU immunocytochemistry with A2B5 immunostaining (Eisenbarth et al., 1979). The A2B5 antibody recognizes antigens expressed by cells in the OL lineage as well as immature OLs, and, accordingly, the use of this antibody would permit the detection of increased proliferation in the pool of OL progenitors as well as immature OLs. The percentage of A2B5+ cells that also were BrdU+ in the antisense-treated coverslips was not significantly different from the sense and untreated controls from 2 to 8 d after incubation (Fig.14A). The phenotype of the BrdU+ cells in the antisense-treated cultures consisted of typical immature OL progenitors; no evidence of OLs with membrane sheets was found labeled with BrdU, indicating that the A2B5 antibody detected all proliferating cells in the OL lineage.
Although the percentages of proliferating OL progenitors (A2B5+ cells that were BrdU-labeled) between controls and antisense-treated cultures were the same, the conclusion that the number of proliferating cells in the OL lineage did not change in the antisense-treated cultures must be tempered by the following statement. The total number of A007+ cells (some of which are A2B5+) increased in the antisense-treated, compared with the control, coverslips as the cultures aged, thus possibly making direct comparison of percentages between the two groups misleading. To determine whether the total number of proliferating immature OL progenitors increased in the antisense-treated coverslips, we counted the total number of A2B5+ cells that were BrdU+on these coverslips (Fig. 14B). No statistically significant difference was found between the different groups at any time point. Although the number of proliferating A2B5+cells in the antisense compared with controls showed no differences, the total number of A2B5+ cells in the antisense-treated coverslips was increased at three of the four time points; by 7–8 d of antisense treatment, a 1.5-fold increase between controls and antisense was present (Fig. 14C). The increase in A2B5 cells may indicate that many of the OL progenitors in the antisense-treated cultures continue to express the antigens recognized by the A2B5+ antibody or it may indicate that A007+cells revert to a less-differentiated stage and re-express A2B5. Finally, the possibility that the S-ODNs affected proliferation of astrocytes was determined by counting the total number of BrdU+ cells on the coverslips (Fig. 14D). No difference was noted between the controls and S-ODN-treated coverslips, indicating the PLP antisense did not affect astrocyte proliferation.
A comparison of the total number of BrdU+ cells on coverslips (Fig. 14D) with the number of BrdU+/A2B5+ cells (Fig. 14B) at different time points revealed how the proliferation of astrocytes and oligodendrocytes changed over time in the coverslips. At 16–18 DIV (4 d of treatment), the proliferating A2B5+ cells constituted ∼10% of the total proliferating cells on a coverslip (∼700 vs 7000), whereas at 19–21 DIV proliferating A2B5+cells constituted <2% of the proliferating cells (∼50 vs 3000). Astrocytes, which are essentially confluent at 3 weeks, undergo a modest (twofold at best) decrease in proliferation, as compared with earlier time points. In contrast, OL progenitors undergo a 10-fold reduction in proliferation during the comparable time.
DISCUSSION
The use of antisense technology to block myelin protein gene expression
Phosphorothioate-protected ODNs, which are more resistant to exo- and endonuclease degradation than unprotected ODNs, were developed in the late 1980s to provide more efficient blocking of protein synthesis (Stein and Krieg, 1994). However, S-ODNs may have toxic effects that are attributed to their high charges and subsequent binding of proteins (Erickson, 1993; Stein and Krieg, 1994). High concentrations of sense, random, or antisense S-ODNs caused disruption and sloughing of the astrocyte bed layer in our primary cultures and detachment of the OLs in the enriched cultures. Even when the S-ODNs were applied at low concentrations, careful purification of the S-ODNs by column chromatography was essential to eliminate toxicity to the cells. Low concentrations of S-ODNs did not show any specific toxic effects on OLs and astrocytes; however, the antisense S-ODNs to PLP led to specific, consistent morphological and functional effects on the OLs; even after long-term exposure, the OLs appeared strikingly healthy as judged by immunostaining for myelin glycolipids and MBP. In summary, toxicity associated with S-ODNs can be avoided by purification of the S-ODNs, and specific biological effects on OLs can be demonstrated by using appropriate concentrations of S-ODNs.
In the present experiments, we show that PLP was specifically blocked with the antisense S-ODNs by at least 90% when compared with the age-matched controls. Compared with controls, MBP was reduced ∼40%. However, a reduction in MBP is quite predictable, because a reduction in PLP protein, as occurs in the PLP mutants or in PLP−mice, inevitably leads to major reductions in other myelin proteins (Barbarese et al., 1979; Delassalle et al., 1981; Boison et al., 1995).
The effects of blocking PLP synthesis on myelin sheet formation and maintenance
The function of the different myelin glycolipids and proteins in CNS myelin sheath formation is poorly understood and has been deduced primarily from the myelin mutants. The role of PLP in promoting apposition of the outer leaflets of the myelin membrane seems clear from the PLP mutants and from the PLP-null mice, but both kinds of mice indicate that this protein has a more general role in myelin sheath formation. In mature PLP-null mice (Boison and Stoffel, 1994), axons with small diameters remain unmyelinated or hypomyelinated, suggesting that PLP has a role in signaling which axons become myelinated. In most of the PLP mutants, only a fraction (<5%) of the axons is myelinated (Skoff and Knapp, 1992). If the function of PLP were solely to promote myelin sheath compaction, all of the axons should be myelinated but have an abnormal periodicity.
By blocking the synthesis of PLP in immature OLs in culture, we essentially prevented the formation of the myelin membrane sheets by OLs, but they still were able to sustain their web-like network of processes. Many mature OLs lost their large membrane sheets but retained their long processes after exposure to PLP antisense. The phenotype of the OLs treated with antisense S-ODNs to PLP closely matched the phenotype of most OLs seen in the PLP mutants. In thejimpy (jp) CNS, OLs had numerous long processes that branched and contacted axons but rarely myelinated (Ghandour and Skoff, 1988). Surprisingly, the phenotype of immaturejp OLs showed only subtle differences from their normal counterparts. This observation now makes sense in light of the antisense studies and confirms that the block in OL myelination lies primarily not so much in the ability of OLs to elaborate processes but in their ability to maintain myelin sheaths. The function of PLP in the elaboration of myelin sheaths can be demonstrated further by comparing the phenotype of shiverer (shi) OLs in culture that are deficient in MBP (Dyer et al., 1995). These MBP-deficient OLs often have membrane sheets that directly surround the cell body but generally lack the long processes seen with the PLP-antisense-treated OLs. The difference between the PLP− and MBP−mice, in terms of process extension and membrane sheet formation, strongly suggests two different functions for these proteins in myelination.
A more careful analysis of the phenotypes of the PLP mutants, the PLP− mice, and our own antisense studies suggests that PLP is not required for myelin sheath formation, at least by some OLs. The PLP− mutants (Boison et al., 1995), which lack normal PLP/DM20 protein, have OLs that make myelin sheaths with an abnormal periodicity and a thinner sheath than normal. De facto, this observation indicates that myelin sheath formation may occur in the absence of PLP/DM20. In the PLP mutants, a small percentage of axons is myelinated, and in the long-lived strain of the myelin-deficient rat, some OLs survive for at least 75–80 d and maintain a few myelin sheaths (Duncan et al., 1995). These findings indicate that some OLs are capable of making and maintaining myelin sheaths for several months, although it is still unclear whether an abnormal form of PLP is present in these OLs or whether PLP/DM20 is absent. In the antisense-treated cultures, ∼15% of the OLs were able to establish or maintain membrane sheets in the absence of detectable levels of PLP/DM20. The membrane sheets of these OLs stained strongly for MBP and A007, but they were PLP-negative even after an 11 d antisense regimen. Similarly, when younger 9 DIV cultures were used, formation of membrane sheets could be blocked in immature OLs for the first week; however, a week later ∼15% of the OLs (PLP−) exhibited sheets. The conclusion to be drawn from the PLP− mice, the mutants, and the antisense studies is that some OLs are able to maintain myelin sheaths without PLP/DM20. It is unclear whether other myelin proteins compensate for the loss of PLP in these situations. Another intriguing possibility is that subpopulations of OLs exist that have the capability of establishing and maintaining myelin sheaths without PLP or with very low levels. The identification of biochemically distinct subpopulations of OLs recently detected in the brain corresponds to Del Rio-Hortega’s morphological description of subtypes of OLs (Del Rio-Hortega, 1928). In one study (Butt et al., 1995), OLs that myelinated larger-diametered axons were carbonic anhydrase-negative. These thicker myelin sheaths are intensely fluorescent for MBP but very weakly fluorescent or negative for PLP (Hartman et al., 1982), suggesting that PLP plays less of a role than MBP in maintaining thick sheaths.
The effects of blocking PLP production on oligodendrocyte survival
Extensive death of OLs is a characteristic feature of most PLP mutants; for many OLs, death begins shortly after they have completed mitosis but before they have begun to form compact myelin (Skoff et al., 1976; Vermeesch et al., 1990). The dissociation between death of OLs and myelin sheath compaction in the PLP mutants is illustrated perfectly by the rsh mutant. This mutant has a normal lifespan, no evidence of increased OL death, and even a slight increase in the number of OLs (Fanarraga et al., 1992). However, the sheaths are abnormally thin and exhibit the abnormal periodicity of the other PLP mutants. The explanation for the dissociation between OL death and abnormal myelination in this mutant is unclear, and it is suggested that it results from the different functions for PLP and DM20 (Griffiths et al., 1995). When expression of normal PLP gene is increased fivefold, the overexpressers die within 2 months, and death of OLs is a predominant feature (Kagawa et al., 1994). With twofold overexpression (Readhead et al., 1994), mice die within 3 months and OL death is increased (Skoff, unpublished observations). Thus, death of OLs is a peculiarity associated with the PLP gene, because increased OL death in the shi mouse and myelin-associated glycoprotein (MAG)-null mice has not been described (Skoff, 1995).
The cultures treated with antisense to PLP revealed a novel property about the expression of the PLP gene, which explains many of the paradoxical findings observed in the overexpressers and mutants. The absence or dramatic reduction in levels of PLP in cultured OLs led to a dramatic increase in the number of OLs, as compared with controls. This increase was highly significant in the older cultures (12→21 DIV), obvious in the few experiments using younger cultures (9→18 DIV) and in experiments using jp cultures, a sixfold increase in the number of jp OLs treated with antisense, as compared with untreated jp OLs (Skoff, unpublished observations). The increase in OLs numbers is not attributable to blocking the synthesis of any myelin protein, because the number of OLs obtained fromshi is not noticeably increased in culture (C. A. Dyer, personal communication).
The increase in OLs in the antisense-treated cultures was not attributable to any significant increase in OL progenitor proliferation, because the BrdU labeling index in OL progenitors or mature OLs was not increased significantly. The lack of increased proliferation means that the OLs in culture, with no or sharply reduced levels of PLP/DM20, prolong their lives. Thus, the absence of PLP seems preferable to a slight overexpression of the gene or to conservative amino acid substitutions. Many conservative amino acid substitutions in PLP/DM20 in both nonprimates and humans now have been described and, with the exception of rsh, are lethal. Conversely, the absence of normal PLP/DM20, as evidenced by the PLP− mice and the deletion of PLP in the case of P–M, is not lethal, or at least not as devastating. The basis for these paradoxical observations can be explained by the antisense studies reported here that show that the absence of PLP/DM20 has the positive effect of promoting OL survival but the negative effect of preventing the differentiation of most OLs.
Footnotes
This work was supported by the National Multiple Sclerosis Society. We thank R. Lerch for performing the laser cytometer analyses and R. Miller for assistance in preparing the graphs and statistical analyses.
Correspondence should be addressed to Dr. Robert P. Skoff, Department of Anatomy and Cell Biology, Wayne State University School of Medicine, 540 East Canfield, Detroit, MI 48201.
REFERENCES
- 1.Bansal R, Stefansson K, Pfeiffer SE. Proligodendroblast antigen (POA), a developmental antigen expressed by A007/04-positive oligodendrocyte progenitors prior to the appearance of sulfatide and galactocerebroside. J Neurochem. 1992;58:2221–2231. doi: 10.1111/j.1471-4159.1992.tb10967.x. [DOI] [PubMed] [Google Scholar]
- 2.Barbarese E, Carson JH, Braun PE. Subcellular distribution and structural polymorphism of myelin basic protein in normal and jimpy mouse brain. J Neurochem. 1979;32:1437–1446. doi: 10.1111/j.1471-4159.1979.tb11082.x. [DOI] [PubMed] [Google Scholar]
- 3.Boison D, Stoffel W. Disruption of the compacted myelin sheath of axons of the central nervous system in proteolipid protein deficient mice. Proc Natl Acad Sci USA. 1994;91:11709–11713. doi: 10.1073/pnas.91.24.11709. [DOI] [PMC free article] [PubMed] [Google Scholar]
- 4.Boison D, Bussow H, D’Urso D, Muller H-W, Stoffel W. Adhesive properties of proteolipid protein are responsible for the compaction of CNS myelin sheaths. J Neurosci. 1995;15:5502–5513. doi: 10.1523/JNEUROSCI.15-08-05502.1995. [DOI] [PMC free article] [PubMed] [Google Scholar]
- 5.Butt AM, Ibrahim M, Ruge FM, Berry M. Biochemical subtypes of oligodendrocyte in the anterior medullary velum of the rat as revealed by the monoclonal antibody Rip. Glia. 1995;14:185–197. doi: 10.1002/glia.440140304. [DOI] [PubMed] [Google Scholar]
- 6.Delassalle A, Zalc B, Lachapelle F, Raoul M, Collier P, Jacque C. Regional distribution of myelin basic protein in the central nervous system of quaking, jimpy, and normal mice during development and aging. J Neurosci Res. 1981;6:303–313. doi: 10.1002/jnr.490060305. [DOI] [PubMed] [Google Scholar]
- 7.Del Rio-Hortega P. Tercera aportacion al conocimiento morfologica e interpretacion functional de la oligodendroglia. Mem R Soc Esp Hist Nat. 1928;14:5–122. [Google Scholar]
- 8.Duchala CS, Asotra K, Macklin WB. Expression of cell surface markers and myelin proteins in cultured oligodendrocytes from neonatal brain of rat and mouse: a comparative study. Dev Neurosci. 1995;17:70–80. doi: 10.1159/000111276. [DOI] [PubMed] [Google Scholar]
- 9.Duncan ID, Hammang JP, Trapp BT. Abnormal compact myelin in the myelin deficient rat: absence of proteolipid protein correlates with a defect in the intraperiod line. Proc Natl Acad Sci USA. 1987;84:6287–6291. doi: 10.1073/pnas.84.17.6287. [DOI] [PMC free article] [PubMed] [Google Scholar]
- 10.Duncan ID, Nadon NL, Hoffman RL, Lunn KF, Csiza C, Wells MR. Oligodendrocyte survival and function in the long-lived strain of the myelin deficient rat. J Neurocytol. 1995;24:745–762. doi: 10.1007/BF01191211. [DOI] [PubMed] [Google Scholar]
- 11.Dyer CA, Benjamins JA. Antibody to galactocerebroside alters organization of oligodendroglial membrane sheets in culture. J Neurosci. 1988;8:4307–4318. doi: 10.1523/JNEUROSCI.08-11-04307.1988. [DOI] [PMC free article] [PubMed] [Google Scholar]
- 12.Dyer CA, Philibotte TM, Billings-Gagliardi S, Wolf MK. Cytoskeleton in myelin-basic protein-deficient shiverer oligodendrocytes. Dev Neurosci. 1995;17:53–62. doi: 10.1159/000111273. [DOI] [PubMed] [Google Scholar]
- 13.Eisenbarth GS, Walsh F, Nirenberg M. Monoclonal antibody to a plasma membrane antigen of neurons. Proc Natl Acad Sci USA. 1979;76:4913–4917. doi: 10.1073/pnas.76.10.4913. [DOI] [PMC free article] [PubMed] [Google Scholar]
- 14.Ellis D, Malcolm S. Proteolipid protein gene dosage effect in Pelizaeus–Merzbacher disease. Nat Genet. 1994;6:333–334. doi: 10.1038/ng0494-333. [DOI] [PubMed] [Google Scholar]
- 15.Entwistle A, Noble M. The use of polarization analysis in the quantification of fluorescent emission: general principles. J Microsc. 1992a;165:331–346. doi: 10.1111/j.1365-2818.1992.tb01492.x. [DOI] [PubMed] [Google Scholar]
- 16.Entwistle A, Noble M. The quantification of fluorescent emission from biological samples using analysis of polarization. J Microsc. 1992b;165:347–365. doi: 10.1111/j.1365-2818.1992.tb01492.x. [DOI] [PubMed] [Google Scholar]
- 17.Erickson RP. The use of antisense approaches to study development. Dev Genet. 1993;14:251–257. doi: 10.1002/dvg.1020140402. [DOI] [PubMed] [Google Scholar]
- 18.Fanarraga ML, Griffiths IR, McCulloch MC, Barier JA, Kennedy PGE, Brophy PJ. Rumpshaker: an X-linked mutation causing hypomyelination: developmental differences in myelination and glial cells between the optic nerve and spinal cord. Glia. 1992;5:161–170. doi: 10.1002/glia.440050302. [DOI] [PubMed] [Google Scholar]
- 19.Feutz A-C, Bellomi I, Schladenhaufen Y, Ghandour MS. Isolation and characterisation of defective jimpy oligodendrocytes in culture. J Neurocytol. 1995;24:865–877. doi: 10.1007/BF01179985. [DOI] [PubMed] [Google Scholar]
- 20.Ghandour MS, Skoff RP. Expression of galactocerebroside in developing normal and jimpy oligodendrocytes in situ. J Neurocytol. 1988;17:485–498. doi: 10.1007/BF01189804. [DOI] [PubMed] [Google Scholar]
- 21.Greenfield S, Norton WT, Morell P. Quaking mouse: isolation and characterization of myelin protein. J Neurochem. 1971;18:2119–2128. doi: 10.1111/j.1471-4159.1971.tb05070.x. [DOI] [PubMed] [Google Scholar]
- 22.Griffiths IR, Scott I, McCulloch MC, Barrie JA, McPhilemy K, Cattanach BM. Rumpshaker mouse: a new X-linked mutation affecting myelination: evidence for a defect in PLP expression. J Neurocytol. 1990;19:273–283. doi: 10.1007/BF01217305. [DOI] [PubMed] [Google Scholar]
- 23.Griffiths IR, Montague P, Dickinson P. The proteolipid protein gene. Neuropathol Appl Neurobiol. 1995;21:85–96. doi: 10.1111/j.1365-2990.1995.tb01034.x. [DOI] [PubMed] [Google Scholar]
- 24.Hartman BK, Agrawal HC, Agrawal D, Kalmbach S. Development and maturation of central nervous system myelin: comparison of immunohistochemical localization of proteolipid protein and basic protein in myelin and oligodendrocytes. Proc Natl Acad Sci USA. 1982;79:4217–4220. doi: 10.1073/pnas.79.13.4217. [DOI] [PMC free article] [PubMed] [Google Scholar]
- 25.Hodes ME, Pratt VM, Dlouhy SR. Genetics of Pelizaeus–Merzbacher disease. Dev Neurosci. 1993;15:383–394. doi: 10.1159/000111361. [DOI] [PubMed] [Google Scholar]
- 26.Honig MG, Hume RI. DiI and DiO: versatile fluorescent dyes for neuronal labeling and pathway tracing. Trends Neurosci. 1986;12:333–341. [PubMed] [Google Scholar]
- 27.Jackson KF, Duncan ID. Cell kinetics and cell death in the optic nerve of the myelin deficient rat. J Neurocytol. 1988;17:657–670. doi: 10.1007/BF01260993. [DOI] [PubMed] [Google Scholar]
- 28.Kagawa T, Ikenaka K, Inoue Y, Kuriyama S, Tsujii T, Nakao J, Nakajima K, Aruga J, Okano H, Mikoshiba K. Glial cell degeneration and hypomyelination caused by overexpression of myelin proteolipid protein gene. Neuron. 1994;13:427–442. doi: 10.1016/0896-6273(94)90358-1. [DOI] [PubMed] [Google Scholar]
- 29.Knapp PE, Skoff RP, Redstone DW. Oligodendroglial cell death in jimpy mice: an explanation for the myelin deficit. J Neurosci. 1986;6:2813–2822. doi: 10.1523/JNEUROSCI.06-10-02813.1986. [DOI] [PMC free article] [PubMed] [Google Scholar]
- 30.Knapp PE, Bartlett WP, Skoff RP. Cultured oligodendrocytes mimic in vivo phenotypic characteristics: cell shape, expression of myelin specific antigens, and membrane production. Dev Biol. 1987;120:356–365. doi: 10.1016/0012-1606(87)90238-7. [DOI] [PubMed] [Google Scholar]
- 31.Knapp PE, Skoff RP, Sprinkle TJ. Differential expression of galactocerebroside, myelin basic protein, and 2′,3′-cyclic nucleotide 3′-phosphohydrolase during development of oligodendrocytes in vitro. J Neurosci Res. 1988;21:249–259. doi: 10.1002/jnr.490210217. [DOI] [PubMed] [Google Scholar]
- 32.Knapp PE, Skoff RP, Booth C. Oligodendrocytes possess essential prerequisites for remyelination: division, motility, and structural rearrangement. In: Seil FJ, editor. Advances in neurology, neural injury, and regeneration, Vol 59. Raven; New York: 1993. pp. 105–112. [PubMed] [Google Scholar]
- 33.Macklin WB, Campagnoni CW, Deininger PL, Gardinier MV. Structure and expression of the mouse myelin proteolipid protein gene. J Neurosci Res. 1987;18:383–394. doi: 10.1002/jnr.490180302. [DOI] [PubMed] [Google Scholar]
- 34.Mirabelli CK, Bennett CF, Anderson K, Crooke ST. In vitro and in vivo pharmacologic activities of antisense oligonucleotides. Anticancer Drug Des. 1991;6:647–661. [PubMed] [Google Scholar]
- 35.Nave K-A. Neurological mouse mutants and the genes of myelin. J Neurosci Res. 1994;38:607–612. doi: 10.1002/jnr.490380602. [DOI] [PubMed] [Google Scholar]
- 36.Nave K-A, Lai C, Bloom FE, Milner RJ. Splice site selection in the proteolipid protein (PLP) gene transcript and primary structure of the DM-20 protein of the central nervous system myelin. Proc Natl Acad Sci USA. 1987;84:5665–5669. doi: 10.1073/pnas.84.16.5665. [DOI] [PMC free article] [PubMed] [Google Scholar]
- 37.Raskind WH, Williams CA, Hudson LD, Bird TD. Complete deletion of the proteolipid protein gene (PLP) in a family with X-linked Pelizaeus–Merzbacher disease. Am J Hum Genet. 1991;49:1355–1360. [PMC free article] [PubMed] [Google Scholar]
- 38.Readhead C, Schneider A, Griffiths I, Nave K-A. Premature arrest of myelin formation in transgenic mice with increased proteolipid protein gene dosage. Neuron. 1994;12:1–20. doi: 10.1016/0896-6273(94)90214-3. [DOI] [PubMed] [Google Scholar]
- 39.Schneider A, Montague P, Griffiths I, Fanarraga M, Kennedy P, Brophy P, Nave K-A. Uncoupling of hypomyelination and glial cell death by a mutation in the proteolipid protein gene. Nature. 1992;358:758–760. doi: 10.1038/358758a0. [DOI] [PubMed] [Google Scholar]
- 40.Skoff RP. Programmed cell death in the dysmyelinating mutants. Brain Pathol. 1995;5:283–288. doi: 10.1111/j.1750-3639.1995.tb00605.x. [DOI] [PubMed] [Google Scholar]
- 41.Skoff RP, Knapp PE. Expression of the jimpy phenotype in relation to proteolipid protein appearance. Ann NY Acad Sci. 1990;605:122–134. doi: 10.1111/j.1749-6632.1990.tb42387.x. [DOI] [PubMed] [Google Scholar]
- 42.Skoff RP, Knapp PE. Phenotypic expression of X-linked genetic defects affecting myelination. In: Martenson RE, editor. Myelin: biology and chemistry. CRC; Boca Raton, FL: 1992. pp. 653–676. [Google Scholar]
- 43.Skoff RP, Price DL, Stocks A. Electron microscopic autoradiographic studies of gliogenesis in the rat optic nerve. J Comp Neurol. 1976;169:291–312. doi: 10.1002/cne.901690303. [DOI] [PubMed] [Google Scholar]
- 44.Skoff RP, Ghandour MS, Knapp PE. Postmitotic oligodendrocytes generated during postnatal cerebral development are derived from proliferation of immature oligodendrocytes. Glia. 1994;12:12–23. doi: 10.1002/glia.440120103. [DOI] [PubMed] [Google Scholar]
- 45.Stein CA, Krieg AM. Editorial: problems in interpretation of data derived from in vitro and in vivo use of antisense oligodeoxynucleotides. Antisense Res Dev. 1994;4:67–69. doi: 10.1089/ard.1994.4.67. [DOI] [PubMed] [Google Scholar]
- 46.Vermeesch MK, Knapp PE, Skoff RP, Studzinski DM, Benjamins JA. Death of individual oligodendrocytes in jimpy brain precedes expression of proteolipid protein. Dev Neurosci. 1990;12:303–315. doi: 10.1159/000111859. [DOI] [PubMed] [Google Scholar]


