

Abstract
Background:
Unpredictable difficult laryngoscopy (DL) remains a challenge for anesthesiologists, especially when difficult ventilation occurs during standard laryngoscopy. Accurate airway assessment should always be performed, but the common airway assessment methods only perform superficial screening. Thus, the deep laryngopharyngeal anatomy may not be evaluated. Ultrasound-based airway assessment has been recently proposed as a useful, simple, and non-invasive bedside tool as an adjunct to clinical methods, which may facilitate identification of DL. The present study aimed to determine the correlation between ultrasound-measured indicators and DL.
Methods:
Patients undergoing elective surgery under general anesthesia with tracheal intubation were enrolled. Ultrasonic airway assessments were performed before anesthesia induction. Ultrasound diagnostic indicators included the thickness and width of the base of the tongue, the angle between the epiglottis and glottis, the length of the thyrohyoid membrane, and the thickness of the lateral pharyngeal wall. A score of ≥3 in the Modified Cormack-Lehane Scoring System was used as a standard of DL and was also applied to divide patients into DL and non-DL groups. The area under the receiver operating characteristic (ROC) curve was used to evaluate the diagnostic ability of various diagnostic indicators.
Results:
A total of 499 patients were enrolled into non-DL and DL groups comprising 452 (452/499, 90.6%) and 47 (47/499, 9.4%) patients, respectively. One ultrasonic diagnoses indicator correlated with DL, namely, the angle between the epiglottis and glottis. When the angle between the epiglottis and glottis was 50°, the area under the ROC curve was maximum (0.902), and the best sensitivity (81%) and specificity (89%) were achieved.
Conclusions:
Airway ultrasounds should be considered to identify DL. The ultrasonic angle measured between the epiglottis and glottis is highly associated with DL, which may occur when the angle is less than 50°.
Clinical trial registration:
ChiCTR-DDT-13004102, http://www.chictr.org.cn/showproj.aspx?proj=5465
Keywords: Ultrasonography, Laryngoscopy, Airway management
Introduction
Approximately 30% of anesthesia-related deaths result from failures of airway management, and an unanticipated difficult airway is an important source of peri-operative anesthetic complications and mortality.[1] The probability of a difficult airway in the general population undergoing anesthesia is 1% to 4%, and the tracheal intubation failure rate is approximately 1 in 2000 in the elective setting and approximately 1 in 300 during rapid sequence induction in the obstetric setting.[2] Difficult glottic exposure contributes to difficult airway management with an incidence rate of 6.1% to 10.1%.[3,4] Many clinical indicators of difficult laryngoscopy (DL) have been identified for airway assessment, including Mallampati airway classification, thyromental distance, degree of mouth opening, and neck range of motion classification. However, these methods suffer from imperfect inter-observer reliability and limited predictive power.[5] The sensitivity of each indicator ranges from 20% to 62%, and the misdiagnosis rate is high (38%–80%).[6]
The development of ultrasound technology has led to attempts to use ultrasound to diagnose difficult airways,[7] localize anatomical structures,[8] and facilitate tracheal intubation.[9] The correlation between the ultrasound view of the airway and the Modified Cormack-Lehane Scoring System (MCLS) of the direct laryngoscopy has been analyzed.[10] Some studies have described a clear correlation between ultrasound measurements of the width of the base of the tongue or the thickness of the lateral pharyngeal wall and obstructive sleep apnea syndrome.[11,12] Reddy et al[13] reported ultrasound had potential utility in predicting difficult intubation in adults undergoing general anesthesia. A systematic review has reported that ultrasonography provides high-resolution images of the anatomic structures of the upper airway comparable to computed tomography (CT) and magnetic resonance imaging (MRI).[14] Several ultrasonographic parameters, such as soft tissue thickness at the level of the hyoid bone, epiglottis and vocal cords as well as the visibility of hyoid bone in sub-lingual ultrasound, hyomental distance in the head-extended position and hyomental distance ratio, have been found to be independent predictors of DL in patients.[15–18]
In the present study, ultrasound technology was used to verify that the thickness and width of the base of the tongue, the angle between the epiglottis and glottis, the length of the thyrohyoid membrane, and the thickness of the lateral pharyngeal wall are associated with DL and to identify ultrasound diagnostic indicators of DL. The angle between the epiglottis and glottis was an innovative factor after carefully observing the ultrasonic static pharyngeal structures and analyzing the pharyngeal dynamic process during tracheal intubation. Thus, these ultrasound-derived factors were hypothesized to be associated with DL.
Methods
Ethical approval
The Ethics Committee at Union Hospital, Tongji Medical College, Huazhong University of Science and Technology approved this study, which has also been registered in the Chinese Clinical Trial Registry (ChiCTR-DDT-13004102). All patients signed informed consent.
Research methodology
Adult patients who underwent elective surgery under general anesthesia with endotracheal intubation at Union Hospital were recruited. The following exclusion criteria were applied: maxillofacial deformities and fractures; limited mouth opening; limited neck movement; non-endotracheal intubation; and agomphiasis. Patients were divided into two groups based on the results of MCLS as follows: patients with DL (DL group); and patients with non-DL (non-DL group).
Ultrasound measurement indicators
The thickness and width of the base of the tongue, the angle between the epiglottis and glottis, the length of the thyrohyoid membrane, and the thickness of the lateral pharyngeal wall were measured with ultrasound.
Ultrasonography
The ultrasound instrument used was the LOGIQ_E portable color ultrasound diagnostic system (General Electric, Fairfield, CT, USA). Patients were examined with ultrasound before anesthesia induction while supine with the head on a soft pillow with an elevation of 10 cm and the neck extended to simulate the body position during intubation. A 12L-RS high-frequency linear array probe (frequency: 5–12 MHz) suitable for superficial tissue structures from the skin was used to separately scan more superficially located areas. The width of the lower tongue in a cross-sectional plane was measured as the distance between the lingual arteries[11] [Figure 1]. A 4C-RS low-frequency convex array probe (frequency: 2–5 MHz), which facilitates the identification of tissues in deeper locations with a broader scope, was used to scan the thickness of the tongue in the median sagittal plane [Figure 1]. Ultrasound images of the hyoid bone, thyroid cartilage, thyrohyoid membrane, epiglottis, and the anterior commissure of the glottis in the median sagittal plane were obtained by a 12L-RS high-frequency linear array probe. The angle between the long axis of epiglottis and the vertical line through the anterior commissure of the glottis was measured as the angle between the epiglottis and glottis. The distance between the hyoid bone and the thyroid cartilage was the length of the thyrohyoid membrane [Figure 2]. The ultrasound assessment of lateral pharyngeal wall thickness in the coronal plane was performed just inferior to the mastoid process on one side of the neck [Figure 3]. All images were obtained at the end of the expiratory breath for approximately 1 to 2 s. Measurements were performed three times, and the mean values of the corresponding variables were recorded.
Figure 1.
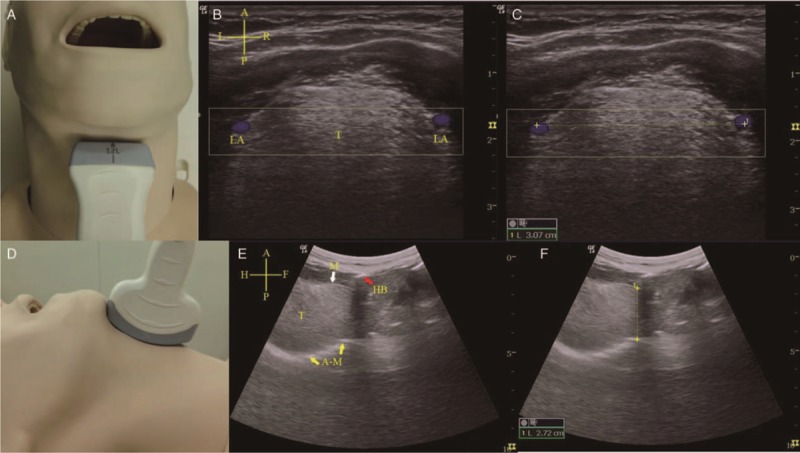
Width and thickness of the base of the tongue. (A) Coronal plane view when the high-frequency linear array probe was placed under the mandible and neck area. (B) Coronal plane ultrasound view of the tongue (T). LA were observed via Doppler mode (blue) on both sides of lower lateral borders of tongue base. (C) The distance between arteries was the width of the base of the tongue (yellow dotted line). (D) Median sagittal view when the low-frequency convex array ultrasound probe was placed under the mandible and neck area. (E) Median sagittal ultrasound view of the tongue (T). Mucosal (M, white arrow) covering of tongue and bright hyper-echoic A-M interface (yellow arrow) arc line. The bright hyper-echoic hyoid bone (HB, red arrow) accompanying posterior acoustic shadow is also shown. (F) The distance between the anterior mucosal and posterior bright air-mucosal arc line was the thickness of the base of the tongue (yellow dotted line). Cruciform – A: Anterior; P: Posterior; L: Left; R: Right; H: Head; F: Foot. A-M: Air-mucosal; HB: Hyoid bone; LA: Lingual arteries .
Figure 2.
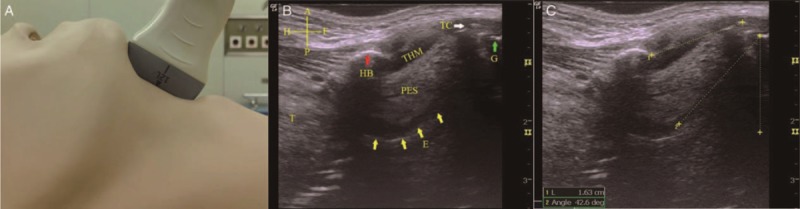
Angle between the epiglottis and glottis and the length of the thyrohyoid membrane. (A) Median sagittal view when the high-frequency linear array probe was placed upon the anterior neck (from the hyoid bone to the thyroid cartilage). (B) Median sagittal ultrasound view. The epiglottis (E, yellow arrows) is shown as a hypo-echoic “hockey stick” shape. The anterior border of the epiglottis is demarcated by the hyper-echoic PES, and the posterior border of the epiglottis is demarcated by the bright A-M interface (yellow arrow). The glottis (G, green arrow) is shown as a bright area at the end of epiglottic vallecula. The bright hyoid bone (HB, red arrow) and TC (white arrow) are also shown. The hypo-echoic area between the HB and TC is the THM. (C) The distance between the hyoid bone and the thyroid cartilage indicates the length of the THM (yellow dotted line). The angle between the long axis of epiglottis and the vertical line through the glottis is the desired measurement (yellow dotted angle). Cruciform – A: Anterior; P: Posterior; H: Head; F: Foot. A-M: Air-mucosal; HB: Hyoid bone; PES: Pre-epiglottic space; TC: Thyroid cartilage; THM: Thyrohyoid membrane.
Figure 3.
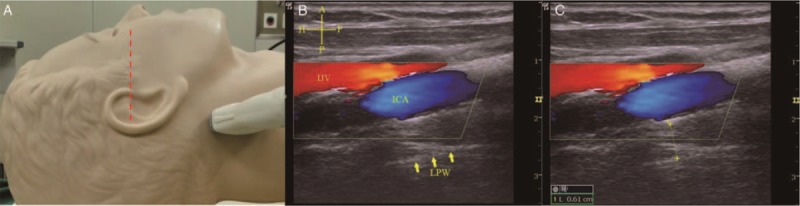
Thickness of the lateral pharyngeal wall. (A) Scanning position of the LPW. The patient laid supine with the infra-orbital meatal baseline (red dotted line) perpendicular to the scanning table. The high-frequency linear array probe was placed longitudinally on the lateral side of the neck just inferior to the mastoid process. (B) Ultrasound view of the LPW. The ICA (blue area) and IJV (red area) are shown by Doppler imaging, and the lateral wall of pharynx is represented by the bright echogenic interface (yellow arrows). (C) The LPW thickness (yellow dotted line) was measured from the internal carotid artery to the lateral wall of pharynx. Cruciform – A: Anterior; P: Posterior; H: Head; F: Foot. ICA: Internal carotid artery; IJV: Internal jugular vein; LPW: Lateral pharyngeal wall.
Anesthesia methods
An effective venous channel, electrocardiogram, non-invasive blood pressure monitor, and train-of-four (TOF)-Watch SX neuromuscular monitor (Organon (Ireland) Ltd., Dublin, Ireland) were already established upon patient entry into the operating room. Patients were pre-oxygenated with 100% oxygen via a face mask for 3 min. Anesthesia was induced with propofol (2 mg/kg), fentanyl (2–4 μg/kg), and rocuronium (0.6–0.8 mg/kg). A No. 3 or 4 Macintosh laryngoscope was used to expose the glottis for tracheal intubation when TOF = 0. The MCLS and tracheal intubation results were then recorded.
DL standards
An MCLS[19] was used to identify DL with the following glottis visualization classification: grade 1, full view of the glottis; grade 2A, only a view of the posterior half of the glottis; grade 2B, only a view of the arytenoid cartilage and the epiglottis; grade 3, only a view of the epiglottis; and grade 4, no view of the epiglottis. Grades 3 and 4 were defined as DL.
Study blinding
An assessor-blinded method was used in the present study. Two attending anesthesiologists with more than 5 years work experience and who received formal training in ultrasonography participated in this study. The ability of the anesthesiologists in laryngoscopic exposure and ultrasound scanning was consistent with other formal trained attending anesthesiologists. One anesthesiologist was responsible for the pre-operative ultrasonic airway assessment, and the other anesthesiologist was responsible for the tracheal intubation and DL assessment using MCLS. The anesthesiologists performed and recorded assessment independently, as neither anesthesiologist was aware of the results obtained by his or her counterpart.
Statistical analysis
Measurement data are expressed as the mean ± standard deviation, and data are calculated as percentages. An independent sample test was used to analyze the demographic data, conventional airway assessment indicators and ultrasound measurement indicators, and the χ2 test was used to assess the significance. Univariate and multivariate logistic regression analyses were used to identify laryngoscopic risk factors. The area under the curve (AUC) was used to evaluate the diagnostic accuracy of various diagnostic indicators. A difference of P < 0.05 was considered statistically significant. SPSS 19.0 (International Business Machines Corporation, Armonk, NY, USA) was used to perform all statistical analyses.
We planned to enroll 50 DL cases to perform effective statistical analysis, which was ten cases per factor studied. To achieve this goal, 500 to 800 patients were planned for enrollment in the present study because the incidence of DL was 6.1% to 10.1% in the whole population. When 499 patients were enrolled, the statistical analysis was performed.
Results
In total, 508 patients who underwent general anesthesia for elective surgery at the Union Hospital from January 2015 to May 2017 were recruited. Nine of these patients refused ultrasound examination, and the remaining 499 patients were examined.
Univariate analysis of indicators
MCLS was applied to divide patients into DL and non-DL groups comprising 47 (47/499, 9.4%) and 452 (452/499, 90.6%) cases, respectively. The incidence of DL was 9.4%, which was consistent with the reported incidence of 6.1% to 10.1%.
Univariate analysis was used to preliminarily screen for laryngoscopic exposure risk factors [Table 1].
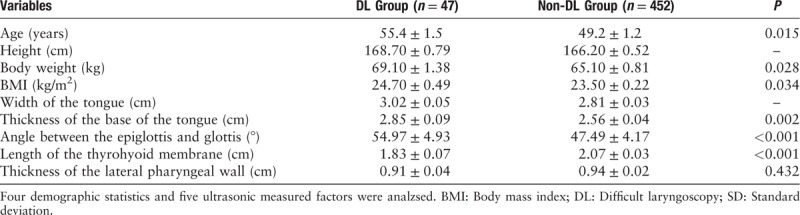
Table 1.
Independent sample t test results of the variables in the DL and the non-DL groups (measurement data, mean ± SD).
Univariate logistic regression analysis results
The MCLS was used as the dependent variable. The odds ratio (OR) value and standardized regression coefficient of each factor were calculated to determine the relative degree of risk of laryngoscopic exposure. A total of six factors were screened out [Table 2].
Table 2.
Univariate logistic regression analysis and standardized regression coefficient.
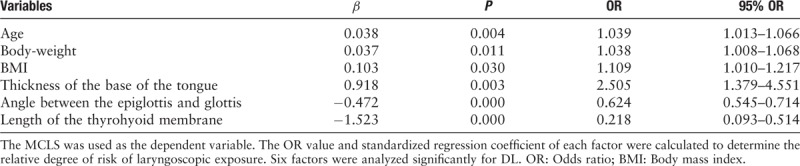
Multivariate logistic regression analysis results
The six significant factors [Table 2] from the univariate logistic regression analysis were placed in the logistic regression model as covariates for multivariate analysis to eliminate the confounding factors and enable the balancing of a variate in a complex relationship. The angle between the epiglottis and glottis (P < 0.05, 95% OR: 0.561–0.746) was the only independent risk factor for DL.
Receiver operating characteristic curve for diagnoses of DL
The receiver operating characteristic (ROC) curve was used to determinate the optimal cut-off point at which the maximal sensitivity and specificity were achieved. The parametric ROC curves showed that the AUC values were at a maximum of 0.902 when the intercept was 50°. The best sensitivity (81%) and specificity (89%) were achieved at a cut-off point of 50°. These results suggested that when the angle between the epiglottis and glottis is less than 50°, DL may be considered [Figure 4]. In addition, the clinical significance of the angle between the epiglottis and glottis was exhibited.
Figure 4.
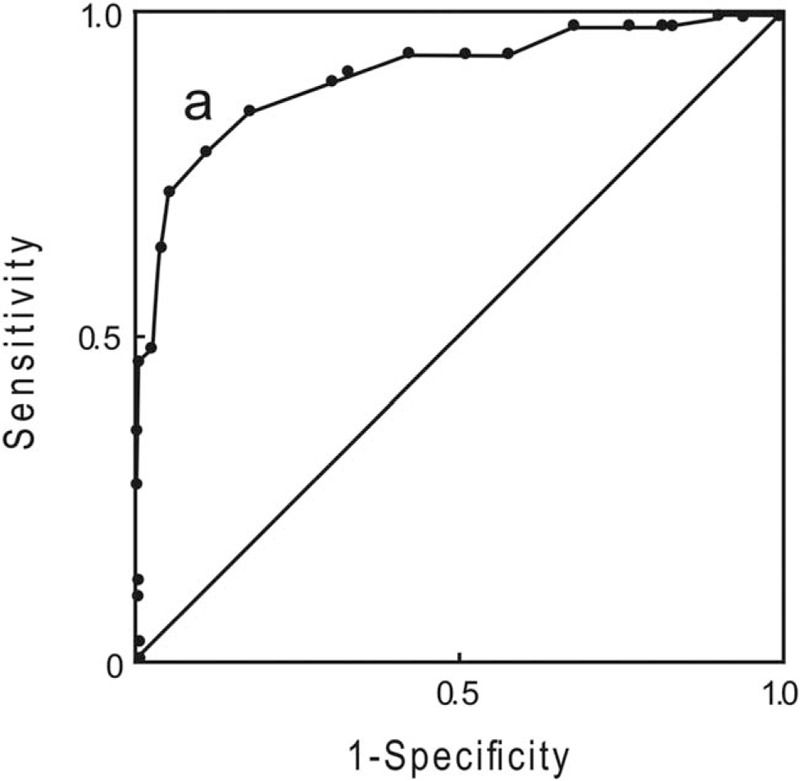
ROC curve of the angle between the epiglottis and glottis for difficult laryngoscopy. The best sensitivity (81%) and specificity (89%) were achieved at the cut-off point of 50°. The area under the ROC curve was 0.902 (95% CI 0.846–0.957). CI: Confidence interval; ROC: Receiver operating characteristic.
Discussion
There are many traditional DL assessment methods, but only superficial monitoring can be performed, indicating that the deep anatomy of the larynx cannot be evaluated. With the application of ultrasonic technology, a deeper anatomic structure should be revealed to discriminate the occurrence of DL, thereby increasing the diagnostic ability of DL.
The American Society of Anesthesiologists has defined a difficult airway as the clinical situation in which a conventionally trained anesthesiologist experiences difficulty with mask ventilation and/or tracheal intubation.[20] Many imaging technologies, including X-ray, CT, MRI, and ultrasound, have been used as potential predictive tools for airway assessment. Prasad et al[21] found that most laryngopharyngeal anatomical structures displayed in CTs can be similarly displayed using B ultrasound. Wojtczak[16] used ultrasound to scan the anatomical structures in the lower sub-mandibular area and found that the ratio of the hyomental distance can be used to diagnose difficult intubation caused by DL. Wu et al[22] quantified anterior neck soft tissue by ultrasound to predict DL and found that the distance from skin to hyoid bone, distance from skin to epiglottis midway between hyoid bone and thyroid cartilage, distance from skin to anterior commissure of vocal cords are independent predictors of DL. However, these studies only measured single laryngopharyngeal anatomical structures. The exposure of the epiglottis and glottis is a dynamic and linkage process, indicating that a proper indicator should consider both the epiglottis and glottis together. The epiglottis acts as a lid placed on the glottis with different angles to the glottis. When the laryngoscope is placed in the epiglottic vallecula and indirectly exposes the glottis at the end of the epiglottis, it is similar to opening the lid from the end of the cover, suggesting that the angle between the epiglottis and glottis may affect glottic exposure. When the angle between the epiglottis and glottis is smaller, it is more difficult to open the epiglottis and expose the glottis. Therefore, there exists a greater likelihood of DL and difficult tracheal intubation with smaller angles between the epiglottis and glottis, which reflects the pharyngeal dynamic process during tracheal intubation. Thus, ultrasonic measurement of the laryngeal structure may be an innovative indicator in clinical anesthesia.
As is known, the respiratory tract is almost entirely filled with gas. Air is a weak ultrasound medium, and it exhibits hyper-echoic boundaries that affect deep-tissue imaging, explaining why ultrasound is rarely used to study the airway. However, the air-adjacent anatomical structures in the airway reveal clear ultrasound images. Many studies have found that anatomical structures in the upper respiratory tract can be identifiable on ultrasound.[23] Singh et al[8] noted that the epiglottis, thyroid cartilage, cricoid cartilage, and tracheal ring appear uniform and hypo-echoic in ultrasounds. The intersecting plane of the cartilage mucous membrane and air tend to appear as a hyper-echoic white line under ultrasound called the air-mucosal (A-M) interface.
The epiglottis of an adult is flat with a curved free edge, and it is attached to the inner surface of the anterior horn of the thyroid cartilage. The ultrasound image of the epiglottis in the median sagittal plane appears as a hypo-echoic “hockey stick” shape and as a “C” shape in cross-section. A bright hyper-echoic line is formed by the A-M interface posterior to the epiglottis.[24] In the present study, an angle between the epiglottis and glottis of less than 50° was a significant diagnostic indicator of DL. The best sensitivity (81%) and specificity (89%) were also achieved at an angle less than 50°. This finding suggested that ultrasound-guided airway assessment may enhance the ability of clinicians to diagnose DL.
The ultrasound-assessed width of the base of the tongue and an increase in thickness of the lateral pharyngeal wall, which may exacerbate airway obstruction, was not related to DL. These two factors may be related to difficult mask ventilation, but further research is required.
The significant factors from the univariate logistic regression analysis were placed in the logistic regression model as covariates for multivariate analysis to eliminate the confounding factors and enable the balancing of a variety of factors in a complex relationship. This approach was used to further screen the primary risk factors with the capacity to cause DL and reflected the influence of these risk factors on the determination of the incidence and prediction of disease.[25] The results of the multivariate logistic regression analysis revealed that the angle between the epiglottis and glottis was the only independent risk factor for DL in the present study.
The thickness of the base of the tongue and the length of the thyrohyoid membrane were associated with DL in univariate but not multivariate logistic regression analysis. DL is affected by many factors, such as the neck range of motion and the degree of mouth opening.[24] Therefore, the thickness of the base of the tongue may not be associated with DL and is not an independent risk factor for DL. The thyrohyoid membrane starts from the tail end of the hyoid bone and goes to the tip of the thyroid cartilage, and it provides a window for ultrasound visualization of the epiglottis using a high-frequency linear array transducer.[8] The use of an ultrasound probe to scan the throat structures in the median sagittal position from the hyoid bone to the thyroid cartilage reveals the thyroid cartilage muscle and a bright line, representing the contact surface between the epiglottis and air.[26] The thyromental distance is equal to the sum of the distance from the top of the thyrohyoid membrane and the thyroid cartilage to the mandibular edge. A shorter thyromental distance occurs when a shorter thyrohyoid membrane is accompanied by a small mandible. A large angle between the pharyngeal axis and laryngeal axis make it difficult for the pharyngeal and laryngeal axes to align during glottic exposure. The present study did not demonstrate that the length of the thyrohyoid membrane was an independent risk factor for DL, suggesting that this variable was influenced by other factors.
Although with the development of video laryngoscope and other technologies, the traditional difficult airway intubation has become easier. However, DL still exists, and it will become more difficult if it occurs under advanced intubation technology. During the present study, two patients with DL under video laryngoscope were followed up post-operatively. The examination showed that epiglottises were difficult to display in the ultrasonic image and that the angle between the epiglottis and glottis was approximately 40°, much less than 50°. These clinical cases showed the necessity of ultrasound-measured risk factors to predict DL.
These results showed that ultrasonic measurement of the angle between the epiglottis and glottis is highly associated with DL. Further research is needed to determine ultrasound-measured factors in predicting difficult mask ventilation and intubation. The present study was based on an Asian population, suggesting that further investigations in other populations are needed.
In summary, the magnitude of the angle between the epiglottis and glottis under ultrasound was highly associated with DL, suggesting that this measurement is an effective indicator of DL. DL may occur when the ultrasound measurement of the angle between the epiglottis and glottis is less than 50°.
Funding
This study was supported by a grant from the National Natural Science Foundation of China (No. 81370112).
Conflicts of interest
None.
Footnotes
How to cite this article: Wang L, Feng YK, Hong L, Xie WL, Chen SQ, Yin P, Wu QP. Ultrasound for diagnosing new difficult laryngoscopy indicator: a prospective, self-controlled, assessor blinded, observational study. Chin Med J 2019;00:00–00. doi: 10.1097/CM9.0000000000000393
Lei Wang and Yan-Kun Feng contributed equally to this work.
References
- 1.Benumof JL. Management of the difficult adult airway. With special emphasis on awake tracheal intubation. Anaesthesiology 1991; 75:1087–1110. doi: 10.1097/00000542-199112000-00021. [DOI] [PubMed] [Google Scholar]
- 2.Cook TM, MacDouqall-Davis SR. Complications and failure of airway management. Br J Anaesth 2012; 109 Suppl 1:i168–i185. doi: 10.1093/bja/aes393. [DOI] [PubMed] [Google Scholar]
- 3.El-Ganzouri AR, McCarthy RJ, Tuman KJ, Tanck EN, Ivankovich AD. Preoperative airway assessment: predictive value of a multivariate risk index. Anesth Analg 1996; 82:1197–1204. [DOI] [PubMed] [Google Scholar]
- 4.Rose DK, Cohen MM. The incidence of airway problems depends on the definition used. Can J Anaesth 1996; 43:30–34. doi: 10.1007/BF03015954. [DOI] [PubMed] [Google Scholar]
- 5.Karkouti K, Rose DK, Ferris LE, Wigglesworth DF, Meisami-Fard T, Lee H. Interobserver reliability of ten tests used for predicting difficult tracheal intubation. Can J Anaesth 1996; 43:554–559. doi: 10.1007/BF03011765. [DOI] [PubMed] [Google Scholar]
- 6.Komatsu R, Sengupta P, Wadhwa A, Akça O, Sessler DI, Ezri T, et al. Ultrasound quantification of anterior soft tissue thickness fails to predict difficult laryngoscopy in obese patients. Anaesth Intensive Care 2007; 35:32–37. doi: 10.1177/0310057X0703500104. [DOI] [PubMed] [Google Scholar]
- 7.Ezri T, Gewürtz G, Sessler DI, Medalion B, Szmuk P, Hagberg C, et al. Prediction of difficult laryngoscopy in obese patients by ultrasound quantification of anterior neck soft tissue. Anaesthesia 2003; 58:1111–1114. doi: 10.1046/j.1365-2044.2003.03412.x. [DOI] [PMC free article] [PubMed] [Google Scholar]
- 8.Singh M, Chin KJ, Chan VW, Wong DT, Prasad GA, Yu E. Use of sonography for airway assessment: an observational study. J Ultrasound Med 2010; 29:79–85. doi: 10.7863/jum.2010.29.1.79. [DOI] [PubMed] [Google Scholar]
- 9.Raphael DT, Conard FU. Ultrasound confirmation of endotracheal tube placement. J Clin Ultrasound 1987; 15:459–462. [DOI] [PubMed] [Google Scholar]
- 10.Gupta D, Srirajakalidindi A, Ittiara B, Apple L, Toshniwal G, Haber H. Ultrasono-graphic modification of Cormack Lehane classification for pre-anesthetic airway assessment. Middle East J Anesthesiol 2012; 21:835–842. [PubMed] [Google Scholar]
- 11.Lahav Y, Rosenzweig E, Heyman Z, Doljansky J, Green A, Dagan Y. Tongue base ultrasound: a diagnostic tool for predicting obstructive sleep apnea. Ann Otol Rhinol Laryngol 2009; 118:179–184. doi: 10.1177/000348940911800304. [DOI] [PubMed] [Google Scholar]
- 12.Liu KH, Chu WC, To KW, Ko FW, Tong MW, Chan JW, et al. Sonographic measurement of lateral parapharyngeal wall thickness in patients with obstructive sleep apnea. Sleep 2007; 30:1503–1508. doi: 10.1093/sleep/30.11.1503. [DOI] [PMC free article] [PubMed] [Google Scholar]
- 13.Reddy PB, Punetha P, Chalam KS. Ultrasonography – a viable tool for airway assessment. Indian J Anaesth 2016; 60:807–813. doi: 10.4103/0019-5049.193660. [DOI] [PMC free article] [PubMed] [Google Scholar]
- 14.Gausan RB, Angela TT, Dam-Thuy T, Juan PC. Ultrasound-assisted evaluation of the airway in clinical anesthesia practice: past, present and future. Int J Anesth Pain Med 2015; 1:2. [Google Scholar]
- 15.Adhikari S, Zeger W, Schmier C, Crum T, Craven A, Frrokaj I, et al. Pilot study to determine the utility of point-of-care ultrasound in the assessment of difficult laryngoscopy. Acad Emerg Med 2011; 18:754–758. doi: 10.1111/j.1553-2712.2011.01099.x. [DOI] [PubMed] [Google Scholar]
- 16.Wojtczak JA. Submandibular sonography assessment of hyomental distances and ratio, tongue size, and floor of the mouth musculature using portable sonography. J Ultrasound Med 2012; 31:523–528. doi: 10.7863/jum.2012.31.4.523. [DOI] [PubMed] [Google Scholar]
- 17.Kristensen MS, Teoh WH, Graumann O, Laursen CB. Ultrasonography for clinical decision-making and intervention in airway management: from the mouth to the lungs and pleurae. Insights Imaging 2014; 5:253–279. doi: 10.1007/s13244-014-0309-5. [DOI] [PMC free article] [PubMed] [Google Scholar]
- 18.Stefano FC, Simona C, Vincenzo G, Paolo P, Massimiliano S, Ivana Z, et al. Evaluation of two neck ultrasound measurements as predictors of difficult direct laryngoscopy: a prospective observational study. Eur J Anaesthesiology 2018; 35:605–612. doi: 10.1097/EJA.0000000000000832. [DOI] [PubMed] [Google Scholar]
- 19.Samsoon GL, Young JR. Difficult tracheal intubation: a retrospective study. Anaesthesia 1987; 42:487–490. doi: 10.1111/j.1365-2044.1987.tb04039.x. [DOI] [PubMed] [Google Scholar]
- 20.Apfelbaum JL, Hagberg CA, Caplan RA, Blitt CD, Connis RT, Nickinovich DG, et al. Practice guidelines for management of the difficult airway. Anesthesiology 2013; 118:251–270. doi: 10.1097/ALN.0b013e31827773b2. [DOI] [PubMed] [Google Scholar]
- 21.Prasad A, Yu E, Wong DT, Karkhanis R, Gullane P, Chan VW. Comparison of sonography and computed tomography as imaging tools for assessment of airway structures. J Ultrasound Med 2011; 30:965–972. doi: 10.7863/jum.2011.30.7.965. [DOI] [PubMed] [Google Scholar]
- 22.Wu J, Dong J, Ding Y, Zheng J. Role of anterior neck soft tissue quantifications by ultrasound in predicting difficult laryngoscopy. Med Sci Monit 2014; 20:2343–2350. doi: 10.12659/MSM.891037. [DOI] [PMC free article] [PubMed] [Google Scholar]
- 23.Andruszkiewicz P, Wojtczak J, Sobczyk D, Stach O, Kowalik I. Effectiveness and validity of sonographic upper airway evaluation to predict difficult laryngoscopy. J Ultrasound Med 2016; 35:2243–2252. doi: 10.7863/ultra.15.11098. [DOI] [PubMed] [Google Scholar]
- 24.Wilson ME, Spiegelhalter D, Robertson JA, Lesser P. Predicting difficult intubation. Br J Anaesth 1988; 61:211–216. doi: 10.1093/bja/61.2.211. [DOI] [PubMed] [Google Scholar]
- 25.Naguib M, Scamman FL, O'Sullivan C, Aker J, Ross AF, Kosmach S, et al. Predictive performance of three multivariate difficult tracheal intubation models: a double-blind, case-controlled study. Anesth Analg 2006; 102:818–824. doi: 10.1213/01.ane.0000196507.19771.b2. [DOI] [PubMed] [Google Scholar]
- 26.Prasad A, Singh M, Chan VW. Ultrasound imaging of the airway. Can J Anesth 2009; 56:868–870. doi: 10.1007/s12630-009-9162-2. [DOI] [PubMed] [Google Scholar]