

Abstract
The development of membrane properties, firing patterns, and δ oscillations in neurons of the cat dorsal lateral geniculate nucleus (dLGN) was investigated in vitro during the first 7 postnatal weeks. Compared with adult neurons, the resting membrane potential was more depolarized at postnatal days 1–9 (P1–P9), the input resistance was higher at P1–P7, and action potentials had a higher threshold and a smaller amplitude at P1–P3 and a longer duration at P1–P9. At P1–P3 trains longer than 200 msec were rarely observed, and trains with more than three action potentials were only present in 41% of the neurons, whereas at P1–P7 the normalized slope of the instantaneous frequencies at the first five interspike intervals was smaller than in the adult. A long-lasting (up to 6 sec) afterhyperpolarization followed a short train of action potentials in 88 and 30% of neurons at P1–P3 and P30–P32, respectively, but it was rarely observed in the adult. The low-threshold Ca2+potential could evoke a burst of action potentials since P1. However, at P1–P7 the number of action potentials per burst was smaller (range, one to five), and at P1–P9 their maximum instantaneous frequency was lower (<190 Hz) than in the adult (range, six to eight, and 344 Hz, respectively). No δ oscillations were observed until P17, and their frequency (0.36 Hz) was lower than that in the adult (1.8 Hz). The percentage of neurons displaying δ oscillations and their frequency reached adult values by the end of the seventh postnatal week, i.e., well after the maturation of the membrane properties and firing patterns (second postnatal week). In conclusion, the maturation of the electrophysiological properties of thalamocortical neurons in the cat dLGN is completed later than the retinogeniculate axon segregation (Shatz CJ, 1983), and the immaturity of the oscillatory, and not of the burst-firing, activity is a limiting factor in the development of δ waves (Jouvet-Mounier et al., 1970).
Keywords: development, dorsal lateral geniculate nucleus, cat, membrane properties, oscillations, sleep, vision
During the first few weeks and months of postnatal life thalamocortical (TC) neurons of the cat undergo major changes in their morphological and physiological properties. In particular, neurons of the cat dorsal lateral geniculate nucleus (dLGN) have a small soma (Kalil, 1978) and lack extensive dendrites in the first postnatal week (Mason, 1983), but a rapid increase in dendritic arborization (Mason, 1983) and soma size (Garey et al., 1973; Elgeti et al., 1976; Kalil, 1978; Hickey, 1980) occurs during the first 2–3 and 4 postnatal weeks, respectively. In addition, in the first postnatal weeks kitten dLGN neurons show low spontaneous firing rates, low visual acuity, small amplitude responses to fast stimuli, and weak surround inhibition, all of which reach adult characteristics by the second to third months of life (Adrien and Roffwarg, 1974; Daniels et al., 1978;Ikeda and Tremain, 1978; Berardi and Morrone, 1984; Tootle and Friedlander, 1986, 1989).
However, except from a developmental study on IT, the low voltage-activated Ca2+ current underlying the low-threshold Ca2+ potential (LTS) (Pirchio et al., 1990), no information is available on the postnatal development of the membrane properties of TC neurons in the cat dLGN (but see Guido and Lo, 1995) or on their characteristic firing patterns, i.e., the tonic action potential firing (evoked from membrane potentials positive to −60 mV) and the high-frequency burst firing (evoked by LTSs produced by depolarizing inputs from membrane potentials negative to −65 mV) (Deschênes et al., 1984; Jahnsen and Llinás, 1984;Crunelli et al., 1987a). Notwithstanding, developmental changes in the membrane properties of dLGN neurons have been investigated in the ferret (White and Sur, 1992; Ramoa and McCormick, 1994a). The conclusions of these studies, however, cannot easily be applied to the kitten, because of the different developmental profile of dLGN neurons in these two species (Robinson and Dreher, 1990). Furthermore, the postnatal development of visual responses in ferret dLGN neurons has not been investigated, making it impossible to draw any correlation between the development of membrane properties and of visual responses.
TC neurons also play an important role in the sleep–wake cycle. Developmental studies in the cat have shown that slow-wave sleep and some of its associated rhythms (δ waves) appear during the third postnatal week, and that its relative contribution to the sleep–wake cycle is similar to that in the adult by the sixth postnatal week (Jouvet-Mounier et al., 1970). The δ waves have been suggested to be caused by the synchronization of thalamic δ (pacemaker) oscillations (Steriade et al., 1991, 1993), an activity that is intrinsic to single TC neurons and results from the interplay between IT and Ih (Leresche et al., 1990, 1991; McCormick and Pape, 1990a,b; Soltesz et al., 1991). Whether developmental changes in the properties of thalamic δ oscillations contribute to the late onset of slow-wave sleep in the cat, however, has not been investigated.
In the present study, therefore, we have investigated the development of the membrane properties, action potential firing patterns, and δ oscillations in TC neurons of the cat dLGN during the first 7 weeks of postnatal life. A preliminary report of some of these results has been published (Turner et al., 1993).
MATERIALS AND METHODS
Experiments were performed on slices of the dLGN, prepared from kittens or cats deeply anesthetized by inhalation of halothane (2%; 2:1 O2/N2O) as previously described (Crunelli et al., 1987a,b; Pirchio et al., 1990). Briefly, a wide craniotomy was performed, and the animal was killed by a coronal section made at the level of the inferior colliculi. From a brain tissue block, 400–500 μm slices containing the dLGN were prepared using a Vibroslice (Campden Instruments) and maintained in a storage bath at room temperature with a continuously oxygenated (95% O2, 5% CO2) medium of composition (in mm) NaCl 134, KCl 2, KH2PO4 1.25, CaCl2 2, MgSO4 2, NaHCO3 16, and glucose 10. When required, slices were transferred to an interface-type bath where they were continuously superfused with a warm (35 ± 1°C), oxygenated (95% O2, 5% CO2) medium. Recordings did not commence for at least 30 min after the slices had been transferred from the storage bath.
Experiments on membrane properties and action potential firing patterns were performed using a medium of composition (in mm) NaCl 134, KCl 1.25, KH2PO4 1.25, CaCl22, MgSO4 2, NaHCO3 16, and glucose 10. To compare the postnatal development of δ oscillations with our previous data in the adult cat (Leresche et al., 1991), these experiments were performed in a medium of similar composition as the one described above but with (in mm) 4 CaCl2, 0.5 MgCl2, and 3 KCl. When Co2+ or Cd2+ were added to the perfusion medium, KH2PO4 was omitted, and MgSO4 was replaced with MgCl2. All drugs were added to the perfusion medium at known concentrations. Bicuculline methiodide, tetrodotoxin, atropine, d-tubocurarine, and propranolol were purchased from Sigma (Poole, UK); 6-cyano-7-nitroquinoxaline-2,3-dione (CNQX) anddl-2-amino-5-phosphonovaleric acid (AP5) were from Tocris Neuramin (Bristol, UK). 3-Aminopropyl-(diethoxymethyl)-phosphonic acid (CGP 35348) and phentolamine mesylate were generous gifts from Dr. W. Froestl (Ciba-Geigy, Basel, Switzerland).
Experiments were often run in parallel, with two electrophysiological setups involved in the analysis of either the membrane and action potential firing properties or the δ oscillations. Intracellular glass microelectrodes (GC 120F; Clark Electromedical Instruments, Pangbourne, UK) filled with 1 m potassium acetate (resistance, 50–80 MΩ) were used to perform current-clamp recordings in TC neurons using an Axoclamp 2A (Axon Instruments) amplifier. The criteria used to identify putative interneurons, which were excluded from this study, included the presence of a relatively small inward rectification (Pape and McCormick, 1995), the absence of outward rectification (Williams et al., 1996), and the presence of a relatively small (<8 mV) LTS (Pape and McCormick, 1995; Williams et al., 1996). Data were stored on a DAT Biological tape recorder (Intracel) and later analyzed using PClamp (Axon Instruments) and home-developed software.
Statistical analysis was performed using SigmaStat (Jandel Scientific). If both normality and equivariance assumptions were satisfied, the statistical differences between the mean of the adult (control) group and the means of the kitten groups were assessed with parametric tests, i.e., one-way ANOVA and Dunnett’s test (Zar, 1984), and the mean ± SEM is shown in the scatter plots. If normality and/or equivariance assumptions were not satisfied, the statistical differences between the adult (control) group and kitten groups were tested with nonparametric tests, i.e., Kruskal–Wallis ANOVA on ranks and Dunn’s test (Zar, 1984). In this case, the differences between groups were tested globally, and no comparison between means or medians was performed. Nevertheless, the median of each group has been inserted in the scatter plots to help the visual comparison of data from different groups.
RESULTS
All recorded neurons were located in laminae A and A1 of the dLGN. Impalements of TC neurons from kittens of postnatal days 1–3 (P1–P3) sometimes did not last for more than 5–10 min, or the quality of the voltage recording could be seen to deteriorate spontaneously or after large and/or long-lasting current steps. Extreme care, therefore, was taken in neurons from this age group to limit the amplitude, duration, and number of positive and negative current steps injected through the recording electrode, and data from neurons showing any sign of deterioration were not included in the analysis. Neurons selected for analysis had stable resting membrane potentials and overshooting action potentials and did not show spontaneous action potential firing at resting membrane potential.
Postnatal development of membrane properties and firing patterns
The postnatal development of the membrane properties and firing patterns was studied on 91 and 12 neurons from kitten (P1–P32) and cat dLGN, respectively. For statistical analysis these neurons were divided into six groups, according to their postnatal age: P1–P3 (n = 37), P5–P7 (n = 25), P9 (n = 10), P13–P14 (n = 9), P30–P32 (n = 10), and adult (n = 12). (Note that no neurons were recorded at P4, P8, P10, P11, and P12). To avoid contamination by the LTS, all results (except the resting membrane potential and when stated otherwise) were collected at the most hyperpolarized membrane potential at which a depolarizing current pulse could not evoke an LTS. In our sample of P1–P32 neurons this membrane potential ranged from −56 to −60 mV, in agreement with a previous study showing that the steady-state activation and inactivation properties of IT in cat dLGN neurons do not change during postnatal development (Pirchio et al., 1990).
Resting membrane properties
The resting membrane potential and apparent input resistance of neurons from adult cats were similar to those reported in previousin vitro studies carried out using similar experimental conditions (Crunelli et al., 1987b; Pape and McCormick, 1995). At P1–P3, P5–P7, and P9 the resting membrane potential was significantly more depolarized (about 9 mV) than the one of adult neurons (p < 0.01 at all ages) (Fig.1A).
Fig. 1.

Developmental changes in resting membrane properties. A, B, Scatter plots show age-related changes in resting membrane potential and apparent input resistance, respectively. Small open circles represent raw data.Large open circles and bars represent mean ± SEM. The resting membrane potential at P1–P3, P5–P7, and P9 was significantly more depolarized than in the adult (p < 0.01 for the three ages). The apparent input resistance at P1–P3 and P5–P7 was significantly larger than in the adult (p < 0.01 for both ages).C, Examples of voltage responses to current pulse injection at P2 and in the adult. Note the presence of a depolarizing sag in the adult and in the P2 neurons. The membrane potentials were −54, −56, and −58 mV (left to right).D, Steady state voltage–current relationships calculated from the records illustrated in C. Note the rectification in both depolarized and hyperpolarized directions.
Analysis of the voltage responses evoked by a family of negative current steps showed that the depolarizing sag typical of adult TC neurons could be observed in neurons as young as P2 (Fig.1C). This depolarizing sag, however, was present in only 63% (n = 23) of P1–P3 neurons, and it did not seem to be as large and fast as the one in the adult. Voltage responses evoked by a family of depolarizing current steps indicated the presence of outward rectification in neurons as young as P2 (Fig. 1C). Steady-state voltage–current relationships (measured 10–20 msec before the offset of the current step) confirmed the presence of outward and inward rectification in young dLGN neurons (Fig.1D). The apparent input resistance (calculated from the steepest portion of the voltage–current relationships that included a point through the voltage axis) decreased from 218 ± 14 MΩ (n = 34) at P1–P3 to 147 ± 13 MΩ (n = 9) at P13–P14 (Fig. 1B), a value similar to the one in adult neurons (137 ± 10,n = 12). At P1–P3 and P5–P7 the apparent input resistance was significantly larger than in the adult (p < 0.01 at both ages). Within each age group no significant correlation was found between resting membrane potential and input resistance.
Single action potential properties
The properties of the action potentials were studied using single action potentials evoked in response to relatively small depolarizing current steps injected through the recording electrode, and some representative examples recorded at P2, P6, P9, and in the adult are shown in Figure 2A. Overall, action potentials of younger neurons were smaller in amplitude and longer in duration than older or adult neurons. Changes in threshold and amplitude (measured from threshold) (Fig. 2C,D) occurred from P1–P3 to P5–P7, with the threshold decreasing from −33 ± 1 (n = 21) to −37 ± 1 (n = 16) mV and with the amplitude increasing from 42 ± 1 (n = 22) to 50 ± 2 (n = 16) mV. Both threshold and amplitude were significantly different from those of adult neurons only at P1–P3 (p < 0.01 and 0.01, respectively). Changes in duration (Fig. 2D,E) occurred from P1–P3 to P13–P14, with the duration at threshold decreasing from 2.25 (n = 22) to 1.6 (n= 16) msec (both median values) and the duration at half-amplitude decreasing from about 1.2 (n = 22) to 0.8 (n = 16) msec (both median values). At P1–P3, P5–P7, and P9, the duration (measured at threshold and at half amplitude) was significantly longer than in the adult (p < 0.001, 0.001, and 0.005, respectively). It is important to note that the difference between resting membrane potential and action potential threshold remained relatively unchanged at around 20–25 mV from P1 to adulthood. Within each age group no significant correlation was found between the resting membrane potential and action potential threshold, amplitude, duration at threshold, and duration at half-amplitude or between input resistance and the same action potential parameters.
Fig. 2.

Developmental changes in single action potential properties. A, Examples of typical action potentials at P2, P6, and P9 and in the adult. The voltage recordings were shifted vertically to align the action potential thresholds (dashed lines). Note the progressive, age-related increase in amplitude and the concomitant reduction in duration. B–E, Scatter plots showing age-related changes in threshold, amplitude (measured from threshold), duration at threshold, and duration at half-amplitude, respectively. Small open circles represent raw data.Large open circles and bars represent mean ± SEM. Large diamonds represent median values. Note the large scatter of data on the action potential duration at P1–P9. The threshold and amplitude at P1–P3 were significantly different from the adult (p < 0.01 for both), whereas median values of the duration both at threshold and half-amplitude at P1–P3, P5–P7, and P9 were significantly longer than in the adult (p < 0.001, 0.001, and 0.005, respectively).
Tonic firing properties
To study the properties of tonic action potential firing, trains of action potentials were evoked in response to depolarizing current steps of increasing amplitude. The duration of the pulses ranged from 400 to 1200 msec, although shorter (200–350 msec) and longer (up to 10 sec) durations were sometimes used in P1–P3 neurons and in the adult, respectively. Our findings on the tonic firing can be summarized into three main points.
First, trains of action potentials could be evoked with difficulties in neurons from young kittens (i.e., P1–P9) (Figs. 3, 4). In particular, at P1–P3 trains of more than three action potentials were obtained in only 9 (41%) of 22 neurons, and trains longer than 200 msec were observed in only 2 (9%) of 22 neurons. In addition, an increase in the amplitude of the depolarizing step did not often generate an action potential but a slow depolarizing potential (3–10 mV) that, on a further increase in the size of the step, would then evoke a large action potential (Fig. 3). At P5–P9 trains of longer duration could be evoked, and the firing often consisted of groups of two to five action potentials separated by periods of slow subthreshold oscillation of the membrane potential (Fig. 3). On the contrary, trains of action potentials as long as the depolarizing current steps (up to 10 sec) were present in the majority of neurons from P15 onward and in all adult neurons (n = 9). Note that at all postnatal ages an increase in the amplitude of the depolarizing current step decreased the latency of the first action potential (Fig.4).
Fig. 3.

Lack of long trains of action potentials in young neurons. Examples of voltage responses to depolarizing current pulses (700 msec) in P1 and P2 neurons show the inability of dLGN neurons to evoke long trains of action potentials at this postnatal age. Note the presence of a slow depolarizing potential following the last action potential in most of the records. The membrane potentials for the P1 and P2 neurons were −56 and −58 mV, respectively; thehorizontal dashed lines indicate 0 mV. Voltage response to a depolarizing current step (4 sec) shows the presence of groups of two to five action potentials separated by periods of slow subthreshold oscillation of the membrane potential in a P6 neuron (membrane potential, −41 mV) but not in the adult neuron.
Fig. 4.

Developmental changes in tonic firing properties. Examples of voltage responses to depolarizing current pulses in P2, P6, and adult neurons. The durations of the pulses were 400, 1000, and 1000 msec for the P2, P6, and adult neurons, respectively. Trains of action potentials as long as the duration of the current pulse could not be evoked at P2. The instantaneous firing frequency at the first interspike interval for the P6 and adult neurons was similar in each row. Nevertheless, the duration of the trains in the P6 neuron was always shorter than in the adult. The membrane potentials for the P2, P6, and adult neurons were −55, −58, and −59 mV, respectively. Action potential amplitude has been truncated for clarity.
Second, at all postnatal ages the instantaneous firing frequency in each train was not constant but was highest at the first to third interspike interval (ISI) and then progressively decreased (Figs. 4,5). This decrease in frequency, however, was not similar at all postnatal ages, as it can be seen in Figure5A, where the instantaneous firing frequencies calculated from the tonic firing shown in Figure 4 have been plotted against the ISI rank. In the P1–P3 neurons generating trains of at least three action potentials (n = 14), the highest frequency was always that of the first ISI, with the frequencies of the following ISIs decreasing rapidly. On the contrary, in adult neurons the highest frequency could also occur at the second or third ISI, with the frequency of the following ISIs decreasing less rapidly than in kitten neurons. In addition, spike frequency adaptation always occurred in neurons from adult cats, generally starting from the 10th–15th ISIs (Fig. 5A).
Fig. 5.

Developmental changes of the frequency of tonic firing. A, Plots of instantaneous firing frequency versus ISI rank obtained from the voltage recordings shown in Figure 4. Note the steep decrease in the frequency with increasing ISI rank at P2 and P6 and the spike–frequency adaptation in the adult.B, Plots of instantaneous firing frequency versus injected current for the same neurons as in Figure4A. In the two kitten neurons, but not in the adult, the slopes of the linear relationships of the second to fifth ISIs were less steep than that at the first ISI. C, Plots of instantaneous firing frequency at the first ISI versus injected current for some P1–P3 (open circles) and adult (filled circles) neurons. Note the similar range of the current pulse amplitudes and the instantaneous firing frequencies obtained. D, Plots showing age-related changes in the normalized slopes (Slope ratio). Each point represents the mean ± SEM (error bars) of six, nine, three, four, four, and nine neurons at P1–P3, P5–P7, P9, P13–P14, P30–P32, and the adult, respectively. At P1–P3 and P5–P7 the normalized slopes were generally <1 and smaller than in the adult. At P1–P3 the normalized slopes of the second, third, and fourth ISIs were significantly smaller than in the adult (p < 0.01, 0.05, and 0.05, respectively). At P5–P7 the normalized slopes of the third, fourth, and fifth ISIs were significantly smaller than in the adult (p < 0.05, 0.05, and 0.01, respectively). At P9 the normalized slopes of the fifth ISI were significantly smaller than in the adult (p < 0.05).
Third, at all postnatal ages the instantaneous firing frequency at each ISI was found to increase by increasing the amplitude of the depolarizing current step (Fig. 4). This can be appreciated better in Figure 5B, where the instantaneous firing frequencies (calculated from the data in Fig. 4) can be seen to be linearly related to the amplitude of the depolarizing current step. Furthermore, no significant difference in the slopes of the linear relationships of the first to fifth ISIs was found between young and adult neurons (see Fig.5C for the first ISI for P1–P3 vs adult neurons). However, within each of the younger groups (i.e., P1–P3, P5–P7, and P9) we observed that the slopes of the linear relationships of the second to fifth ISIs were less steep than that of the first ISI (Fig.5B). To quantify this difference, for each neuron the slopes of the linear relationships of the second to fifth ISIs were normalized to the slope of the first ISI. The normalized slopes were then averaged for each age group, and the averaged slopes were plotted against age (Fig. 5D). In younger neurons the normalized slopes were usually smaller than 1, i.e., the slopes of the second to fifth ISIs were smaller than that of the first ISI. In particular, at P1–P3 the normalized slopes of the second, third and fourth ISIs were significantly smaller than those of the adult (p< 0.01, 0.05, and 0.05, respectively). At P5–P7 the normalized slopes of the third, fourth, and fifth ISIs were significantly smaller than those of the adult (p < 0.05, 0.05, and 0.01, respectively), and at P9 only the normalized slope of the fifth ISI was significantly smaller than that of the adult (p< 0.05).
Burst firing properties
The properties of the LTS-evoked bursts of action potentials were studied by producing LTS at the break of hyperpolarizing current steps of increasing amplitude. A burst of action potentials, superimposed on an LTS, could be evoked since P1 (Fig. 6). In a number of neurons (n = 7 of 30 at P1–P3; n = 2 of 17 at P5–P7), however, the second and third action potentials in the burst could often be much smaller in amplitude than the first (Fig.6), even when tonic firing of up to three action potentials, all of similar amplitude, could be evoked in the same neurons (Fig. 3). Indeed, by increasing the size of the preceding hyperpolarizing current pulses, the amplitude of the LTS increased, but no additional action potential was evoked in the burst, whereas the amplitude of the second action potential would decrease by up to 80% (Fig. 6).
Fig. 6.

Lack of strong burst firing in young neurons. Examples of voltage recordings obtained at the break of hyperpolarizing current steps in P1 and P2 neurons (same neurons for which tonic firing is shown in Fig. 3). The durations of the current steps were 700 and 1000 msec for the P1 and P2 neurons, respectively. Note how by increasing the size of the preceding hyperpolarizing pulse the amplitude of the second and third action potentials in the burst is markedly reduced. Horizontal dashed lines indicate 0 mV.
At all postnatal ages an increase in the amplitude of the hyperpolarizing current step resulted in a decrease of the latency of the first action potential and in an increase of the number of action potentials per burst. The maximum number of action potentials per burst, however, increased with increasing postnatal age (Figs.7, 8B) and at P1–P3 and P5–P7 was significantly smaller than in the adult (p < 0.001 at both ages).
Fig. 7.

Developmental changes in burst firing properties. Examples of voltage recordings obtained at the break of hyperpolarizing current steps (800 msec duration) in P6, P9, and adult neurons. In each neuron, by increasing the amplitude of the hyperpolarizing current pulse both the number of action potentials per burst and the firing frequencies increased. However, more action potentials per burst and higher frequencies could be obtained in the adult than in the P2 and P9 neurons. Action potential amplitude has been truncated for clarity.
Fig. 8.

Developmental changes in the number and frequency of action potentials in a burst. A, Plots of instantaneous firing frequency versus amplitude of the preceding voltage deviation calculated from the same neurons as in Figure 7. Each point is the mean of one to eight measurements. B, Scatter plot showing age-related changes in the maximum number of action potentials per burst. Small open circlesrepresent raw data. Large diamonds represent median values. The maximum number of action potentials per burst at P1–P3 and P5–P7 was significantly smaller than in the adult (p < 0.001 for both ages).C, Plots showing age-related changes in maximum instantaneous firing frequency. Each point represents mean ± SEM (error bars) for 20, 14, 7, 6, 8, and 10 neurons at P1–P3, P5–P7, P9, P13–P14, P30–P32, and the adult, respectively. Maximum instantaneous firing frequencies at P1–P3, P5–P7, and P9 were significantly smaller than in the adult (p < 0.01 for all).
At all postnatal ages the instantaneous firing frequency at each ISI was found to increase by increasing the amplitude of the hyperpolarizing current step (Fig. 7). This can be appreciated better in Figure 8A, where the instantaneous firing frequencies calculated from the burst firing shown in Figure 7 have been plotted against the amplitude of the voltage deviations produced by the negative current steps. Small increases in the voltage deviation resulted in large increases in the instantaneous firing frequencies of each ISI, until a maximum frequency was reached. As shown in Figure 8C, however, the maximum instantaneous firing frequency at P1–P3, P5–P7, and P9 was significantly smaller than in the adult (p < 0.01 for all frequencies at all ages). For instance, the maximum frequency at the first ISI increased from 160 ± 14 Hz in P1–P3 neurons to 344 ± 18 Hz in adult neurons.
Long-lasting afterhyperpolarization
In young neurons a long-lasting afterhyperpolarization (AHP) was often observed after a short train of action potentials (Fig.9A). This AHP was dependent on the amplitude (Fig. 9C) and duration (Fig. 9D) of the preceding depolarizing current step, could reach a duration of up to 6 sec and an amplitude of up to 25 mV, and was sensitive to tetrodotoxin (n = 4) and insensitive to excitatory and inhibitory amino acid antagonists (see Materials and Methods) (n = 8). The percentage of neurons exhibiting the long-lasting AHP decreased with increasing postnatal age (Fig. 9B); at P1–P9 the long-lasting AHP was observed in 34 of 39 neurons but in only 1 of 12 adult neurons. In the other adult neurons a long-lasting AHP could not be observed even after a very long train of action potentials. It was not possible to measure the reversal potential of the long-lasting AHP, because the amplitude of the AHP progressively increased when measured from holding potentials between −75 and −90 mV (Fig. 9E), probably because of a contamination by Ih at these membrane potentials (cf. McCormick and Pape, 1990a; Soltesz et al., 1991). Indeed, application of Cs+ (2 mm) (n = 2, P1 and P3), which is known to block Ih in thalamic neurons (McCormick and Pape, 1990a; Soltesz et al., 1991), had no effect on the AHP at membrane potentials positive to −60 mV but reduced its amplitude (44 and 57%) and duration at more negative potentials. The amplitude of the long-lasting AHP was also decreased by addition of Cd2+ (64%, n = 1, P9) or Co2+ (54 and 85%, n = 2, both P7) to the perfusion medium.
Fig. 9.

A long-lasting AHP is present in young neurons.A, Examples of voltage recordings showing the presence of a long-lasting AHP at P3 after only one to three action potentials and its absence in the adult even after 12 action potentials. Membrane potential was −58 mV for both neurons. B, Plot showing age-related changes in the percentage of neurons exhibiting the long-lasting AHP. The numbers of neurons tested were 7, 23, 22, 4, 7, and 12 at P1–P3, P5–P7, P9, P13–P14, P30–P32, and the adult, respectively. C, D, Examples of voltage recordings from P5 and P7 neurons, respectively, show that an increase in the amplitude or the duration, respectively, of the depolarizing current pulse resulted in an increase of both the duration and the amplitude of the long-lasting AHP. E, Examples of voltage recordings from a P9 neuron show the voltage dependence of the long-lasting AHP. Action potential amplitude has been truncated for clarity.
Postnatal development of δ oscillations
The postnatal development of δ (or pacemaker) oscillations was investigated on a total of 142 dLGN neurons from P2 to P49 kittens perfused with a different medium than the one used to study the membrane properties and firing patterns (see Materials and Methods). In each of these neurons the voltage range between −40 and −80 mV was carefully examined before drawing any conclusion on the presence or properties of any oscillatory activity. According to the pattern of spontaneous oscillations observed, these 142 neurons were then classified as neurons displaying: (1) δ oscillations (n = 20), (2) intermittent δ oscillations (n = 17), (3) irregular oscillations (n= 25), and (4) no oscillations (n = 80).
Neurons displaying δ oscillations
This group includes neurons capable of producing δ oscillations (Fig. 10C) with properties similar to those described previously (Leresche et al., 1990, 1991;McCormick and Pape, 1990a,b; Soltesz et al., 1991). Briefly, δ oscillations were voltage-dependent, were only observed in the range of membrane potentials between −60 and −80 mV, and occurred for as long as the intracellular recording lasted. The frequency of the δ oscillations was very regular in a given neuron, except for the characteristic, relatively small increase in frequency that was present at the upper limit of the voltage region of existence, a finding similar to previously reported observations in the adult (cf. Leresche et al., 1991; Antal et al., 1996). This result can be better appreciated in Figure 10C1,C2, where the δ oscillation recorded in the same neuron at the upper and lower limits of its region of existence is shown together with the corresponding frequency histograms.
Fig. 10.
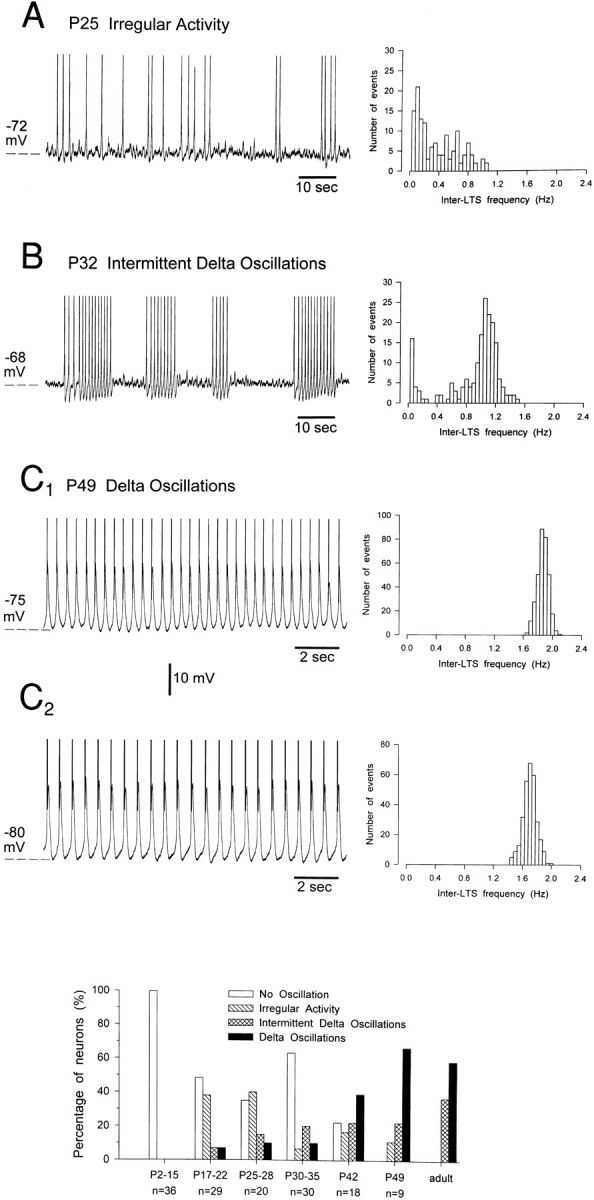
Postnatal development of intrinsic oscillations in dLGN neurons. A–C, Voltage recordings show the three main types of intrinsic oscillatory activity that were distinguished in kitten dLGN neurons. The histogram on theright side of each recording shows the corresponding distribution of inter-LTS frequency: note the presence of two clear peaks in B (see text for further details). Records inC1 and C2 were obtained in the same neuron at the upper and lower limits of the voltage region of existence of the δ oscillations, respectively, and show the extent of their frequency change within a neuron. D, Age-related distribution of the intrinsic oscillatory activity. Data for the adult have been taken from experiments performed under similar conditions (Leresche et al., 1991). Note that at P42–P49 the percentage of neurons displaying intermittent δ oscillations or δ oscillations is similar to the one in the adult.
Neurons displaying intermittent δ oscillations
These neurons displayed δ oscillations with properties similar to those of the previous group, except that they occurred in discrete periods separated by periods when the neuron was silent (Fig.10B; cf. spindle-like oscillations in Leresche et al., 1991). The intermittent δ oscillation is intrinsic to TC neurons (Leresche et al., 1991) and possess a “waxing and waning” of the membrane potential similar to the sleep spindles, which are, however, synaptically generated (Steriade et al., 1993). The frequency histogram of the intermittent δ oscillation had two peaks (Fig.10B); the one on the right is the peak of the inter-LTS frequency during the period of activity, whereas the one on the left is the peak of the inter-LTS frequency between the last LTS of each period of activity and the first LTS of the next period of activity.
Neurons displaying irregular oscillations
These neurons could generate spontaneous LTSs only for discrete periods and not at a constant frequency (Fig. 10A). In these neurons, therefore, the inter-LTS intervals were randomly distributed (Fig. 10A).
Neurons displaying no oscillations
Some of these neurons (n = 17) were silent for most of the recording period, although groups of one to three LTSs could sometimes be observed. The other neurons (n = 63) never showed a spontaneous LTS, although these potentials could be evoked easily, for instance, at the end of negative current steps.
The δ and intermittent δ oscillations were insensitive to tetrodotoxin (n = 7 and 4, respectively) and to blockade of NMDA (n = 10 and 10), non-NMDA (n = 10 and 10), GABAA (n = 10 and 10), GABAB (n = 10 and 10), and cholinergic receptors (n = 5 and 3), as well as of α- and β-adrenoceptors (n = 5 and 3) by 100 μm AP5, 20 μm CNQX, 50 μmbicuculline, 300 μm CGP 35348, 50 μmatropine, 100 μm tubocurarine, 50 μmphentolamine, and 100 μm propranolol, respectively.
The postnatal age distribution profile of the neurons showing these four types of spontaneous oscillations is shown in Figure10D. At P2–P15 only neurons displaying no oscillations were found, whereas irregular oscillations, intermittent δ oscillations, and δ oscillations appeared for the first time in neurons of P17, P20, and P17, respectively. During the subsequent weeks, although the percentages of neurons displaying no oscillations or irregular oscillations decreased, the percentage of neurons displaying intermittent δ oscillations or δ oscillations increased, until at P42–P49 percentages similar to those observed in the adult dLGN under the same experimental conditions (Leresche et al., 1991) were found.
The frequency of δ oscillations, calculated from cumulative frequency plots, was lower in young than in adult neurons. Comparison of the δ oscillations from the three neurons of different age shown in Figure11 shows that the lowest frequency is present in the P17 neuron, and the highest is in the P49 neuron. Indeed, a significant correlation (r = 0.932; p < 0.0001;n = 20) was found between the postnatal age and the frequency of the δ oscillations that increased from 0.36 Hz at P17 to 1.64 Hz at P49 (Fig. 11D). The frequency at P49, therefore, is similar to the frequency of δ oscillations (1.8 ± 0.3 Hz) of adult cat dLGN neurons recorded under the same experimental conditions (Leresche et al., 1991). Moreover, at any postnatal age the frequency of δ oscillations was similar to the frequency of the oscillations in neurons displaying intermittent δ activity. Note that all the frequency measurements were performed at the lower voltage limit of existence of the various oscillatory activities.
Fig. 11.

Developmental changes in the properties of δ oscillations. A–C, Examples of voltage recordings (top), distribution of inter-LTS intervals (bottom left) and inter-LTSs cumulative curves (bottom right) show the increase in the frequency of δ oscillations from P17 to P49. Note the absence of overlap between the histograms obtained at the three postnatal ages. D, Age-related changes in the frequency of δ oscillations. At P17 the frequency of δ oscillations is lower than in the adult and reaches values similar to those in the adult at P42–P49. The single point for the adult is the mean frequency of the δ oscillation recorded under similar conditions (Leresche et al., 1991).
Spontaneous synaptic activity
In some of the very young neurons recorded to study the postnatal development of the membrane properties, spontaneous hyperpolarizing potentials (2–15 mV in amplitude) (n = 5 at P1–P3; n = 9 at P5–P7) were observed as single events (n = 4; Fig.12A) or in bursts (n= 10; Fig. 12B). These spontaneous hyperpolarizing potentials were abolished by addition of 50 μmbicuculline to the perfusion medium (Fig. 12A) and reversed in polarity at around −70 mV (n = 4), indicating that they were spontaneous GABAAreceptor-mediated IPSPs. Spontaneous EPSPs were not observed.
Fig. 12.

Spontaneous synaptic activity in kitten dLGN neurons. A, Voltage recordings show the presence of spontaneous hyperpolarizing potentials in a P3 neuron. These potentials were blocked by application of 50 μm bicuculline to the perfusion medium. B, Voltage recording from another P3 neuron shows the presence of a burst (4 Hz) of inhibitory postsynaptic potentials, similar in waveform but not in frequency to the sleep spindles (Steriade et al., 1993). Membrane potential was −55 mV inA and B.
DISCUSSION
The main findings of this investigation are: (1) the membrane properties of kitten dLGN neurons progressively mature, reaching values similar to those in the adult before P13–P14, except the long-lasting AHP, which is still present at P30–P32 in about 30% of the neurons; (2) δ oscillations appear at P17, and the percentage of neurons showing this intrinsic activity is similar to the one in the adult by P42–P49. Overall, therefore, the membrane properties mature about 2–5 weeks earlier than the oscillatory activities.
Postnatal development of membrane properties
In kitten dLGN neurons the resting membrane potential was more depolarized, the apparent input resistance was larger, and single action potentials had a higher threshold, smaller amplitude, and longer duration than those in adult neurons. Significant differences between young and adult neurons were found at P1–P3 for the single action potential threshold and amplitude, at P1–P7 for the apparent input resistance, and at P1–P9 for the resting membrane potential and the single action potential duration. A similar developmental profile has been observed in the ferret dLGN in vitro during P7–P33 (White and Sur, 1992) and during P0–P34 (Ramoa and McCormick, 1994a). Outward and inward rectification were present in the voltage–current relationships of TC neurons as young as P2 and seemed to be qualitatively well developed.
After a train of action potentials a long-lasting AHP was observed at P1–P32 and rarely in the adult. A similar AHP has not been observed in ferret dLGN and rat ventrobasal thalamic neurons in vitroduring the first postnatal weeks (White and Sur, 1992; Ramoa and McCormick, 1994a; Velazquez and Carlen, 1996) but is present in rat cortical pyramidal neurons in vitro during P1–P36 (McCormick and Prince, 1987).
Trains of action potentials could be obtained at all postnatal ages. However, at P1–P3 trains longer than 200 msec were rarely observed, and trains with more than three action potentials were present in only 41% of the neurons, whereas at P1–P7 the instantaneous firing frequency during the first five ISIs decreased more quickly than in the adult. These data, therefore, indicate some inability of young neurons to sustain relatively long periods of tonic firing and the presence of a different discharge pattern between young and adult neurons, despite a similarity in the instantaneous firing frequency of the first two action potentials in a train.
Such differences in tonic firing properties have not been found in ferret dLGN neurons in vitro during the first weeks of postnatal life (White and Sur, 1992; Ramoa and McCormick, 1994a). It is reasonable to argue that this inability of kitten dLGN neurons to sustain repetitive firing, in particular at the youngest ages, is related to the presence of a long-lasting AHP, which was present after only one or two action potentials. On the basis of these results on the repetitive firing properties and the long-lasting AHP, we would expect kitten dLGN neurons in vivo to be unable to generate long trains of action potentials at high frequencies during the first 2 weeks of postnatal age, both spontaneously and in response to visual stimulation. Indeed, kitten dLGN neurons in vivo show very low spontaneous firing rates and low amplitude responses to flashing spots at P6–P13 (Daniels et al., 1978). At a very young age, therefore, the immaturity of the intrinsic membrane properties of dLGN neurons strongly contributes to the immaturity of their spontaneous firing and visual responses.
LTSs with a burst of action potentials could be evoked at all postnatal ages. At P1–P7, however, the number of action potentials per burst was smaller than in the adult, and at P1–P9 their instantaneous firing frequency was lower than the one in the adult. A similar increase in the number of action potentials per burst has been observed in ferret dLGN neurons in vitro during the first weeks of postnatal life (Ramoa and McCormick, 1994a). The reasons for this immaturity, however, seem to be different between ferret and kitten dLGN neurons. In the ferret dLGN, in fact, the maturation of the burst firing properties is accompanied both by a maturation of the single action potential properties and by a threefold to fourfold increase in the maximum amplitude of the LTS (Ramoa and McCormick, 1994a). In the kitten dLGN, instead, the maturation of the burst firing properties during P1–P9 is accompanied by the maturation of single action potential properties and a decrease in the long-lasting AHP, but there is no change in the LTS amplitude from P4 to adult neurons (Pirchio et al., 1990). Nevertheless, because no data are available on the developmental changes in LTS amplitude in cat dLGN neurons before P4, the possibility that the differences observed in burst firing properties between P1–P3 and adult neurons could also depend on differences in LTS amplitude cannot be ruled out. It is also important to point out that the correlation between LTS amplitude and number of action potentials per burst is not a simple one. In fact, although an increase in the amplitude of the preceding hyperpolarizing step resulted, as expected, in an increase of the LTS amplitude, in 19% of P1–P7 neurons this increase in LTS amplitude was not accompanied by an increase in the number of action potentials per burst, and the amplitude of the second and third action potentials in the burst was reduced, often markedly. During the first postnatal week, therefore, the degree of immaturity in the burst firing properties can be overestimated when studied with negative current pulses of relatively large amplitude or long duration.
The threefold increase in the amplitude of IT observed in kitten dLGN neurons from P4–P7 to P80–P100 (Pirchio et al., 1990) has been suggested to be simply attributable to the twofold increase in soma size of cat LGN neurons occurring during the same postnatal period (Garey et al., 1973; Elgeti et al., 1976; Kalil, 1978; Hickey, 1980;Mason, 1983; Friedlander, 1984), without a change in channel density. The present results indirectly support this suggestion. Indeed, although the amplitude of IT doubles from P10–P13 to P80–P100 (Pirchio et al., 1990), this increase in amplitude does not correspond to any apparent changes in burst firing properties, which are already similar to those in the adult by P13–P14.
Postnatal development of oscillatory activities
The δ oscillations were first observed at P17 in only a few dLGN neurons and with a lower frequency than those in the adult. Both the percentage of neurons displaying these oscillations and their frequency reached values similar to those in the adult by P42–P49. Thus, the time course of the maturation of the membrane properties and δ oscillations is different, with the membrane properties maturing by P13–P14.
It is unlikely that neurons younger than P42–P49 cannot oscillate or oscillate at a lower frequency than those in the adult, because of a greater damage produced by the microelectrode impalement (Staley et al., 1992), because, if true, this would have also affected the other membrane properties. Instead, all other membrane properties except the long-lasting AHP were already similar to those of adult neurons by P13–P14. Alternatively, the inability of young TC neurons to produce δ oscillations might be attributable to an immaturity of IT and/or Ih (McCormick and Pape, 1990a,b;Soltesz et al., 1991). The amplitude of IT is significantly smaller at P4–P41 than at P80–P100, but its other steady state and kinetics properties are already mature by P4 (Pirchio et al., 1990), and the burst firing properties become similar to those in the adult by P13–P14. Thus, the possibility that the immaturity of δ oscillations between P17 and P49 could depend on an immaturity of IT is also unlikely. The presence of inward rectification in the voltage–current relationship of P1–P2 neurons indirectly suggests the presence of Ih, but cannot provide information on its steady state or kinetics properties. Thus, in the absence of any developmental study on Ih the possibility remains that a mismatch between the development of Ih and that of IT might be responsible for the late appearance of δ oscillations. Last, it is possible that kitten dLGN neurons were prevented from oscillating by the long-lasting AHP that might have forced a return of the membrane potential too slow for ITactivation. Indeed, the disappearance of the long-lasting AHP occurs close to the postnatal age when the percentage of neurons displaying δ oscillations is reaching a value similar to that in the adult. In addition, the slower frequency of δ oscillations in P17–P33 neurons might also be related to the long-lasting AHP that is present at this developmental stage.
In dLGN neurons there is a progressive appearance (from P12 to P31) of high-frequency burst firing during slow-wave sleep but not during the awake state (Adrien and Roffwarg, 1974). Our data are in agreement with this result and indicate that the appearance of high-frequency bursts in slow-wave sleep during the period P12–P31 is not attributable to a maturation of the burst firing properties, which are already mature by P13–P14, but rather to a maturation of the oscillatory properties, which mature later from P17 to P42. It is also interesting to note that the developmental profile of δ oscillations is superimposable to that of slow-wave sleep, which has been shown to appear in the kitten at P15–P21 and to reach a structure similar to the one in the adult by the sixth postnatal week (Jouvet-Mounier et al., 1970). This suggests that the immaturity of oscillatory properties of dLGN neurons is a limiting factor in the development of δ waves.
Spontaneous synaptic activity
Although this study focused on the development of membrane properties and δ oscillations in dLGN neurons, we believed it was important to report that spontaneous GABAAreceptor-mediated IPSPs were observed as early as P1. The presence of IPSPs at such an early postnatal age is in agreement with previous electrophysiological and anatomical investigations. In fact: (1) optic tract-evoked inhibitory interactions between cat dLGN neurons in vitro have been detected 6 d before birth (Shatz and Kirkwood, 1984); (2) medial thalamus-evoked IPSPs have been recorded from P1–P3 cat thalamic neurons in vivo (Thatcher and Purpura, 1973); (3) optic tract-evoked IPSPs have been observed as early as P7–P9 (White and Sur, 1992) in ferret dLGN neurons in vitro (but see Ramoa and McCormick, 1994b); and (4) GABAA receptor-mediated currents have been recorded at P5 in rat somatosensory thalamic neurons (Oh et al., 1995). Furthermore, glutamic acid decarboxylase (Shotwell et al., 1986) and GABA (Kalil et al., 1985) immunoreactivity has been observed in the cat dLGN at embryonic day 49 and by the first postnatal week, respectively.
The role and possibly the site of origin of the GABAAreceptor-mediated IPSPs observed in this study during the first postnatal week must certainly be different from those that mediate visual inhibition later in development, because the response of cat dLGN neurons is virtually unaffected by bicuculline at P25–P32 (Berardi and Morrone, 1984), and their receptive field surround inhibition is still immature at 4–5 weeks of postnatal life (Tootle and Friedlander, 1986). Indeed, a trophic role for GABA in early developmental stages has been suggested by several authors (Wollf et al., 1984; Lauder et al., 1986; LoTurco et al., 1991).
Physiological implications
The anatomical and morphological maturation of the visual pathways of macaques, cats, ferrets, hamsters, rabbits, rats, and mice occurs according a common timetable when expressed with respect to the cecal period, i.e., the interval between conception and eye opening (for discussion, see Robinson and Dreher, 1990). Do the physiological properties of the visual centers of cat and ferret also develop according to a common timetable when the time of eye opening (P7 and P31.5 in cat and ferret, respectively) is taken into account? Because statistical analysis has been used in the cat (this study) but not in the ferret (White and Sur, 1992; Ramoa and McCormick, 1994a) to determine the oldest postnatal age at which significant differences with respect to the adult are present, a quantitative comparison between the development in the two species cannot be made. It is reasonable to suggest, however, that the resting membrane potential, the apparent input resistance, the single action potential properties, and the burst firing properties mature ∼1 week earlier in cat than in ferret, whereas the tonic firing matures at least 9 d earlier in ferret than in cat dLGN neurons. Instead, if the time of eye opening is taken as a reference, the electrophysiological properties in the ferret are mature approximately 2 weeks before the time of eye opening (White and Sur, 1992; Ramoa and McCormick, 1994a), whereas in the cat they are similar to the adult at, or 1 week later than, the time of eye opening (this study). The different developmental profile of the electrophysiological properties of cat and ferret dLGN neurons, therefore, remains even when the time of eye opening is taken into account.
The maturation of the membrane properties and firing patterns of dLGN neurons occurs between P5–P7 and P13–P14 and does not seem, therefore, to be the limiting factor for the development of their morphological structure and synaptic arrangements (Garey et al., 1973;Cragg, 1975; Elgeti et al., 1976; Kalil, 1978; Hickey, 1980; Winfield and Powell, 1980; Winfield et al., 1980; Mason, 1983; Friedlander, 1984) or of their response to visual stimuli (Adrien and Roffwarg, 1974; Daniels et al., 1978; Ikeda and Tremain, 1978; Berardi and Morrone, 1984; Tootle and Friedlander, 1986, 1989), all of which take place much later. Moreover, the segregation of dLGN axons into alternating monocularly innervated patches in the visual cortex (Hubel and Wiesel, 1963; Shatz et al., 1977; Shatz and Stryker, 1978) is not apparent before P15 and is complete by P92 (LeVay et al., 1978). Thus, the maturation of the membrane properties and firing patterns of cat dLGN neurons precedes the eye-specific segregation of geniculate axons in the visual cortex (this study), as the time course of the maturation of the electrophysiological properties of cat retinal ganglion cells precedes, or is partly superimposed on, the eye-specific segregation of retinal axons in the dLGN (Skaliora et al., 1993; Skaliora et al., 1995). It is also worth noting that the eye-specific segregation of retinal axons in the dLGN is already complete at birth (Shatz, 1983), i.e., when the membrane properties and firing patterns of dLGN neurons are still immature. Thus, the maturity of the electrophysiological properties of dLGN neurons, that is of neurons postsynaptic to the retinogeniculate synapse, is not a prerequisite for normal retinogeniculate axon segregation.
Footnotes
This work was supported by Wellcome Trust Grant 37089 and Consiglio Nazionale delle Ricerche Bilateral Project Award 92.01074.CT04. M.P. acknowledges partial support from the Accademia Nazionale dei Lincei and the Royal Society. S.R.W. was supported by a Wellcome Prize studentship. We thank Tim Gould for help with experiments and Bob Jones for photography.
Correspondence should be addressed to Dr. Vincenzo Crunelli, Physiology Unit, School of Molecular and Medical Biosciences, University of Wales Cardiff, Museum Avenue, Cardiff CF1 1SS, UK.
Dr. Turner’s Present address: Department of Visual Science, Institute of Ophthalmology, London EC1V 9EV, UK.
Dr. Williams’s Present address: Department of Neurology, UCLA School of Medicine, UCLA, Los Angeles, CA 90095-1769.
Dr. Asprodini’s Present address: Department of Pharmacology, University of Thessaly, Larisa, Greece.
REFERENCES
- 1.Adrien J, Roffwarg HP. The development of unit activity in the lateral geniculate nucleus of the kitten. Exp Neurol. 1974;43:261–275. doi: 10.1016/0014-4886(74)90145-9. [DOI] [PubMed] [Google Scholar]
- 2.Antal K, Emri ZS, Tóth TI, Crunelli V. Model of a thalamocortical neurone with dendritic voltage-gated ion channels. NeuroReport. 1996;7:2655–2658. doi: 10.1097/00001756-199611040-00049. [DOI] [PubMed] [Google Scholar]
- 3.Berardi N, Morrone MC (1984) Development of γ-aminobutyric acid mediated inhibition of X cells of the cat lateral geniculate nucleus. J Physiol (Lond.) 357:525–537. [DOI] [PMC free article] [PubMed]
- 4.Cragg BG. The development of synapses in the visual system of the cat. J Comp Neurol. 1975;160:147–166. doi: 10.1002/cne.901600202. [DOI] [PubMed] [Google Scholar]
- 5.Crunelli V, Leresche N, Hynd JW, Patel NM, Parnavelas JG. An in vitro slice preparation of the cat lateral geniculate nucleus. J Neurosci Methods. 1987a;20:211–219. doi: 10.1016/0165-0270(87)90053-7. [DOI] [PubMed] [Google Scholar]
- 6.Crunelli V, Leresche N, Parnavelas JG (1987b) Membrane properties of morphologically identified X and Y cells in the lateral geniculate nucleus of the cat in vitro. J Physiol (Lond.) 390:243–256. [DOI] [PMC free article] [PubMed]
- 7.Daniels JD, Pettigrew JD, Norman JL. Development of single-neuron responses in kitten’s lateral geniculate nucleus. J Neurophysiol. 1978;41:1373–1393. doi: 10.1152/jn.1978.41.6.1373. [DOI] [PubMed] [Google Scholar]
- 8.Deschênes M, Paradis M, Roy JP, Steriade M. Electrophysiology of neurons of lateral thalamic nuclei in cat: resting properties and burst discharges. J Neurophysiol. 1984;51:1196–1219. doi: 10.1152/jn.1984.51.6.1196. [DOI] [PubMed] [Google Scholar]
- 9.Elgeti H, Elgeti R, Fleischhauer K. Postnatal growth of the lateral geniculate nucleus of the cat. Anat Embryol (Berl) 1976;149:1–13. doi: 10.1007/BF00315081. [DOI] [PubMed] [Google Scholar]
- 10.Friedlander MJ. The postnatal development of the kitten dorsal lateral geniculate nucleus. In: Stone J, editor. Development of visual pathways in mammals. Alan R Liss; New York: 1984. pp. 155–173. [Google Scholar]
- 11.Garey LJ, Fisken RA, Powell TPS. Observations on the growth of cell in the lateral geniculate nucleus of the cat. Brain Res. 1973;52:359–362. doi: 10.1016/0006-8993(73)90671-9. [DOI] [PubMed] [Google Scholar]
- 12.Guido W, Lo F-S. Membrane properties and synaptic responses of mature, immature, and visually-deprived LGN cells. Soc Neurosci Abstr. 1995;21:1306. [Google Scholar]
- 13.Hickey TL. Development of the dorsal lateral geniculate nucleus in normal and visually deprived cats. J Comp Neurol. 1980;189:467–481. doi: 10.1002/cne.901890304. [DOI] [PubMed] [Google Scholar]
- 14.Hubel DH, Wiesel TN. Shape and arrangement of columns in cat’s striate cortex. J Physiol (Lond) 1963;165:559–568. doi: 10.1113/jphysiol.1963.sp007079. [DOI] [PMC free article] [PubMed] [Google Scholar]
- 15.Ikeda H, Tremain KE. The development of spatial resolving power of lateral geniculate neurones in kittens. Exp Brain Res. 1978;31:193–206. doi: 10.1007/BF00237599. [DOI] [PubMed] [Google Scholar]
- 16.Jahnsen H, Llinás R. Electrophysiological properties of guinea-pig thalamic neurones: an in vitro study. J Physiol (Lond) 1984a;349:205–226. doi: 10.1113/jphysiol.1984.sp015153. [DOI] [PMC free article] [PubMed] [Google Scholar]
- 17.Jouvet-Mounier D, Astic L, Lacote D. Ontogenesis of the states of sleep in rat, cat, and guinea pig during the first postnatal month. Dev Psychobiol. 1970;2:216–239. doi: 10.1002/dev.420020407. [DOI] [PubMed] [Google Scholar]
- 18.Kalil R. Development of the dorsal lateral geniculate nucleus in the cat. J Comp Neurol. 1978;182:265–292. doi: 10.1002/cne.901820206. [DOI] [PubMed] [Google Scholar]
- 19.Kalil RE, Wenthold RJ, Zempel J. Postnatal development of neurons with GABA immunoreactivity in the lateral geniculate nucleus (LGN) and visual cortex of the cat. Soc Neurosci Abstr. 1985;11:806. [Google Scholar]
- 20.Lauder JM, Han VKM, Henderson P, Verdoorn T, Towle AC. Prenatal ontogeny of the GABAergic system in the rat brain: an immunocytochemical study. Neuroscience. 1986;19:465–493. doi: 10.1016/0306-4522(86)90275-7. [DOI] [PubMed] [Google Scholar]
- 21.Leresche N, Jassik-Gerschenfeld D, Haby M, Soltesz I, Crunelli V. Pacemaker-like and other types of spontaneous membrane potential oscillations of thalamocortical cells. Neurosci Lett. 1990;113:72–77. doi: 10.1016/0304-3940(90)90497-w. [DOI] [PubMed] [Google Scholar]
- 22.Leresche N, Lightowler S, Soltesz I, Jassik-Gerschenfeld D, Crunelli V. Low frequency oscillatory activities intrinsic to rat and cat thalamocortical cells. J Physiol (Lond) 1991;441:155–174. doi: 10.1113/jphysiol.1991.sp018744. [DOI] [PMC free article] [PubMed] [Google Scholar]
- 23.LeVay S, Stryker MP, Shatz CJ. Ocular dominance columns and their development in layer IV of the cat’s visual cortex. J Comp Neurol. 1978;179:223–244. doi: 10.1002/cne.901790113. [DOI] [PubMed] [Google Scholar]
- 24.LoTurco JJ, Blanton MG, Kriegstein AR. Initial expression and endogenous activation of NMDA channels in early neocortical development. J Neurosci. 1991;11:792–799. doi: 10.1523/JNEUROSCI.11-03-00792.1991. [DOI] [PMC free article] [PubMed] [Google Scholar]
- 25.Mason CA. Postnatal maturation of neurons in the cat’s lateral geniculate nucleus. J Comp Neurol. 1983;217:458–469. doi: 10.1002/cne.902170410. [DOI] [PubMed] [Google Scholar]
- 26.McCormick DA, Pape H-C. Properties of a hyperpolarization-activated cation current and its role in rhythmic oscillation in thalamic relay neurones. J Physiol (Lond) 1990a;431:291–318. doi: 10.1113/jphysiol.1990.sp018331. [DOI] [PMC free article] [PubMed] [Google Scholar]
- 27.McCormick DA, Pape H-C. Noradrenergic and serotonergic modulation of a hyperpolarization-activated cation current in thalamic relay neurones. J Physiol (Lond) 1990b;431:319–342. doi: 10.1113/jphysiol.1990.sp018332. [DOI] [PMC free article] [PubMed] [Google Scholar]
- 28.McCormick DA, Prince DA. Post-natal development of electrophysiological properties of rat cerebral cortical pyramidal neurones. J Physiol (Lond) 1987;393:743–762. doi: 10.1113/jphysiol.1987.sp016851. [DOI] [PMC free article] [PubMed] [Google Scholar]
- 29.Oh K-S, Lee C-J, Gibbs JW, Coulter DA. Postnatal development of GABAA receptor function in somatosensory thalamus and cortex: whole-cell voltage-clamp recordings in acutely isolated rat neurons. J Neurosci. 1995;15:1341–1351. doi: 10.1523/JNEUROSCI.15-02-01341.1995. [DOI] [PMC free article] [PubMed] [Google Scholar]
- 30.Pape H-C, McCormick DA. Electrophysiological and pharmacological properties on interneurons in the cat dorsal lateral geniculate nucleus. Neuroscience. 1995;68:1105–1125. doi: 10.1016/0306-4522(95)00205-w. [DOI] [PubMed] [Google Scholar]
- 31.Pirchio M, Lightowler S, Crunelli V. Postnatal development of the T calcium current in cat thalamocortical cells. Neuroscience. 1990;38:39–45. doi: 10.1016/0306-4522(90)90372-b. [DOI] [PubMed] [Google Scholar]
- 32.Ramoa AS, McCormick DA. Developmental changes in electrophysiological properties of LGNd neurons during reorganization of retinogeniculate connections. J Neurosci. 1994a;14:2089–2097. doi: 10.1523/JNEUROSCI.14-04-02089.1994. [DOI] [PMC free article] [PubMed] [Google Scholar]
- 33.Ramoa AS, McCormick DA. Enhanced activation of NMDA receptor responses at the immature retinogeniculate synapse. J Neurosci. 1994b;14:2098–2105. doi: 10.1523/JNEUROSCI.14-04-02098.1994. [DOI] [PMC free article] [PubMed] [Google Scholar]
- 34.Robinson SR, Dreher B. The visual pathways of eutherian mammals and marsupials develop according to a common timetable. Brain Behav Evol. 1990;36:177–195. doi: 10.1159/000115306. [DOI] [PubMed] [Google Scholar]
- 35.Shatz CJ. The prenatal development of the cat’s retinogeniculate pathway. J Neurosci. 1983;3:482–499. doi: 10.1523/JNEUROSCI.03-03-00482.1983. [DOI] [PMC free article] [PubMed] [Google Scholar]
- 36.Shatz CJ, Kirkwood PA. Prenatal development of functional connections in the cat’s retinogeniculate pathway. J Neurosci. 1984;4:1378–1397. doi: 10.1523/JNEUROSCI.04-05-01378.1984. [DOI] [PMC free article] [PubMed] [Google Scholar]
- 37.Shatz CJ, Stryker MP. Ocular dominance in layer IV of the cat’s visual cortex and the effects of monocular deprivation. J Physiol (Lond) 1978;281:267–283. doi: 10.1113/jphysiol.1978.sp012421. [DOI] [PMC free article] [PubMed] [Google Scholar]
- 38.Shatz CJ, Lindstrom S, Wiesel TN. The distribution of afferents representing the right and left eyes in the cat’s visual cortex. Brain Res. 1977;131:103–116. doi: 10.1016/0006-8993(77)90031-2. [DOI] [PubMed] [Google Scholar]
- 39.Shotwell SL, Shatz CJ, Luskin MB. Development of glutamic acid decarboxylase immunoreactivity in the cat’s lateral geniculate nucleus. J Neurosci. 1986;6:1410–1423. doi: 10.1523/JNEUROSCI.06-05-01410.1986. [DOI] [PMC free article] [PubMed] [Google Scholar]
- 40.Soltesz I, Lightowler S, Leresche N, Jassik-Gerschenfeld D, Pollard CE, Crunelli V. Two inward currents and the transformation of low-frequency oscillations of rat and cat thalamocortical cells. J Physiol (Lond) 1991;441:175–197. doi: 10.1113/jphysiol.1991.sp018745. [DOI] [PMC free article] [PubMed] [Google Scholar]
- 41.Skaliora I, Scobey RP, Chalupa LM. Prenatal development of excitability in cat retinal ganglion cells: action potentials and sodium currents. J Neurosci. 1993;13:313–323. doi: 10.1523/JNEUROSCI.13-01-00313.1993. [DOI] [PMC free article] [PubMed] [Google Scholar]
- 42.Skaliora I, Robinson DW, Scobey RP, Chalupa LM. Properties of K+ conductances in cat retinal ganglion cells during the period of activity-mediated refinements in retinofugal pathways. Eur J Neurosci. 1995;7:1558–1568. doi: 10.1111/j.1460-9568.1995.tb01151.x. [DOI] [PubMed] [Google Scholar]
- 43.Staley KJ, Otis TS, Mody I. Membrane properties of dentate gyrus granule cells—comparison of sharp microelectrodes and whole-cell recordings. J Neurophysiol. 1992;67:1346–1358. doi: 10.1152/jn.1992.67.5.1346. [DOI] [PubMed] [Google Scholar]
- 44.Steriade M, Curró Dossi R, Nuñez A. Network modulation of a slow intrinsic oscillation of cat thalamocortical neurons implicated in sleep delta waves: cortically induced synchronization and brainstem cholinergic suppression. J Neurosci. 1991;11:3200–3217. doi: 10.1523/JNEUROSCI.11-10-03200.1991. [DOI] [PMC free article] [PubMed] [Google Scholar]
- 45.Steriade M, McCormick DA, Sejnowski TJ. Thalamocortical oscillations in the sleeping and aroused brain. Science. 1993;262:679–685. doi: 10.1126/science.8235588. [DOI] [PubMed] [Google Scholar]
- 46.Thatcher RW, Purpura DP. Postnatal development of thalamic synaptic events underlying evoked recruiting responses and electrocortical activation. Brain Res. 1973;60:21–34. doi: 10.1016/0006-8993(73)90848-2. [DOI] [PubMed] [Google Scholar]
- 47.Tootle JS, Friedlander MJ. Postnatal development of receptive field surround inhibition in kitten dorsal lateral geniculate nucleus. J Neurophysiol. 1986;56:523–541. doi: 10.1152/jn.1986.56.2.523. [DOI] [PubMed] [Google Scholar]
- 48.Tootle JS, Friedlander MJ. Postnatal development of the spatial contrast sensitivity of X- and Y-cells in the kitten retinogeniculate pathway. J Neurosci. 1989;9:1325–1340. doi: 10.1523/JNEUROSCI.09-04-01325.1989. [DOI] [PMC free article] [PubMed] [Google Scholar]
- 49.Turner JP, Williams SR, Pirchio M, Crunelli V. Development of the membrane properties and low-frequency oscillations in the cat thalamus. Soc Neurosci Abstr. 1993;19:527. [Google Scholar]
- 50.Velazquez JLP, Carlen PL. Development of firing patterns and electrical properties in neurons of the rat ventrobasal thalamus. Dev Brain Res. 1996;91:164–170. doi: 10.1016/0165-3806(95)00171-9. [DOI] [PubMed] [Google Scholar]
- 51.White CA, Sur M. Membrane and synaptic properties of developing lateral geniculate nucleus neurons during retinogeniculate axon segregation. Proc Natl Acad Sci USA. 1992;89:9850–9854. doi: 10.1073/pnas.89.20.9850. [DOI] [PMC free article] [PubMed] [Google Scholar]
- 52.Williams SR, Turner JP, Anderson CM, Crunelli V. Electrophysiological and morphological properties of interneurones in the rat dorsal lateral geniculate nucleus in vitro. J Physiol (Lond) 1996;490:129–147. doi: 10.1113/jphysiol.1996.sp021131. [DOI] [PMC free article] [PubMed] [Google Scholar]
- 53.Winfield DA, Powell TPS. An electron-microscopical study of the postnatal development of the lateral geniculate nucleus in the normal kitten and after eyelid suture. Proc R Soc Lond [Biol] 1980;210:197–210. doi: 10.1098/rspb.1980.0129. [DOI] [PubMed] [Google Scholar]
- 54.Winfield DA, Hiorns RW, Powell TPS. A quantitative electron-microscopical study of the postnatal development of the lateral geniculate nucleus in normal kittens and in kittens with eyelid suture. Proc R Soc Lond [Biol] 1980;210:211–234. doi: 10.1098/rspb.1980.0130. [DOI] [PubMed] [Google Scholar]
- 55.Wolff JR, Böttcher H, Zetzsche T, Oertel WH, Chronwall BM. Development of GABAergic neurons in the rat visual cortex as identified by glutamate decarboxylase-like immunoreactivity. Neurosci Lett. 1984;47:207–212. doi: 10.1016/0304-3940(84)90515-9. [DOI] [PubMed] [Google Scholar]
- 56.Zar JH. Biostatistical analysis. Prentice–Hall; Englewood Cliffs, NJ: 1984. [Google Scholar]