

Abstract
The main excitatory pathway of the hippocampal formation is controlled by a network of morphologically distinct populations of GABAergic interneurons. Here we describe a novel type of GABAergic interneuron located in the outer molecular layer (OML) of the rat dentate gyrus with a long-range forward projection from the dentate gyrus to the subiculum across the hippocampal fissure. OML interneurons were recorded in hippocampal slices by using the whole-cell patch-clamp configuration. During recording, cells were filled with biocytin for subsequent light and electron microscopic analysis. Neurons projecting to the subiculum were distributed throughout the entire OML. They had round or ovoid somata and a multipolar dendritic morphology. Two axonal domains could be distinguished: an extensive, tangential distribution within the OML and a long-range vertical and tangential projection to layer 1 and stratum pyramidale of the subiculum. Symmetric synaptic contacts were established by these interneurons on dendritic shafts in the OML and subiculum. OML interneurons were characterized physiologically by short action potential duration and marked afterhyperpolarization that followed the spike. On sustained current injection, they generated high-frequency (up to 130 Hz, 34°C) trains of action potentials with only little adaptation. In situ hybridization and single-cell RT-PCR analysis for GAD67 mRNA confirmed the GABAergic nature of OML interneurons. GABAergic interneurons in the OML projecting to the subiculum connect the input and output regions of the hippocampus. Hence, they could mediate long-range feed-forward inhibition and may participate in an oscillating cross-regional interneuron network that may synchronize the activity of spatially distributed principal neurons in the dentate gyrus and the subiculum.
Keywords: GABAergic interneurons, dentate–subicular projection, glutamate decarboxylase, single-cell RT-PCR, feed-forward inhibition, dentate gyrus, rat
The neuronal network of the hippocampus consists of glutamatergic principal neurons (granule cells and pyramidal neurons) and GABAergic interneurons (Amaral, 1978; Buhl et al., 1994;Buckmaster and Schwartzkroin, 1995a,b) (for review, see Freund and Buzsáki, 1996). Although interneurons numerically represent only ∼10% of the neuronal population, they regulate the activity of the entire network. GABAergic interneurons mediate feedback or feed-forward inhibition by local synaptic interactions with principal neurons and thereby control their activity (Andersen et al., 1963; Buzsáki, 1984). In addition, GABAergic interneurons form a network by mutual synaptic interactions. This interneuron network is thought to be involved in the generation of oscillatory activity and may provide the clock signal for temporal encoding of information in principal neurons (Soltész and Deschênes, 1993; Bragin et al., 1995;Buzsáki and Chrobak, 1995; Cobb et al., 1995; Whittington et al., 1995; Jefferys et al., 1996).
The axons of GABAergic interneurons innervate specific regions of their postsynaptic target cells (Somogyi, 1977; Soriano and Frotscher, 1989;Li et al., 1992; Gulyás et al., 1993; Halasy and Somogyi, 1993;Buhl et al., 1994, 1996; Miles et al., 1996) (for review, see Freund and Buzsáki, 1996). GABAergic synapses established on the axon initial segment or the soma are thought to set the threshold of action potential initiation in principal neurons (Miles et al., 1996). In contrast, inhibitory synapses formed on dendrites may suppress both the backpropagation of Na+-dependent action potentials (Tsubokawa and Ross, 1996) and the initiation of dendritic Ca2+ spikes (Miles et al., 1996). This may imply that interneurons regulate plasticity at glutamatergic synapses (Davies et al., 1991).
Most GABAergic interneurons have an extensive local axonal arborization, indicating that they control a large number of target cells (Han et al., 1993; Buckmaster and Schwartzkroin, 1995a,b; Cobb et al., 1995) (for review, see Freund and Buzsáki, 1996). Recently, a backprojecting interneuron in the alveus of the CA1 subfield with three spatially distributed axonal domains in CA1, CA3, and in the hilar region was described (Sik et al., 1994). It was suggested that this type of interneuron mediates long-range feedback inhibition in the hippocampus. GABAergic interneurons with long-range projections may couple oscillating local circuits and generate spatially coherent oscillations (Traub et al., 1996). The abundance and distribution of GABAergic interneurons with cross-regional projections in the hippocampal formation, however, remain unclear.
The outer molecular layer (OML) of the dentate gyrus is the input region of the hippocampus for afferent fibers from the entorhinal cortex (Steward, 1976; Witter, 1989). Therefore, GABAergic interneurons situated in this region would be in a key position to control information flow into the hippocampus by feed-forward inhibition. Very little is known, however, about neurons located in the OML. Previous studies in the developing and adult hippocampus have shown a population of glutamic acid decarboxylase (GAD) 65/67 (Houser and Esclapez, 1994) and calretinin-positive neurons (Del Río et al., 1996; Liu et al., 1996) in the OML. The axonal projection and the function of these cells are unknown.
Using patch-clamp techniques in brain slices, we describe a novel type of GABAergic interneuron in the OML with a cross-regional forward projection to the subiculum via the hippocampal fissure. Because the subiculum is the first stage in the output from the hippocampus to the neocortex, it is suggested that this interneuron mediates long-range feed-forward inhibition and may synchronize oscillating networks in the hippocampal–entorhinal axis.
MATERIALS AND METHODS
Patch-clamp recording. Brains from 10- to 31-d-old Wistar rats were used in this study; however, the majority of brains was taken from animals between postnatal days 10 to 18 (P10–P18). Animals were decapitated, and transverse hippocampal slices (300 μm thickness) were cut in ice-cold physiological extracellular solution with a vibratome (Dosaka Instruments, Kyoto, Japan). Then slices were incubated at 32–35°C for 30–60 min and stored, subsequently, at room temperature. Patch-clamp recordings from neurons in the OML were made under visual control by infrared differential interference contrast (IR-DIC) videomicroscopy (Stuart et al., 1993). An upright microscope (Axioskop FS, Zeiss, Oberkochen, Germany) equipped with a 40× water immersion objective (Zeiss), an infrared filter (RG-9, Schott, Melsungen, Germany), and a Newvicon camera (C2400, Hamamatsu, Hamamatsu City, Japan) was used. Borders within the molecular layer of the dentate gyrus were defined according to Amaral and Witter (1995).
Patch pipettes were pulled from borosilicate glass tubing (2.0 mm outer diameter, 0.5 mm wall thickness, Hilgenberg, Malsfeld, Germany). When filled with intracellular solution, they had resistances of 3–5 MΩ. Neurons were approached while positive pressure was applied to the inside of the patch pipette. Seals were formed in the voltage-clamp mode by using an Axopatch 200A amplifier (Axon Instruments, Foster City, CA). After the whole-cell configuration was established by breaking the cell membrane with a suction pulse, the amplifier was switched to the current-clamp recording mode. Only neurons with a resting potential more negative than −50 mV were accepted. During recording the membrane potential was set to −70 mV by injection of a small holding current (<20 pA). The recording temperature was 34 ± 2°C.
Solutions. The physiological extracellular solution used for bath perfusion contained (in mm): 125 NaCl, 25 NaHCO3, 25 glucose, 2.5 KCl, 1.25 NaH2PO4, 2 CaCl2, and 1 MgCl2, bubbled with 95% O2/5% CO2. The intracellular solution contained (in mm): 135 K-gluconate, 20 KCl, 0.1 EGTA, 10 HEPES, 2 MgCl2, and 2 adenosine 5′-triphosphate (Na2-ATP) plus 5 mg/ml biocytin pH-adjusted to 7.3 with KOH. All chemicals were obtained from Merck (Darmstadt, Germany) or Sigma (München, Germany).
Data acquisition and analysis. Voltage recordings were filtered at 2 kHz with the internal 4-pole low-pass Bessel filter of the Axopatch amplifier. Data were digitized and stored on-line at 5–10 kHz with a CED1401+ interface (CED, Cambridge, England) connected to a personal computer. Data analysis was performed with interactive programs written in Pascal.
The input resistance (RN) was estimated from voltage responses to current pulses of 1000 msec duration (−100 pA to +280 pA amplitude, incremented in steps of 20 pA).RN was determined from a plot of the voltage measured 500–1000 msec after the onset of the pulse against the current amplitude; data points −20 mV to +10 mV around the holding potential were fit by linear regression. The apparent membrane time constant (τ0) was estimated from voltage responses to current pulses of small amplitude (−60 pA). The resulting voltage transient was plotted logarithmically, and the late portion (between 10–20 and 20–40 msec after the onset of the pulse) was fit by linear regression (Spruston and Johnston, 1992). The sag ratio was determined by using hyperpolarizing current pulses (−80 pA) of 1000 msec duration and was calculated as the voltage at the end of the pulse (900–960 msec) divided by the maximal voltage during the pulse.
Action potentials were elicited by depolarizing current pulses of 1000 msec duration (+50 pA to +900 pA amplitude, incremented in steps of 50 pA). Half-duration and the dV/dt ratio (McCormick et al., 1985; Scharfman, 1992) of single action potentials were determined from the first spike in response to a current injection that was slightly above threshold. The action potential frequency for a given stimulus intensity was determined from the number of spikes during the 1000 msec pulse. All data are given as mean ± SD.
Biocytin filling and histological procedure. During recording, neurons were filled with biocytin (15–30 min) to reveal their morphological characteristics. After the pipette was withdrawn, slices were left in the recording chamber for an additional 10–15 min to allow for biocytin transport within the axon. Slices were immersion-fixed in a phosphate-buffered solution (100 mmPB, pH 7.4) containing 1% paraformaldehyde and 2.5% glutaraldehyde (12 hr at 4°C). For electron microscopy slices were embedded in 3% agar (diluted in 100 mm PB) and resectioned at a thickness of 70 μm on a vibratome. Thereafter, free-floating sections were rinsed several times in 100 mm PB. To block endogenous peroxidase, we transferred sections into phosphate-buffered 3% H2O2 for 20 min, followed by an ascending series of dimethylsulfoxide (DMSO) at the following concentrations: 5, 10, 20, and 40% diluted in 100 mm PB (30 min for each step). After several rinses in 100 mm PB, sections were processed with an ABC solution (1:25, Vectastain Elite, Camon, Wiesbaden, Germany), as previously described (Lübke et al., 1996). To enhance the staining contrast, we post-fixed sections for 1 hr in 0.5% phosphate-buffered osmium tetroxide, counterstained in 1% uranyl acetate, dehydrated via an ascending series of ethanol (30 min for each step), and finally flat-embedded in Durcopan (Fluka AG, Buchs, Switzerland). Serial sections were cut with an ultramicrotome (Leitz Ultracut, Leitz, Hamburg, Germany) and analyzed for synaptic contacts with a Zeiss EM 109 electron microscope.
For light microscopy a similar protocol was used, although slices were not resectioned and no ascending series of DMSO was used, but 0.1% Triton X-100 was added to the ABC solution. After the diaminobenzidine reaction, free-floating slices were enhanced briefly in 0.1% osmium tetroxide (2 min), run through an ascending series of ethanol, and finally were flat-embedded in Hypermount (Life Sciences GmbH, Frankfurt, Germany). Representative examples of neurons were examined, photographed, and reconstructed with an Olympus BX-50 microscope and a camera lucida drawing tube (Olympus, Hamburg, Germany) at a final magnification of 480×. Drawings of the OML neurons formed the basis for further quantitative morphological analysis.
Quantitative analysis of axonal parameters of OML interneurons.The numbers of boutons, segments, and branch points were determined for the two axonal domains (OML and subiculum) by using concentric ring analysis (Sholl, 1955). The soma region of the neuron was placed within the first concentric ring (ring spacing was 20 μm), and the total number per ring was counted for each parameter. The bouton density per 100 μm axonal length was calculated from the total number of boutons and the total axonal length for each concentric ring. All data are given as mean ± SD. No correction was made for tissue shrinkage caused by fixation and dehydration.
Nonradioactive in situ hybridization for GAD67 mRNA.Wistar rats (10–30 d old) were anesthetized and perfused transcardially with 100 mm PB containing 4% paraformaldehyde. The brains were removed and post-fixed for 2 hr, followed by cryoprotection (12 hr) in 100 mm PB containing 20% sucrose and 0.1% diethylpyrocarbonate to inactivate RNases. Then brains were frozen in isopentane at −40°C and stored until further processing at −70°C. Sections (50 μm) of the hippocampal formation were cut with a cryotome (Reichert-Jung 2700 Frigocut, Wien, Austria). Every second section was used for in situ hybridization.
Sections were transferred to RNase-free vials and washed in 2× SSC (0.3 m sodium chloride and 0.03 m sodium citrate). Digoxigenin-labeled riboprobes for GAD67 mRNA were kindly provided by Dr. Petra Wahle (Universität Bochum, Bochum, Germany); they were transcribed and tested as described by Wahle and Beckh (1992). In situ hybridization was performed by using free-floating sections. They were incubated for 10–18 hr at 47°C in hybridization buffer containing 50% formamide, 4× SSC, 250 μg/ml denatured salmon sperm DNA, 100 μg/ml yeast tRNA, 5% dextran sulfate, 1× Denhardt’s solution (Sigma), and the probe (sense or antisense, diluted 1:1000; Bender et al., 1996). After posthybridization washes (2× SSC for 2 × 15 min at 24°C, 2× SSC/50% formamide for 15 min at 57°C, 0.1 SSC/50% formamide for 15 min at 57°C, and 0.1× SSC for 15 min at 57°C), labeled neurons were detected by a digoxigenin–RNA labeling and detection kit (Boehringer Mannheim, Mannheim, Germany). Control experiments with the sense probe gave no labeling.
Single-cell reverse transcription (RT)-PCR analysis for GAD67 mRNA. Single-cell RT-PCR analysis was performed as described previously (Monyer and Jonas, 1995). Patch pipettes were pulled from heated (200°C overnight) glass tubing; resistances were between 1 and 2 MΩ. They were filled with 8 μl of autoclaved intracellular solution containing (in mm): 140 KCl, 5 EGTA, 3 MgCl2, and 5 HEPES, pH-adjusted to 7.3. The silver wire of the electrode holder was rechlorided before every recording. After examination of the action potential pattern of the neuron in the whole-cell configuration, we harvested the nucleus and cytoplasm of the cell into the patch pipette under visual control. Then the content of the pipette tip was expelled into a reaction tube by a valve-controlled pressure system. Subsequently, RT-PCR amplification for GAD67 mRNA was performed (Jonas et al., 1994), using the sense primer ATGGCATCTTCCACGCCTTCG (position 1 of the coding region) and the antisense primer CCAAATTAAAACCTTCCATGCC (position 465 of the coding region). The resulting 465 bp fragment spans three introns at the genomic level. The cycling conditions were 3 min initial denaturation (94°C), 40 cycles (94°C, 30 sec; 51°C, 30 sec; 72°C, 30 sec). Control experiments obtained without harvesting of cytoplasm gave no product after PCR amplification.
RESULTS
Visualization of neurons in the OML
IR-DIC videomicroscopy allowed us to visualize and record from neurons in the OML of hippocampal slices (P10–P31), although the density of these neurons was much lower than that of neurons in the granule and pyramidal cell layer and the hilar region. Only neurons with somata located 50–100 μm below the surface of the slice were selected, to reduce the probability that dendrites or axons were severed during the slicing procedure. Eighty neurons were recorded and filled with biocytin. In 40 neurons the axon was stained adequately. Six neurons recorded from subsequently were identified as displaced granule cells. Fourteen neurons had a local axonal arborization that was confined mainly to the OML, 3 neurons projected to the stratum lacunosum moleculare of the CA1 region, and 17 neurons projected to the subiculum via the hippocampal fissure.
This study is focused on OML interneurons projecting to the subiculum via the hippocampal fissure. The location of the somata of physiologically and morphologically analyzed OML interneurons with an axonal projection to the subiculum is given in Figure 1. The somata of neurons were distributed throughout the entire span of the OML; however, the majority was found in the middle to outer third of the OML adjacent to the hippocampal fissure (Fig. 1).
Fig. 1.

Location of somata of interneurons in the OML projecting to the subiculum. Schematic drawing of a transverse hippocampal slice shows the distribution of recorded and anatomically analyzed neurons. Internal reference numbers are shown within circles. Because of the overlap in the position of the somata, two neurons were omitted. Note that subiculum-projecting neurons could be found throughout the entire OML. CA1,CA3, Hippocampal regions CA1 and CA3; F, fimbria; GCL, granule cell layer; hf, hippocampal fissure; sp, stratum pyramidale of the subiculum; SUB, subiculum. Scale bar, 1 mm.
Dendritic configuration and axonal arborization of subiculum-projecting interneurons in the OML
Subiculum-projecting neurons in the OML constituted a heterogeneous group with respect to their dendritic morphology. They had round to ovoid somata (transverse mean diameter, 16 μm; range, 12–28 μm) with either fusiform (Fig.2A), multipolar (Fig.2B), or pyramidal-like (Fig. 2C) dendritic configurations. The large majority of neurons had only a few short dendrites confined to the molecular layer (Fig.2A,B), and their dendrites did not cross the hippocampal fissure even when their somata were located directly underneath. It is unlikely that the sometimes very short dendrites (Fig. 2B) are attributable to incomplete filling with biocytin, because no partially stained dendrites were observed in our electron microscopic study. In 1 of 17 neurons dendrites entered the hilar region via the granule cell layer (Figs. 2C,3C), and in 5 of 17 neurons individual dendrites crossed the hippocampal fissure to enter layer 1 of the subiculum (see Fig.6A). Dendrites of OML interneurons were aspiny, but varicosities were observed frequently.
Fig. 2.

Morphology of biocytin-filled neurons in the OML. Three representative examples of OML interneurons are illustrated showing dendritic variability. A, Interneuron recorded and filled in a postnatal day 17 (P17) hippocampal slice with a fusiform morphology. The soma is located in the middle third of the OML. B, Multipolar interneuron from a P13 rat situated near the hippocampal fissure. The very short thin dendrites are confined to the OML. The main axon is marked by the open arrow, and projecting collaterals are marked by filled arrows. C, Pyramidal-like interneuron recorded and filled at P11, located in the inner third of the OML. The long apical dendrite descends into the hilar region via the granule cell layer. D, Single fiber (arrows) crossing the hippocampal fissure (hf).E, Photo montage of a displaced granule cell recorded and filled at P17. The soma is located in the inner third of the OML, and the main axon (open arrow) descends through the granule cell layer, giving rise to several collaterals (filled arrows) within the hilar region. In all micrographs the hippocampal fissure (hf) is delineated by the dashed line. GCL, Granule cell layer; H, hilar region; iml, inner molecular layer of the dentate gyrus; ml, molecular layer of the subiculum; oml, outer molecular layer of the dentate gyrus. Scale bars: in A–C, E, 50 μm; in D, 25 μm.
Fig. 3.
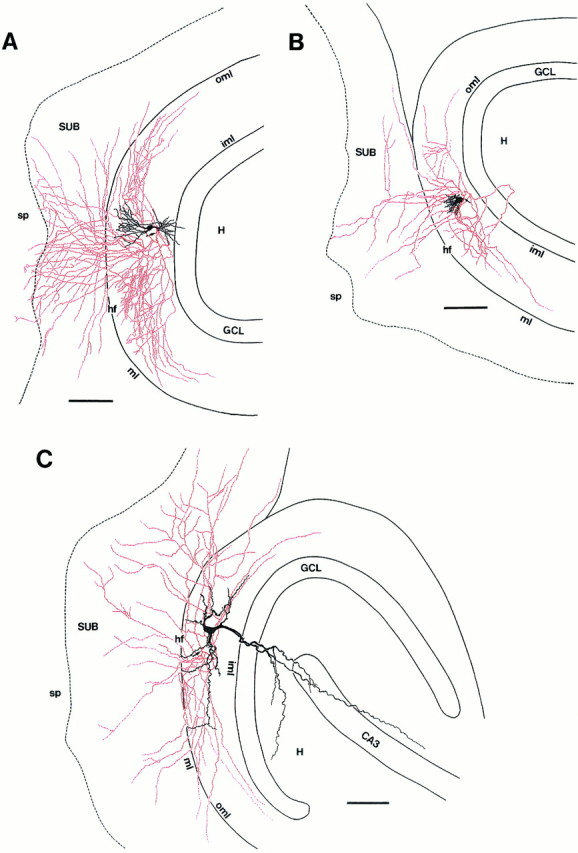
Axonal and dendritic morphology of three subiculum-projecting interneurons in the OML. Somata and dendrites of the neurons are drawn in black; axons are drawn inred. Arrows point to the origin of the axons. A, Camera lucida reconstruction of an interneuron (P17) with its soma located in the inner to middle third of the OML with a fusiform dendritic configuration. Note the extensive axonal arborization within layer 1 of the subiculum with terminations in stratum pyramidale and the extensive tangential spread within the OML.B, Interneuron (P13) with its soma located in the inner third of the OML with short, varicose dendrites emerging from the upper pole and restricted to the molecular layer. C, Pyramidal-like interneuron (P11) with a soma located in the inner third of the OML. This is the same neuron as that shown Figure2C. Note that the main dendrite projects through the granule cell layer into the hilar region. Neurons shown inB and C have a less extensive axonal domain within the OML and the subiculum than the cell inA. The dashed line separates layer 1 and stratum pyramidale of the subiculum. CA3, Hippocampal region CA3; GCL, granule cell layer; H, hilar region; hf, hippocampal fissure;iml, inner molecular layer of the dentate gyrus;ml, molecular layer of the subiculum;oml, outer molecular layer of the dentate gyrus;sp, stratum pyramidale of the subiculum;SUB, subiculum. Scale bars in A–C, 100 μm.
Fig. 6.
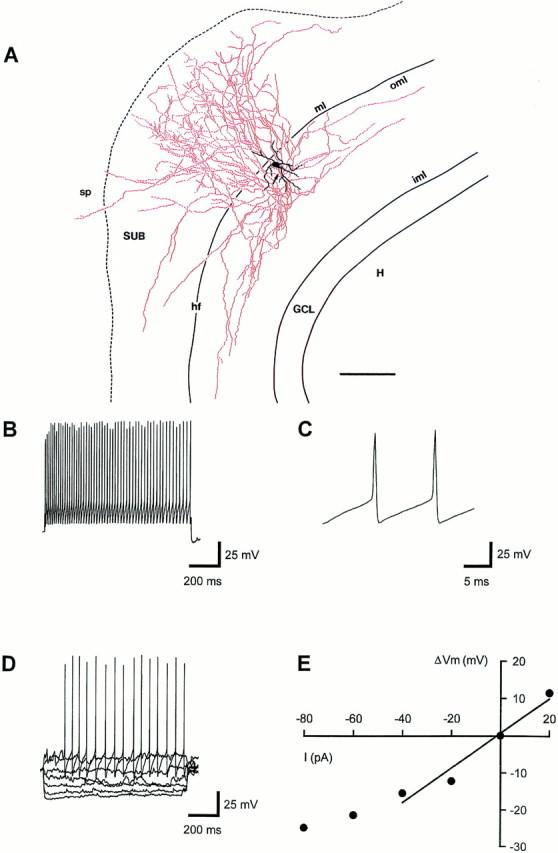
Physiological properties of a subiculum-projecting interneuron in the OML. A, Camera lucida reconstruction of an interneuron recorded and filled at P18, with its soma located underneath the hippocampal fissure and with an extensive vertical axonal projection to the subiculum. Soma and dendrites are drawn inblack; the axon is drawn in red. Thearrow points to the origin of the axon. Thedashed line separates layer 1 and stratum pyramidale of the subiculum. For abbreviations, see Figure 3. Scale bar inA, 100 μm. B, High-frequency train of action potentials (55 Hz) evoked by a 1000 msec current pulse of +180 pA. C, The second and third action potential of the voltage trace shown in B at an expanded time scale.D, Voltage responses to hyper- and depolarizing current injections of −80 to +40 pA. E, Voltage–current (V–I) relation for the voltage traces shown inD. Data points from −40 to +20 pA were fit by linear regression. RN, estimated from the slope, was 465 MΩ. The resting membrane potential was −58 mV; the holding potential was −70 mV. All data were obtained from the same neuron.
The main axon of subiculum-projecting neurons in the OML emerged directly from the soma and had two distinct axonal domains. The first domain was confined mainly to the OML and was oriented tangentially. The field span of this local domain was 1–1.3 mm (Figs.3A–C, 6A). Only a few collaterals (<5%) projected toward the inner molecular layer (Fig.3B). Collaterals entering the granule cell layer or the hilar region of the dentate gyrus were not observed, with one exception, where the main axon entered the hilar region, but looped back into the OML (Fig. 3B).
The second axonal domain was established by vertically and tangentially oriented collaterals, which crossed the hippocampal fissure (Fig.2D) and terminated in layer 1 (∼95% of the axonal collaterals) or stratum pyramidale (∼5%) of the subiculum (Figs.3A–C, 6A). The axonal arborization within the subiculum was variable among the population of OML interneurons. Most neurons showed a high degree of collateralization in the subiculum. The majority of their axonal collaterals was oriented vertically, and only a few tangential collaterals were found (Figs.3A, 6A). In some neurons the vertical axonal arborization in the subiculum was less extensive, but the tangential projection was more widespread (Fig. 3B,C). These tangential collaterals could be followed over distances up to 750 μm from the soma. The maximal field span of single axonal collaterals was 1.3 mm and was similar for both axonal domains. Axonal growth cones occasionally were found on interneurons from younger rats (<P14).
Electron microscopic analysis revealed that OML interneurons established symmetric (supposedly inhibitory) synaptic contacts mainly on dendritic shafts but also on spine necks of target neurons in the OML (Fig. 4A,B) and the subiculum (Fig. 4C,D). No synaptic contacts with cell bodies or axon initial segments were found. The contacts on spine necks and on shafts of spiny dendrites within the two axonal domains of OML interneurons suggest that these synapses are formed with principal neurons, granule cells, and subicular pyramidal neurons. It cannot be excluded, however, that OML interneurons also target other interneurons in the OML and subiculum.
Fig. 4.
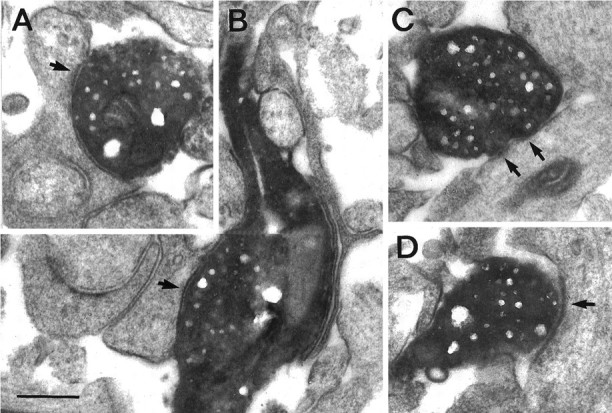
Symmetric synaptic contacts of a subiculum-projecting OML interneuron of a P14 rat. A, Biocytin-filled synaptic bouton terminating on a spine neck in the OML.B, En passant synapse established on a dendritic shaft in the OML. C, D, Two examples of synapses established on dendritic shafts in the molecular layer of the subiculum. Arrows point to what appear to be postsynaptic membrane specializations. Scale bar, 0.25 μm.
Quantitative analysis of axonal arborization of subiculum-projecting interneurons in the OML
The number of boutons, axonal segments, and branch points for the two axonal domains of subiculum-projecting OML interneurons was determined by concentric ring analysis (Fig. 5). The mean number of boutons of the subicular domain was 947 ± 657 (range, 251–2083), somewhat larger than that of the OML domain (667 ± 434; range, 264–1399). Comparable results were obtained for the number of axonal segments (mean values 316 and 253, respectively), branch points (mean values 51 and 48, respectively), and density of boutons per 100 μm axonal length (Fig. 5D) (mean values 15.3 and 14.4 per 100 μm, respectively). Although the axonal parameters were not significantly different between the two domains (two-sided t test for paired samples;p > 0.05), some neurons established much more prominent domains in the subiculum than in the OML. This is exemplified by the neuron shown in Figures 5 and6A. In this particular neuron the number of boutons (Fig. 5C), axonal segments (Fig.5A), and branch points (Fig. 5B) was more than twofold higher in the subiculum than in the OML. The number of boutons per ring in the OML was maximal at 100 μm from the soma, followed by a steep decline. In contrast, the number of boutons per ring in the subiculum was maximal at 220 μm and showed a much broader distribution (Fig. 5C).
Fig. 5.

Concentric ring analysis of axonal parameters of a subiculum-projecting interneuron in the OML. A, Number of axonal segments. B, Number of axonal branch points.C, Number of boutons. D, Density of boutons per 100 μm of axonal length per ring as a function of the distance from the soma. Open and filled bars represent the distribution within the OML and subiculum, respectively. The highest bins of the histograms are marked byarrows in A–C; the total numbers (A–C) and the mean ± SD (D) are given on the right. This is the same neuron as that shown in Figure6A.
Physiological properties of subiculum-projecting interneurons in the OML
In 9 of 17 subiculum-projecting OML interneurons an analysis of passive and active membrane properties in the current-clamp recording configuration was performed (Fig. 6B–E). Interneurons in the OML were very heterogeneous in their physiological characteristics. The mean resting membrane potential was −63 ± 6 mV, ranging from −55 to −72 mV. The mean input resistance (RN) was 292 ± 104 MΩ (range, 150–465 MΩ); the variation may be attributable in part to differences in somatic and dendritic surface area and configuration. The apparent membrane time constant τ0 was 10.9 ± 5.1 msec, ranging from 3.8 to 20.4 msec. All neurons investigated showed little sag (sag ratio 0.8 ± 0.1, ranging from 0.6 to 0.9) during hyperpolarizing current injections (Fig. 6D). Spontaneous excitatory and inhibitory synaptic potentials were observed frequently (Fig. 6D).
The shape of single action potentials generated by OML interneurons differed from that of hippocampal principal neurons (compare Fig.6C with Fig. 9C). The half-duration was 1.1 ± 0.7 msec (range, 0.5–2.8 msec), and the dV/dt ratio that relates the maximum rate of rise of the action potential to the maximum rate of decline was 1.2 ± 0.2 (range, 1–1.7). Single spikes were followed by a marked afterhyperpolarization (Fig.6B–D). OML interneurons generated high-frequency trains of action potentials with little or no adaptation in response to depolarizing current steps (Fig. 6B). In six neurons that were stimulated with currents of up to +900 pA, the average maximal action potential frequency was 108 ± 20 Hz (range, 83–130 Hz).
Fig. 9.

Morphological characteristics and electrophysiological properties of a displaced granule cell recorded and filled at P11. A, Camera lucida reconstruction of a displaced granule cell. The soma is located in the inner third of the OML. Note the characteristic arborization of the axon typical for granule cells. For abbreviations, see Figure 3. Scale bar inA, 100 μm. B, Action potential pattern (17 Hz) evoked by a 1000 msec current pulse of +180 pA.C, Voltage responses to hyper- and depolarizing current injections of −80 to +80 pA. D, V–Irelation for the voltage traces shown in C. Data points from −60 to +20 pA were fit by linear regression.RN was 209 MΩ, and the resting and holding membrane potentials were −70 mV. All data were obtained from the same neuron.
Given the brief duration of single action potentials, the weak adaptation, and the high maximal frequency of action potentials generated on sustained current injection, the electrophysiological characteristics were very similar to those of various types of GABAergic interneurons but markedly different from those of principal neurons of the hippocampus and neocortex (McCormick et al., 1985;Kawaguchi and Hama, 1987; Scharfman, 1992; Han et al., 1993).
Neurons in the OML are GABAergic
To identify the transmitter phenotype of OML interneurons, we performed in situ hybridization and single-cell RT-PCR analysis for GAD67 mRNA. A photomicrograph of a representative section through the hippocampal formation showing the distribution of GAD67 mRNA-containing neurons is given in Figure 7. The somata of GAD67-positive neurons could be distinguished from the background by the extensive reaction product filling the cytoplasm, whereas the nuclei were devoid of label. In the hippocampal formation the highest density of GAD67 mRNA-positive neurons was found in the dentate gyrus and the hilar region (Fig. 7A). Throughout the entire OML, GAD67 mRNA-positive neurons could be identified, although their density was much lower than that in the granule cell layer and the hilar region (Fig. 7A–C). Some neurons were located directly underneath the hippocampal fissure and the pial surface of the dentate gyrus (inset, Fig. 7B).
Fig. 7.
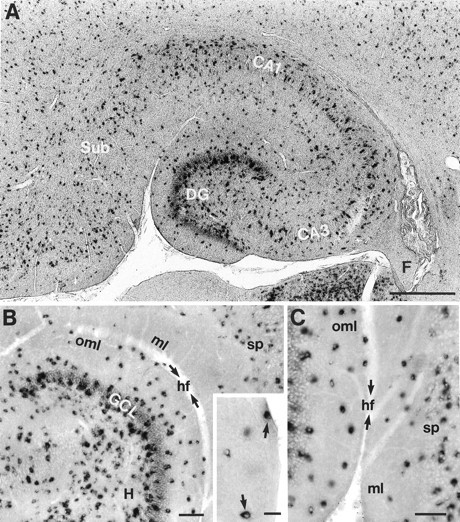
Distribution of GAD67-positive neurons in sections of the rat hippocampal formation at P11. A, Low-power magnification of the hippocampus and subiculum showing the overall distribution of GAD67-positive neurons. B, Distribution of GAD67-positive neurons in the hilar region, the granule cell layer, and the molecular layer of the dentate gyrus at higher magnification. The inset shows GAD67-positive neurons (arrows) located close to the hippocampal fissure.C, GAD67-positive neurons in the OML and layer 1 of the subiculum. The arrows in B andC indicate the hippocampal fissure (hf). CA1, CA3, Hippocampal regions CA1 and CA3; DG, dentate gyrus;F, fimbria; GCL, granule cell layer;H, hilar region; ml, molecular layer of the subiculum; oml, outer molecular layer of the dentate gyrus; sp, stratum pyramidale of the subiculum;Sub, subiculum. Scale bars: in A, 500 μm; in B, C, 100 μm; ininset, 25 μm.
To address whether the majority of neurons in the OML contained GAD67 mRNA, we counted neurons in alternating consecutive sections that were either processed for GAD67 mRNA or stained with cresyl violet (Nissl staining). A high degree of overlap between GAD67-positive neurons (35.9 ± 3.2 cells per section in 20 sections, thickness 50 μm) and Nissl-stained neurons (33.6 ± 2.7 cells per section in 20 alternating sections, thickness 50 μm) was found.
To confirm further the GABAergic nature of electrophysiologically characterized OML interneurons, we performed single-cell RT-PCR analysis, using specific primers designed to amplify GAD67 cDNA (Fig.8). Of 12 fast-spiking neurons located in the OML close to the hippocampal fissure, 10 cells expressed GAD67 mRNA (Fig. 8,lanes 1–6); the two remaining neurons did not amplify. In contrast, GAD67 mRNA was detected in none of the six CA1 pyramidal neurons (Fig. 8, lane 7) that served as controls. These results indicate that virtually all neurons in the OML are GABAergic.
Fig. 8.

Single-cell RT-PCR of GAD67 mRNA content of interneurons in the OML. Shown is an ethidium bromide-stained gel of cDNA fragments amplified from six electrophysiologically characterized OML interneurons by using primers for GAD67 (lanes 1–6). In addition, RT-PCR for GAD67 mRNA was performed for six CA1 pyramidal neurons. An example is shown in lane 7; note the absence of any detectable PCR product.M, DNA molecular weight marker.
Dendritic configuration and axonal projection of displaced granule cells
Six neurons with somata located in the inner third of the OML had morphological and functional properties substantially different from those of the subiculum-projecting fast-spiking interneurons described above. These neurons showed the characteristic morphological features described for granule cells (Lorente de Nó, 1934; Claiborne et al., 1990), except that their somata were not located in the granule cell layer (Figs. 2E, 9A). The somata were round to ovoid (transverse mean diameter, 14 μm; range, 12–15 μm) and gave rise to one or two primary apical dendrites that branched and fanned out to a cone-shaped dendritic field within the molecular layer (Figs. 2E, 9A). All dendrites were densely covered with spines. The main axon emerged directly from the basal pole of the soma and descended through the granule cell layer (Fig.2E). Within the hilar region it then gave rise to several collaterals. The mossy fiber axon ran parallel to the CA3 pyramidal cell layer over long distances while giving off several short terminal branches (Fig. 9A).
Physiological properties of displaced granule cells
Displaced granule cells typically had resting potentials that were more negative (−75 mV; range, −70 to −80 mV) than those of OML interneurons. The values for RN (198 MΩ; range, 186–209 MΩ) were in good agreement with published data for granule cells (Spruston and Johnston, 1992; Staley et al., 1992). Single action potentials of displaced granule cells were followed by a triphasic afterhyperpolarization (Fig. 9B; see alsoScharfman, 1992). Unlike OML interneurons, they generated low-frequency trains of action potentials on sustained current injection and showed marked spike frequency adaptation (Fig. 9B). Hence, displaced granule cells are markedly different from OML interneurons with regard to resting potential, shape of the action potential, firing frequency, and adaptation (Fig. 9B–D).
DISCUSSION
Here we describe a GABAergic interneuron that connects the input region of the hippocampal formation, the molecular layer of the dentate gyrus, to the output region, the subiculum. Via the hippocampal fissure this interneuron establishes a cross-regional axonal projection that is forward-directed, relative to the information flow in the trisynaptic pathway of the hippocampus.
Interneurons in the outer molecular layer of the dentate gyrus
Interneurons in the OML share several characteristics with other types of GABAergic interneurons in the hippocampus. OML interneurons are characterized by the short duration of the action potential, the marked afterhyperpolarization that follows a spike, and the high frequency of action potential trains generated on sustained current injection. These properties are used widely to identify GABAergic interneurons (McCormick et al., 1985; Scharfman, 1992). Both in situ hybridization and single-cell RT-PCR analysis of GAD67 mRNA content further indicated that neurons in the OML use GABA as their main transmitter, in agreement with a previous GAD65/67 mRNA in situ hybridization study (Houser and Esclapez, 1994). Subpopulations of neurons in the OML also express the Ca2+-binding protein calretinin (Del Río et al., 1996; Liu et al., 1996), different neuropeptides such as vasoactive intestinal polypeptide (Kosaka et al., 1985) and neuropeptide Y (Deller and Leranth, 1990), and nitric oxide synthase (Ikeda et al., 1996).
Interneurons in the OML have an axonal projection pattern markedly different from that of the majority of GABAergic interneurons in the hippocampus. They have two distinct axonal domains: a local domain in the OML and a forward projection domain to the subiculum. In contrast, most types of GABAergic interneurons have only a single axonal domain (Somogyi, 1977; Soriano and Frotscher, 1989; Li et al., 1992; Han et al., 1993; Buhl et al., 1994; McBain et al., 1994; Buckmaster and Schwartzkroin, 1995a,b; Miles et al., 1996). Bistratified and trilaminar interneurons in the CA1 region of the hippocampus have two and three axonal domains, respectively, but their axons do not leave the hippocampus and dentate gyrus (Sik et al., 1995). Backprojection interneurons in the alveus of the CA1 subfield have three axonal domains, i.e., in CA1, CA3, and in the hilar region (Sik et al., 1994,1995). These neurons, like OML interneurons, have axon collaterals that cross the hippocampal fissure. Both the OML interneuron (this paper) and the alveus interneuron (Sik et al., 1994) are interneurons with cross-regional projections, but the direction of the projection is opposite. Hence, OML interneurons and alveus interneurons together may provide long-range bidirectional control of neuronal activity in the hippocampus.
The morphological and functional characteristics of interneurons in the OML are also markedly different from those of Cajal–Retzius (CR) cells located in the same layer (von Haebler et al., 1993; Del Río et al., 1996, 1997; Liu et al., 1996). CR cells in the hippocampus, like their counterparts in layer 1 of the neocortex (Marin-Padilla, 1984; Ogawa et al., 1995; Hestrin and Armstrong, 1996;Del Río et al., 1997), are likely to play an important role in development. They may serve as a template for lamina-specific ingrowth of entorhinal fibers and seem to disappear in the early postnatal period after the arrival of these fibers (Del Río et al., 1996). The GABAergic interneurons in the OML described in the present paper are unlikely to represent CR cells: (1) OML interneurons have a multipolar dendritic configuration and an extensive axonal network; in contrast, CR cells are characterized by a bipolar shape, often with only a single dendritic process and an immature axon, both oriented tangentially to the pial surface or the hippocampal fissure (von Haebler et al., 1993; Del Río et al., 1996, 1997); (2) OML interneurons are positive for GAD, whereas CR cells may be glutamatergic (Del Río et al., 1995) or GABAergic (Martin et al., 1989); (3) OML interneurons generate high-frequency trains of brief action potentials on sustained current injection, whereas CR cells fire low-frequency trains of spikes of much longer duration (von Haebler et al., 1993; Hestrin and Armstrong, 1996); (4) OML interneurons were recorded in slices from animals ranging in age from P10–P31 in the present study. In contrast, many CR cells already have disappeared at that time and most of the remaining CR cells undergo degeneration (von Haebler et al., 1993; Del Río et al., 1997).
Putative synaptic input and output of interneurons in the OML
Because the somata and the majority of the dendrites of OML interneurons are confined to the molecular layer, these cells are in a key position to receive specific excitatory and inhibitory innervation (Fig. 10A). The main excitatory input is provided by fibers of the perforant path originating in the entorhinal cortex (Steward, 1976; Witter, 1989). In addition, OML interneurons are likely to receive inhibitory input from three sources: (1) hilar interneurons with an axonal projection to the OML coaligned with the perforant path (HIPP cells, Halasy and Somogyi, 1993; Han et al., 1993), (2) inner molecular layer interneurons with axons coaligned with the perforant path (MOPP cells, Han et al., 1993) or with a more widespread projection to the entire molecular layer (Soriano and Frotscher, 1993), and (3) other OML interneurons (Fig.10A). However, given the observation that some dendrites of OML interneurons extend into the inner molecular layer and the hilar region (Figs. 2C, 3A,C), additional excitatory input via the commissural/associational pathway and inhibitory input from other types of hilar interneurons (HICAP cells,Han et al., 1993; Buckmaster and Schwartzkroin, 1995b) cannot be excluded.
Fig. 10.
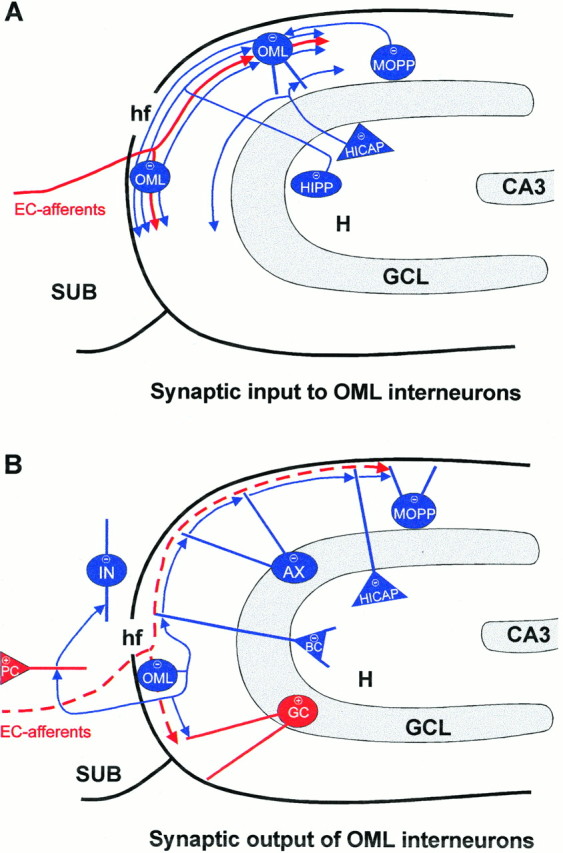
Schematic drawing of putative input–output connections of subiculum-projecting interneurons in the OML.A, OML interneurons may receive synaptic input from entorhinal afferents and from various GABAergic interneurons in the molecular layer and hilar region of the hippocampus. The excitatory input via the perforant path is drawn in red. Note the coalignment of entorhinal afferents and axons of OML interneurons.B, Interneurons in the OML may establish synaptic contacts with excitatory glutamatergic principal neurons (+), granule cells (GC), and pyramidal cells (PC) in the subiculum and with various GABAergic interneurons (−) in the subiculum, the dentate molecular layer, the granule cell layer, and the hilar region. AX, Axo–axonic cell; BC, basket cell; CA3, hippocampal region CA3;EC-afferents, entorhinal afferents; GCL, granule cell layer; H, hilar region; hf, hippocampal fissure; HICAP, hilar interneuron with an axonal plexus associated with the commissural/associational path;HIPP, hilar interneuron with an axonal plexus associated with the perforant path; IN, interneuron in layer 1 of the subiculum; MOPP, molecular layer interneuron with an axonal plexus associated with the perforant path; SUB, subiculum.
OML interneurons are likely to inhibit two types of principal neurons located in different regions of the hippocampal formation: the dentate granule cells by their local axonal domain and the pyramidal neurons of the subiculum via their long-range cross-regional forward projection axonal domain (Figs. 4, 10B). In addition, OML interneurons may innervate (1) other OML interneurons, (2) hippocampal interneurons with dendrites extending into the OML (basket and axo–axonic cells; MOPP and HICAP cells; Han et al., 1993), and (3) interneurons in layer 1 of the subiculum. The axonal distribution of the OML interneurons with regard to the location of the somata of their putative target neurons suggests that a majority of inhibitory synapses are established on distal dendritic segments. Hence, OML interneurons may suppress dendritic Ca2+ spikes in their postsynaptic target neurons, similar to other hippocampal interneurons innervating the dendritic domain (Han et al., 1993; McBain et al., 1994; Sik et al., 1994, 1995; Buckmaster and Schwartzkroin, 1995a,b;Miles et al., 1996).
Two possible functions of OML interneurons for the operation of the hippocampal network can be predicted from the location of their somatodendritic and axonal domains. First, OML interneurons are candidates for mediating both local and cross-regional feed-forward inhibition (Buzsáki, 1984), implying that they gate the information flow in the hippocampus at both the input and the output stage. Second, OML interneurons could participate in a cross-regional network of GABAergic interneurons distributed over the entire hippocampal formation. Such an interneuron network may generate oscillatory activity (Whittington et al., 1995; Wang and Buzsáki, 1996) and provide a spatially coherent clock signal for temporal coding of information in principal neurons of the hippocampal–subicular network (Buzsáki and Chrobak, 1995; Chrobak and Buzsáki, 1996).
Footnotes
This work was supported by the Deutsche Forschungsgemeinschaft (SFB 505/A3 and Leibniz program to M.F., SFB 505/C5 to P.J., and DFG 432/3 to H.M.) We thank Drs. H. Scharfman, M. Häusser, and I. Vida for critically reading an earlier version of this manuscript. We are also grateful to B. Joch, S. Nestel, M. Winter, and U. Amtmann for excellent technical assistance.
Correspondence should be addressed to Dr. Joachim Lübke, Anatomisches Institut der Albert-Ludwigs-Universität Freiburg, Albertstrasse 17, D-79104 Freiburg, Germany.
REFERENCES
- 1.Amaral DG. A Golgi study of cell types in the hilar region of the hippocampus in the rat. J Comp Neurol. 1978;182:851–914. doi: 10.1002/cne.901820508. [DOI] [PubMed] [Google Scholar]
- 2.Amaral DG, Witter MP. Hippocampal formation. In: Paxinos G, editor. The rat nervous system, 2nd Ed. Academic; New York: 1995. pp. 443–493. [Google Scholar]
- 3.Andersen P, Eccles JC, Løyning Y. Recurrent inhibition in the hippocampus with identification of the inhibitory cell and its synapses. Nature. 1963;198:540–542. doi: 10.1038/198540a0. [DOI] [PubMed] [Google Scholar]
- 4.Bender R, Plaschke M, Naumann T, Wahle P, Frotscher M. Development of cholinergic and GABAergic neurons in the rat medial septum: different onset of choline acetyltransferase and glutamate decarboxylase mRNA expression. J Comp Neurol. 1996;372:204–214. doi: 10.1002/(SICI)1096-9861(19960819)372:2<204::AID-CNE4>3.0.CO;2-7. [DOI] [PubMed] [Google Scholar]
- 5.Bragin A, Jandó G, Nádasdy Z, Hetke J, Wise K, Buzsáki G. γ (40–100 Hz) oscillation in the hippocampus of the behaving rat. J Neurosci. 1995;15:47–60. doi: 10.1523/JNEUROSCI.15-01-00047.1995. [DOI] [PMC free article] [PubMed] [Google Scholar]
- 6.Buckmaster PS, Schwartzkroin PA. Interneurons and inhibition in the dentate gyrus of the rat in vivo. J Neurosci. 1995a;15:774–789. doi: 10.1523/JNEUROSCI.15-01-00774.1995. [DOI] [PMC free article] [PubMed] [Google Scholar]
- 7.Buckmaster PS, Schwartzkroin PA. Physiological and morphological heterogeneity of dentate gyrus–hilus interneurons in the gerbil hippocampus in vivo. Eur J Neurosci. 1995b;7:1393–1402. [PubMed] [Google Scholar]
- 8.Buhl EH, Halasy K, Somogyi P. Diverse sources of hippocampal unitary inhibitory postsynaptic potentials and the number of synaptic release sites. Nature. 1994;368:823–828. doi: 10.1038/368823a0. [DOI] [PubMed] [Google Scholar]
- 9.Buhl EH, Szilágyi T, Halasy K, Somogyi P. Physiological properties of anatomically identified basket and bistratified cells in the CA1 area of the rat hippocampus in vitro. Hippocampus. 1996;6:294–305. doi: 10.1002/(SICI)1098-1063(1996)6:3<294::AID-HIPO7>3.0.CO;2-N. [DOI] [PubMed] [Google Scholar]
- 10.Buzsáki G. Feed-forward inhibition in the hippocampal formation. Prog Neurobiol. 1984;22:131–153. doi: 10.1016/0301-0082(84)90023-6. [DOI] [PubMed] [Google Scholar]
- 11.Buzsáki G, Chrobak JJ. Temporal structure in spatially organized neuronal ensembles: a role for interneuronal networks. Curr Opin Neurobiol. 1995;5:504–510. doi: 10.1016/0959-4388(95)80012-3. [DOI] [PubMed] [Google Scholar]
- 12.Chrobak JJ, Buzsáki G. High-frequency oscillations in the output networks of the hippocampal–entorhinal axis of the freely behaving rat. J Neurosci. 1996;16:3056–3066. doi: 10.1523/JNEUROSCI.16-09-03056.1996. [DOI] [PMC free article] [PubMed] [Google Scholar]
- 13.Claiborne BJ, Amaral DG, Cowan WM. Quantitative, three-dimensional analysis of granule cell dendrites in the rat dentate gyrus. J Comp Neurol. 1990;302:206–219. doi: 10.1002/cne.903020203. [DOI] [PubMed] [Google Scholar]
- 14.Cobb SR, Buhl EH, Halasy K, Paulsen O, Somogyi P. Synchronization of neuronal activity in hippocampus by individual GABAergic interneurons. Nature. 1995;378:75–78. doi: 10.1038/378075a0. [DOI] [PubMed] [Google Scholar]
- 15.Davies CH, Starkey SJ, Pozza MF, Collingridge GL. GABAB autoreceptors regulate the induction of LTP. Nature. 1991;349:609–611. doi: 10.1038/349609a0. [DOI] [PubMed] [Google Scholar]
- 16.Deller T, Leranth C. Synaptic connections of neuropeptide Y (NPY) immunoreactive neurons in the hilar area of the rat hippocampus. J Comp Neurol. 1990;300:433–447. doi: 10.1002/cne.903000312. [DOI] [PubMed] [Google Scholar]
- 17.Del Río JA, Martínez A, Fonseca M, Auladell C, Soriano E. Glutamate-like immunoreactivity and fate of Cajal–Retzius cells in the murine cortex as identified with calretinin antibody. Cereb Cortex. 1995;5:13–21. doi: 10.1093/cercor/5.1.13. [DOI] [PubMed] [Google Scholar]
- 18.Del Río JA, Heimrich B, Supèr H, Borrell V, Frotscher M, Soriano E. Differential survival of Cajal–Retzius cells in organotypic cultures of hippocampus and neocortex. J Neurosci. 1996;16:6896–6907. doi: 10.1523/JNEUROSCI.16-21-06896.1996. [DOI] [PMC free article] [PubMed] [Google Scholar]
- 19.Del Río JA, Heimrich B, Borrell V, Förster E, Drakew A, Alcántara S, Nakajima K, Miyata T, Ogawa M, Mikoshiba K, Derer P, Frotscher M, Soriano E. A role for Cajal–Retzius cells and reelin in the development of hippocampal connections. Nature. 1997;385:70–74. doi: 10.1038/385070a0. [DOI] [PubMed] [Google Scholar]
- 20.Freund TF, Buzsáki G. Interneurons of the hippocampus. Hippocampus. 1996;6:347–470. doi: 10.1002/(SICI)1098-1063(1996)6:4<347::AID-HIPO1>3.0.CO;2-I. [DOI] [PubMed] [Google Scholar]
- 21.Gulyás AI, Miles R, Hájos N, Freund TF. Precision and variability in postsynaptic target selection of inhibitory cells in the hippocampal CA3 region. Eur J Neurosci. 1993;5:1729–1751. doi: 10.1111/j.1460-9568.1993.tb00240.x. [DOI] [PubMed] [Google Scholar]
- 22.Halasy K, Somogyi P. Subdivisions in the multiple GABAergic innervation of granule cells in the dentate gyrus of the rat hippocampus. Eur J Neurosci. 1993;5:411–429. doi: 10.1111/j.1460-9568.1993.tb00508.x. [DOI] [PubMed] [Google Scholar]
- 23.Han Z-S, Buhl EH, Lörinczi Z, Somogyi P. A high degree of spatial selectivity in the axonal and dendritic domains of physiologically identified local circuit-neurons in the dentate gyrus of the rat hippocampus. Eur J Neurosci. 1993;5:395–410. doi: 10.1111/j.1460-9568.1993.tb00507.x. [DOI] [PubMed] [Google Scholar]
- 24.Hestrin S, Armstrong WE. Morphology and physiology of cortical neurons in layer I. J Neurosci. 1996;16:5290–5300. doi: 10.1523/JNEUROSCI.16-17-05290.1996. [DOI] [PMC free article] [PubMed] [Google Scholar]
- 25.Houser CR, Esclapez M. Localization of mRNAs encoding two forms of glutamic acid decarboxylase in the rat hippocampal formation. Hippocampus. 1994;4:530–545. doi: 10.1002/hipo.450040503. [DOI] [PubMed] [Google Scholar]
- 26.Ikeda M, Kanai H, Akaike M, Tsutsumi S, Sadamatsu M, Masui A, Kato N. Nitric oxide synthase-containing neurons in the hippocampus are preserved in trimethyltin intoxication. Brain Res. 1996;712:168–170. doi: 10.1016/0006-8993(95)01530-2. [DOI] [PubMed] [Google Scholar]
- 27.Jefferys JGR, Traub RD, Whittington MA. Neuronal networks for induced “40 Hz” rhythms. Trends Neurosci. 1996;19:202–208. doi: 10.1016/s0166-2236(96)10023-0. [DOI] [PubMed] [Google Scholar]
- 28.Jonas P, Racca C, Sakmann B, Seeburg PH, Monyer H. Differences in Ca2+ permeability of AMPA-type glutamate receptor channels in neocortical neurons caused by differential GluR-B subunit expression. Neuron. 1994;12:1281–1289. doi: 10.1016/0896-6273(94)90444-8. [DOI] [PubMed] [Google Scholar]
- 29.Kawaguchi Y, Hama K. Fast-spiking non-pyramidal cells in the hippocampal CA3 region, dentate gyrus, and subiculum of rats. Brain Res. 1987;425:351–355. doi: 10.1016/0006-8993(87)90518-x. [DOI] [PubMed] [Google Scholar]
- 30.Kosaka T, Kosaka K, Tateishi K, Hamaoka Y, Yanaihara N, Wu J-Y, Hama K. GABAergic neurons containing CCK-8-like and/or VIP-like immunoreactivities in the rat hippocampus and dentate gyrus. J Comp Neurol. 1985;239:420–430. doi: 10.1002/cne.902390408. [DOI] [PubMed] [Google Scholar]
- 31.Li X-G, Somogyi P, Tepper JM, Buzsáki G. Axonal and dendritic arborization of an intracellularly labeled chandelier cell in the CA1 region of the rat hippocampus. Exp Brain Res. 1992;90:519–525. doi: 10.1007/BF00230934. [DOI] [PubMed] [Google Scholar]
- 32.Liu Y, Fujise N, Kosaka T. Distribution of calretinin immunoreactivity in the mouse dentate gyrus. I. General description. Exp Brain Res. 1996;108:389–403. doi: 10.1007/BF00227262. [DOI] [PubMed] [Google Scholar]
- 33.Lorente de Nó R. Studies on the structure of the cerebral cortex. II. Continuation of the study of the ammonic system. J Psychol Neurol. 1934;46:113–177. [Google Scholar]
- 34.Lübke J, Markram H, Frotscher M, Sakmann B. Frequency and dendritic distribution of autapses established by layer 5 pyramidal neurons in the developing rat neocortex: comparison with synaptic innervation of adjacent neurons of the same class. J Neurosci. 1996;16:3209–3218. doi: 10.1523/JNEUROSCI.16-10-03209.1996. [DOI] [PMC free article] [PubMed] [Google Scholar]
- 35.Marin-Padilla M. Neurons of layer I. A developmental analysis. In: Peters A, Jones EG, editors. Cerebral cortex, Vol I, Cellular components of the cerebral cortex. Plenum; New York: 1984. pp. 447–478. [Google Scholar]
- 36.Martin KAC, Friedlander MJ, Alones V. Physiological, morphological, and cytochemical characteristics of a layer 1 neuron in cat striate cortex. J Comp Neurol. 1989;282:404–414. doi: 10.1002/cne.902820307. [DOI] [PubMed] [Google Scholar]
- 37.McBain CJ, DiChiara TJ, Kauer JA. Activation of metabotropic glutamate receptors differentially affects two classes of hippocampal interneurons and potentiates excitatory synaptic transmission. J Neurosci. 1994;14:4433–4445. doi: 10.1523/JNEUROSCI.14-07-04433.1994. [DOI] [PMC free article] [PubMed] [Google Scholar]
- 38.McCormick DA, Connors BW, Lighthall JW, Prince DA. Comparative electrophysiology of pyramidal and sparsely spiny stellate neurons of the neocortex. J Neurophysiol. 1985;54:782–806. doi: 10.1152/jn.1985.54.4.782. [DOI] [PubMed] [Google Scholar]
- 39.Miles R, Tóth K, Gulyás AI, Hájos N, Freund TF. Differences between somatic and dendritic inhibition in the hippocampus. Neuron. 1996;16:815–823. doi: 10.1016/s0896-6273(00)80101-4. [DOI] [PubMed] [Google Scholar]
- 40.Monyer H, Jonas P. Polymerase chain reaction analysis of ion channel expression in single neurons of brain slices. In: Sakmann B, Neher E, editors. Single-channel recording, 2nd Ed. Plenum; New York: 1995. pp. 357–373. [Google Scholar]
- 41.Ogawa M, Miyata T, Nakajima K, Yagyu K, Seike M, Ikenaka K, Yamamoto H, Mikoshiba K. The reeler gene-associated antigen on Cajal–Retzius neurons is a crucial molecule for laminar organization of cortical neurons. Neuron. 1995;14:899–912. doi: 10.1016/0896-6273(95)90329-1. [DOI] [PubMed] [Google Scholar]
- 42.Scharfman HE. Differentiation of rat dentate neurons by morphology and electrophysiology in hippocampal slices: granule cells, spiny hilar cells and aspiny “fast-spiking” cells. In: Ribak CE, Gall CM, Mody I, editors. The dentate gyrus and its role in seizures. Elsevier; Amsterdam: 1992. pp. 93–109. [PMC free article] [PubMed] [Google Scholar]
- 43.Sholl DA. The organization of the visual cortex in the cat. J Anat. 1955;89:33–46. [PMC free article] [PubMed] [Google Scholar]
- 44.Sik A, Ylinen A, Penttonen M, Buzsáki G. Inhibitory CA1-CA3-hilar region feedback in the hippocampus. Science. 1994;265:1722–1724. doi: 10.1126/science.8085161. [DOI] [PubMed] [Google Scholar]
- 45.Sik A, Penttonen M, Ylinen A, Buzsáki G. Hippocampal CA1 interneurons: an in vivo intracellular labeling study. J Neurosci. 1995;15:6651–6665. doi: 10.1523/JNEUROSCI.15-10-06651.1995. [DOI] [PMC free article] [PubMed] [Google Scholar]
- 46.Soltész I, Deschênes M. Low- and high-frequency membrane potential oscillations during theta activity in CA1 and CA3 pyramidal neurons of the rat hippocampus under ketamine–xylazine anesthesia. J Neurophysiol. 1993;70:97–116. doi: 10.1152/jn.1993.70.1.97. [DOI] [PubMed] [Google Scholar]
- 47.Somogyi P. A specific “axo-axonal” interneuron in the visual cortex of the rat. Brain Res. 1977;136:345–350. doi: 10.1016/0006-8993(77)90808-3. [DOI] [PubMed] [Google Scholar]
- 48.Soriano E, Frotscher M. A GABAergic axo-axonic cell in the fascia dentata controls the main excitatory hippocampal pathway. Brain Res. 1989;503:170–174. doi: 10.1016/0006-8993(89)91722-8. [DOI] [PubMed] [Google Scholar]
- 49.Soriano E, Frotscher M. GABAergic innervation of the rat fascia dentata: a novel type of interneuron in the granule cell layer with extensive axonal arborization in the molecular layer. J Comp Neurol. 1993;334:385–396. doi: 10.1002/cne.903340305. [DOI] [PubMed] [Google Scholar]
- 50.Spruston N, Johnston D. Perforated patch-clamp analysis of the passive membrane properties of three classes of hippocampal neurons. J Neurophysiol. 1992;67:508–529. doi: 10.1152/jn.1992.67.3.508. [DOI] [PubMed] [Google Scholar]
- 51.Staley KJ, Otis TS, Mody I. Membrane properties of dentate gyrus granule cells: comparison of sharp microelectrode and whole-cell recordings. J Neurophysiol. 1992;67:1346–1358. doi: 10.1152/jn.1992.67.5.1346. [DOI] [PubMed] [Google Scholar]
- 52.Steward O. Topographic organization of the projections from the entorhinal area to the hippocampal formation of the rat. J Comp Neurol. 1976;167:285–314. doi: 10.1002/cne.901670303. [DOI] [PubMed] [Google Scholar]
- 53.Stuart GJ, Dodt H-U, Sakmann B. Patch-clamp recordings from the soma and dendrites of neurons in brain slices using infrared video microscopy. Pflügers Arch. 1993;423:511–518. doi: 10.1007/BF00374949. [DOI] [PubMed] [Google Scholar]
- 54.Traub RD, Whittington MA, Stanford IM, Jefferys JGR. A mechanism for generation of long-range synchronous fast oscillations in the cortex. Nature. 1996;383:621–624. doi: 10.1038/383621a0. [DOI] [PubMed] [Google Scholar]
- 55.Tsubokawa H, Ross WN. IPSPs modulate spike backpropagation and associated [Ca2+]i changes in the dendrites of hippocampal CA1 pyramidal neurons. J Neurophysiol. 1996;76:2896–2906. doi: 10.1152/jn.1996.76.5.2896. [DOI] [PubMed] [Google Scholar]
- 56.von Haebler D, Stabel J, Draguhn A, Heinemann U. Properties of horizontal cells transiently appearing in the rat dentate gyrus during ontogenesis. Exp Brain Res. 1993;94:33–42. doi: 10.1007/BF00230468. [DOI] [PubMed] [Google Scholar]
- 57.Wahle P, Beckh S. A method of in situ hybridization combined with immunocytochemistry, histochemistry, and tract tracing to characterize the mRNA expressing cell types in heterogeneous neuronal populations. J Neurosci Methods. 1992;41:153–166. doi: 10.1016/0165-0270(92)90057-k. [DOI] [PubMed] [Google Scholar]
- 58.Wang X-J, Buzsáki G. γ Oscillation by synaptic inhibition in a hippocampal interneuronal network model. J Neurosci. 1996;16:6402–6413. doi: 10.1523/JNEUROSCI.16-20-06402.1996. [DOI] [PMC free article] [PubMed] [Google Scholar]
- 59.Whittington MA, Traub RD, Jefferys JGR. Synchronized oscillations in interneuron networks driven by metabotropic glutamate receptor activation. Nature. 1995;373:612–615. doi: 10.1038/373612a0. [DOI] [PubMed] [Google Scholar]
- 60.Witter MP. Connectivity of the rat hippocampus. In: Chan-Palay V, Köhler C, editors. The hippocampus—new vistas. Liss; New York: 1989. pp. 53–89. [Google Scholar]