

Abstract
Autophosphorylation of calcium/calmodulin-dependent protein kinase II (CaMKII) at threonine-286 produces Ca2+-independent kinase activity and has been proposed to be involved in induction of long-term potentiation by tetanic stimulation in the hippocampus. We have used an immunocytochemical method to visualize and quantify the pattern of autophosphorylation of CaMKII in hippocampal slices after tetanization of the Schaffer collateral pathway. Thirty minutes after tetanic stimulation, autophosphorylated CaM kinase II (P-CaMKII) is significantly increased in area CA1 both in apical dendrites and in pyramidal cell somas. In apical dendrites, this increase is accompanied by an equally significant increase in staining for nonphosphorylated CaM kinase II. Thus, the increase in P-CaMKII appears to be secondary to an increase in the total amount of CaMKII. In neuronal somas, however, the increase in P-CaMKII is not accompanied by an increase in the total amount of CaMKII. We suggest that tetanic stimulation of the Schaffer collateral pathway may induce new synthesis of CaMKII molecules in the apical dendrites, which contain mRNA encoding its α-subunit. In neuronal somas, however, tetanic stimulation appears to result in long-lasting increases in P-CaMKII independent of an increase in the total amount of CaMKII.
Our findings are consistent with a role for autophosphorylation of CaMKII in the induction and/or maintenance of long-term potentiation, but they indicate that the effects of tetanus on the kinase and its activity are not confined to synapses and may involve induction of new synthesis of kinase in dendrites as well as increases in the level of autophosphorylated kinase.
Keywords: long-term potentiation, protein phosphorylation, synapse, synaptic regulation, synaptic plasticity, immunocytochemistry, hippocampal slices
Calcium/calmodulin-dependent protein kinase II (CaMKII) is believed to play a crucial role in synaptic plasticity in the hippocampal CA1 region. CaMKII is expressed at unusually high levels in the forebrain and cerebellum, making up ∼2% of total protein in the hippocampus. Approximately half of the kinase behaves as a soluble enzyme after homogenization (Bennett et al., 1983) and can be visualized in the cytosol of neuronal cell bodies (Ouimet et al., 1984;Erondu and Kennedy, 1985; Apperson et al., 1996). In addition, a large portion is particulate and is concentrated at synapses in both presynaptic and postsynaptic compartments (Kennedy et al., 1983; Ouimet et al., 1984; Benfenati et al., 1992). The concentration of CaMKII is especially high in the postsynaptic density of glutamatergic synapses, a specialization of the submembranous cytoskeleton that lies under the postsynaptic membrane and is contiguous with the synaptic cleft (Kennedy et al., 1983, 1990). In the forebrain, the CaM kinase II holoenzyme is an oligomer comprising two homologous catalytic subunits, a major α-subunit, and a minor β-subunit (Bennett et al., 1983;Miller and Kennedy, 1985). Soon after it is activated by calcium and calmodulin, CaMKII becomes autophosphorylated at a site adjacent to the calmodulin-binding domain (threonine-286) (Miller and Kennedy, 1986). Until this site is dephosphorylated by cellular phosphatases, the kinase remains active, although at a reduced rate, even after the concentration of calcium falls back to baseline (Miller and Kennedy, 1986; Miller et al., 1988).
Several roles have been postulated for this autophosphorylation in the induction or maintenance of synaptic plasticity (Miller and Kennedy, 1986; Lisman and Goldring, 1988; Kennedy et al., 1990). Experiments with transgenic mice in which the α-subunit was deleted by homologous recombination indicate that both long-term potentiation (LTP) and long-term depression (LTD) are severely disrupted in hippocampal slices from the mutants (Silva et al., 1992b; Stevens et al., 1994). Furthermore, the mutant mice perform poorly in the Morris water maze, a test that measures capacity for spatial memory in rodents (Silva et al., 1992a). As the behavior of the mice was tested more fully, it became evident that the homozygous mice have a form of limbic epilepsy (Butler et al., 1995). In addition, mice heterozygous for the deletion display abnormal fear and aggression (Chen et al., 1994).
Although the mouse mutant studies provide useful information about the molecular requirements for normal brain function and synaptic plasticity, they do not clarify the molecular mechanisms underlying each form of plasticity. For example, it is still unclear which substrates for CaMKII are most crucial for induction of LTP or LTD and which elements in the phosphorylation cascades determine the rate of onset and the persistence of these forms of plasticity. Both biochemical evidence and physiological evidence suggest that CaMKII may regulate glutamate receptors directly or indirectly (McGlade-McCulloh et al., 1993; Pettit et al., 1994; Liao et al., 1995; Lledo et al., 1995), although the significance of these mechanisms for LTP is still controversial (Kullmann et al., 1996). In addition, CaMKII phosphorylates an identified site on the cytosolic tail of the NR2B-subunit of the NMDA receptor in vitro and in vivo (Omkumar et al., 1996). The regulatory significance of this phosphorylation event is still unknown.
A more complex hypothesis for involvement of autophosphorylation of CaMKII in the induction of synaptic plasticity was proposed byMayford et al. (1995) who recently introduced into mice a transgene encoding a mutated α-subunit with an aspartate residue substituted for threonine-286. The kinase expressed from this gene has constitutive enzymatic activity (Fong et al., 1989). Mayford and colleagues found that the frequency of extracellular stimulation at which LTP and LTD are induced is altered in these mice, such that LTD is induced at frequencies that normally produce LTP. They postulated that CaMKII controls a sliding threshold for induction of the two opposing forms of synaptic plasticity. Such a sliding threshold for induction of different forms of plasticity (called metaplasticity) has been postulated previously on both theoretical and experimental grounds (Bear, 1995; Abraham and Bear, 1996). Thus, the available evidence suggests that CaMKII plays more than one role in the regulation of synaptic strength.
The purpose of the study presented here was to test and refine hypotheses about the mode of action of CaMKII during synaptic plasticity by visualizing changes in autophosphorylation of CaMKII in neurons and synapses after manipulations that alter synaptic strength. We have developed a semiquantitative immunohistochemical method for visualizing autophosphorylated CaMKII (P-CaMKII) in fixed hippocampal slices (Kindler and Kennedy, 1996). This method makes use of a phosphosite-specific monoclonal antibody that recognize CaMKII only when it is phosphorylated at threonine-286 and a complementary rabbit antiserum that recognizes CaMKII only when it is not phosphorylated at threonine-286 (Patton et al., 1991, 1993). Here, we demonstrate that 30 min after tetanization of the Schaffer collateral pathway in hippocampal slices, substantial increases in autophosphorylation of CaMKII are evident in dendrites in stratum radiatum and in neuronal somas in area CA1 located within ∼1 millimeter of the electrode.
MATERIALS AND METHODS
Antibodies. Monoclonal antibody 22B1 (Patton et al., 1993) was prepared from mouse ascites fluid by precipitation with 50% saturated NH4SO4. The pellet was dissolved in 25 mm Tris-HCl, pH 7.5, and dialyzed against the same buffer. Protein concentrations, determined by the method of Peterson (1983), ranged from 10 to 12 mg/ml. Rabbit antiserum against nonphosphorylated CaMKII (NP-CaMKII) was raised and affinity-purified as described in Patton et al. (1993), and the solutions were stored frozen in aliquots at −80°C.
Electrical stimulation of slices. Hippocampal slices were prepared according to the method of Madison and Nicoll (1988). Young adult (6 to 7 weeks) male Sprague Dawley rats were anesthetized with halothane, then decapitated, and their brains were placed in ice-cold artificial CSF (ACSF; 119 mm NaCl, 2.5 mm KCl, 1.3 mm MgSO4, 2.5 mmCaCl2, 1 mmNaH2PO4, 26.2 mmNaHCO3, and 11 mmd-glucose). Hippocampi were sectioned into 500 μm slices using a manual tissue chopper and maintained in an interface chamber gassed with 95% 02/5% CO2 at room temperature (22°–23°C) for at least 2 hr before experiments. For electrophysiology, slices were transferred to a submersion chamber and superfused continuously with oxygenated ACSF at room temperature. One extracellular recording electrode (filled with 3 m NaCl or with oxygenated ACSF) and two tungsten stimulating electrodes were placed in stratum radiatum of the CA1 region (Fig. 1). The stimulating electrodes were positioned on opposite sides of the recording electrode, ∼800 μm apart, and two independent sets of inputs from the Schaffer collateral/commissural pathway were recorded by alternate stimulation of each electrode every 15 sec (i.e., 30 sec interstimulus interval for each pathway). The positions of the recording and stimulating electrodes were recorded photographically for several experiments to compare with subsequent confocal images. The slope of the field EPSP was measured (initial 1–2 msec), and the baseline stimulus intensity was adjusted to elicit a response of ∼0.1–0.2 mV/msec. LTP was induced by delivering four trains of high-frequency stimulation (100 Hz for 1 sec) with an intertrain interval of 30 sec. An increase of 25% was used as the criterion to establish successful induction of LTP. Slices were fixed at the indicated times in ice-cold 4% paraformaldehyde/0.2% glutaraldehyde for 1 hr. All values for electrophysiology data are expressed as mean percent of baseline field EPSP slope ± SEM.
Fig. 1.

Arrangement of electrodes for stimulation of hippocampal slices. Two stimulating electrodes were placed ∼800 μm apart in stratum radiatum and used to stimulate different groups of axons in the Schaffer collateral pathway. Note that although each electrode stimulated distinct sets of axons, the two groups of axons usually overlap spatially as they progress through stratum radiatum, because the trajectory of axons of the Schaffer collateral pathway is quite tortuous (Ishizuka et al., 1990). A recording electrode was placed between the stimulating electrodes to record synaptic EPSPs. As described in Materials and Methods, both stimulating electrodes were used to deliver a monitoring stimulus to each pathway every 30 sec. A brief tetanic stimulation was delivered through one of the stimulating electrodes after 30 min of recording, and the monitoring stimulus was continued for an additional 30 min.
Immunostaining of slices for visualization of P-CaMKII.Slices were fixed and stained by a modification of the method described by Kindler and Kennedy (1996). Slices were fixed by rapid immersion in ice-cold 4% paraformaldehyde/0.2% glutaraldehyde in 0.1m sodium phosphate buffer, pH 7.4. They were left in the fixative for 1 hr, then transferred to ice-cold 0.02 mphosphate buffer, pH 7.4, 0.9% NaCl (PBS) and stored at 4°C overnight. Sections (50 μm) were cut from each slice with a vibratome (Pelco, Ted Pella, Redding, CA). The first 50 μm section, which was often incomplete, was discarded and the next four to six sections were collected for staining in individual wells. The sections were washed with each of the following solutions: PBS plus 0.7% Triton X-100, 1 hr; twice with PBS, 10′ each; 100 mm glycine in PBS, 1 hr; distilled water, 10′; 1% Na tetrahydridoborate hydride, 20′; distilled water, 10′; Preblock solution (0.05% Triton X-100, 5% normal goat serum, 0.02 m phosphate buffer, pH 7.4, 0.45 mNaCl), 90 min. Primary antibodies were diluted in Preblock solution. Anti-phosphokinase monoclonal antibody 22B1 was used at a final concentration of ∼0.3 mg/ml and affinity-purified nonphosphokinase specific polyclonal rabbit antiserum at a final concentration of ∼20 μg/ml. Each section was incubated overnight in 250 μl of primary antibody at 4°C on a shaker, then washed three times for 30′ each with Preblock solution at room temperature and incubated for 1 hr with secondary antibodies diluted in Preblock solution. For these experiments, we used a 1:50 dilution (∼200 μg/ml) of fluorescein-conjugated goat anti-mouse IgG (Cappel, Organon Teknika, Durham, NC) and a 1:50 dilution (∼20 μg/ml) of Cy3-conjugated goat anti-rabbit IgG (Chemicon International, Temecula, CA). Sections were washed once for 30′ at RT with Preblock solution, twice with PBS, and a fourth time for 1 min with 100 mmNaHCO3, pH 9.0, and mounted in 100 mmNaHCO3, pH 9.0/80% glycerol containing 1 mg/mlp-phenylenediamine to reduce bleaching. In later experiments, 4% n-propyl gallate was substituted forp-phenylenediamine.
Data collection on the laser-scanning fluorescence confocal microscope. Observations were made with a Zeiss LSM 310 confocal laser scanning microscope (Zeiss GmbH, Oberkochen, Germany). Fluorescein was excited with the 488 nm laser line attenuated to 1/10th of the maximal intensity and Cy3 was excited with the 543 nm line without attenuation. Light emitted from each fluorophore was split by a dichroic mirror into two beams, one of which is filtered through a 590 nm long-pass filter to visualize fluorescein, and the other through a 515–560 nm bandpass filter to visualize Cy3. The filtered beams were detected by separate photomultiplier tubes. Switching of illumination between lasers was computer-controlled, and dual images were collected sequentially. There was no significant light spillover between the two channels under the conditions we used. Images were recorded with a 10× objective [Plan-NeoFluor, 0.30 numerical aperture (NA), Zeiss] at zoom 1 (2.5 μm per pixel), or a 40× oil immersion objective (Plan-Apochromat, 1.3 NA, Zeiss) at zoom 1 (0.65 μm per pixel). Data presented in this paper were recorded with a pinhole size set to 20. The brightness and contrast settings of the photomultiplier tube output were optimized in each experiment for the image with the brightest staining so that the data filled the dynamic range of 256 brightness units (eight bits), without saturation. Settings were then kept constant for recording of all data within one experiment so that control and experimental images could be compared accurately. We determined that the average brightness of an image falls approximately linearly as the contrast is decreased over a wide range; thus, we can compare the brightnesses of different images without introducing serious nonlinearities (data not shown). For the 10× objective, the theoretical thickness of the optical section was ∼20 μm, and data were collected from the brightest plane of each section, which was near the middle of the section. For the 40× objective, the theoretical optical section was 1.2 μm and data were collected from optical sections located 2–3 μm beneath the upper surface of each section, because the image intensity decreased in deeper planes of the tissue.
Image processing. Images were saved in TIFF file format as an array of 512 × 512 pixels with brightness values ranging from 0 to 255. To obtain an image of the entire CA1 area of each section through the 10× objective, two to three sets of overlapping double images were recorded from each slice, one set of “phosphokinase” images (fluorescein) and another set of “nonphosphokinase” images (Cy3). The images were opened in Photoshop (Adobe Systems, Mountain View, CA) and assembled into montages. This task was accomplished with the help of macro functions written in Tempo II Plus (Affinity Microsystems, Boulder, CO). Before assembly into montages, the images were converted from gray scale to a “color look-up table” in which brightness values from 0 to 192 are displayed in color graded from dark blue to white, and brightness values from 193 to 255 are displayed in color ranging from white to bright red. This presentation facilitates identification of the brightest areas in each section. For printing, the images were converted by bicubic interpolation to the appropriate image size and pixel density.
Quantitative analysis of images. We used macro programs written with the aid of the scientific data visualization and analysis program MacPhase (Otter Solution, Whitesboro, NY) to collect the average brightness values from regions of interest (ROI) in the digital images. For each slice, we first determined which of the five or six 50 μm sections had the highest average brightness of P-CaMKII staining. We then used that section and the slices adjacent to it (total of three sections for each slice) for the analysis as described under Results. The data were transferred to Excel (Microsoft, Redmond, WA) for statistical analysis.
RESULTS
We have examined the distributions of P-CaMKII and NP-CaMKII 30 min after tetanization of one pathway in a “two-pathway” experiment as diagrammed in Figure 1. Hippocampal slices were prepared from 4- to 6-week-old rats, and two stimulating electrodes were placed in stratum radiatum ∼800 μm apart. Synaptic potentials evoked by stimulation were recorded with a glass electrode placed between the two stimulating electrodes. Each of the electrodes received a test stimulus every 30 sec as described in Materials and Methods. After 30 min of test stimulation and recording to establish a stable baseline slope of the field EPSP, experimental slices received tetanic stimulation at one electrode (four trains of 100 Hz for 1 sec with an intertrain interval of 30 sec). The slope of the field EPSP was recorded every 30 sec for an additional 30 min after tetanic stimulation, then the slice was fixed and stained as described in Materials and Methods. Of the 11 slices that were tetanized, 8 developed LTP in the tetanized pathway; these are referred to as “LTP” slices (Fig. 2). Three did not develop LTP and are referred to as “tetanized but no LTP” controls. We performed several additional control experiments on separate slices. One set (10 slices) was superfused alongside slices from the same animal that were stimulated electrically; these slices received no electrical stimulation and are referred to as “chamber only” controls. A second set (4 slices) was placed in the superfusion chamber, impaled with electrodes, and stimulated with only test stimuli for 1 hr; these are referred to as “stimulation only” controls. A third set (3 slices) was superfused in the chamber with Ringer’s solution containing APV as described in Materials and Methods; these slices were stimulated and tetanized in the same manner as the experimental slices and are referred to as “tetanized with APV” controls.
Fig. 2.

Electrophysiological recording from two slices that were subsequently analyzed for CaMKII staining. The stimulation paradigm was as described in Materials and Methods and in the legend to Figure 1. Recordings from the tetanized pathways are shown on theleft and those from corresponding control pathways are shown on the right. Tetanus was applied at the time indicated by the arrow. The tetanized pathways exhibited a 60% (DK 325) and 25.5% (ES 220) increase in synaptic strength, respectively, measured 20–30 min after tetanic stimulation. The distribution of P-CaMKII and NP-CaMKII staining in one section from ES 220 is shown in Figure3A and in one section from DK 325 is shown in Figure3C.
All slices were fixed at appropriate times and stained as described in Materials and Methods to visualize the distribution of P-CaMKII and NP-CaMKII.
Distribution of P-CaMKII and NP-CaMKII in “LTP” and “chamber control” slices
Figure 3 depicts examples from three different experiments of double-staining for P-CaMKII and NP-CaMKII in area CA1 of sections made from LTP slices (Fig. 3A–C,top image in each) and the corresponding chamber control slices (Fig. 3A–C, bottom image). The levels of P-CaMKII (right images) and NP-CaMKII (left images) were relatively evenly distributed in area CA1 of the chamber control slices, although levels of both were consistently lower in stratum lacunosum moleculare than in other anatomical regions of area CA1 (see Fig. 4 for diagram of anatomical regions). Figure 3B (left image) depicts a rare example of a bright patch of staining for NP-CaMKII in a chamber control slice. In contrast to the chamber controls, we noted that “naive” slices, which had been rested for 2 hr but had not been placed in the superfusion chamber, often had patches of bright staining for P-CaMKII (data not shown), suggesting that superfusion alone helps to stabilize the neurons at similar baselines of P-CaMKII.
Fig. 3.
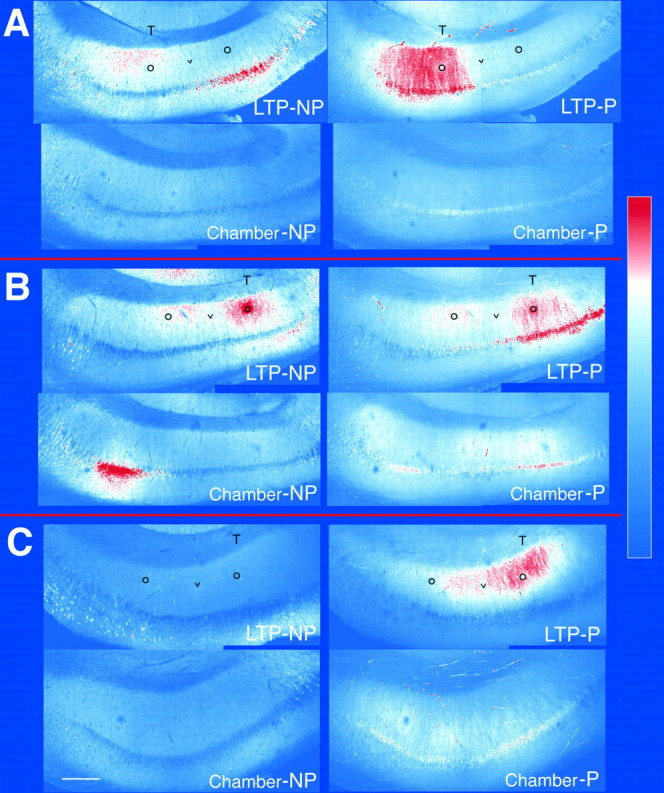
Staining for P-CaMKII and NP-CaMKII in sections from three tetanized slices and their corresponding chamber control slices. Tetanized slices (top images in each set) were fixed 30 min after tetanic stimulation was delivered through the stimulating electrode located on the side marked with aT. Black circles mark the approximate positions of the two stimulating electrodes. A black vmarks the approximate position of the recording electrode. Chamber control slices (bottom images) were fixed after 1 hr of superfusion alongside the tetanized slice. Sections cut from the slices were double-immunolabeled for P-CaMKII (right) and NP-CaMKII (left) as described in Materials and Methods. Each picture is a montage of two 512 × 512 images recorded by the confocal microscope through a 10× lens. The montages were converted into color according to the color look-up table depicted at theright of the figure. In sections from the tetanized slices, increased labeling of P-CaMKII is evident in the pyramidal somas and dendrites of stratum radiatum on the side that received tetanic stimulation. The elevated labeling of P-CaMKII in stratum radiatum gradually decreases with distance from the tetanizing electrode. Increased labeling for NP-CaMKII on the side of the slice that received tetanic stimulation is also evident in stratum radiatum of sections depicted in A and B.A, Fourth sections from tetanized and chamber control slices from experiment ES 220. B, Fourth sections from tetanized and chamber control slices from experiment DK 211.C, Third sections from tetanized and chamber control slices from experiment DK 325. Scale bar, 250 μm.
Fig. 4.
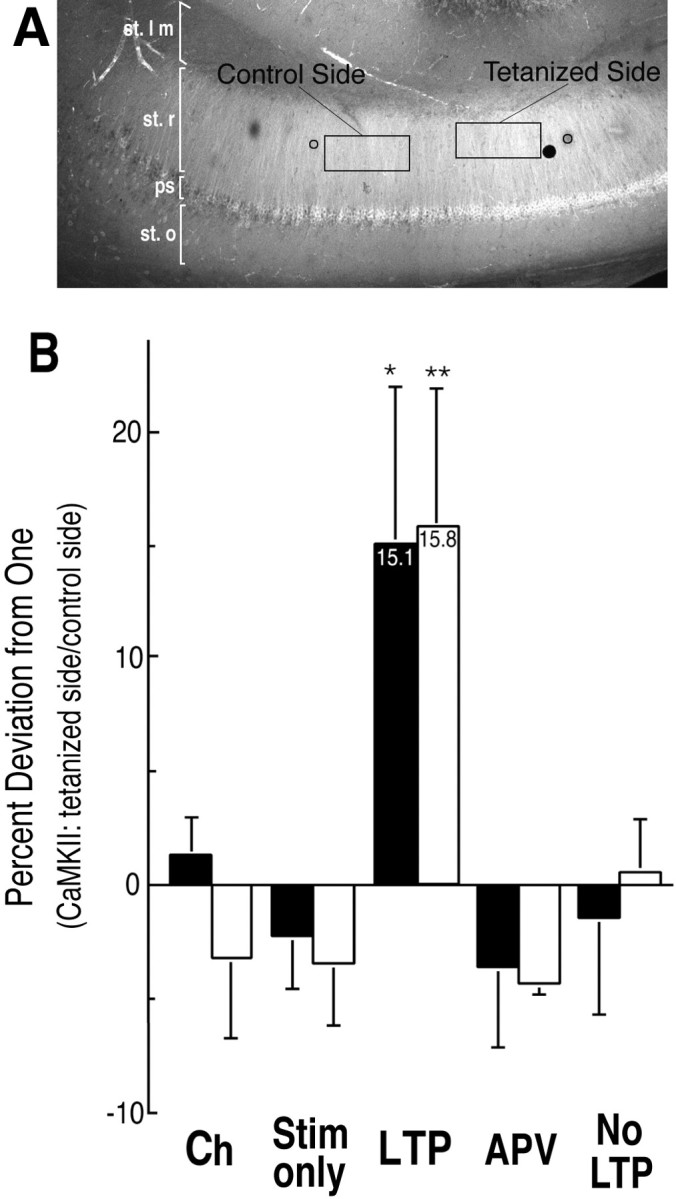
Quantitative analysis of the ratio of staining on the tetanized side of area CA1 to that on the control side (stratum radiatum). A, Location of ROIs for quantitative analysis of staining. Average brightness values were obtained for each section from two rectangular ROIs (50 × 100 pixels) as displayed in the figure and described in Materials and Methods. One ROI was drawn with MacPhase software on each original image between the stimulating electrode that delivered the tetanic stimulation and the recording electrode. A second ROI was drawn between the control stimulating electrode and the recording electrode. The ROIs drawn on P-CaMKII images were then transferred to the corresponding images of NP-CaMKII. The illustration shows the positions of the ROIs for the third section of the tetanized slice from experiment DK 211.Black circles indicate the approximate positions of the stimulating electrodes. The large black dot is a piece of debris on the slide that was excluded from the ROI.B, Percent deviation from 1.0 of the ratio of staining on tetanized side of slice to staining on control side of slice (stratum radiatum). The data from Table 1 are plotted as percent deviation from 1.0 of the ratio between staining on the tetanized side and staining on the control side. ANOVA indicated that the four control groups were not significantly different from each other. Statistical comparison of staining for both P-CaMKII and NP-CaMKII in the LTP group with each of the controls by t test revealed that the percent deviation of the LTP group was significantly higher than for each of the controls. Ch, Chamber only; Stim only, stimulation only; LTP, tetanized with LTP;APV, tetanized with APV; No LTP, tetanized but no LTP (*p < 0.05 for LTP versus Ch, Stim only, APV, and No LTP; **p < 0.02 for LTP versus Ch, Stim only, APV, and No LTP.
In each individual experiment, the contrast settings of the confocal microscope were optimized, as described in Materials and Methods, while viewing the brightest section, which was usually from the tetanized slice. All other sections, including those from the control slices, were then imaged at these settings so that the images of control and experimental slices could be compared directly. Consequently, the images of chamber control slices show very few areas of high brightness, which would be red.
In eight of eight experiments, the staining for both P-CaMKII and NP-CaMKII in slices that developed LTP was brighter on the side of area CA1 that received tetanic stimulation. Three of these experiments are shown in Figure 3A–C (top images). In six of these experiments, staining for P-CaMKII was also brighter on the tetanized side in neuronal cell bodies. In seven of the eight experiments, staining for NP-CaMKII was brighter on the tetanized side in the dendrites of stratum radiatum; however, in neuronal cell bodies, staining for NP-CaMKII was brighter on the tetanized side in only three of the eight experiments.
Both the magnitude and the pattern of differential staining were variable. In one experiment (Fig. 3A, top right), the staining for P-CaMKII was much brighter on the tetanized side, with a sharp demarcation visible in all sections. In this experiment, staining for NP-CaMKII (Fig. 3A, left) was correspondingly brighter on the tetanized side in stratum radiatum, but not in neuronal cell bodies. In the other seven LTP experiments analyzed, staining for P-CaMKII was brighter on the tetanized side in most sections, but the bright staining extended into the nontetanized side in gradients of varying magnitudes (Fig.3B,C, top right).
Quantitative analysis of changes in P-CaMKII and NP-CaMKII produced in stratum radiatum by tetanic stimulation
We devised algorithms for assessing the statistical significance of changes in the distribution of P-CaMKII and NP-CaMKII produced by tetanic stimulation. First, we evaluated the average difference in staining for both P-CaMKII and NP-CaMKII between areas in stratum radiatum adjacent to the tetanized stimulating electrode and areas adjacent to the control stimulating electrode. To do this, we first identified the section of each slice with the highest overall average brightness of staining for P-CaMKII. The following analysis was then performed on this section and its immediately adjacent sections (three sections total for each slice). We collected average brightness values from rectangular ROIs of fixed size positioned on corresponding P-CaMKII and NP-CaMKII images between each of the stimulating electrodes and the recording electrode (Fig. 4A). Brightness averages from the control and tetanized sides of the three chosen sections were summed for each of the slices. Finally, we computed the ratios of the summed brightnesses from the tetanized side to those from the control side (Table 1, Fig.4B). ANOVA indicated that the ratios for the control groups, chamber, stimulation only, tetanized with APV, and tetanized but no LTP did not differ significantly from each other (p < 0.79 for P-CaMKII staining;p < 0.75 for NP-CaMKII staining). Both P-CaMKII and NP-CaMKII staining of the LTP group, however, differed significantly from the control groups (F = 7.4 and p< 4 × 10⁻⁵ for P-CaMKII staining,F = 5.02 and p < 0.001 for NP-CaMKII staining). Analysis by Student’s t test (unpaired, one-tailed) indicated that the ratios for the LTP group were significantly higher than those for each of the control groups (see Fig. 4B for p values).
Table 1.
Average ratio of staining on the tetanized side of area CA1 to that on the control side: stratum radiatum
| Experimental group | n | P-CaMKII | NP-CaMKII | ||
|---|---|---|---|---|---|
| Ratio | SEM | Ratio | SEM | ||
| Chamber only | 10 | 1.013 | 0.017 | 0.968 | 0.035 |
| Stimulation only | 4 | 0.978 | 0.024 | 0.966 | 0.028 |
| LTP | 8 | 1.151 | 0.069 | 1.158 | 0.061 |
| Tetanized with APV | 3 | 0.964 | 0.035 | 0.957 | 0.005 |
| Tetanized but no LTP | 3 | 0.986 | 0.043 | 1.006 | 0.023 |
Tetanized slices were fixed and cut into five to six 50 μm sections. Staining for P-CaMKII and for NP-CaMKII was recorded in area CA1 of each section by laser-scanning confocal microscopy, as described in Materials and Methods and in the legend to Figure 3. Average brightness values were obtained for each section from two rectangular ROIs (50 × 100 pixels) as described in Figure4A. The ratio of the average brightness on the tetanized side over the average brightness on the control side was calculated for each section. The three adjacent sections with the brightest staining for P-CaMKII were chosen for each tetanized slice, and the average brightnesses on tetanized and control sides were summed. The ratio between the sums was calculated to obtain the ratio for the slice. A corresponding ratio was calculated for each control slice. Table 1 displays the average of these ratios ± SEM for each of the five groups of slices.
As described above, in most experiments the increased brightness on the tetanized side of area CA1 extended beyond the position of the recording electrode into the area nearer the control electrode (e.g., Fig. 3B,C). Hence, the ratio plotted in Figure 4 reflects the steepness of the gradient of brightness from the tetanized electrode to the control electrode, rather than the absolute magnitude of the effect of tetanus on CaMKII. This method of analysis may underestimate the effect of tetanus. Therefore, we tried various strategies to obtain a measure more reflective of the magnitude of the effect of tetanus. For example, we computed the ratio of average brightness from the tetanized side of stratum radiatum to average brightness from an ROI positioned in stratum oriens (basal dendrites). The variation of this measure within each set of slices, however, was too great to permit statistically significant comparisons between the sets (data not shown).
Quantitative analysis of changes in P-CaMKII and NP-CaMKII in neuronal somas produced by tetanic stimulation
Changes in P-CaMKII associated with tetanic stimulation were not limited to stratum radiatum, but were also evident in neuronal cell bodies in area CA1 (Figs. 3A,B,4A). We performed an analysis of the cell body layer similar to that described above for stratum radiatum, except that ROIs were drawn freehand around the cell body layers on the half of area CA1 closest to the control stimulating electrode or closest to the tetanized stimulating electrode (Table 2; Fig.5). ANOVA indicated that the ratios for three of the control groups did not differ significantly from each other (p < 0.61 for P-CaMKII staining;p < 0.95 for NP-CaMKII staining). The P-CaMKII staining of the LTP group, however, was significantly different from the three control groups (F = 6.78 andp < 0.0004). In contrast to the data for stratum radiatum, the staining was significantly different from controls only for P-CaMKII, and not for NP-CaMKII (F = 0.34 andp < 0.78). Analysis by Student’s t test (unpaired, one-tailed) indicated that the ratios for P-CaMKII staining of the LTP group were significantly higher than the ratios for each of the control groups (see Fig. 5 for p values).
Table 2.
Average ratio of staining on the tetanized side of area CA1 to that on the control side: neuronal somas
| Experimental group | n | P-CaMKII | NP-CaMKII | ||
|---|---|---|---|---|---|
| Ratio | SEM | Ratio | SEM | ||
| Chamber only | 10 | 1.032 | 0.026 | 0.898 | 0.085 |
| Stimulation only | 4 | 1.000 | 0.026 | 0.933 | 0.086 |
| LTP | 8 | 1.172 | 0.060 | 0.986 | 0.090 |
| Tetanized with APV | 3 | 1.027 | 0.023 | 0.933 | 0.030 |
The staining of the pyramidal cell body layer was analyzed in a manner similar to that described in the legend to Table 1. We compared the average brightness of staining on the tetanized side of each slice with the average brightness of staining on the control side of the slice. The ROIs were drawn by free hand on images of staining for P-CaMKII around areas of the pyramidal layer on tetanized and control sides of each section. After obtaining the average brightness within the ROI, it was transferred to the NP-CaMKII image with the use of MacPhase Software. Ratios were obtained for each slice as described in Table 1. Table 2 displays the average of these ratios ± SEM for each of four groups of slices.
Fig. 5.
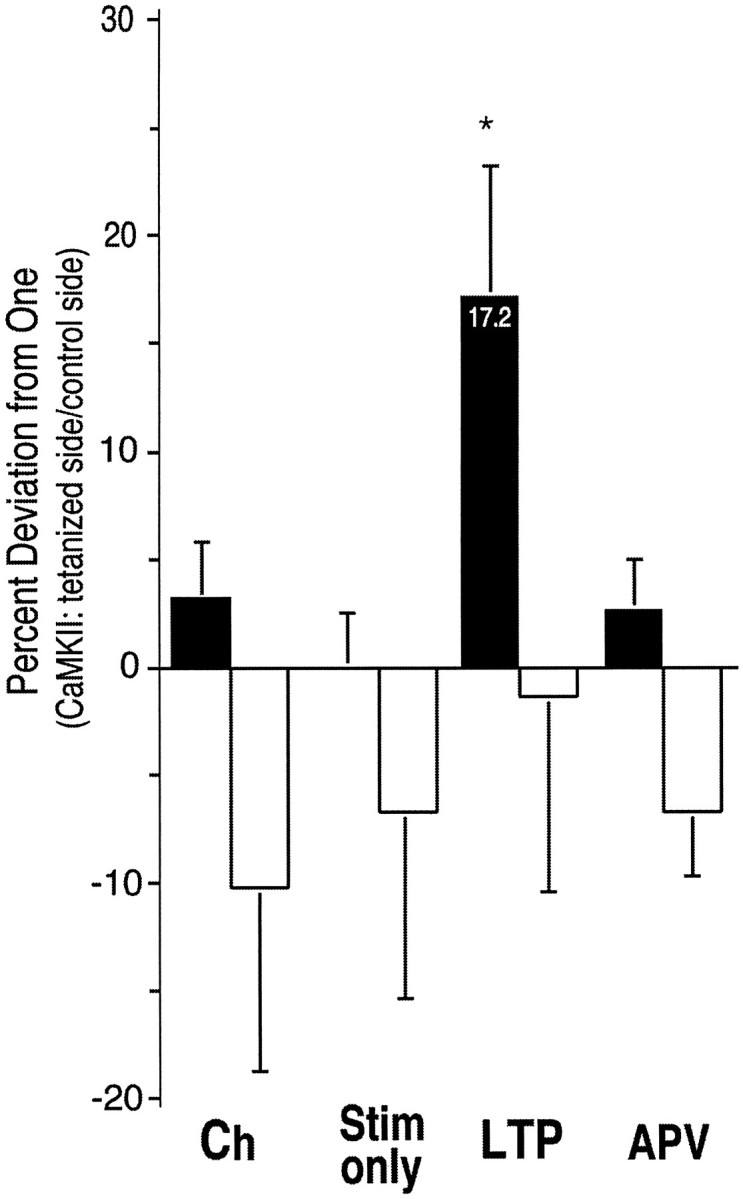
Percent deviation from 1.0 of the ratio of staining on tetanized side of slice to staining on control side of slice (CA1 pyramidal somas). The data from Table 2 are plotted as percent deviation from 1.0 of the ratio between staining on the tetanized side and staining on the control side. ANOVA indicated that the three control groups were not significantly different from each other. Staining for NP-CaMKII in the LTP group also did not differ significantly from the controls. Statistical comparison of staining for P-CaMKII in the LTP group with each of the controls by ttest revealed that the percent deviation of the LTP group was significantly higher than that for each of the controls. Abbreviations are as in Figure 4; *p < 0.03 for LTP versus Ch, Stim only, and APV, respectively.
For two reasons, the data from the cell body layer, particularly the data for NP-CaMKII, were more variable than that from stratum radiatum. First, the freehand ROIs were smaller than the rectangular ROI used in the analysis of stratum radiatum. Second, the staining of cell bodies for NP-CaMKII was generally low (Fig. 3, left). Thus, the ratios of these low numbers were highly variable. Because the variance was too large to permit a reliable conclusion, we have not shown the data for somas of the “tetanized but no LTP” control group.
High-resolution images of stratum radiatum on tetanized and control sides of hippocampal slices
We found that low-power (10×) images provided the best indication of global changes in autophosphorylation of CaMKII produced by tetanic stimulation of the Schaffer collateral pathway. However, it is also of interest to know the distribution of P-CaMKII and NP-CaMKII within dendrites, synapses, and neuronal somas before and after tetanic stimulation. Figure 6 depicts several high-power images (40× objective, 1.3 NA) taken from a section adjacent to that shown in the top image of Figure 3A. For this figure, we enlarged the images twofold and increased the pixel density by bicubic interpolation with Photoshop software for printing. It is evident that staining for P-CaMKII in the dendrites on both the tetanized and the control sides of the slice is brightest at small spots (Fig. 6, black arrows) with the approximate dimensions of synaptic sites or spines. We have not yet rigorously proven that the spots indeed represent synapses. For NP-CaMKII, the most intense staining in the dendrites was present in sections of dendritic shafts (white arrows) as well as in small spots that may represent synaptic sites. In neuronal somas, staining for both P-CaMKII and NP-CaMKII was present throughout the cytosol.
Fig. 6.
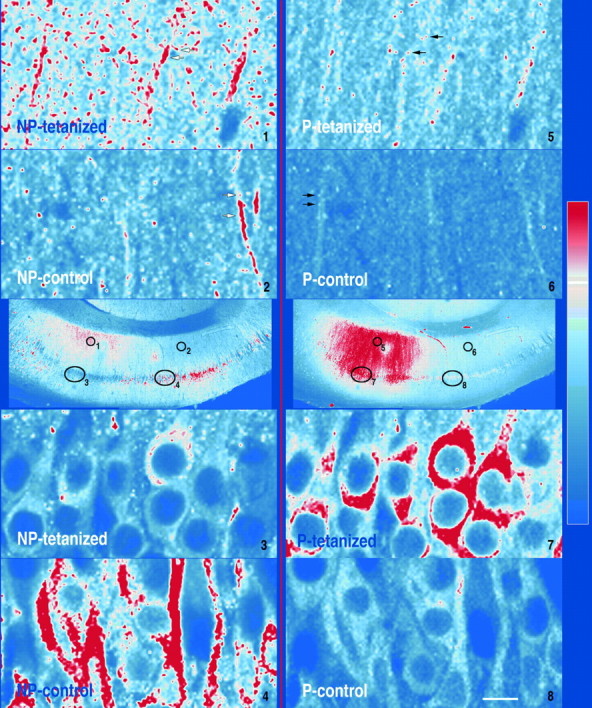
High-resolution images from a tetanized section stained for P-CaMKII and NP-CaMKII. Images were recorded with a 40× lens (1.3 NA) from several areas of section 5 from the tetanized slice in experiment ES 220. The approximate locations of the high-resolution images are marked with black ovals andnumbers on the reference image (10× lens) in the center of the figure. NP-CaMKII staining is shown on the left; P-CaMKII staining is shown on the right. Black arrows indicate brightest staining for P-CaMKII in the dendrites on both the tetanized and the control sides of the slice at small spots with the approximate dimensions of synaptic spines.White arrows indicate brightest staining for NP-CaMKII in sections of dendritic shafts and in small spots with the approximate dimensions of synaptic spines. Scale bars: high-resolution images, 10 μm; reference images, 250 μm.
Images of dendrites and somas from the tetanized and control sides of the slice were processed identically. Hence, the differences in brightness of P-CaMKII images from the same experiment are proportional to real differences in the amount of P-CaMKII in each section. Similarly, differences in brightness of the NP-CaMKII images from the same experiment are proportional to differences in the amount of NP-CaMKII in each section. However, differences in brightness between a P-CaMKII image and the corresponding NP-CaMKII image are not proportional to real differences in the concentrations of P-CaMKII and NP-CaMKII in the section. This is because the contrast and brightness of the microscope are set independently for the fluorescein and Cy3 channels that are used to record P-CaMKII and NP-CaMKII, respectively. Thus, in the 10× calibration images in the center of Figure 6, the P-CaMKII image is brighter on the tetanized side of stratum radiatum than in the same area in the corresponding NP-CaMKII image, whereas, the opposite is the case for the 40× images of stratum radiatum portrayed at the top of Figure 6. Despite this technical limitation, it appears that the brightest staining for P-CaMKII in the tetanized dendrites is concentrated in small spots that may represent individual synaptic sites.
Relationship between changes in P-CaMKII and NP-CaMKII and generation of LTP
The ratios of staining between tetanized and control sides of slices were highly variable for both the P- and NP-forms of CaMKII, as reflected in the large error bars in Figures 4 and 5. To determine whether there was a relationship between the magnitude of LTP measured at the recording electrode and the ratio of staining between tetanized and control sides, we plotted the two values against each other for each tetanized slice (Fig. 7). The plot revealed no clear correlation between the two measures. The lack of correlation indicates that the magnitude of autophosphorylation of CaMKII is not directly related to the magnitude of LTP. It is possible that the induction of LTP is caused by metabolic effects of tetanus other than changes in CaMKII. However, the data may imply that induction of LTP requires a threshold level of CaMKII concentration or autophosphorylation in the dendrites.
Fig. 7.

The size of LTP is not correlated with the magnitude of the ratio of CaMKII staining on the tetanized side to that on the control side. The graph is a scatterplot from experiments in which tetanic stimulation produced LTP. The magnitude of LTP is represented on the x-axis, and the percent deviation from 1.0 in the ratio of CaMKII staining is represented on the y-axis (see Table 1). There is no clear relationship between the magnitude of synaptic potentiation observed at the recording electrode site and the percent deviation from 1.0 in either P-CaMKII or NP-CaMKII staining. Solid squares indicate P-CaMKII; open circles, NP-CaMKII.
DISCUSSION
We have presented three principal observations concerning the effect of tetanic stimulation of the Schaffer collateral pathway on autophosphorylation of CaM kinase II. First, 30 min after the tetanic stimulation, there is a significant increase on the tetanized side of the slice compared with the control side in the level of P-CaMKII in the apical dendrites of stratum radiatum. Second, this increase is accompanied by an equally significant increase in the level of NP-CaMKII in the apical dendrites on the tetanized side. Third, 30 min after the tetanic stimulation, there is also a significant increase in the level of P-CaMKII in pyramidal cell bodies of area CA1 on the tetanized side of the slice compared with the control side. This increase is not accompanied by a significant increase in NP-CaM kinase II. These differences in levels of P-CaMKII and NP-CaMKII were not present in slices that received only test stimulation or were simply placed in the superfusion chamber for the same period of time. They were not present in slices that were tetanized in the presence of APV, indicating that the effect is dependent on activation of NMDA receptors. Finally, the differences were not present in the apical dendrites of slices that were tetanized but did not develop LTP at the site of the recording electrode.
The results are consistent with the general hypotheses that CaMKII, which is highly concentrated in the postsynaptic density, is a target for calcium ion influx through activated NMDA receptors during tetanic stimulation that leads to development of LTP (Kennedy et al., 1983;Kennedy, 1989) and that autophosphorylation of CaMKII can lead to activation that outlasts the initial triggering calcium signal (Miller and Kennedy, 1986; Lisman and Goldring, 1988). Thirty minutes after a tetanic stimulation, the level of P-CaMKII is elevated over a broad area of the slice near the tetanized stimulating electrode in synapses, in dendritic shafts, and even quite dramatically in neuronal somas. Thus, the findings are not consistent with the notion that activation of the kinase via NMDA receptors is a highly localized event, restricted to synapses. Furthermore, given the relatively large area of enhanced P-CaMKII staining in dendrites, the findings may not support the hypothesis that long-lasting activation of the kinase happens only in synapses that are potentiated (Lisman and Goldring, 1988; Lisman, 1994). Indeed, the high concentration of CaMKII in neurons of the forebrain may reflect the fact that it regulates several specialized functions throughout these neurons (Erondu and Kennedy, 1985).
It is not clear whether the widespread increases in P-CaMKII that we observed would occur under natural conditions in vivo, because the tetanic stimulus that we used, which is commonly used to study LTP, activates a greater number of synapses than are likely to be synchronously activated in vivo. Nevertheless, our results indicate that individual CA1 neurons in vivo may undergo long-lasting activation of CaMKII in both dendrites and soma when they are stimulated to fire action potentials at the same time that NMDA receptors are activated at synaptic sites. Recent reports that action potentials propagate back into the dendrites of pyramidal neurons, causing influx of calcium ion and contributing to regulation of synaptic strength (Magee and Johnston, 1995, 1997; Spruston et al., 1995; Johnston et al., 1996; Markram et al., 1997), suggest a mechanism that may initiate this long-lasting activation.
Our most unexpected finding is the large and statistically significant increase in staining for NP-CaMKII in the apical dendrites on the tetanized side of hippocampal slices. In acute hippocampal slices, the steady-state level of P-CaMKII is believed to fluctuate from a baseline of ∼8% to no more than 30% of the total kinase (Molloy and Kennedy, 1991; Ocorr and Schulman, 1991). Therefore, if the number of CaMKII molecules did not change with tetanic stimulation, staining for NP-CaMKII would be expected to be reduced when staining for P-CaMKII is increased, although by a lower percentage. Thus, our observation of an increase rather than a decrease in staining for NP-CaMKII in the same areas of the neuropil that show increased staining for P-CaMKII most likely reflects an increase in the total number of kinase molecules. The most straight-forward explanation for this increase is that there has been new synthesis of CaMKII in the apical dendrites in response to tetanic stimulation. This is a plausible and appealing hypothesis for several reasons. First, the message encoding the α-subunit of CaMKII is present at relatively high levels in dendrites of CA1 pyramidal neurons (Burgin et al., 1990; Benson et al., 1992). Furthermore, recent work has shown that patterned synaptic stimulation can activate dendritic protein synthesis in area CA1 (Feig and Lipton, 1993), that dendritic protein synthesis underlies changes in hippocampal synaptic strength induced by application of BDNF (Kang and Schuman, 1996), and that protein synthesis can occur directly from transcripts introduced into dendrites of hippocampal neurons (Crino and Eberwine, 1996). Finally, several anatomical studies have suggested that the amount of CaMKII or its message can be altered by changes in neuronal activity. The first immunocytochemical study of the distribution of the α-subunit of CaMKII in monkey cortex revealed that after monocular deprivation, the intensity of staining for CaMKII in layer 4 of primary visual cortex was decreased in cells innervated by the deprived eye (Hendry and Kennedy, 1986). This finding was an early indication that changing levels of activity in cortical neurons could alter their regulatory machinery. More recent studies suggest that induction of LTP in area CA1 (Mackler et al., 1992; Roberts et al., 1996) or in the dentate gyrus (Thomas et al., 1994) increases the concentration of mRNA encoding the α-subunit of CaMKII. An alternative explanation for the increase in NP-CaMKII staining, which we feel is less likely, is that tetanic stimulation leads to a change in the disposition of CaMKII, for example, dissociation of a bound dendritic protein, such that the epitope recognized by the antisera against NP-CaMKII is more accessible after fixation. We are presently performing experiments to distinguish between these two possibilities.
The magnitude of the change in P-CaMKII in apical dendrites on the tetanized side of the slices is similar, on average, to the magnitude of change in NP-CaMKII (Fig. 4; Table 1), suggesting that the increase in P-CaMKII simply reflects the increase in the total amount of the kinase and not an increase in the proportion of kinase molecules that are autophosphorylated. This finding is consistent with biochemical studies by Fukunaga et al. (1993) in which both total CaMKII and P-CaMKII were found to increase in homogenates of area CA1 after induction of LTP. We found previously that the baseline steady-state proportion of P-CaMKII appears to be set by the balance between resting Ca2+ concentration and ambient phosphatase activity (Molloy and Kennedy, 1991). Our results here suggest that this balance may not be altered dramatically in apical dendrites 30 min after tetanic stimulation. In contrast, in neuronal somas, the increase in P-CaMKII after tetanic stimulation is not accompanied by an increase in NP-CaMKII (Fig. 5; Table 2), and may indeed reflect a long-lasting increase in basal Ca2+ concentration or a decrease in phosphatase activity. Thus, the mechanisms by which tetanic stimulation effects CaMKII may be different in somas and dendrites.
The magnitude of the ratio between staining for P-CaMKII or NP-CaMKII on the tetanized side of slices versus the control side is not correlated with the magnitude of LTP measured at the recording electrode (Fig. 7). Therefore, we cannot say with certainty whether the widespread effects of tetanus on the levels of P-CaMKII and NP-CaMKII are directly related to the development of LTP. However, it is intriguing that the increases in P-CaMKII and NP-CaMKII were not observed when the tetanic stimulation did not result in induction of LTP (Figs. 4, 5). We have analyzed only three slices in which tetanus failed to produce LTP. Despite the small sample number, these slices did not show a significant increase in P-CaMKII or NP-CaMKII on the tetanized side and were significantly different by our statistical tests from slices that did develop LTP (p < 0.04 in stratum radiatum, and p < 0.02 in somas). This finding suggests that if a tetanus fails to produce a certain threshold increase in P-CaMKII or NP-CaMKII, for whatever reason, LTP fails to develop. The converse may also be true. We are attempting to examine more closely the correlation between enhanced synthesis and autophosphorylation of CaMKII and development of LTP in single neurons in which LTP is induced by pairing depolarization of the neuron with low-frequency synaptic stimulation.
The method used here to visualize and quantify the pattern of autophosphorylation of CaM kinase II in hippocampal tissue can provide both a global view (Fig. 3) and a high-resolution view (Fig. 6) of changes in phosphorylation of an identified site after physiological manipulations. Furthermore, we have not yet reached the theoretical limit of the resolution that the technique may offer. During conventional confocal microscopy such as that shown in Figure 6, imaging with objectives of higher power than 20× causes significant bleaching of the fluorophores after a single scan of the laser beam. Thus, we found that three-dimensional imaging by collection of a series of “z-scans” through the tissue was not reliable at higher magnifications. However, the use of two-photon microscopy (Denk et al., 1990), which causes much less photodamage than conventional confocal laser-scanning microscopy (Potter, 1996), will allow us to make three-dimensional reconstructions of the distribution of phosphorylated proteins at high magnification, permitting the unambiguous identification of individual synaptic sites. The method presented here offers a completely new view of synaptic mechanisms that have been invisible previously (Malinow and Mainen, 1996). It can, in theory, be applied to any identified phosphorylated site on any protein and thus will provide a powerful means to test and refine mechanistic hypotheses in the future.
Footnotes
This work was supported by National Institutes of Health Grants MH49176 and NS17660 (M.B.K.), NS32792 (E.M.S.), NS21184 (K.M.H.); National Science Foundation Grant GER-9023446 (M.B.K.); and grants from the Alfred P. Sloan Foundation, Beckman Foundation, John Merck Fund, and PEW Charitable Trusts (E.M.S.). We thank Leslie Schenker for expert technical assistance, Mary Mosier and Kathryn Stofer for help with some of the experiments, Scott Fraser for valuable technical advice, and Kathleen Branson for help with preparation of this manuscript.
Correspondence should be addressed to Dr. Mary B. Kennedy, Division of Biology 216-76, California Institute of Technology, Pasadena, CA 91125.
REFERENCES
- 1.Abraham WC, Bear MF. Metaplasticity—the plasticity of synaptic plasticity. Trends Neurosci. 1996;19:126–130. doi: 10.1016/s0166-2236(96)80018-x. [DOI] [PubMed] [Google Scholar]
- 2.Apperson ML, Moon I-S, Kennedy MB. Characterization of densin-180, a new brain-specific synaptic protein of the O-sialogly-coprotein family. J Neurosci. 1996;16:6839–6852. doi: 10.1523/JNEUROSCI.16-21-06839.1996. [DOI] [PMC free article] [PubMed] [Google Scholar]
- 3.Bear MF. Mechanism for a sliding synaptic modification threshold. Neuron. 1995;15:1–4. doi: 10.1016/0896-6273(95)90056-x. [DOI] [PubMed] [Google Scholar]
- 4.Benfenati F, Valtorta F, Rubenstein JL, Gorelick FS, Greengard P, Czernik AJ. Synaptic vesicle-associated C2+/calmodulin-dependent protein kinase II is a binding-protein for synapsin I. Nature. 1992;359:417–420. doi: 10.1038/359417a0. [DOI] [PubMed] [Google Scholar]
- 5.Bennett MK, Erondu NE, Kennedy MB. Purification and characterization of a calmodulin-dependent protein kinase that is highly concentrated in brain. J Biol Chem. 1983;258:12735–12744. [PubMed] [Google Scholar]
- 6.Benson DL, Gall CM, Isackson PJ. Dendritic localization of type II calcium/calmodulin-dependent protein kinase messenger RNA in normal and re-innervated rat hippocampus. Neuroscience. 1992;46:851–857. doi: 10.1016/0306-4522(92)90189-9. [DOI] [PubMed] [Google Scholar]
- 7.Burgin KE, Waxham MN, Rickling S, Westgate SA, Mobley WC, Kelly PT. In situ hybridization histochemistry of Ca 2+ calmodulin-dependent protein kinase in developing rat brain. J Neurosci. 1990;10:1788–1798. doi: 10.1523/JNEUROSCI.10-06-01788.1990. [DOI] [PMC free article] [PubMed] [Google Scholar]
- 8.Butler LS, Silva AJ, Abeliovich A, Watanabe Y, Tonegawa S, McNamara JO. Limbic epilepsy in transgenic mice carrying a Ca2+/calmodulin-dependent kinase-II alpha-subunit mutation. Proc Natl Acad Sci USA. 1995;92:6852–6855. doi: 10.1073/pnas.92.15.6852. [DOI] [PMC free article] [PubMed] [Google Scholar]
- 9.Chen C, Rainnie DG, Greene RW, Tonegawa S. Abnormal fear response and aggressive behavior in mutant mice deficient for α-calcium-calmodulin kinase II. Science. 1994;266:291–294. doi: 10.1126/science.7939668. [DOI] [PubMed] [Google Scholar]
- 10.Crino PB, Eberwine J. Molecular characterization of the dendritic growth cone: regulated mRNA transport and local protein synthesis. Neuron. 1996;17:1173–1187. doi: 10.1016/s0896-6273(00)80248-2. [DOI] [PubMed] [Google Scholar]
- 11.Denk W, Strickler JH, Webb WW. 2-Photon laser scanning fluorescence microscopy. Science. 1990;248:73–76. doi: 10.1126/science.2321027. [DOI] [PubMed] [Google Scholar]
- 12.Erondu NE, Kennedy MB. Regional distribution of type II Ca2+/calmodulin-dependent protein kinase in rat brain. J Neurosci. 1985;5:3270–3277. doi: 10.1523/JNEUROSCI.05-12-03270.1985. [DOI] [PMC free article] [PubMed] [Google Scholar]
- 13.Feig S, Lipton P. Pairing the cholinergic agonist carbachol with patterned Schaffer collateral stimulation initiates protein synthesis in hippocampal CA1 pyramidal cell dendrites via a muscarinic, NMDA-dependent mechanism. J Neurosci. 1993;13:1010–1021. doi: 10.1523/JNEUROSCI.13-03-01010.1993. [DOI] [PMC free article] [PubMed] [Google Scholar]
- 14.Fong YL, Taylor WL, Means AR, Soderling TR. Studies of the regulatory mechanism of Ca2+/calmodulin-dependent protein kinase II-mutation of threonine-286 to alanine and aspartate. J Biol Chem. 1989;264:6759–6763. [PubMed] [Google Scholar]
- 15.Fukunaga K, Stoppini L, Miyamoto E, Muller D. Long-term potentiation is associated with an increased activity of Ca2+/calmodulin-dependent protein kinase II. J Biol Chem. 1993;268:7863–7867. [PubMed] [Google Scholar]
- 16.Hendry SC, Kennedy MB. Immunoreactivity for a calmodulin-dependent protein kinase is selectively increased in macaque striate cortex after monocular deprivation. Proc Natl Acad Sci USA. 1986;83:1536–1540. doi: 10.1073/pnas.83.5.1536. [DOI] [PMC free article] [PubMed] [Google Scholar]
- 17.Ishizuka N, Weber J, Amaral DG. Organization of intrahippocampal projections originating from CA3 pyramidal cells in the rat. J Comp Neurol. 1990;295:580–623. doi: 10.1002/cne.902950407. [DOI] [PubMed] [Google Scholar]
- 18.Johnston D, Magee JC, Colbert CM, Christie BR. Active properties of neuronal dendrites. Annu Rev Neurosci. 1996;19:165–186. doi: 10.1146/annurev.ne.19.030196.001121. [DOI] [PubMed] [Google Scholar]
- 19.Kang H, Schuman EM. A requirement for local protein synthesis in neurotrophin-induced hippocampal synaptic plasticity. Science. 1996;273:1402–1406. doi: 10.1126/science.273.5280.1402. [DOI] [PubMed] [Google Scholar]
- 20.Kennedy MB. Regulation of synaptic transmission in the central nervous system: long-term potentiation. Cell. 1989;59:777–787. doi: 10.1016/0092-8674(89)90601-6. [DOI] [PubMed] [Google Scholar]
- 21.Kennedy MB, Bennett MK, Erondu NE. Biochemical and immunochemical evidence that the “major postsynaptic density protein” is a subunit of a calmodulin-dependent protein kinase. Proc Natl Acad Sci USA. 1983;80:7357–7361. doi: 10.1073/pnas.80.23.7357. [DOI] [PMC free article] [PubMed] [Google Scholar]
- 22.Kennedy MB, Bennett MK, Bulleit RF, Erondu NE, Jennings VR, Miller SM, Molloy SS, Patton BL, Schenker LJ. Structure and regulation of type II calcium/calmodulin-dependent protein kinase in central nervous system neurons. CSH Symp Quant Biol. 1990;55:101–110. doi: 10.1101/sqb.1990.055.01.013. [DOI] [PubMed] [Google Scholar]
- 23.Kindler S, Kennedy MB. Visualization of autophosphorylation of Ca2+/calmodulin-dependent protein kinase II in hippocampal slices. J Neurosci Methods. 1996;68:61–70. doi: 10.1016/0165-0270(96)00074-x. [DOI] [PubMed] [Google Scholar]
- 24.Kullmann DM, Erdemli G, Asztely F. LTP of AMPA and NMDA receptor-mediated signals—evidence for presynaptic expression and extrasynaptic glutamate spill-over. Neuron. 1996;17:461–474. doi: 10.1016/s0896-6273(00)80178-6. [DOI] [PubMed] [Google Scholar]
- 25.Liao DZ, Hessler NA, Malinow R. Activation of postsynaptically silent synapses during pairing-induced LTP in CA1 region of hippocampal slice. Nature. 1995;375:400–404. doi: 10.1038/375400a0. [DOI] [PubMed] [Google Scholar]
- 26.Lisman J. The CaM kinase II hypothesis for the storage of synaptic memory. Trends Neurosci. 1994;17:406–412. doi: 10.1016/0166-2236(94)90014-0. [DOI] [PubMed] [Google Scholar]
- 27.Lisman JE, Goldring MA. Feasibility of long-term storage of graded information by the Ca2+/calmodulin-dependent protein kinase molecules of the postsynaptic density. Proc Natl Acad Sci USA. 1988;85:5320–5324. doi: 10.1073/pnas.85.14.5320. [DOI] [PMC free article] [PubMed] [Google Scholar]
- 28.Lledo PM, Hjelmstad GO, Mukherji S, Soderling TR, Malenka RC, Nicoll RA. Calcium calmodulin-dependent kinase-II and long-term potentiation enhance synaptic transmission by the same mechanism. Proc Natl Acad Sci USA. 1995;92:11175–11179. doi: 10.1073/pnas.92.24.11175. [DOI] [PMC free article] [PubMed] [Google Scholar]
- 29.Mackler SA, Brooks BP, Eberwine JH. Stimulus-induced coordinate changes in mRNA abundance in single postsynaptic hippocampal CA1 neurons. Neuron. 1992;9:539–548. doi: 10.1016/0896-6273(92)90191-f. [DOI] [PubMed] [Google Scholar]
- 30.Madison DV, Nicoll RA. Enkephalin hyperpolarizes interneurones in the rat hippocampus. J Physiol (Lond) 1988;398:123–130. doi: 10.1113/jphysiol.1988.sp017033. [DOI] [PMC free article] [PubMed] [Google Scholar]
- 31.Magee JC, Johnston D. Synaptic activation of voltage-gated channels in the dendrites of hippocampal pyramidal neurons. Science. 1995;268:301–304. doi: 10.1126/science.7716525. [DOI] [PubMed] [Google Scholar]
- 32.Magee JC, Johnston D. A synaptically controlled, associative signal for Hebbian plasticity in hippocampal neurons. Science. 1997;275:209–213. doi: 10.1126/science.275.5297.209. [DOI] [PubMed] [Google Scholar]
- 33.Malinow R, Mainen ZF. Long-term potentiation in the CA1 hippocampus. Science. 1996;271:1604–1605. doi: 10.1126/science.271.5255.1604. [DOI] [PubMed] [Google Scholar]
- 34.Markram H, Lübke J, Frotscher M, Sakmann B. Regulation of synaptic efficacy by coincidence of postsynaptic APs and EPSPs. Science. 1997;275:213–215. doi: 10.1126/science.275.5297.213. [DOI] [PubMed] [Google Scholar]
- 35.Mayford M, Wang J, Kandel ER, O’Dell TJ. CaMKII regulates the frequency-response function of hippocampal synapses for the production of both LTD and LTP. Cell. 1995;81:891–904. doi: 10.1016/0092-8674(95)90009-8. [DOI] [PubMed] [Google Scholar]
- 36.McGlade-McCulloh E, Yamamoto H, Tan S-E, Brickey DA, Soderling TR. Phosphorylation and regulation of glutamate receptors by calcium/calmodulin-dependent protein kinase II. Nature. 1993;362:640–642. doi: 10.1038/362640a0. [DOI] [PubMed] [Google Scholar]
- 37.Miller SG, Kennedy MB. Distinct forebrain and cerebellar isozymes of type II Ca2+/calmodulin-dependent protein kinase associate differently with the postsynaptic density fraction. J Biol Chem. 1985;260:9039–9046. [PubMed] [Google Scholar]
- 38.Miller SG, Kennedy MB. Regulation of brain type II Ca2+/calmodulin-dependent protein kinase by autophosphorylation: a Ca2+-triggered molecular switch. Cell. 1986;44:861–870. doi: 10.1016/0092-8674(86)90008-5. [DOI] [PubMed] [Google Scholar]
- 39.Miller SG, Patton BL, Kennedy MB. Sequences of autophosphorylation sites in neuronal type II CaM kinase that control Ca2+-independent activity. Neuron. 1988;1:1593–1604. doi: 10.1016/0896-6273(88)90109-2. [DOI] [PubMed] [Google Scholar]
- 40.Molloy SS, Kennedy MB. Autophosphorylation of type II Ca2+/calmodulin-dependent protein kinase in cultures of postnatal rat hippocampal slices. Proc Natl Acad Sci USA. 1991;88:4756–4760. doi: 10.1073/pnas.88.11.4756. [DOI] [PMC free article] [PubMed] [Google Scholar]
- 41.Ocorr KA, Schulman H. Activation of multifunctional Ca2+ calmodulin-dependent kinase in intact hippocampal slices. Neuron. 1991;6:907–914. doi: 10.1016/0896-6273(91)90231-n. [DOI] [PubMed] [Google Scholar]
- 42.Omkumar RV, Kiely MJ, Rosenstein AJ, Min K-T, Kennedy MB. Identification of a phosphorylation site for calcium/calmodulin-dependent protein kinase II in the NR2B subunit of the N-methyl-d-aspartate receptor. J Biol Chem. 1996;271:31670–31678. doi: 10.1074/jbc.271.49.31670. [DOI] [PubMed] [Google Scholar]
- 43.Ouimet CC, McGuinness TL, Greengard P. Immunocytochemical localization of calcium/calmodulin-dependent protein kinase II in rat brain. Proc Natl Acad Sci USA. 1984;81:5604–5608. doi: 10.1073/pnas.81.17.5604. [DOI] [PMC free article] [PubMed] [Google Scholar]
- 44.Patton BL, Miller SG, Kennedy MB. Identification of functionally significant phosphorylation sites on neuronal proteins and preparation of antibodies that recognize them. Methods Neurosci. 1991;6:158–176. [Google Scholar]
- 45.Patton BL, Molloy SS, Kennedy MB. Autophosphorylation of type II CaM kinase in hippocampal neurons: localization of phospho- and dephosphokinase with complementary phosphorylation site-specific antibodies. Mol Biol Cell. 1993;4:159–172. doi: 10.1091/mbc.4.2.159. [DOI] [PMC free article] [PubMed] [Google Scholar]
- 46.Peterson GL. Determination of total protein. Methods Enzymol. 1983;91:95–119. doi: 10.1016/s0076-6879(83)91014-5. [DOI] [PubMed] [Google Scholar]
- 47.Pettit DL, Perlman S, Malinow R. Potentiated transmission and prevention of further LTP by increased CaM KII activity in postsynaptic hippocampal slice neurons. Science. 1994;266:1881–1885. doi: 10.1126/science.7997883. [DOI] [PubMed] [Google Scholar]
- 48.Potter SM. Vital imaging—2 photons are better than one. Curr Biol. 1996;6:1595–1598. doi: 10.1016/s0960-9822(02)70782-3. [DOI] [PubMed] [Google Scholar]
- 49.Roberts LA, Higgins MJ, O’Shaughnessy CT, Stone TW, Morris BJ. Changes in hippocampal gene expression associated with the induction of long-term potentiation. Mol Brain Res. 1996;42:123–127. doi: 10.1016/s0169-328x(96)00148-9. [DOI] [PubMed] [Google Scholar]
- 50.Silva AJ, Paylor R, Wehner JM, Tonegawa S. Impaired spatial learning in α-calcium-calmodulin kinase II mutant mice. Science. 1992a;257:206–211. doi: 10.1126/science.1321493. [DOI] [PubMed] [Google Scholar]
- 51.Silva AJ, Stevens CF, Tonegawa S, Wang Y. Deficient hippocampal long-term potentiation in α-calcium-calmodulin kinase II mutant mice. Science. 1992b;257:201–206. doi: 10.1126/science.1378648. [DOI] [PubMed] [Google Scholar]
- 52.Spruston N, Schiller Y, Stuart G, Sakmann B. Activity-dependent action potential invasion and calcium influx into hippocampal CA1 dendrites. Science. 1995;268:297–300. doi: 10.1126/science.7716524. [DOI] [PubMed] [Google Scholar]
- 53.Stevens CF, Tonegawa S, Wang Y. The role of calcium-calmodulin kinase II in 3 forms of synaptic plasticity. Curr Biol. 1994;4:687–693. doi: 10.1016/s0960-9822(00)00153-6. [DOI] [PubMed] [Google Scholar]
- 54.Thomas KL, Laroche S, Errington ML, Bliss TVP, Hunt SP. Spatial and temporal changes in signal transduction pathways during LTP. Neuron. 1994;13:737–745. doi: 10.1016/0896-6273(94)90040-x. [DOI] [PubMed] [Google Scholar]