Abstract
It is now well established that briefly flashed single targets are mislocalized in space, not only during saccades but also before them. We show here by several techniques (including a vernier judgment that did not require absolute location in space) that errors appear up to 100 msec before saccades are made and are maximal just before they start. The size and even the sign of errors depend strongly on position in the visual field, the complete pattern of errors suggesting a compression of visual space around the initial fixation point and the target of the impending saccade. The compression was confirmed by displaying multiple rather than single targets and was found to be powerful enough to reduce or even to remove vernier offset for pairs of bars shown simultaneously and to create offsets for colinear bars separated in time by 75 msec. It also reduced the apparent number of parallel bars. When saccades were simulated by moving the display at saccadic speed, there were sometimes errors of location, but only for tasks requiring absolute judgment of position. The pattern of errors differed greatly from that during saccades and, in particular, showed no signs of compression. We can model our saccade results by assuming a shift in the point in space associated with eye position compression of eccentricity along the axis of saccades.
Keywords: saccades, eye movements, extraretinal position signal, magnocellular, attention, visual capture
Saccades are rapid eye movements, frequently made, that shift the point of gaze and therefore reposition images of the external world on the retinas. They pose two obvious problems: (1) Why is image motion not usually noticed; and (2) how is visual stability maintained in the face of shifts in the retinal position of images? Recent evidence suggests that motion signals are suppressed during saccades, possibly by selective attenuation of the magnocellular pathway (Burr et al., 1982; Shiori and Cavanagh, 1989;Burr et al., 1994; for review see Ross et al., 1996a). However, the question of visual stability remains elusive.
Theories of stability across saccades have been dominated by the idea of a uniform vectorial correction that cancels out the translation of images on the retina. This idea has often been attributed to von Helmholtz (1866), who used the term Willenanstreungung(usually translated as effort of the will) for the primary source of the information used to make the correction. But Grüsser (1994)has traced the idea itself beyond Franciscus Aguilonius in the early 17th century and has shown that it has surfaced repeatedly in ancient and modern times. The idea is now most closely associated with two models, the “efference copy” (and “reafference”) of von Holst and Mittelstaedt (1950) and the “corollary discharge” of Sperry (1950). von Helmholtz (1866) suggested that sensations of motion, although not registered consciously, might also make a contribution, and Sherrington (1918) identified afferent signals from extraocular muscle spindles as a possible source of information about eye position during movement. There has emerged the concept of an extraretinal position signal (ERPS) with possibly both “outflow” and “inflow” components (Whitteridge, 1960).
The correction to retinal position codes had been assumed to coincide with the eye movement and to grow continuously with it, therefore ensuring stability of perceived position at all times, until the work of Matin and Pearce (1965). They showed that targets flashed during saccades were mislocated, and furthermore, that errors of location were different for targets flashed at different positions. This undermined the assumption of a correction coinciding with the saccade and cast doubt on the more fundamental assumption that the correction was uniform for all directions in space. Matin and Pearce (1965, page 1487) themselves suggested that “compensation” might occur “at different rates at different regions of the visual field.”
Subsequent findings of Matin and his associates led them to conclude that the ERPS does not coincide with its saccade but is more sluggish (Matin et al., 1969, 1970). Similar conclusions have been drawn by Schlag and associates (Dassonville et al., 1992; Schlag and Schlag-Rey, 1995; Cai et al., 1997) and by Honda (1989, 1991, 1993), who found substantial errors of location for targets flashed before the eye had moved, suggesting that the ERPS anticipated its saccade. Less attention has been given to the issue of the uniformity of errors of location across the visual field, but Honda (1995) recently reported that the size of errors changes with target position. The pattern Honda finds is consistent with what Matin and Pearce (1965, page 1487) termed a “contraction of visual space in the direction of ocular motion.”
For many years attempts to find any neurophysiological substrate for the widely assumed ERPS met with little success. However, it has recently been shown by Duhamel et al. (1992) that a substantial proportion of neurons in the parietal cortical lateral intraparietal area (LIP) shift their receptive fields in a manner consistent with an ERPS. They anticipate saccades by responding to what will fall on their classical receptive fields after an intended saccade has been completed. Similar behavior has also been demonstrated in neurons in the deep layer of the superior colliculus (Walker et al., 1995). But even more recent evidence suggests that some LIP neurons behave in stranger ways; their receptive fields deform, increasing or decreasing in size, and are displaced in directions other than that of the saccade (Ben Hamed et al., 1996). The function of this behavior is much less clear.
Our purpose here is to examine more closely the pattern of perisaccadic errors of location in humans, particularly how they change with target position, and also to deduce the structure of perceptual space during saccades.
Some of this work has been published in abstract form (Morrone et al., 1996; Ross et al., 1996b) and in a brief report (Ross et al., 1997).
MATERIALS AND METHODS
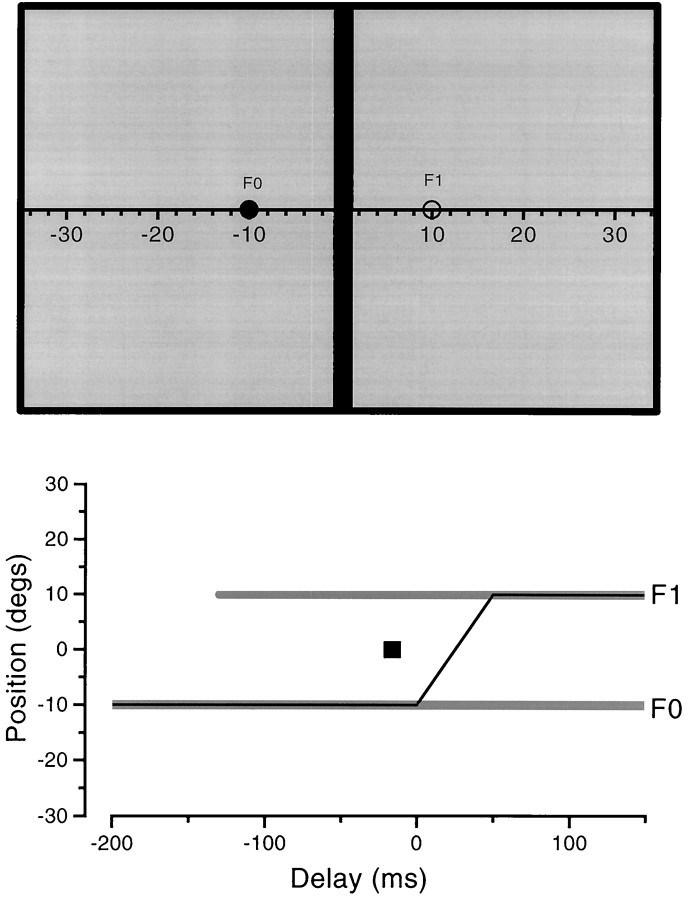
Stimuli. Stimuli were displayed on a Mitsubishi color monitor with display area 36 × 25 cm, subtending 70 × 50° at the usual distance of 25 cm. The display was surrounded by a white card (1.2 × 1 m), lit to about 10 cd/m2by background lighting. Stimuli were generated at 120 Hz by a visual stimulus generator (Cambridge Research Systems VSG2) housed in a personal computer (PC). All stimuli (except natural scenes) were presented on a red background (Commission Internationale de l’Eclairage (CIE) coordinates: x = 0.595;y = 0.349; luminance, 16.3 cd m−2) for a single frame (8.3 msec). Except where indicated stimuli were single or multiple green vertical bars (CIE coordinates:x = 0.298; y = 0.563) displayed at luminance equal to the background (determined separately for each observer by flicker photometry). They were usually 4° wide and stretched either from the top of the screen to the bottom (full bars), or from the middle to the top or the bottom (half bars). The display is illustrated in Figure 1.
Fig. 1.
Top, Spatial layout of the display. The screen was 36 × 25 cm (70 × 50° at the usual distance of 25 cms), of uniform red, with mean luminance of 14 cd/m2. The bar, usually vertical and equiluminant green (but sometimes black), could be displayed at any position. The ruler, when used as a reference, appeared 500 msec after completion of saccade. Bottom, Time course of the presentation. The black fixation circle (F0) stayed on for the duration of the experiment. After a warning, a similar black circle appeared atF1, to which observers saccaded as quickly as possible. The stimulus (in this case a single vertical bar at position0°) was briefly displayed for one frame (8 msec) at some arbitrary time after the saccadic target appeared. In the first series of experiments, observers simply reported the apparent position of the bar relative to the ruler. In others, they had to report the apparent offset of two half-bars or the number of bars seen in a multiple display.
The time of presentation of the stimulus was determined by computer and illustrated to the experimenter, together with the eye movement trace, after each trial, with a visual display (such as Fig. 1,bottom). The actual timing of the stimulus onset, relative to eye movements, was calibrated directly by measuring it at the monitor with the eye movement sensor. Because of the monitor raster, there was a 5 msec variation of display time from top to bottom; the times given in this study are those at the center of the screen, at the level of eye gaze.
Eye movements. Eye movements were monitored by an infrared limbus eye tracker (HVS SP150). The horizontal resolution was 0.01 degree, and accuracy was 0.1 degree (manufacturer’s specifications). Vertical resolution and accuracy was about 0.03 and 0.3 degree, respectively. The infrared sensor was mounted below the right eye on transparent wraparound plastic goggles through which observers viewed the display screen binocularly. The PC sampled eye position at 1000 Hz and stored the trace in digital form (after suitable linearization). Before each session, both the gain and the linearization of the eye tracker were calibrated by asking observers to make saccades to five fixed points arranged horizontally (or vertically in the one case in which subjects saccaded vertically).
After each trial, the computer identified the beginning of the saccade (by convolving the trace with a difference-of-gaussian function and finding the peak or trough), and calculated the delay of the stimulus presentation (positive or negative) relative to saccade onset. An experimenter viewed the eye movement trace after each trial and adjusted the estimate of saccade onset (when necessary) or aborted the trial if the saccade was not of sufficient amplitude (within 5% of correct amplitude).
Simulated saccades. “Simulated saccades” were produced by viewing the oscilloscope through a light plastic mirror (25 × 15 cm) caused to rotate at saccadic speeds by a computer-activated solenoid. The mirror was positioned as close as possible to the observer and gave a clear view of the entire monitor together with ∼60° of surround (the white card) in all directions. Displacement distance was calibrated by projecting a laser from eye position to the screen. Duration and velocity of the motion were monitored throughout the experiment with the infrared sensor of the eye tracker placed on an “artificial eye” attached to the mirror. Typical duration for a 20° displacement was 45 msec, compared with 40 msec for the human saccade (Carpenter, 1988). We did not monitor eye movements during the experiments (because the tracker was used to identify motion onset and to check mirror function), but in separate control experiments we showed that subjects maintained perfect fixation under these conditions and did not make saccades or fast pursuit movements in response to the moving scene (cf. Kawano and Miles, 1986).
Procedure. Observations were made in a dimly lit room. Trials began with a dark fixation spot, which appeared usually 10° to the left of the center of the screen and stayed on thereafter. After a warning a target appeared (and thereafter stayed on) usually 10° to the right of the center, and observers made a saccade to it as soon as they could. Latencies varied with observer and level of training within a range of 140–220 msec. Stimuli were flashed for one frame (8 msec) some time after the appearance of the target and could fall before, during, or after the saccade (see Fig. 1 for illustration of sequence of events). About 500 msec after the saccade, a ruler was drawn across the whole screen, running through the fixation point and target (illustrated in Fig. 1). Observers were required to report the positions of bars with reference to this ruler. For most experiments the fixation point and target were positioned as described above, but for others they varied to give shorter horizontal saccades and vertical saccades. Observers voiced their responses, which were recorded on computer by an experimenter, after checking the quality of the saccade and the estimate of saccade onset.
The procedure for simulated saccades was identical to that for saccades, except that the mirror action replaced the saccades. The display was inverted horizontally to compensate for the inverting effect of the mirror.
Observers. Observers, whose ages ranged from 26–65, included the authors and students from their laboratories in Perth and Pisa. Because relevant theory, and even patterns in the data, emerged only late in the course of investigation, all were effectively naive for most observations, but care was taken to keep some observers innocent of theory as it developed and to recruit new observers to guarantee unprejudiced observations.
RESULTS
Effect of saccades on apparent position
Time course of localization
In the first experiment observers viewed (from a distance of 25 cm) a fixation point at −10° (to the left of center) and saccaded to a target at +10° (20° saccades). Single bars subtending 1.8 × 50° were flashed for one frame at the center of the screen (0°), −20° (left of center), or +20° (right of center). The short exposure minimized motion blur during saccades. Time of display ranged from well before (<−150 msec) to well after (>150 msec) the start of saccades. Observers, who were unaware of actual display positions, reported where bars appeared by reference to the ruler that was drawn on the screen 500 msec after the saccades has finished.
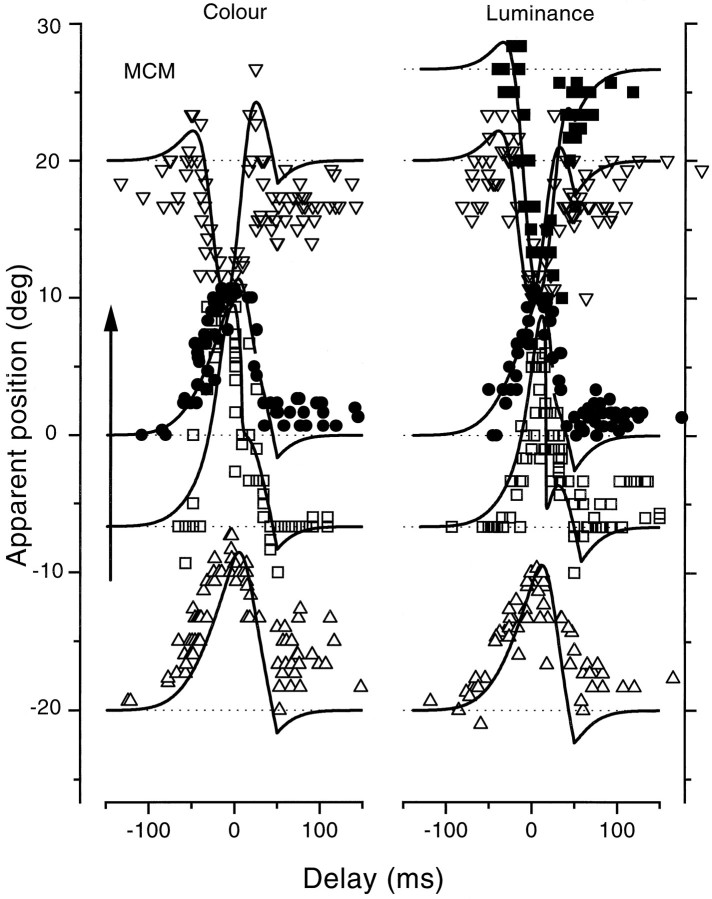
Figure 2 shows the results of the first experiment, for observer M.C.M. (an author), observing both equiluminant green bars (left) and black bars (right). For both types of stimuli, reported bar position was close to true position outside the range of −50 to 50 msec, but within this range the apparent position of bars was systematically displaced. The pattern of the displacement depended critically on the actual position of the displayed bar. Those displayed to −20, −7, or 0° were systematically mislocated in the direction of the saccade. The displacement began before saccade commencement, reaching a maximum near the time t = 0, where it was ∼10°, half the size of the saccade. The magnitude of the mislocalization decreased gradually throughout the saccade, returning to near veridical shortly after the completion of the saccade.
Fig. 2.
Apparent position of a bar flashed briefly (8 msec) at various positions and at various (randomized) times relative to saccadic onset, as observers saccaded from the fixation point at −10° to the target at 10° (indicated by the arrowon the left). For the curves on theleft, the bars were green, equiluminant with the red background, and for those on the right they were black. All of the data are from observer M.C.M., an author. Thecontinuous curves are the predictions of the model, described in Mathematical Model of the Results. The physical position of the bar was −20° (upright triangles), −7° (open squares), 0° (filled circles), 20° (inverted triangles), or 28° (filled squares). The pattern of results for the dark bars was very similar to that with the equiluminant bars. Bars displayed to the left of the saccadic target were mislocalized in the direction of the saccade, with maximum error just before saccadic onset; bars displayed past the target were mislocalized in the other direction, toward the target.
The results for bars displayed at +20 and +27° were quite different from the others. Mislocalization was again maximal at approximatelyt = 0 but in the opposite direction from the other conditions. In these conditions apparent displacement occurred against the direction of the saccade, back toward the saccadic target. Again, the displacement relaxed in amplitude throughout the saccade, returning near (but not quite to) veridical after completion of the saccade.
The continuous curves passing through the data of this and later figures are fits of a model, which assumes a shift in the origin of visual space before each saccade, together with a compression. Details of the model are given in Mathematical Model of the Results.
The results for luminance-modulated stimuli were very similar to those for equiluminant stimuli, except for a slight difference in time course, with the equiluminance data anticipating luminance data by about 10 msec. This difference (incorporated in the model predictions) most probably results from differences in processing latencies for luminance and chromatic stimuli (Bowen, 1981; Burr and Morrone, 1993). Because the major pattern of results did not vary much between stimuli, most of the subsequent measurements were made with equiluminant stimuli, known not to be less visible during saccades (Burr et al., 1994).
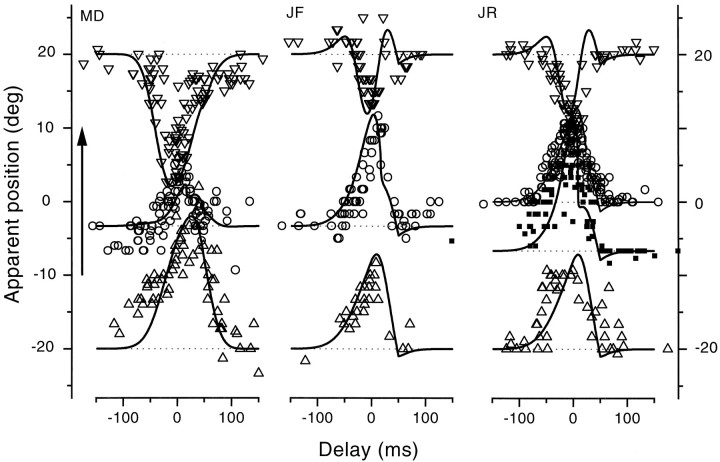
Figure 3 shows similar sets of data collected with equiluminant stimuli from three additional observers, two of whom were innocent of the goals of the experiment. Saccades were again 20°, left to right. The effects were qualitatively similar for all observers, although there were differences in magnitude, particularly for M.R.D., for whom the displacements in both directions was greater than for the others. The continuous lines refer to model predictions, with parameters chosen separately for each observer but maintained for all data collected by each observer (see Table 1 for values).
Fig. 3.
Same as Figure 1 for three different observers, two of whom were unaware of the goals of the experiment. In this case, the bars were always equiluminant green. The bars were physically displayed at −20° (upright triangles), −7° (filled squares for J.R.), −3° (circles for M.D. and J.F.), 0° (circles for R.J.), or +20° (inverted triangles).
Table 1.
Values of model constants used to fit the data of the various observers
| Observer | Gain a0 | Origin shift | Compression | ||
|---|---|---|---|---|---|
| τ0 | ς0 | τ1 | ς1 | ||
| M.C.M. | 0.93 | −5 | 40 | −7 | 15 |
| J.F. | 1.09 | −10 | 40 | −3 | 17.5 |
| J.R. | 1.09 | −10 | 40 | −3 | 17.5 |
| J.A.M. | 0.79 | 0 | 40 | −7 | 15 |
| H.D. | 0.79 | −10 | 40 | 7 | 40 |
| M.D. | 0.66 | 10 | 40 | 7 | 30 |
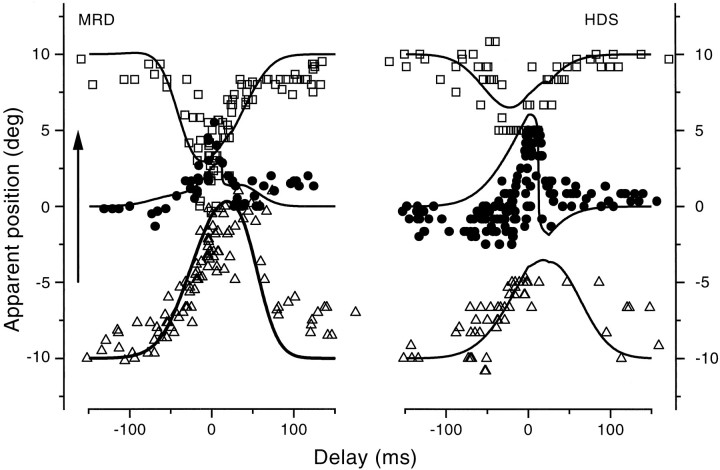
Figure 4 shows data for smaller (10°) saccades, between −5 and +5°, achieved by viewing the same display as before from 50 instead of 25 cm. This scaled the whole image, so the bars subtended 0.9 × 25°. Both observers were naive about the experimental goals. The pattern of results is similar to those of the larger saccades, with mislocalization in the direction of the saccade for bar positions at −10 and 0° and against it for bars at +10°.
Fig. 4.
Same as Figure 2, except the saccades were smaller, from −5 to 5°. The display was otherwise the same as before but was viewed from twice the previous viewing distance (50 cm). The bars were physically at −10° (upright triangles), 0° (filled circles) or 10° (open squares).
Effect of spatial position
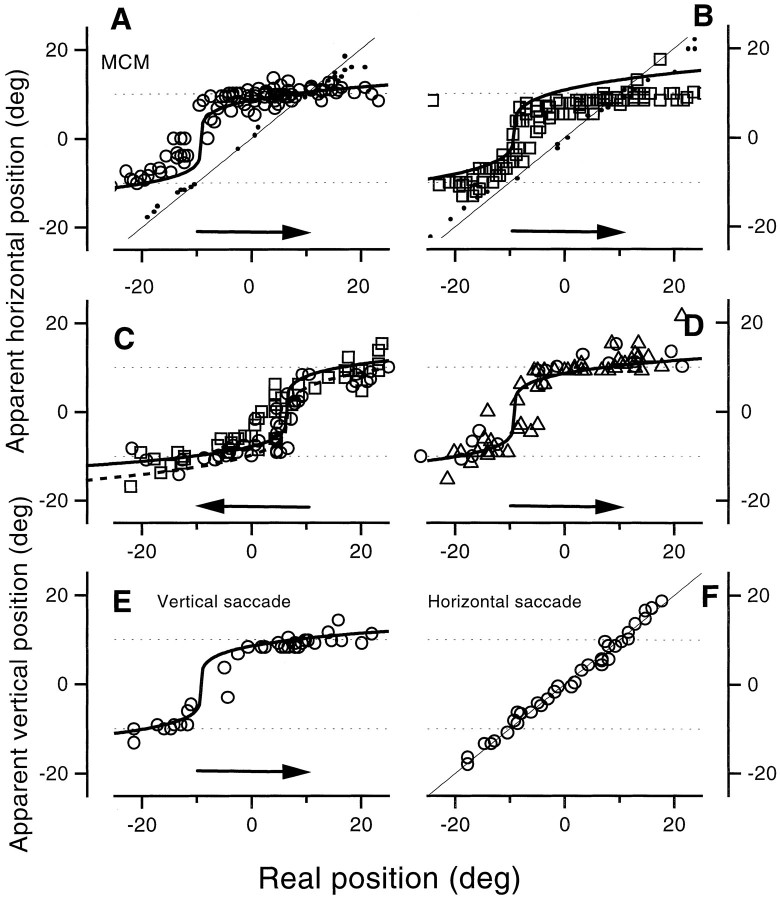
To study the effect of spatial location on mislocalization over a wider range, we measured the apparent position of bars displayed randomly from positions −20 to 20° in the critical presaccadic period. Bar latency (relative to the signal to saccade) was set so that stimuli tended to fall over a wide range at random, but only those that fell between −25 < t < 0 msec were included in later analysis. Figure 5 shows the results for observer M.C.M. for 20° saccades. Figure 5, Aand B, refers to standard left-to-right saccades for equiluminant green bars and for black bars, respectively. The results show that both the amount and the direction of displacement clearly depend on the physical position of the bars, with a tendency for data to concentrate around the two fixation points. The small dots show control measurements, made with the eyes still under similar conditions. Position judgments were very accurate. The linear regression of these data had a slope of 1 (r > 0.995). Figure 5C shows results for right-to-left saccades (from +10 to −10°) for dark and equiluminant stimuli, producing similar but mirror-reversed results.
Fig. 5.
Apparent position of bars presented at various positions in the interval just before saccadic onset (−25<t <0 msec). A, B, Results for equiluminant green and black bars, respectively, for 20° left-to-right horizontal saccades. C, The direction of the saccades was reversed, from 10 to −10°. D, Possibility of visual features acting as passive attractors, investigated by “priming” the bar position with a flashing dot (open circles) or by adding 50 stationary random dots (2° diameter) to the display and using an ever-present saccadic target that was dimmed slightly as a signal to saccade (open triangles). Neither manipulation significantly affected the results. E, F, The bar was horizontal, and observers judged its vertical position, either during vertical saccades (E) or horizontal saccades (F). The horizontal saccade had very little effect on the vertical position, but the vertical saccade caused the same pattern of compression observed previously. As before, thecontinuous lines show the model predictions.
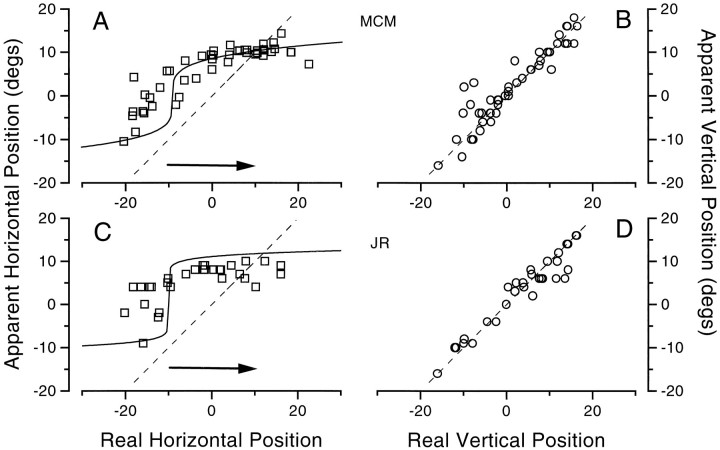
For Figure 5E the observer made vertical saccades and reported the vertical position of a horizontal bar. Again, the pattern of results was similar to that of the standard horizontal saccade, with a tendency for data to cluster around the two fixation points. For Figure 5F, the observer again reported the vertical position of a horizontal bar, but this time while making horizontal saccades. Under these conditions localization was virtually veridical, implying that saccades have very little effect in the orthogonal direction. This is pursued further in Figure 7.
Fig. 7.
Apparent position in two dimensions of large green dots (6° diameter) briefly presented in the interval just before onset of 20° horizontal saccades (−25 < t< 0 msec). The horizontal localization followed the same pattern as observed with bars, but the vertical localization showed no systematic bias or tendency for compression. The dashed lines show the prediction for veridical perception.
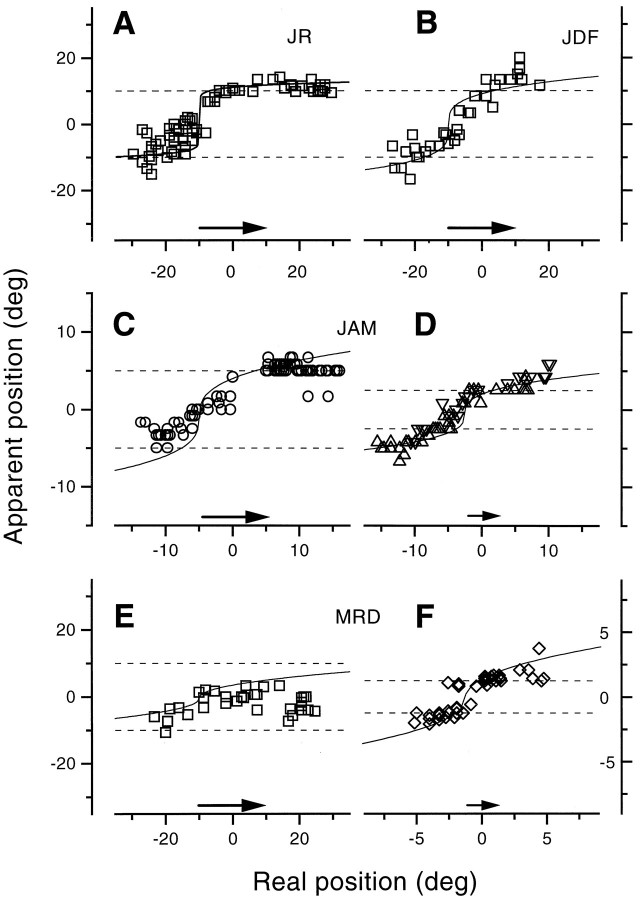
Figure 6 shows more measurements of the effect of bar position for different observers and for saccades of varying size. The exact pattern of results varies from observer to observer, and with saccade size, but the general tendency for compression was always present. The compression was most extreme with observer M.R.D. (consistent with the results shown in Fig. 4). With 20° saccades he always tended to see bars near 0°, irrespective of where they were displayed. Even with 2.5° saccades, the compression was considerable. Observer J.A.M. also showed compression for the shorter saccade, but it was less extreme. All data could be well simulated with a single model, with the same parameters as used in the previous figures (see Table 1 for values).
Fig. 6.
Results similar to those of Figure 4, for different observers and variable length saccades (indicated by thearrows near the abscissas). Saccade amplitude was 20° for A, B, E, 10° forC (viewing distance, 50 cm), 5° for D(viewing distance, 100 cm) and 2.5° for F (viewing distance, 200 cm). The bar was briefly presented in the interval just before the onset of saccades (for 20 and 10°, −25 <t < 0 msec; for the smaller saccade, between −10 < t < 0).
Importance of visual cues
In the previous experiments, the only features on the screen were the initial fixation point and the saccadic target (the ruler appeared 500 msec later). One possibility is that these features act as “passive attractors,” which in some way bias apparent position in their direction. To examine this idea, we attempted two variants, shown in Figure 5D. For one experiment we primed the position of the stimulus with a large, high-contrast dot flashed before the saccade (data shown in Fig. 5D, open circles); in another we added at 50 random locations additional stationary “seed” dots, of identical size and color to the saccadic target (Fig. 5D, triangles). In this condition the saccadic target was always present, decreasing in contrast to signal the observer to make a saccade.
It may be argued that the first intervention should decrease the uncertainty of the stimulus position, decreasing the compression. The second may decrease the attractiveness of the saccadic target by diluting it with competing attractors. In fact neither intervention changed the pattern of results. This would suggest that if the fixation points are serving as attractors in some way, they do not do so passively.
Localization orthogonal to saccade direction
Figure 5E suggested that saccades had little effect on the vertical position of horizontal bars during horizontal saccades. We pursued this further by asking observers to locate in two dimensions the center of disks (6° diameter) displayed at random anywhere within the whole display area in the critical interval 0–40 msec before saccade onset. Because localization in two dimensions was more difficult than in one dimension, we collected data only from the experienced observers M.C.M. and J.R. The results are shown in Figure7, for horizontal localization (Fig.7A,C) and for vertical localization (Fig. 7B,D). Horizontal localization was not dissimilar to previously reported results, except for an increase in variability, probably attributable to the increase in eccentricity of the stimuli and the greater demands of the two-dimensional task. Vertical localization, however, was quite veridical. There was a certain level of noise, but there was no systematic dependency on vertical position. Nor was there a dependency on horizontal position (data not shown).
Multiple targets
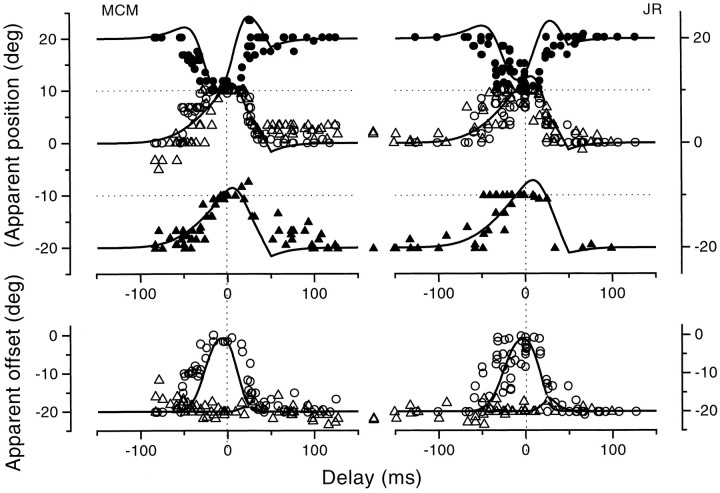
As a more severe test of the dependence of saccadic displacement on spatial position, and of compression, we used a stimulus comprising two half-bars (1.8 × 25°), one displayed from the midline to the top, the other from the midline to the bottom of the screen. In the first experiment they were first displayed simultaneously, but at different positions, either at −20 and 0° or at 0 and 20° (with the top or bottom assigned to one of the two possible positions at random). Observers made 20° saccades (from −10 to +10°) and were required to report separately the positions of both bars. Figure8 shows the results for equiluminant stimuli for two observers, M.C.M. and J.R. The top curvesplot the positions of the half-bars, with different symbols for the two sets of spatial positions. The pattern of results is similar to that observed with full bars (Fig. 2). Furthermore, the apparent position of one half-bar does not depend on the true position of the other; the data for position 0° for the −20/0° condition (Fig. 8,triangles) and the 0/20° condition (Fig. 8,circles) were very similar.
Fig. 8.
Judgment of the apparent position of two half-bars displayed simultaneously at different positions, either at −20 and 0° (filled and open triangles, respectively) or at 0 and 20° (open and filled circles, respectively), while observers made 20° horizontal saccades. The results for half-bars shown in pairs are similar to those for single isolated bars. The bottom curves show the apparent separation of the bars for the two conditions. Whereas the −20/0° (triangles) pair maintains a veridical separation of −20° at all delays, the separation of the 0/20° pair (circles) shrinks just before saccadic onset, when they appear to be colinear.
The effects of compression are brought out more clearly in thebottom curves of Figure 8, which show the apparent separations for the two conditions. Although the −20/0° pairs were always seen to be separated by −20° (correctly), the separation between the 0/20° pair narrowed to around 0° near saccade onset. This is again consistent with compression and does not rely on absolute judgments relative to an external ruler but on the differences of such judgments: any systematic biases should be eliminated in the subtraction.
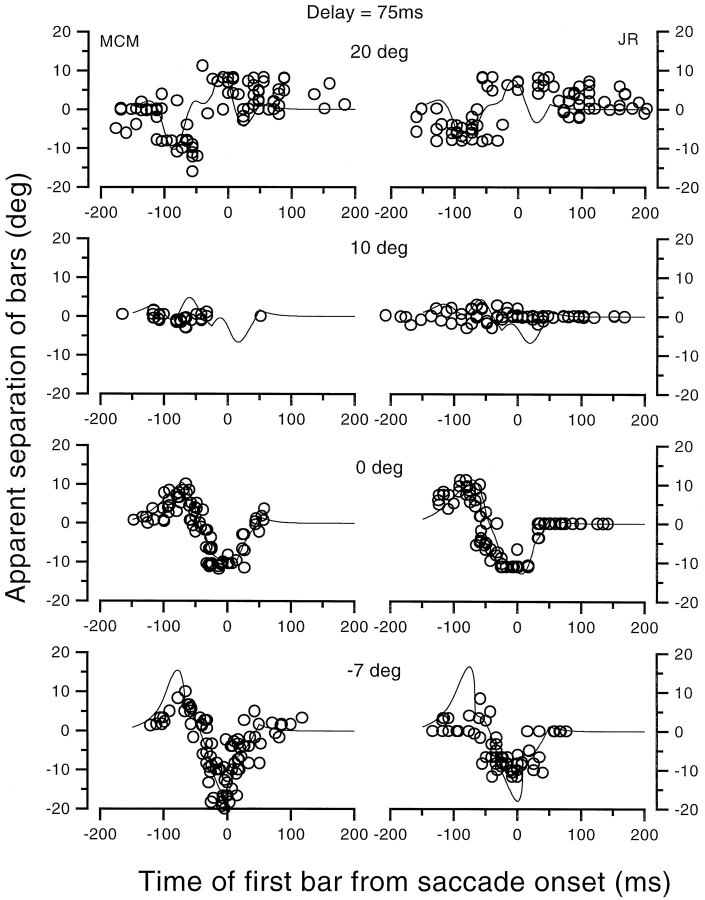
We next measured the apparent separation of two half-bars (again equiluminant and 1.8 × 25°) that were colinear but separated in time by 75 msec (order of top and bottom randomized). Here observers were required to report the sign and amplitude of the separation, rather than the positions of each half-bar. With this technique there was no requirement for observers to make position judgments relative to an external scale. The results are shown in Figure9 for four different spatial positions of the bars: −7, 0, 10, and 20°. The ordinate shows the difference between the second and the first presented bars, so a positive number means a relative displacement of the second bar in the direction of the saccade.
Fig. 9.
Apparent separation of colinear half-bars presented at various positions with a 75 msec asynchrony, at various (randomized) delays of the first bar relative to the onset of a 20° horizontal saccade. Although physically colinear, the bars appeared to be offset over much of the range of delays. The direction of the offset depended on spatial position. At 0 and −7°, the displacement was initially positive (meaning that the second bar was displaced in the direction of the saccade), becoming negative as time progressed. At 20°, the pattern of results was reversed (although somewhat noisier). At 10°, the saccadic target, there was very little displacement in either direction. Note that for t < −75 msec, both bars were presented to the same physical position on stationary retinas.
The pattern of results is clearly different for the three conditions. The most interesting interval is between −100 and −75 msec, when both bars are presented at the same position to stationary eyes and the second, but not the first, falls near the saccade onset. When presented at 0°, there was a positive displacement during this period, implying that the second bar was displaced in the direction of the saccade. When the bar was displayed at 20°, however, the displacement occurred in the opposite direction, consistent with previous results of this report. After the eyes began to move, the pattern of the results changed as the eye movement displaced the retinal position of the bars. It is notable that bars displayed near 10° (the saccadic target, the main focus of compression) were never seen as being offset, at any delay, even when eye movements caused them to be painted at different positions. The results for bars at 0 and 20° show very clear signs of both displacement and compression before saccades, without relying on absolute judgment relative to an external ruler.
Effect of simulated saccades on apparent position
Time course of localization
To disentangle the effects of image motion and displacement from more central effects accompanying saccades, we repeated some of these experiments with simulated saccadic movements. Observers viewed the display through a large mirror that displaced the whole scene, including the display screen and its surround, through 20° at saccadic speed. As with the first experiments, observers were required to report the apparent position of equiluminant bars displayed at various times relative to the onset of the mirror motion.
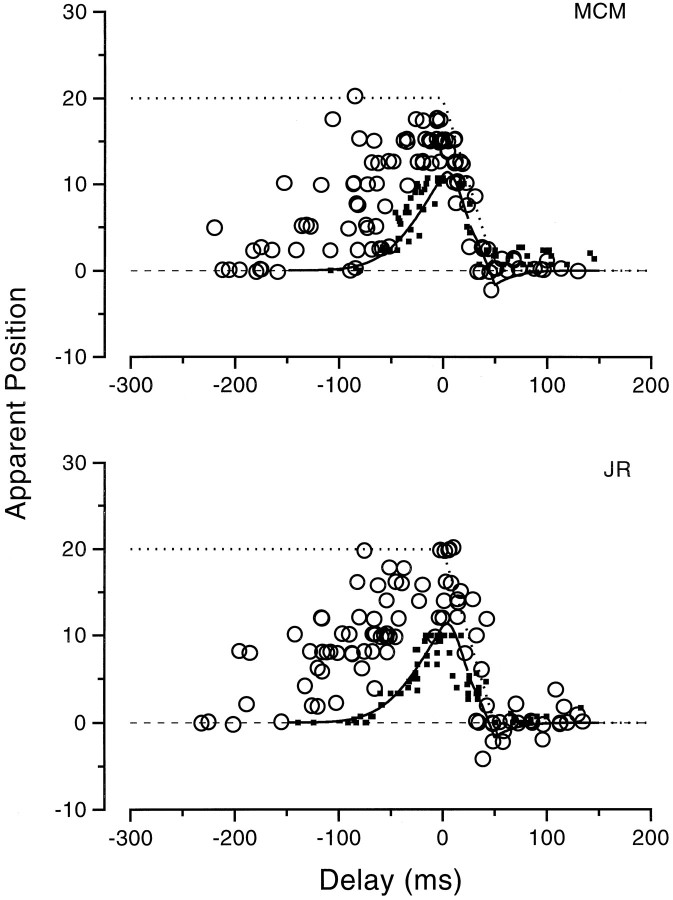
Figure 10, open circles, shows the results for bars displayed at position 0. For comparison data collected with real saccades under otherwise identical conditions have been replotted from Figures 2 and 3 (small squares), together with the model fit. At first glance the results seem similar, with an early mislocalization in the direction of motion, but there are some interesting differences. The first is that the mislocation in the simulated saccades is typically of greater magnitude than during real saccades, often up to 20° (the size of the displacement), whereas the mislocalization during real saccades never exceeded 10°. Another clear difference is that during the simulated saccades, the mislocalization commenced far earlier, even 200 msec before movement onset, whereas the saccadic results were all ∼0° for times less than 50–60 msec. There was also considerably more scatter in the data for simulated saccades over the period preceding the motion than observed with real saccades.
Fig. 10.
Apparent position of bars before, during and after simulated saccades, produced by displacing the image 20° rightward at saccadic speeds. The results are shown by the large open circles. The small squares show the results during saccades (replotted from Figs. 2, 3) for comparison. Thedotted line shows the physical displacement of the bar caused by the mirror.
Figure 10, dotted line, shows the physical effect of the mirror motion, assuming a “photographic” retina. The comparison ruler came on 500 msec after the mirror motion, so judgments with the mirror in its final position should be veridical. Before that time, the point of retinal stimulation will be systematically shifted by the mirror, as indicated by the dotted line. The data follow this prediction reasonably well for 0 < t < 150 msec but begin to fail for times before t = 0. There is also considerable scatter over this region, and the observers complained that the task was very difficult.
Effect of spatial position
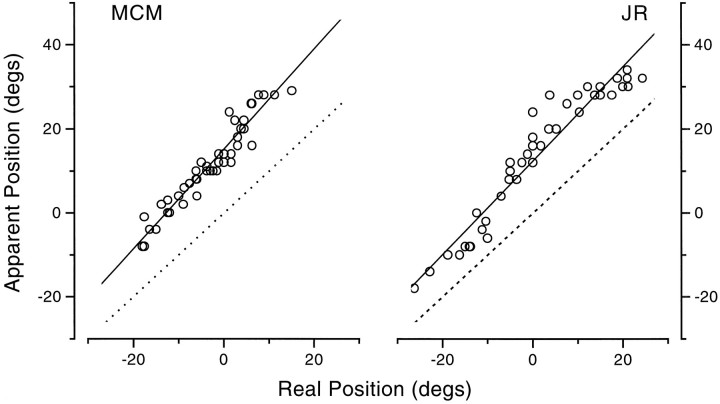
To examine whether the effects of the simulated saccades varied with space, observers were asked to report the apparent position of bars displayed at various spatial positions, just before the mirror started to move (t ≈ −20 msec). Figure11 shows the results for the two observers. The bars were always seen displaced in the direction of the motion, with no tendency for the displacement to reverse for positions beyond the saccadic target (compare with Figs. 5, 6 for the saccadic results). Furthermore, the amount of displacement was quite constant with spatial position. The lines through the data are linear regressions, having slopes of 1.2 and 1.1 for M.C.M. and J.R., respectively. This is certainly not consistent with compression, which would produce slopes of less than unity.
Fig. 11.
Apparent position of bars presented at random positions just before 20° saccadic-like motion (t= 64–20 msec). Bars were systematically mislocalized against the direction of motion by a similar amount at all positions. The regression lines have slope greater than unity (1.1 for M.C.M., 1.2 for J.R.), showing that there is no compression (if anything, a slight expansion) of space with simulated saccades.
Vernier alignment
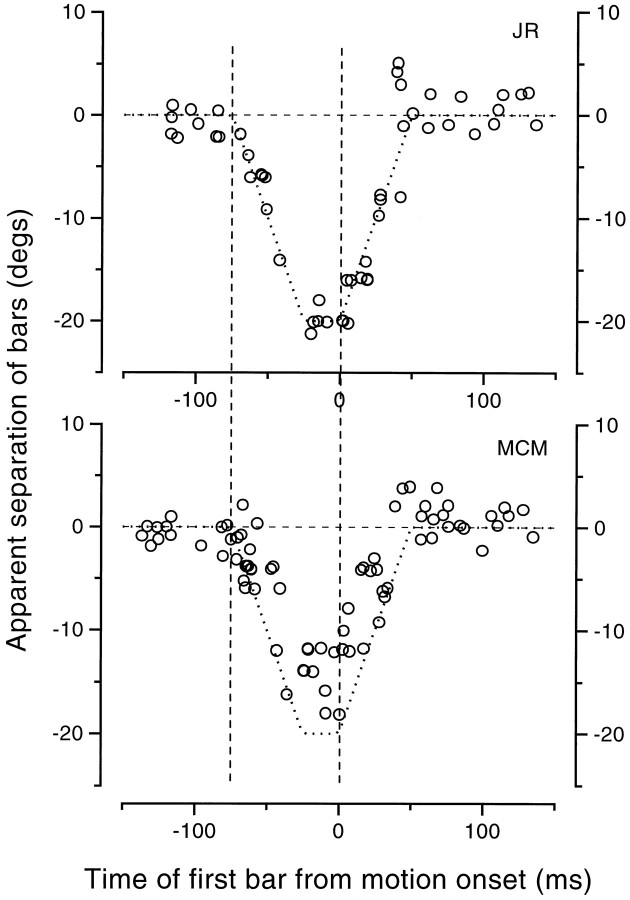
One of the most powerful pieces of evidence of mislocalization (in both directions) before saccades was given by the estimates of apparent vernier offset of two colinear half-bars presented at different times (results shown in Fig. 9), which did not rely on judgments relative to some external ruler. We repeated this for the simulated saccade for bars presented at position 0. The results, shown in Figure12, are quite different from those obtained in real saccades. In the critical period −100 <t < −75 msec (when both were displayed before the movement), the bars were seen to be aligned, compared with the large and systematic apparent offset observed with real saccades. Thedashed lines show the predictions based on retinal displacements caused by the mirror movement. The data follow this physical prediction quite well, although the data of M.C.M. tend to underestimate the magnitude of the offset by about 30%.
Fig. 12.
Apparent separation of colinear half-bars presented with a 75 msec asynchrony at various delays relative to the onset of a 20° saccadic-like movement (analogous to the experiment of Fig. 9). The dotted lines show the physical separation caused by the motion of the mirror during stimulus presentation. The data follow this prediction quite well (except for a tendency of M.C.M. to underestimate the displacement). There was no mislocalization before −75 msec (indicated by the left vertical dashed line), when both bars were displayed to stationary retinas (compare with Fig.9).
Thus it can safely be concluded that effects of saccades on apparent direction are not entirely attributable to the displacement caused by the saccade or to the sense of motion created by it or by masking attributable to image motion.
Spatial distortions during real and simulated saccades
The results to date suggest that saccades can produce strong visual compression, especially toward the saccadic target. Image motion of comparable speed and duration does not produce similar effects. We explored the generality and strength of the compression by examining the appearance of complex natural scenes and multiple stimuli around saccadic onset.
We first looked informally at the effects of saccades on natural scenes by briefly presenting a variety of natural scenes and portraits to observers and asking them to report on their appearance. When the images appeared just before saccadic onset, the scenes seemed to be compressed along the direction of the saccade, around the saccadic target (for example, see Ross et al., 1997). All observers, both trained and naive, agreed about the compression, although there were subtle differences in exactly how they perceived the scenes. During simulated saccades with the moving mirror, no such compression occurred.
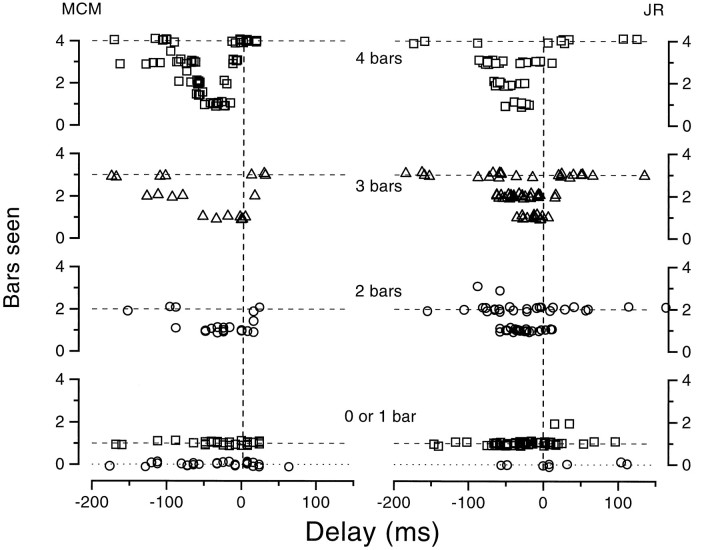
To quantify these effects, we displayed multiple bars (between 0 and 4) around the saccadic target at different times and asked observers to report how many they saw. The bars could occupy some or all of four possible positions around the saccadic target (at 10°): 1, 7, 13, and 19°. The number of bars, the positions to which they were displayed, and their delay were varied at random. The results for two trained observers making 20° left-to-right saccades are shown in Figure 13. Observers never reported seeing a bar when none had been displayed (Fig. 13, circles) and always reported one bar when only one was displayed, no matter where it fell (Fig. 13, squares). With multiple bars, however, both observers tended to underestimate bar number during the critical period preceding saccade onset. Four bars were typically seen as one during this period. Note that it would be difficult for observers to bias these results, because they did not know when the bars were displayed or how many there were in a given trial.
Fig. 13.
Observers were asked to report how many bars they saw displayed. Multiple bars (between 0 and 4) were displayed simultaneously around the saccadic target, at some or all of four possible positions: 1, 7, 13, and 19°. The number of bars, the positions to which they were displayed, and the display time were randomized (except that 4 bars was more frequent than the other possibilities). The results show that there were no false-positives (zero bars were always reported as such), and single bars were always seen, irrespective of their position. However, multiple bars tended to be grossly underestimated when displayed during the interval near the start of each saccade; they tended to collapse to a single bar.
Results similar to those reported here have been obtained with naive observers (see Ross et al., 1997). Furthermore, literally dozens of visitors to our laboratories have verified the main effect, that four bars presented just before a saccade are seen as one.
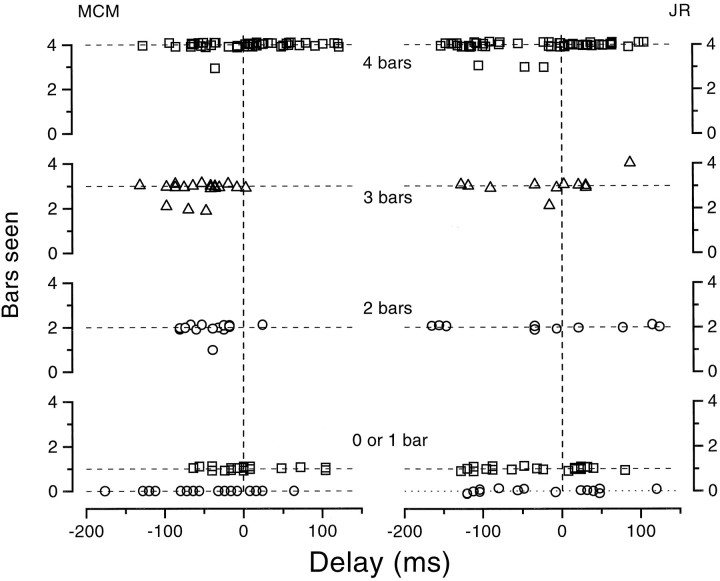
Figure 14 shows the results with the simulated 20° saccades under similar conditions. Observers occasionally underestimated bar number around the time of image motion but never erred by more than one bar.
Fig. 14.
Observers were asked to report how many bars they saw in a display (similar to Fig. 14) but with simulated rather than real saccades. Observers sometimes reported four bars as three or three as two (possibly because of the eccentricity of the bars) but did not show the large and systematic underestimation seen with real saccades.
Mathematical model of the results
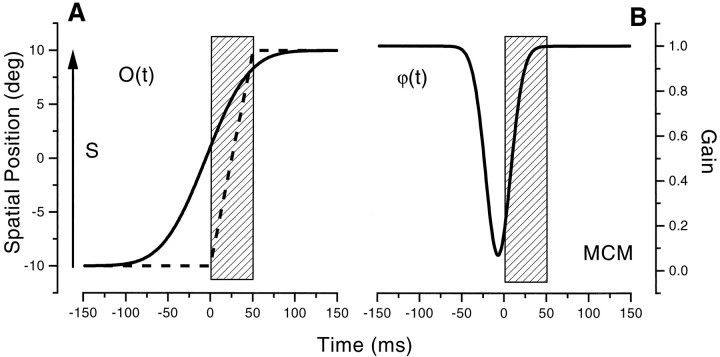
All of the curves passing through the data in the previous graphs were derived with a two-component model, described in this section. The first component, O(t), represents the origin of the internal coordinate system, which shifts from the fixation (F0) to the saccadic target position (F1), mimicking closely the intention-to-move signal of the von Holst and Mittelstaedt (1950)model. The shift commences before the initiation of the saccade and proceeds gradually over time following a cumulative gaussian function:
| Equation 1 |
where t is time relative to saccadic, and τ0 and ς are free parameters that describe the peak time and spread of the gaussian function. An example of the functionO(t), used to fit the data of subject M.C.M., is illustrated in Figure15A.
Fig. 15.
Illustration of the functions that change the origin of the internal coordinate system [O(t); Eq. 1] and the compression of the spatial metric [ϕ(t); Eq.2]. The dotted line illustrates the time course of the saccades, from −10 to 10°. See Mathematical Model of the Results for full details of the model.
The second component of the model modulates the metric of the internal space (expressed in units of retinal eccentricity). During fixation this is equal to identity but nearly vanishes in proximity of the saccade:
| Equation 2 |
where a0,t1, and ς1 are free parameters describing the strength and time course of the compression (see Fig. 15B).
Having defined the origin shift and the metric compression functions, it is now possible to express the apparent position,P(x,t), as a function of the retinal eccentricity:
| Equation 3 |
where E(x,t) is the retinal eccentricity of the stimulus defined as the difference between the stimulus position (in space; x) and the position of the eye. Sign is the sign function, and S = (F1 − F0)/2 is half of the amplitude of the saccade. The eye motion was modeled by assuming constant velocity (v) for the duration of the saccade (tf), flanked by zero velocity fixations (a reasonably close approximation under these conditions; Carpenter, 1988):
| Equation 4 |
The model uses five free parameters that were determined separately for each subject to obtain the best overall fit for all of the data collected for that subject. The values of all of the parameters are reported in Table 1. The gaussian function determining the origin shift is very similar for all subjects (with the exception of M.D.), having the same spread of about 40 msec and peak position varying by <5 msec. The spread of the collapse function varies more between subjects, but the minimum of the function varies very little in position and amplitude. Given this small variability, there are probably less than five useful free parameters.
The change-of-origin signal O(t) has a time constant similar to that of the saccade. However, it precedes the saccade and reaches 50% of its final value at the onset of the saccade and 90% of it by the end of the saccade. The compression signal is also gradual, with a smaller time constant, but it reaches its minimum at about saccadic onset.
The above model provided a satisfactory fit for all observers except M.R.D. This subject showed an extremely strong compression for large saccades, whereas his results for smaller saccades were similar to those of the other subjects. To simulate this differential effect, it was necessary to consider that the planned displacement (F1 − F0) induced by the saccade was smaller than the effective one for the large saccadic condition. We assumed that the planned saccade was always 3° for all of the saccadic amplitudes tested (20, 10, and 2.5°).
To model both equiluminance and luminance apparent position data, it was necessary to take into account the faster transmission (or integration time) of the luminance response. This was achieved by introducing a delay of 10 msec for the origin shift and the compression signals. Interestingly, the delay needed to simulate the data corresponds quite closely to that evaluated psychophysically in a separate study under similar light and adaptation conditions (Burr and Morrone, 1993).
DISCUSSION
Comparison with previous studies
Several previous psychophysical studies have demonstrated anticipatory, presaccadic displacement of flashed stimuli in the direction of saccades, up to 100 msec before they start, both in total darkness (e.g., Matin, 1972; Honda, 1991; Schlag and Schlag-Rey, 1995) and with visual referents present (Honda, 1993, 1995). The displacement we find is maximal in the 25 msec before saccades and depends on stimulus position; it is in the opposite direction for stimuli beyond the end point of a saccade. There have been previous reports showing a dependency of perisaccadic mislocalization on spatial position (Matin and Pearce, 1965; Bischof and Kramer, 1968; O’Regan, 1984; Honda, 1995), but none of these found a reversal in direction as we do or pursued their findings to demonstrate compression with multiple targets or other techniques. O’Regan (1984) attempted to explain position dependency as an artifact arising from differences in visual persistence at different eccentricities, but this explanation would have difficulty explaining how four bars, each perfectly visible individually, could merge into one, and how even natural scenes are altered in appearance by saccades in ways consistent with errors in the location of single targets. Perhaps the most convincing evidence for simultaneous mislocalizations in two different directions comes from estimates of vernier offset, particularly when both half-bars are presented before the eyes move. These results (Fig. 9) are not confounded by movements of the eyes or by strategies used to locate bars in space.
Several recent studies, conducted under conditions different from ours, show target mislocalizations in the direction of the saccade, even for stimuli past the saccadic target (e.g., Miller, 1996; Cai et al., 1997). We can only speculate on the reasons for the discrepancy between their results and ours. Perhaps the major difference is that our studies were performed at photopic luminances, whereas those not finding the inversion were performed in the dark. It is possible that the reversal in direction depends on visual cues, although these by themselves are not sufficient to cause the effects (as shown by the simulated saccades). Alternatively, visual function could be qualitatively different at low luminance levels. Other details in the techniques were also different, such as exposure duration and the task required of the observer. Further research would be need to determine the main reason for the discrepancy.
Real versus simulated saccades
It has been suggested that errors of location before and during saccades may not result from reorganization of linkages between retina and space but from image motion (MacKay, 1970; O’Regan, 1984;Sperling, 1990). Our control studies show that this is not the case under the conditions of these experiments. Simulated saccades affect target localization, but the effects were quite different in magnitude, time course, and even sign from those during eye movements, and there was no evidence of compression with multiple targets. When four bars were shown simultaneously in the simulated saccade condition, subjects almost always reported four and never fewer than three. This contrasts with the real saccade condition, in which often only one bar was reported when four were displayed in the 50 msec before a saccade.
Figure 10, dotted line, shows the physical displacement caused by the mirror, predicting performance based on a cumulative photographic record of retinal images, both of the bar and the later ruler. The results follow this prediction quite well while the mirror is in motion and for a short time before. For earlier presentations, however, there is a very large scatter, over the full 20° range. This could suggest the action of two processes: an absolute judgment based on the retinotopic record indicating a bar located at 20° and a relative judgment based on the position within the screen, indicating a bar at ∼0°. Only at presentations long before motion onset did observers reliably report seeing the bar at position 0, presumably because the retinotopic trace, or memory, had completely faded. Not only was there considerable scatter in the data, but observers reported considerable difficulty and conflict. Interestingly, this conflict seems not to arise for real saccades, for which the range of errors was less, and observers were more comfortable with the task. Nevertheless, one should be cautious about using this type of task for measuring saccadic mislocalization, given the ambiguity it causes in normal viewing. For this reason, we place greatest confidence in the vernier task, in the interval t < −75, when both bars are displayed to stationary retinae. There was a strong position-dependent mislocalization during saccades but no effect for the simulated saccades (compare Figs. 9, 12).
Model and its biological basis
We can model our results for real saccades with two assumptions: (1) that there is a shift in the assumed external reference point for the center of the fovea; and (2) that retinal eccentricities are subjected to horizontal compression. In the present implementation the model is simple and computationally economical. Two very coarse signals are sufficient to model all of the data reported here, including the counterintuitive retinotopic dependence of the localization error. The shift signal is a linear additive process, whereas the metric modulation is nonlinear. In a previous simulation of the data (Ross et al., 1997), the model used a compression signal, constructed by fading out an old origin signal and fading in a new one, that simply multiplied the metric. However, to improve the fit, the compression signal needs to depend on eccentricity, increasing the complexity of the model. In the present simulation the collapse is achieved by means of a reduction in the value of an exponent and can be thought of as a momentary disconnection or gating of the eccentricity-dependent remapping of visual input.
At this stage it is difficult to speculate about the neurophysiological substrate mediating the operations defined by the equations of our model. However, it is interesting to note that many visual centers of the brain possess the necessary hardware. The shift in external reference point assumed in our model is consistent with anticipatory shifts in receptive field location of neurons in the LIP and in the superior colliculus (Goldberg et al., 1990; Duhamel et al., 1992; Colby et al. 1995; Walker et al. 1995). Many cells in these areas respond to stimuli that will be brought into their receptive field by the saccade. These anticipatory responses are found to occur ∼50 msec before saccades begin, near the time when we find the largest position shifts. In most of the work reported to date, receptive fields shift in the direction of the saccade, consistent with our results when stimuli do not fall beyond the saccadic target. Recently, however, Ben Hamed et al. (1996) have reported more complex behaviors in LIP neurons before saccades. The receptive fields can change in a variety of bizarre ways, including translation in directions other than that of the saccade or expansion or contraction of receptive field size. These results, if confirmed, may provide a biological substrate for the compression component of our model.
Another interesting property of parietal neurons in areas 7A and LIP (and in V3 and V6) is that many vary their response gain with gaze position (Andersen et al. 1985, 1990; Galletti and Battaglini, 1989;Battaglini et al. 1996). Zipser and Andersen (1988) have suggested that the change in gain could be instrumental in transforming, via a distributed network, the internal retinocentric coordinates to oculocentric coordinates and ultimately to an allocentric system. In the model of Zipser and Andersen (1988), the gain modulation is multiplicative in nature, as is the compression in our model. It is therefore feasible that the gaze-dependent modulation of these neurons could also cause compression of the metric, if their gain were drastically reduced at the moment of transition. Interestingly, a nonvisual signal with appropriate time course does exist in some LIP neurons (Andersen et 1990, their Fig. 4); these neurons are insensitive to visual or attentive processes and have a high resting discharge that is inhibited just before saccadic onset (like the fixation neurons in the superior colliculus; Wurtz, 1996).
LIP is strategically positioned to integrate visual input, from both the magnocellular and parvocellular pathways (Fellerman and Van Essen, 1991; Merigan and Maunsell, 1993). Recent evidence, partly from our laboratories, suggests that the magnocellular pathway is inhibited during saccades, but the parvocellular pathway is not (Burr et al., 1994; Uchikawa and Sato, 1995; for review, see Ross et al., 1996a). It is possible that the parvocellular system can analyze the transient stimuli used in this study for form, orientation, and color but is unable to make an overall spatial analysis of the whole visual scene (purported to be the role of then magnocellular-dominated dorsal stream; e.g., Mishkin et al., 1983). This reduced capacity to map visual space may restrict the space within which transient stimuli can be located. This is unlikely to be a problem under normal viewing conditions, in which saccadic velocities of continuous images are beyond the resolution of the parvocellular system (Merigan, 1990), and any erroneous perception during saccades will be masked by the clear images during periods of fixation (MacKay, 1970; Matin, 1972; Campbell and Wurtz, 1978).
Footnotes
This work was supported by the Australian Research Council, the Italian Consiglio Nazionale delle Ricerche, and a Framework 4 Biomed Grant (BMH4-CT96-1461).
Correspondence should be addressed to Dr. David Burr, Istituto di Neurofisiologia del Consiglio Nazionale delle Ricerche, Via S. Zeno 51, 56127 Pisa, Italy.
REFERENCES
- 1.Andersen RA, Essick GK, Siegel PM. Encoding of spatial location by posterior parietal neurons. Science. 1985;230:456–458. doi: 10.1126/science.4048942. [DOI] [PubMed] [Google Scholar]
- 2.Andersen RA, Bracewell RM, Barash S, Gnadt JW, Fogassi L. Eye position effects on visual, memory, and saccade-related activity in areas LIP and 7a of macaque. J Neurosci. 1990;10:1176–1196. doi: 10.1523/JNEUROSCI.10-04-01176.1990. [DOI] [PMC free article] [PubMed] [Google Scholar]
- 3.Battaglini PP, Galletti C, Fattori P. Cortical mechanisms for visual perception of object motion and position in space. Behav Brain Res. 1996;76:143–154. doi: 10.1016/0166-4328(95)00192-1. [DOI] [PubMed] [Google Scholar]
- 4.Ben Hamed S, Duhamel J-R, Bremmer F, Graf W. Dynamic changes in visual receptive field organization in the macaque lateral intraparietal area (LIP) during saccade preparation. Soc Neuorsci Abstr. 1996;22:1619. [Google Scholar]
- 5.Bischof N, Kramer E. Untersuchen und Überlegungen zur Richtungswahnehmung bei wilkurlichen sakkadischen Augenbewegungen. Psychol Forsch. 1968;32:185–218. doi: 10.1007/BF00418660. [DOI] [PubMed] [Google Scholar]
- 6.Bowen RW. Latencies for chromatic and achromatic visual mechanisms. Vision Res. 1981;21:1457–1466. doi: 10.1016/0042-6989(81)90216-9. [DOI] [PubMed] [Google Scholar]
- 7.Burr DC, Morrone MC. Impulse response functions for chromatic and achromatic stimuli. J Opt Soc Am A. 1993;10:1706–1713. [Google Scholar]
- 8.Burr DC, Holt J, Johnstone JR, Ross J. Selective depression of motion sensitivity during saccades. J Physiol (Lond) 1982;333:1–15. doi: 10.1113/jphysiol.1982.sp014434. [DOI] [PMC free article] [PubMed] [Google Scholar]
- 9.Burr DC, Morrone MC, Ross J. Selective suppression of the magnocellular visual pathway during saccadic eye movements. Nature. 1994;371:511–513. doi: 10.1038/371511a0. [DOI] [PubMed] [Google Scholar]
- 10.Cai RH, Pouget A, Schlag-Rey M, Schlag Perceived geometrical relationships affected by eye-movement signals. Nature. 1997;386:601–604. doi: 10.1038/386601a0. [DOI] [PubMed] [Google Scholar]
- 11.Campbell FW, Wurtz RH. Saccadic omission: why we do not see a grey-out during saccadic eye movements. Vision Res. 1978;15:1297–1303. doi: 10.1016/0042-6989(78)90219-5. [DOI] [PubMed] [Google Scholar]
- 12.Carpenter RHS. Movements of the eyes. Pion; London: 1988. [Google Scholar]
- 13.Colby CL, Duhamel JR, Goldberg ME. Oculocentric spatial representation in parietal cortex. Cereb cortex. 1995;5:470–481. doi: 10.1093/cercor/5.5.470. [DOI] [PubMed] [Google Scholar]
- 14.Dassonville P, Schlag J, Schlag-Rey M. Oculomotor localization relies on a damped representation of saccadic eye displacement in human and nonhuman primates. Vis Neurosci. 1992;9:261–269. doi: 10.1017/s0952523800010671. [DOI] [PubMed] [Google Scholar]
- 15.Duhamel J-R, Colby CL, Goldberg ME. The updating of the representation of visual space in parietal cortex by intended eye movements. Science. 1992;255:90–92. doi: 10.1126/science.1553535. [DOI] [PubMed] [Google Scholar]
- 16.Fellerman DJ, Van Essen DC. Distributed hierarchical processing in the primate cerebral cortex. Cereb Cortex. 1991;1:1–47. doi: 10.1093/cercor/1.1.1-a. [DOI] [PubMed] [Google Scholar]
- 17.Galletti C, Battaglini PP. Gaze-dependent visual neurons in area V2 of behaving macaque monkeys. J Neurosci. 1989;9:1112–1125. doi: 10.1523/JNEUROSCI.09-04-01112.1989. [DOI] [PMC free article] [PubMed] [Google Scholar]
- 18.Goldberg ME, Colby CL, Duhamel J-R. The representation of visuomotor space in the parietal lobe of the monkey. Cold Spring Harb Symp Quant Biol. 1990;55:729–739. doi: 10.1101/sqb.1990.055.01.068. [DOI] [PubMed] [Google Scholar]
- 19.Grüsser O-J. Early concepts on efference copy and reafference. Behav Brain Sci. 1994;17:262–265. [Google Scholar]
- 20.Honda H. Perceptual localization of visual stimuli flashed during saccades. Percept Psychophys. 1989;45:162–174. doi: 10.3758/bf03208051. [DOI] [PubMed] [Google Scholar]
- 21.Honda H. The time courses of visual mislocalization and of extra-retinal eye position signals at the time of vertical saccades. Vision Res. 1991;31:1915–1921. doi: 10.1016/0042-6989(91)90186-9. [DOI] [PubMed] [Google Scholar]
- 22.Honda H. Saccade-contingent displacement of the apparent position of visual stimuli flashed on a dimly illuminated structured background. Vision Res. 1993;33:709–716. doi: 10.1016/0042-6989(93)90190-8. [DOI] [PubMed] [Google Scholar]
- 23.Honda H. Visual mislocalization produced by a rapid image displacement on the retina: examination by means of dichoptic presentation of a target and its background scene. Vision Res. 1995;35:3021–3028. doi: 10.1016/0042-6989(95)00108-c. [DOI] [PubMed] [Google Scholar]
- 24.Kawano K, Miles FA. Short-latency ocular following responses of monkey. II. Dependence on a prior saccadic eye movement. J Neurophysiol. 1986;56:1353–1377. doi: 10.1152/jn.1986.56.5.1355. [DOI] [PubMed] [Google Scholar]
- 25.MacKay DM. Mislocation of test flashes during saccadic image displacements. Nature. 1970;227:731–733. doi: 10.1038/227731a0. [DOI] [PubMed] [Google Scholar]
- 26.Matin L. Eye movements and perceived visual direction. In: Jameson D, Hurvich LM, editors. Handbook of sensory physiology, Vol VII/4, Visual psychophysics. Springer; Berlin: 1972. pp. 331–380. [Google Scholar]
- 27.Matin L, Pearce DG. Visual perception of direction for stimuli flashed during voluntary saccadic eye movements. Science. 1965;148:1485–1488. doi: 10.1126/science.148.3676.1485. [DOI] [PubMed] [Google Scholar]
- 28.Matin L, Matin E, Pearce DG. Visual perception of direction when voluntary saccades occur: I. Relation of visual direction of a fixation target extinguished before a saccade to a subsequent test flash presented during the saccade. Percept Psychophys. 1969;5:65–80. [Google Scholar]
- 29.Matin L, Matin E, Pola J. Visual perception of direction when voluntary saccades occur: II. Relation of visual direction of a fixation target extinguished before a saccade to a subsequent test flash presented before the saccade. Percept Psychophys. 1970;8:9–14. [Google Scholar]
- 30.Merigan WH. P and M pathway specialization in the macaque. In: Valberg A, Lee BB, editors. From pigments to perception. Plenum; New York: 1991. pp. 117–126. [Google Scholar]
- 31.Merigan WH, Maunsell JHR. How parallel are the primate visual pathways? Annu Rev Neurosci. 1993;16:369–402. doi: 10.1146/annurev.ne.16.030193.002101. [DOI] [PubMed] [Google Scholar]
- 32.Miller J. Egocentric localization of a perisaccadic flash by manual pointing. Vision Res. 1996;36:837–851. doi: 10.1016/0042-6989(95)00184-0. [DOI] [PubMed] [Google Scholar]
- 33.Mishkin M, Ungerleider LG, Macko KA. Object vision and spatial vision: two cortical pathways. Trends Neurosci. 1983;6:414–417. [Google Scholar]
- 34.Morrone MC, Ross J, Burr DC. Restructuring of perceptual space before saccades. Soc Neurosci Abstr. 1996;22:271. [Google Scholar]
- 35.O’Regan JK. Retinal versus extraretinal influences in flash localization during saccadic eye movements in the presence of a visual background. Percept Psychophys. 1984;36:1–14. doi: 10.3758/bf03206348. [DOI] [PubMed] [Google Scholar]
- 36.Ross J, Burr DC, Morrone MC. Suppression of the magnocellular pathways during saccades. Behav Brain Res. 1996a;80:1–8. doi: 10.1016/0166-4328(96)00012-5. [DOI] [PubMed] [Google Scholar]
- 37.Ross J, Morrone MC, Burr D. Collapse of perceptual space during saccade. Invest Ophthalmol Vis Sci. 1996b;37:3238. [Google Scholar]
- 38.Ross J, Morrone MC, Burr DC. Compression of visual space before saccades. Nature. 1997;384:598–601. doi: 10.1038/386598a0. [DOI] [PubMed] [Google Scholar]
- 39.Schlag J, Schlag-Rey M. Illusory localization of stimuli flashed in the dark before saccades. Vision Res. 1995;35:2347–2357. doi: 10.1016/0042-6989(95)00021-q. [DOI] [PubMed] [Google Scholar]
- 40.Sherrington CS. Observations of the sensual role of the proprioceptive nerve supply of the extrinsic eye muscles. Brain. 1918;41:332–343. [Google Scholar]
- 41.Shiori S, Cavanagh P. Saccadic suppression of low-level motion. Vision Res. 1989;29:915–928. doi: 10.1016/0042-6989(89)90106-5. [DOI] [PubMed] [Google Scholar]
- 42.Sperling G. Comparison of perception in the moving and stationary eye. In: Kowler E, editor. Eye movements and their role in visual and cognitive processes. Elsevier; Amsterdam: 1990. pp. 307–351. [PubMed] [Google Scholar]
- 43.Sperry R. Neural basis of the spontaneous optokinetic response produced by visual inversion. Journal Comp Physiol Psychol. 1950;43:482–489. doi: 10.1037/h0055479. [DOI] [PubMed] [Google Scholar]
- 44.Uchikawa K, Sato M. Saccadic suppression to achromatic and chromatic responses measured by increment-threshold spectral sensitivity. J Opt Soc Am A. 1995;12:661–666. doi: 10.1364/josaa.12.000661. [DOI] [PubMed] [Google Scholar]
- 45.von Helmholtz H. Handbuch der Physiologischen Optick, Vol 3. Voss; Leipzig: 1866. [Google Scholar]
- 46.von Holst E, Mittelstaedt H. Das Reafferenzprinzip. Naturwissenschaften. 1950;37:464–476. [Google Scholar]
- 47.Walker MF, Fitzgibbon J, Goldberg ME. Neurons of the monkey superior colliculus predict the visual result of impending saccadic eye movements. J Neurophysiol. 1995;73:1988–2003. doi: 10.1152/jn.1995.73.5.1988. [DOI] [PubMed] [Google Scholar]
- 48.Whitteridge D. Central control of the eye movements. In: Field, Magoun, Hall, editors. Handbook of physiology, Vol II. American Physiological Society; Washington, DC: 1960. pp. 1089–1109. [Google Scholar]
- 49.Wurtz RH. Vision for the control of movement. Invest Ophthalmol Vis Sci. 1996;37:2131–2145. [PubMed] [Google Scholar]
- 50.Zipser D, Andersen RA. A back-progation programmed network that stimulates response properties of a subset of posterior parietal neurons. Nature. 1988;331:679–684. doi: 10.1038/331679a0. [DOI] [PubMed] [Google Scholar]


