

Abstract
Cortical synapses exhibit several forms of short-term plasticity, but the contribution of this plasticity to visual response dynamics is unknown. In part, this is because the simple patterns of stimulation used to probe plasticity in vitro do not correspond to patterns of activity that occur in vivo. We have developed a method of quantitatively characterizing short-term plasticity at cortical synapses that permits prediction of responses to arbitrary patterns of stimulation. Synaptic responses were recorded intracellularly as EPSCs and extracellularly as local field potentials in layer 2/3 of rat primary visual cortical slices during stimulation of layer 4 with trains of electrical stimuli containing random mixtures of frequencies. Responses exhibited complex dynamics that were well described by a simple three-component model consisting of facilitation and two forms of depression, a stronger form that decayed exponentially with a time constant of several hundred milliseconds and a weaker, but more persistent, form that decayed with a time constant of several seconds. Parameters obtained from fits to one train were used to predict accurately responses to other random and constant frequency trains. Control experiments revealed that depression was not caused by a decrease in the effectiveness of extracellular stimulation or by a buildup of inhibition. Pharmacological manipulations of transmitter release and postsynaptic sensitivity suggested that both forms of depression are mediated presynaptically. These results indicate that firing evoked by visual stimuli is likely to cause significant depression at cortical synapses. Hence synaptic depression may be an important determinant of the temporal features of visual cortical responses.
Keywords: facilitation, depression, temporal integration, temporal filtering, contrast adaptation, presynaptic, neocortex, nonlinearity, EPSC, field potential
Several decades of concerted effort have yielded important insights into the mechanisms that underlie spatial-filtering properties of primary visual cortical (V1) neurons (for review, see Shapley and Lennie, 1985; Ferster, 1994; DeAngelis et al., 1995) but have revealed much less about the mechanisms that underlie their temporal-filtering properties. Temporal-filtering properties are important because of their role in adaptation and gain control (Bonds, 1991; Nelson, 1991a; Abbott et al., 1997), velocity tuning (Orban et al., 1985), and direction selectivity (Reid et al., 1991; Jagadeesh et al., 1993). Recently, we proposed that some of the specific temporal-filtering properties of visual cortical neurons reflect short-term plasticity at cortical synapses (Abbott et al., 1997; Nelson et al., 1997; for related ideas, see Grossberg, 1984;Thomson and Deuchars, 1994; Finlayson and Cynader, 1995; Fisher et al., 1997; Lisman, 1997; Tsodyks and Markram, 1997). Short-term plasticity at neocortical synapses is typically studied by applying pairs or brief constant frequency trains of electrical impulses (Sutor and Hablitz, 1989; Thomson and West, 1993; Thomson et al., 1993; Metherate and Ashe, 1994; Castro-Alamancos and Connors, 1996; Hess et al., 1996; Stratford et al., 1996). This approach has been invaluable for understanding the mechanisms of short-term plasticity but does not provide a general means of predicting responses during more complex patterns of activity, such as those that occur in vivo. Developing such a method is important for understanding the role these synaptic processes play in the sensory responses of cortical neurons.
Single-unit studies have revealed that the temporal properties of V1 responses can differ substantially from those of neurons in the lateral geniculate nucleus (LGN). In general, V1 neurons respond to lower temporal frequencies and slower velocities than do LGN neurons (Movshon et al., 1978; Orban et al., 1985; Hawken et al., 1996). However, unlike linear low-pass filters, cortical neurons typically respond briskly to transients that contain high-frequency components, although they often have smaller sustained responses (Kulikowski et al., 1979). In addition, the responses of cortical neurons show much more pronounced adaptation during prolonged stimulation than do LGN neurons. Rapid adaptation effects, recovering over the course of a fraction of a second (Bonds, 1991; Nelson, 1991a), and more prolonged adaptation effects, recovering over the course of many seconds (Movshon and Lennie, 1979; Ohzawa et al., 1982), have been observed. Finally, heterogeneity of temporal-filtering properties across the receptive fields of some cortical neurons may play an important role in generating direction selectivity (Reid et al., 1991; Jagadeesh et al., 1993).
Classical studies of synaptic transmission at the neuromuscular junction identified short-term enhancement and depression occurring over several time scales (for review, see Magleby, 1987; Zucker, 1989;Fisher et al., 1997). Enhancement has been particularly well characterized. Four temporally distinct components of response enhancement (facilitation 1, facilitation 2, augmentation, and potentiation) have been identified first at neuromuscular junctions and later at central synapses and have been shown to result from enhanced release of neurotransmitter that persists after presynaptic calcium entry (Swandulla et al., 1991; Regehr et al., 1994).
The time course and mechanisms underlying depression have not been as completely characterized, but depression is believed to result from depletion of a readily releasable pool of neurotransmitter (Betz, 1970;Kusano and Landau, 1975). Depression seems to be a particularly prominent feature of transmission at neocortical synapses (Deisz and Prince, 1989; Nelson and Smetters, 1993; Thomson et al., 1993; Markram and Tsodyks, 1996). Depression and facilitation can coexist, and the balance between the two depends strongly on quantal content. Conditions under which larger numbers of quanta are released per action potential (or probability of release is high) favor depression, whereas conditions under which smaller numbers of quanta are released per action potential (or probability of release is low) favor facilitation (for review, see Zucker, 1989). The objective of the present study was to measure the temporal transfer characteristics of cortical synapses in sufficient detail to permit prediction of responses to arbitrary patterns of stimulation.
MATERIALS AND METHODS
Coronal slices containing primary visual cortex were obtained from Long Evans rats, age postnatal days 14–40. Animals were deeply anesthetized with ketamine (100 mg/kg) and acepromazine (10 mg/kg) or with pentobarbital (35 mg/kg) and decapitated, and their brains were quickly removed and placed in chilled (5°C) artificial CSF (ACSF). Slices of 400 μm thickness were cut on a vibratome. During recording, slices were transilluminated, permitting visualization of the location of primary visual cortex and the boundaries between layers 2/3 and 4 (Domenici et al., 1995).
Slices were maintained at room temperature on semipermeable membranes (Falcon 3090) covered by a thin layer of ACSF continuously oxygenated with 95% O2/5% CO2. They were transferred one at a time to a submerged chamber mounted on a fixed-stage upright microscope (Nikon Optiphot UD) and were slowly warmed to 34–35°C. Slices were equilibrated for 1–2 hr before recording and remained viable for up to 16 hr. Slices were perfused with warmed, oxygenated ACSF at a rate of 2–3 ml/min. For obtaining visually guided whole-cell recordings, slices were illuminated obliquely through an infrared filter and viewed with standard optics using a 40× long working-distance water immersion objective. The resulting image was displayed on a video monitor using a CCD camera.
Solutions. ACSF contained (in mm): 126 NaCl, 3 KCl, 1.25 NaH2PO4, 10 dextrose, 20 NaHCO3, 2 MgSO4, and 2.0 CaCl2. pH was 7.4 when saturated with 95% O2/5% CO2, and osmolarity was 305–310 mOsm.
Pipettes were pulled from 1.0-mm-outer diameter thin-walled capillary tubing (Warner Instruments) on a Flaming–Brown horizontal puller (Sutter) and were filled with (in mm): 130 potassium methylsulfonate, 10 KCl, 10 HEPES, 0.5 EGTA, 2–3 Na2ATP, 0–1 GTP, and 2 MgSO4. Osmolarity of the internal solution was 280–290 mOsm, and pH was 7.2–7.4.
Electrophysiological techniques. Whole-cell recording pipette resistances were 4–8 MΩ in the bath. Voltage-clamp recordings were performed using an Axopatch 1D (Axon Instruments). Seal resistances were 1–10 GΩ. Unless stated otherwise, cells were voltage-clamped at −70 mV. Series resistances (5–20 MΩ) were uncompensated. Voltages were not corrected for liquid junction potentials. EPSCs were judged to be monosynaptic if they occurred with short (1.5–4 msec) and constant (jitter <1 msec) latency that did not change with small changes in stimulus strength. EPSCs were included only if additional inhibitory components were not present after depolarization (40–50 mV above rest).
Field potential recordings were obtained from low resistance (1–2 MΩ) saline-filled pipettes. Biphasic electrical stimuli (80 μsec in duration; 10–150 μA) were delivered via saline-filled pipettes. Electrode placements were performed under low power using transillumination.
Signals were filtered at 1–1000 Hz (field potentials) or DC 2 kHz (EPSCs) and digitized at 5 kHz (Instrutech). Data were collected and analyzed using IGOR (Wavemetrics, Oswego, OR), Pulse Control (Herrington et al., 1995), and additional fitting routines implemented in the C programming language.
Data analysis. Response magnitudes were measured as peak amplitudes within a 1 msec window. Amplitudes, rather than slopes of field potentials, were measured because in many cases the initial slope was contaminated by a nonsynaptic response (Hess et al., 1996). We were concerned initially that truncation of the peak response by overlapping inhibition might significantly influence the kinetics of the measured plasticity. For example, apparent depression of excitatory responses could actually reflect potentiation of inhibition. Several observations indicate that this was not the case. (1) In five slices in which the synaptic and nonsynaptic responses were fully separated, we confirmed that measurements of initial slope and peak amplitude were well correlated (mean Pearson correlation coefficient, r = 0.93l). (2) In four slices, we confirmed that similar synaptic depression was observed in the presence of 20 μmbicuculline (see Fig. 2C). (3) Previous study of monosynaptic IPSCs in neocortex (Deisz and Prince, 1989) and our own preliminary observations (Song et al., 1997) indicate that during repeated stimulation IPSCs also depress, rather than potentiate. (4) Nearly identical depression was observed in recordings of field potentials and of EPSCs. For the intracellular recordings, we used much lower amplitude stimuli and confirmed that no IPSCs were present.
Fig. 2.
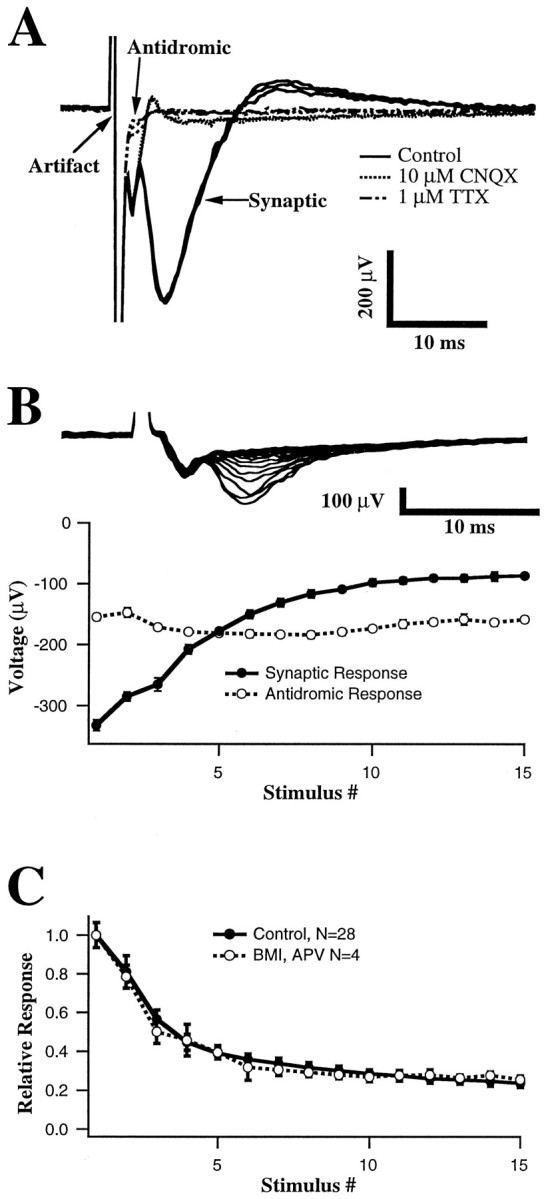
Characterization of field potential components.A, Responses to single stimuli recorded under control conditions, after application of 10 μm CNQX, and after application of 1 μm TTX. Three traces for each condition are shown. A presumed antidromic response (initial negative deflection after the stimulus artifact) is blocked by application of TTX but persists during application of CNQX. The synaptic response is abolished by either CNQX or TTX. B, Amplitudes of antidromic and synaptic response components during a 20 Hz constant frequency train. Error bars are SDs over five repetitions.Top traces are superimposed average responses to each stimulus in the train. Depression is apparent in the synaptic but not in the antidromic response. C, Depression of isolated AMPA responses during 20 Hz stimulation. GABAA- and NMDA-dependent responses were blocked by application of BMI (20 μm) and MK-801 (2 μm). Plottedpoints are the mean responses (error bars indicate SD over 5 repetitions) normalized to the initial response in each experiment and averaged across separate experiments (n = 4, AMPA only; n = 28, control).
Initial attempts to extract the underlying dynamics of these responses were based on the synaptic decoding method of Sen et al. (1996). This technique is quite generic and makes few assumptions about the temporal profile of short-term changes in synaptic strength. Because our goal was to predict synaptic responses accurately with as concise a description as possible, we subsequently adopted a simpler, but somewhat less generic, model in which changes in response amplitude (A) were assumed to result from the product of an initial amplitude (A0) and dynamic variables representing facilitation and depression. The choice of this type of model was guided by our observation that kernels obtained using the synaptic decoding method were usually well fit by exponentials. A similar class of models has been used previously to describe short-term plasticity at the neuromuscular junction (Liley and North, 1952;Magleby and Zengel, 1976).
Response amplitudes were fit with several related models that differed in the number of facilitation (zero or one) and depression (one to three) factors. The most complex form of the model contained a single facilitation factor (F) and three depression factors (D1, D2, and D3):
| Equation 1 |
For other less complete variants, one or more of the facilitation and depression factors were omitted (i.e., were constrained to be 1):
| Equation 2 |
| Equation 3 |
| Equation 4 |
| Equation 5 |
| Equation 6 |
Dynamic variables representing depression (D) were constrained to be ≤ 1 and depended on the stimulus pattern in the following way: after each stimulus in the train, Dwas multiplied by a constant factor (d) representing the amount of depression per presynaptic action potential:
| Equation 7 |
Between stimuli, D recovered exponentially back toward 1 with first-order kinetics and time constant τD:
| Equation 8 |
Accumulation of depression results when the interval between presynaptic action potentials is less than that required for recovery. The different components of depression (D1, D2, and D3) had different constant factors (d1, d2, and d3) and time constants (τd1, τd2, and τd3).
The dynamic variable F representing facilitation was constrained to be ≥ 1. After each stimulus, a constant,f (≥ 0), representing the amount of facilitation per presynaptic action potential was added to F, and between stimuli, F recovered exponentially back toward 1:
| Equation 9 |
| Equation 10 |
A model of facilitation in which F was updated additively, rather than multiplicatively, was found to provide a superior fit to the data, especially at high stimulus frequencies where multiplicative facilitation can lead to amplitudes that increase without bound.
All of the data were fit with the two-component depression model defined by Equation 4 and the complete form of the model defined by Equation 1. Most of the data were also fit with the model variant containing two depression components and one facilitation component (Eq. 5). This three-component model, which included facilitation, was used for all of the fits illustrated (see Figs. 3, 4, 8, 10, 11, 12, 13), because it was the simplest form of the model that adequately described data obtained under conditions of high and low probability of release (see Fig. 7). For comparing data across different recordings obtained under control conditions (see Fig. 9), the two-component model was used (Eq. 4), because it adequately described that data and had fewer parameters.
Fig. 3.

Measured and predicted short-term plasticity of EPSCs. A, Average amplitudes (lines; n = 10 repetitions) of EPSCs recorded in a layer 2/3 pyramidal neuron in response to low-amplitude stimulation of layer 4. Stimulus train was Poisson-distributed with a mean rate of 4 Hz. Dots are the best fit of a three-component model. B, The fraction of each measured response amplitude by which the model prediction differed from the data. C, D, Measured (lines) and predicted (dots) responses to constant frequency trains at 5 Hz (C) and 10 Hz (D). These predictions were generated from the fit of the model to the response to the Poisson-distributed train inA. E, Parameters of the best fit of the model. Each stimulus caused facilitation (F), a stronger but more rapidly recovering form of depression (D1), and a weaker but more persistent form of depression (D2). Curvesillustrate the amplitude and time course of facilitation and both forms of depression that would follow an isolated stimulus. The intercepts of each curve with the y-axis indicate the initial magnitude of the facilitation and depression (see Eqs. 7-10). Between stimuli, facilitation and depression factors decayed toward 1 with first-order kinetics (time constants indicated).
Fig. 4.

Measured and predicted short-term plasticity of field potentials. Conventions are described in Figure 3.A, Average amplitudes (lines;n = 5 repetitions) of field potentials recorded in layer 2/3 in response to Poisson-distributed stimulus train (mean, 4 Hz) of layer 4 and the best fit of three-component model (dots). B, The fraction of each measured response amplitude by which the fit of the model differs from the data. The average error of 0.7 ± 1.0% was not significantly different from zero. The fit accounts for >97% of the variation in the amplitude of the data. C, D, Measured (lines) and predicted (dots) responses to constant frequency trains at 5 Hz (C) and 10 Hz (D). E, Parameters of the best fit of the model.
Fig. 8.
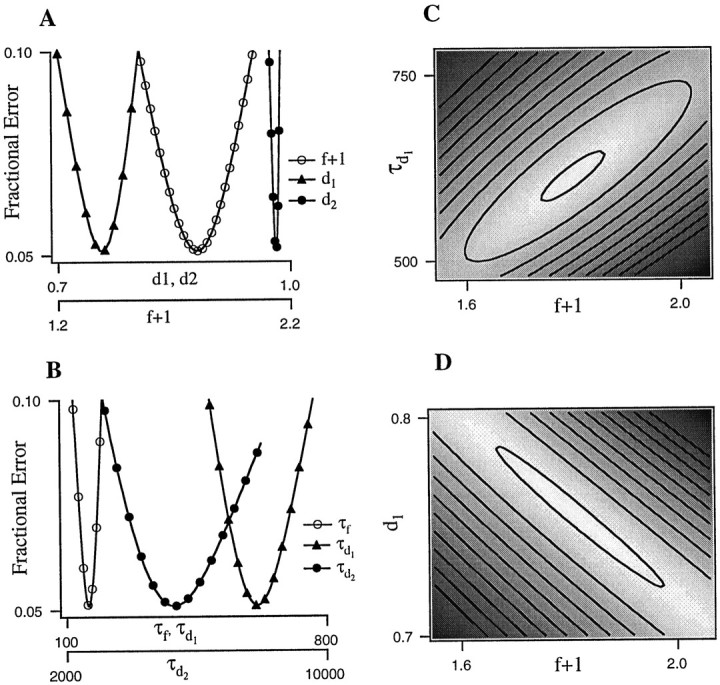
Sensitivity of fit errors to variation in parameters. Field potential responses recorded during a Poisson-distributed train (mean rate, 4 Hz) were fit with a three-component model. A, B, Individual parameters were varied about the best fit values one at a time and plotted against the resulting rms error. For each parameter, the range of values shown is that producing rms errors of up to 10%. A greater range was tested. C, D, Pairs of parameters were varied simultaneously over ranges of values that produced increases in the rms error of ≤10% above optimal (i.e., from 5.2 to 15.2%). The resulting error surface is shaded such that white indicates the region of lowest error,black indicates regions of highest error, andgrays indicate regions of intermediate error. Adjacent regions represent rms error increases of 1%.
Fig. 10.

Partial postsynaptic blockade with CNQX does not alter short-term plasticity. Conventions are described in Figure 3. Measured field potential responses (lines) and best fit of the model (dots) are given before (A) and after (B) application of 0.5 μm CNQX. Inset, Average responses to the first stimulus in the train under both conditions. Note that responses in A and B show similar overall depression and seem to be essentially scaled versions of one another. C, Parameters of the fit are extremely similar. Control and CNQX time constants are 113 and 114 msec forF, 640 and 631 msec forD1, and 5723 and 5723 msec forD2, respectively.
Fig. 11.

Blockade of AMPA receptor desensitization with cyclothiazide does not alter short-term plasticity. Conventions are described in Figure 3. Measured field potential responses (lines) and best fit of the model (dots) are given before (A) and after (B) application of cyclothiazide.Inset, Average responses to the first stimulus in the train under both conditions. Note that although cyclothiazide clearly prolonged the duration and slightly increased the amplitude of individual responses (inset), there was little effect on the buildup of depression. C, Parameters of the fit are extremely similar. Control and cyclothiazide time constants are 242 and 252 msec for F, 508 and 648 msec forD1, and 7523 and 9208 msec forD2, respectively.
Fig. 12.

Low calcium dramatically reduces synaptic depression. Conventions are described in Figure 3. Measured field potential responses (lines) and best fit of the model (dots) are given before (A) and after (B) exchange of normal extracellular solution for a solution containing 0.5 mmCa2+ and 3.5 mm Mg2+.Inset, Average responses to the first stimulus in the train under both conditions. Note that responses in B do not show the overall depression apparent in A and that the rapid depression apparent during high-frequency portions ofA (arrow) are replaced by net facilitation inB. C, Parameters of the fit. Facilitation (left) is mildly reduced (initial amplitude, 1 +f, changed from 3.03 to 2.45) but increased in duration (time constants changed from 93 to 124 msec). In contrast, the amplitude of both depression components (middle andright) are substantially reduced (i.e., are closer to 1;D1, 0.368–0.955;D2, 0.983–0.991). Time constants changed from 438 to 569 msec (D1) and from 7523 to 4283 msec (D2).
Fig. 13.

Adenosine reduces synaptic depression. Conventions are described in Figure 3. Measured field potential responses (lines) and best fit of the model (dots) are given before (A) and after (B) bath application of 10 μmadenosine. Inset, Average responses to the first stimulus in the train under both conditions. Note that responses inB show much less overall depression than is apparent inA and that high-frequency portions of Aare associated with rapid depression, whereas the same portions inB show constant amplitude or mild facilitation.C, Parameters of the fit. Facilitation (left) was moderately reduced (amplitude changed from 2.63 to 1.65; time constants changed from 106 to 168 msec). The more rapid component of the depression (D1; middle) was also moderately reduced (amplitude changed from 0.526 to 0.763; time constants changed from 446 to 566 msec). The longer-lasting component of the depression (D2;right) was abolished (initial amplitude was 0.98, and time constant was 5723 msec; during adenosine application, amplitude was 1.0).
Fig. 7.
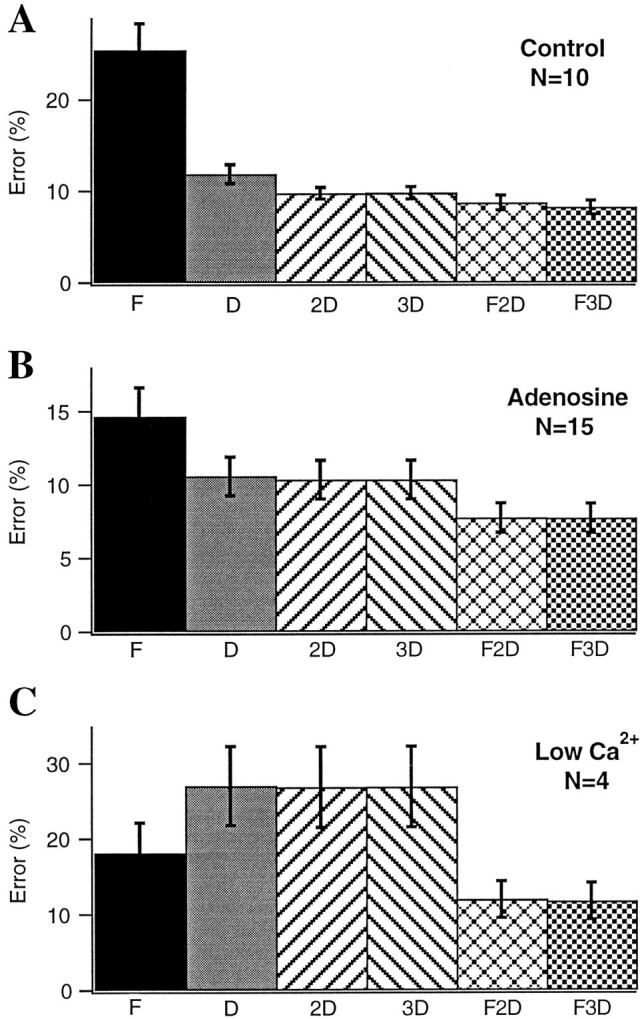
Comparison of one-, two-, three-, and four-component models. fEPSP responses to 4 Hz Poisson-distributed trains recorded under control conditions (A), during application of 5–20 μm adenosine (B), and during perfusion with reduced extracellular calcium (C) were fit with six different related models of short-term plasticity (see Eqs. 1-6). Each model had one to four components, consisting of zero or one facilitation factor (indicated by F underbar) and zero to three depression factors (indicated byD under bar). Facilitation and depression factors were those in Eqs. 1-6. Error bars indicate the SEM of the fit error associated with each model.
Fig. 9.

Distribution of fit parameters. Data recorded intracellularly (open circles) and extracellularly (filled circles) were fit with a two-component model (see Eq. 4). Fit parameters are shown as a function of animal age. Recovery time constants tended to be longer in data from younger animals.
Fits were evaluated first by measuring the fractional error [(observed − predicted)/observed] for each response in a train and then by calculating its average (referred to as average error) and its root mean square (referred to as rms error). The average error is a measure of the degree to which the predictions systematically underestimate or overestimate the data, whereas the rms error is a measure of the closeness of fit. The set of model parameters yielding the lowest rms error was found by an automated search algorithm. We also calculated an error index, defined as the ratio of the rms error obtained with the best fit of the model to the rms error obtained when no depression or facilitation factors were included (i.e., whenA = A0).
Typically we fit a set of responses obtained during stimulation with a Poisson-distributed train or with a Poisson-distributed train followed by a period of constant frequency stimulation, and then used the model parameters to predict responses to other random and constant frequency trains. To avoid overlap of individual responses within a train, we clipped the minimum interval at 30 msec. In some experiments, we used smaller minimum intervals. Individual trains were separated by 45–60 sec. We ensured that this was an adequate period of recovery by confirming that the initial amplitudes did not vary systematically on subsequent repetitions (see Fig.1A,C, top).
Fig. 1.

Synaptic depression recorded in layer 2/3 during random stimulation of layer 4. A,B, EPSCs recorded during whole-cell voltage clamp of a visually identified pyramidal neuron. Stimulus was a Poisson-distributed train (duration, 20 sec; mean rate, 4 Hz).A, Superimposed individual responses to the first stimulus in the train (top; n = 8 repetitions) and superimposed responses to each stimulus in the train averaged over the eight repetitions (bottom).B, Averaged responses to the entire train.C, D, Field potentials recorded in layer 2/3 in response to the same stimulus pattern during a separate experiment. C, Superimposed individual responses to the first stimulus in each of five repetitions (top) and superimposed averaged responses to each stimulus in the train (bottom). D, Averaged responses to the entire train.
RESULTS
Synaptic responses in layer 2/3 exhibit prominent synaptic depression
Figure 1 illustrates synaptic responses evoked in layer 2/3 by Poisson-distributed stimulus trains applied to layer 4 immediately below the recording site. Both monosynaptic EPSCs (Fig.1A,B;n = 11 cells), recorded intracellularly, and field potentials (Fig. 1C,D; n = 38 slices), recorded extracellularly, strongly depressed during the course of each stimulus train and recovered during the 45–60 sec period between repetitions of the stimulus train. The amplitude of individual responses within the train typically varied over a twofold to eightfold range (Fig. 1A,C,bottom). Most of this variance was not caused by random fluctuations, particularly for the field potentials, because the trial-to-trial variance of the responses (Fig.1A,C, top; SEM/mean, 8.1% for EPSCs and 4.0% for field potentials) was small compared with the variance of the responses across stimuli within the train. In general, the trial-to-trial variance of the EPSCs evoked by near-minimal stimulation was much greater than the trial-to-trial variance of the field potentials, which were evoked using larger amplitude stimuli. Presumably, EPSCs are more variable because the small number of synapses contributing to the responses are not sufficient to average out random fluctuations in transmitter release. In contrast, field potentials presumably reflect simultaneous activation of large numbers of synapses and hence allow an accurate determination of the mean response to a particular stimulus pattern using a much smaller number of trials.
Although it is widely assumed that field potentials in hippocampus and neocortex reflect primarily activation of excitatory synapses (Mitzdorf and Singer, 1978; Bode-Greuel et al., 1987; Langdon and Sur, 1990;Kirkwood and Bear, 1994), we wished to confirm this fact in our preparation. Two components of the response were distinguished on the basis of latency and ability to follow high-frequency stimulation: (1) a very short latency (0.5–1.5 msec onset; 1–2 msec peak) response that persisted during high-frequency stimulation, and (2) a slightly longer latency response (2–4 msec onset; 4–7 msec peak) that depressed rapidly during high-frequency stimulation. Additional, longer latency negative components were sometimes present but were not studied in detail. Based on these observations and on the effects of pharmacological manipulations described below and in keeping with previous observations in visual cortex (Kirkwood and Bear, 1994) and other cortical areas (Hess et al., 1996), we identified these components as (1) a nonsynaptic fiber volley and antidromic response (referred to as the antidromic response) and (2) a field EPSP (fEPSP). Application of the AMPA glutamate receptor antagonist 6-cyano-7-nitroquinoxaline-2,3-dione (CNQX; 10–20 μm) completely blocked the synaptic component of the response (Fig.2A; n = 6) but spared the antidromic response. Monosynaptic IPSPs and NMDA receptors did not contribute to the potential that remained after application of CNQX, because subsequent addition of bicuculline methiodide (BMI; 20 μm) and aminophosphonovalerate (APV; 50 μm) had no effect (data not shown). Addition of tetrodotoxin (TTX; 1 μm) (Fig. 2A) abolished both the synaptic and antidromic responses. We often observed an upward deflection after the initial negative-going synaptic response. We suspect that this reflects activation of polysynaptic inhibitory pathways because (1) it corresponds temporally to disynaptic inhibitory currents recorded intracellularly; (2) during application of BMI it was reduced or abolished and was replaced by additional negative components that corresponded temporally with polysynaptic excitatory potentials recorded intracellularly; and (3) it tended to fatigue even more rapidly than the short latency response.
During repetitive stimulation, the antidromic response, unlike the synaptic response, did not decline in amplitude. In some cases, like that shown in Figure 2B, there was a small increase in amplitude after the first or second stimulus that then decayed back to the initial levels. In the majority of cases, the amplitude of the antidromic response did not change. This indicates that the depression of the synaptic response is not simply an artifact of decreasing effectiveness of extracellular stimuli in a train.
To avoid large polysynaptic potentials and epileptiform discharges that often occurred after stimulation in the presence of bicuculline, we did not block inhibition in most experiments. During whole-cell recordings, EPSCs were isolated by keeping stimulus strengths below the threshold for evoking an IPSC. In four field potential experiments, we were able to record a stable pharmacologically isolated AMPA receptor component of the fEPSP in the presence of 20 μm BMI to block inhibition and 2 μm MK-801 to block NMDA receptors without evoking epileptiform activity. Synaptic depression observed during blockade of GABAA receptors and NMDA receptors was extremely similar to that observed under control conditions (Fig.2C).
Responses to random stimulus trains can be fit accurately by a simple model of short-term facilitation and depression
Figure 3 illustrates the best fit of the three-component model (one facilitation component and two depression components, see Eq. 5) to EPSCs recorded from a layer 2/3 pyramidal neuron in response to 10 repetitions of a Poisson-distributed train. The model accurately captures the overall time course of depression but is less precise in predicting the response to individual stimuli. Averaged across the responses within the train, the difference between measured and predicted amplitudes was not significantly different from zero (average error, 2.5 ± 15.9%), although predictions of responses to individual stimuli varied appreciably in how well they matched the data (rms error, 16.0%). The error index was 8.6%, indicating that the prediction accounted for >91% of the variation in amplitude across stimuli within the train. The same parameters used to fit the response to the Poisson train were then used to predict responses to constant frequency trains at 5 and 10 Hz (Fig.3C,D). The predicted responses to constant frequency trains agreed well with the measured responses (rms errors of 10.1 and 16.7%, respectively), although, as in the initial fit, responses to individual stimuli deviated in an apparently random way from predicted values. Similar fit parameters were obtained for EPSCs recorded from 8 of 11 cells. In two of the remaining cells, the data were better fit by a single exponentially decaying depression (i.e.,F and D2 both equaled 1), and in the third remaining cell, the data were best fit by a combination of facilitation and a single depression factor (i.e.,D2 was 1).
Much more accurate (i.e., lower rms error) fits were obtained from the field potential data. Presumably the increased accuracy reflects the lower trial-to-trial variability of the field potentials that allow more accurate estimates of the mean response to each stimulus in a train, despite a small number of repetitions (4–5; see Fig. 5 and below). An example of a fit to field potential recordings is shown in Figure 4. Fine details of the fluctuations in response amplitude are accurately captured by the fit. The rms error for this fit was 8.3%, and the error index was only 2.4%, indicating that the prediction accounted for >97% of the variation in amplitude across stimuli within the train. The parameters of the fit (Fig. 4E) were quite similar to those obtained from fits to EPSCs. The same parameters extracted from the fit to the 4 Hz Poisson train (Fig. 4A) accurately predicted responses to constant frequency trains (Fig.4C,D). For these trains, the rms errors were 2.5 and 8.5%, and the error indices were 1.3 and 1.9%. The same parameters also accurately predicted responses to different random trains. The rms errors for additional random trains with mean rates of 1 and 2 Hz were 11.8 and 10.9%, respectively.
Fig. 5.

Accuracy of fits and predictions depend on response variability. Responses were fit with the four-component model (see Fig. 7). For each cell and recording site, the model was fit to data from a subset of stimulus trains tested and then used to predict responses to other trains. A, The rms errors of model fits and predictions plotted against the SEM of the data (also expressed as a percent of the mean) over the 5–10 repetitions recorded. Filled circles are field potentials (n = 140 response trains from 39 slices).Open circles are EPSCs (n = 42 response trains from 11 cells). The line is the best linear fit (slope = 0.85; intercept = 4.7%;r = 0.90). Note that EPSCs had higher fit errors but also had correspondingly higher SEMs. Inset, Histogram of differences between the normalized fit errors and SEMs.B, Comparisons of rms errors for field potential responses to different types of stimulus trains. Black bars are Poisson-distributed trains, and gray bars are constant frequency trains. For each data set, model parameters were obtained from fits to responses during 4 Hz Poisson-distributed trains or from jointly fitting these responses and those obtained during stimulation with a 20 Hz constant frequency train. Responses to other trains were then predicted using the same fit parameters. The errors for the fits (4 Hz Poisson-distributed and 20 Hz constant frequency) and predictions (2 Hz Poisson-distributed and 1–10 Hz constant frequency) are quite similar.
To determine whether the fit errors were determined primarily by limitations of the model or by the intrinsic variability of the data, we plotted the precision of the fits against the variability of the data. Figure 5A illustrates the fact that the error of the fits increased with increasing trial-to-trial variability. Each point plots the rms error for a stimulus train against the SEM that, like the rms error, has been expressed as a fraction of the response amplitude and averaged across responses within a train. All data from 2 and 4 Hz Poisson-distributed trains and 1, 5, 10, and 20 Hz constant frequency trains are included. Three to five stimulus trains are shown for each cell and extracellular recording site. In each case, one or two trains were used to generate the fit, and two to four were predicted using the same parameters. The values shown are from fits of the full four-component model (one facilitation and three depression components, Eq. 1), but fits of the three-component model to a subset of the data were quite similar (see Fig. 7). The high degree of correlation between the rms error of the fit and the SEM of the data (r = 0.90) suggest that trial-to-trial variability was an important factor limiting the accuracy of predictions of individual responses within a train. The intercept represents the accuracy of our fits in the limit of zero trial-to-trial variability. An alternative measure of fit accuracy is the residual error remaining after the error attributable to variability is subtracted from the rms error (Fig. 5A,inset). The two measures of fit accuracy independent of intrinsic variability yielded similar values (intercept = 4.7%; residual error mean ± SD, 1.8 ± 5%; median = 3.2%). As seen in the case of the individual set of responses shown in Figure4, errors for response predictions were typically no worse than the errors of the initial fits (Fig. 5B).
Comparison of related models
In most cases, the data were fit better by a model with two depression factors than by a model with only a single depression factor. To test more directly the need for two components of depression with differing time courses, we measured the recovery from depression after a train of 15 stimuli at 20 Hz. As shown in Figure6, the amplitude of field potential responses to a single test pulse given at various times after the end of the train recovered with a time course that was much better fit by the product of two exponentials than by a single exponential. This was true in each of the five experiments in which the recovery time course was measured.
Fig. 6.

Recovery from depression after a constant frequency train has two time constants. Field potential responses to single test stimuli are given after a 15-sec-long 20 Hz train. Recovery intervals ranged from 10 msec to 10 sec. Response amplitudes are normalized to the initial responses. Error bars indicate SDs over five repetitions. Data from three different slices are shown (A–C). In each case data were well fit by the product of two exponentials (solid curves) but were not as well fit by a single exponential (dotted curves).
To compare more comprehensively the need for each of the components of the model, we fit a subset of the data with six different related models (Eqs. 1-6). For the sake of comparison, the rms error obtained when assuming no short-term plasticity (A =A0; see error index in Materials and Methods) was 157 ± 28.1%. Under control conditions, the dominant form of short-term plasticity is depression, hence the data were poorly fit by a single facilitation factor but were better fit by a single depression factor. In keeping with the results of the recovery experiments, including a second depression factor produced a substantial improvement in the fit (from rms error of 11.9 ± 1.0% with a single depression factor to 9.8 ± 0.6% with two depression factors). We also assessed the benefit of adding a third depression component having a faster time course (10–100 msec) (Thomson et al., 1993; Stevens and Wang, 1995). Adding this third, very rapidly recovering depression factor produced little improvement for models that lacked facilitation but led to small additional improvements in models that included a facilitation term. It should be noted that the data used for Figure7A may underestimate the magnitude of this faster form of depression because the data were collected using stimulus trains in which the range of frequencies was not truly Poisson but was clipped at 30 Hz. When shorter intervals were included in the stimulus trains (clipping at 60 Hz, n = 4; clipping at 100 Hz, n = 3; no clipping frequency,n = 3), the data were better fit with a model that included this rapid depression component (rms error of 15.3 ± 1.2% for three depression factors vs 16.9 ± 1.9% for two depression factors).
Mixtures of facilitation and depression typically produced the best fits. The improvement over models containing only depression was modest under control conditions (e.g., rms error of 8.7 ± 0.8% for two depression factors and one facilitation factor vs 9.8 ± 0.6% for the two depression factors with no facilitation; Fig. 7A) but became more significant under conditions of reduced transmitter release (Fig. 7B,C). This reflected the reduced depression and enhanced facilitation that was apparent under conditions of reduced release (see below and Figs. 12, 13, 14).
Fig. 14.

Effects of pharmacological manipulations on responses to 20 Hz trains. A–F, Responses were recorded before (solid lines, filled circles) and after (dashed lines, open circles) manipulations. Response amplitudes are normalized to the initial response in each train to allow comparison of effects on short-term plasticity independently of effects on response amplitude. Error bars indicate SD across repetitions within an experiment, averaged across the number of experiments shown. Note that reducing postsynaptic responses with 0.25 μm CNQX (A) or reducing AMPA receptor desensitization with 60 μm CTZ (B) did not alter depression during 20 Hz stimulation. In contrast, manipulations known to alter transmitter release (C–F) produced dramatic changes in short-term plasticity. G. Effects of manipulations on initial response amplitude. Amplitudes have been normalized to initial control response amplitudes (first bar).
To determine whether or not there was a unique best fit of the model, we varied fit parameters over a wide range and measured the resulting error. For these studies, we used the three-component variant of the model containing a single facilitation component and two depression components (Eq. 5). Varying each parameter individually (Fig.8A,B) produced smoothly changing error functions that had clear minima and were approximately parabolic in shape. The error was more sensitive to variations in some parameters (e.g., d2; Fig. 8A, filled circles) than in others (e.g., τd2; Fig. 8B,filled circles). Varying pairs of parameters simultaneously (Fig. 8C,D) produced error surfaces that were also smoothly varying and that each had a single discrete region of minimum error. The region of minimum error for a given pair of parameters (e.g., f and τd1; Fig. 8C) was typically elongated along a diagonal. For most pairs of parameters examined, the degree of elongation was similar to that shown in Figure 8C. When the degree of facilitation and the faster depression were varied simultaneously (Fig. 8D), the degree of elongation was substantially greater than with any other pair of parameters. Along this diagonal, increases in facilitation could be matched by decreases in depression (or vice versa) without significantly affecting the quality of the fit. This ambiguity is present in all model variants that contain opposing facilitation and depression acting over approximately similar time scales. We performed the same analysis on fits to data from four other slices and obtained very similar error surfaces.
To compare the amount of depression and its rate of recovery across experiments, it was important to minimize the degeneracy of the fits. Data were fit with a variant of the model that included the two depression components described above but in which facilitation was omitted (Eq. 4). This represented a compromise between using a single-component model that in some cases produced rather poor fits but had the fewest free parameters and using the full four-component model that produced better fits but had nine free parameters (A0 plus the amplitudes and time constants of each component). The parameters of the best fits of this model to all of the data recorded under control conditions are plotted as a function of age of the animal in Figure 9. Both forms of depression were evident over the entire range of ages studied and were similar in intracellular and extracellular recordings. There was a tendency for the recovery time constants, especially for the slower of the two forms of depression, to be shorter in the older animals.
Manipulations that alter postsynaptic responsiveness do not alter short-term plasticity
In principle, the prominent short-term synaptic depression we observed could arise as a result of a change in the amount of neurotransmitter released from presynaptic axons (Betz, 1970;Kusano and Landau, 1975; Larkman et al., 1991; Thomson et al., 1993;Stevens and Wang, 1995; Debanne et al., 1996), a change in the sensitivity of postsynaptic cells to that neurotransmitter (Hestrin, 1992; Trussell et al., 1993), or a change in other conductances, such as voltage-dependent conductances (Sutor and Hablitz, 1989; Deisz et al., 1991; Hirsch and Gilbert, 1991; Thomson et al., 1993) activated as a result of the depolarization caused by synaptic current. In an attempt to distinguish between these possibilities, we applied a number of pharmacological manipulations known to affect presynaptic release and postsynaptic responsiveness. We reasoned that if the relevant change were occurring in voltage-dependent conductances activated by postsynaptic depolarization, short-term plasticity should be altered by manipulations that decrease the postsynaptic response.
We compared the best fit of the model for data obtained under control conditions with that obtained at the same recording site after application of a low concentration (0.25 μm) of the AMPA-type glutamate receptor antagonist CNQX. As shown in Figure10, CNQX dramatically decreased the overall amplitude of the responses but had little effect on the observed short-term plasticity. This suggests that changes in conductances that depend strongly on postsynaptic voltage are unlikely to make a major contribution to the observed short-term plasticity. Similar results were obtained in four other experiments. These results were also consistent with the observation that the magnitude and time course of depression were similar during whole-cell voltage-clamp experiments when cells were kept hyperpolarized and much smaller synaptic currents were evoked.
A second possible postsynaptic mechanism that might contribute to short-term synaptic depression is desensitization of AMPA receptors, which occurs at a variety of central synapses including those in rat visual cortex (Hestrin, 1992). To investigate this possibility, we applied cyclothiazide (CTZ), a drug that reduces AMPA receptor desensitization (Trussell et al., 1993), and measured its effect on short-term synaptic plasticity. CTZ (60 μm;n = 5 experiments) markedly increased the duration and slightly increased the amplitude of individual field potential responses (Fig. 11, inset) but had no effect on short-term plasticity (Fig.11A–C).
Manipulations that alter transmitter release alter short-term plasticity
At neuromuscular junctions (del Castillo and Katz, 1954;Betz, 1970), the squid giant synapse (Kusano and Landau, 1975;Swandulla et al., 1991), and synapses in spinal cord (Pinco and Lev-Tov, 1993), hippocampus (Debanne et al., 1996), and neocortex (Thomson et al., 1993; Markram and Tsodyks, 1996), presynaptic changes in quantal content or probability of release have been shown to influence profoundly short-term facilitation and depression. To determine whether the forms of short-term plasticity studied here also depended on presynaptic release, we applied manipulations that have been shown previously to affect release. Presynaptic release was decreased by lowering external calcium from 2.0 to 0.5 mm(with a compensatory increase in external Mg2+ ion concentration; n = 4; Fig.12) and by applying neuromodulatory substances such as adenosine (Prince and Stevens, 1992) (n = 10; Fig. 13) or baclofen (Thompson et al., 1993) (n = 7; Fig.14) that have been shown previously to decrease release. Although adenosine and baclofen can also have postsynaptic effects, we have observed previously (Varela et al., 1995; J. A. Varela and S. B. Nelson, unpublished observations) that at visual cortical synapses the presynaptic effects are far more pronounced and occur at lower concentrations. As shown in Figures 12and 13, reducing release dramatically altered short-term plasticity. Responses recorded during application of lowered calcium were smaller and, in addition, showed much less overall depression. During high-frequency bursts within the random stimulus train, net depression was converted to net facilitation (Fig. 12, arrow). Responses recorded during application of adenosine or baclofen, in the presence of normal extracellular calcium, showed a similar reduction in the degree of depression and enhancement of net facilitation (Fig.13).
In a smaller number of experiments, we increased release by elevating external calcium (n = 4) or by applying the potassium channel blocker 4-aminopyridine (4-AP; n = 4). 4-AP enhances neurotransmitter release at many types of synapses, presumably by causing action potential broadening and hence increased calcium entry (Rutecki et al., 1987). These manipulations produced modest increases in the amplitude of responses to individual stimuli and enhanced depression.
The effects of the various pharmacological manipulations on short-term plasticity are summarized in Figure 14, which shows responses to 20 Hz trains that have been normalized to the initial amplitude and averaged across experiments. Reducing postsynaptic responsiveness with CNQX (Fig. 14A) or blocking postsynaptic receptor desensitization with CTZ (Fig. 14B) did not alter the accumulation of depression that occurred during the train. Manipulations that increase presynaptic transmitter release (Fig.14C,D) increased the rate and relative magnitude of the depression. Conversely, manipulations that decrease transmitter release (Fig. 14E,F) greatly decreased the depression and revealed facilitation during the early portion of the train. Similar results were obtained during application of adenosine (n = 9; data not shown).
To compare fit parameters across cells while minimizing the impact of the ambiguity caused by simultaneous facilitation and depression (see Fig. 8), we fit each set of responses with a model consisting of two components of depression without accompanying facilitation. Data from the various manipulations were pooled into three groups: manipulations of postsynaptic responsiveness (CNQX and CTZ), manipulations that increase presynaptic release (elevated external calcium and 4-AP), and manipulations that decrease presynaptic release (reduced external calcium, adenosine, and baclofen). For each group, we assessed the effect of the manipulations by comparing mean fit parameters obtained from data collected during drug application with those obtained before drug application. The more rapid form of depression (d1) was significantly weaker (i.e., closer to 1) during manipulations that decreased release probability (from 0.88 ± 0.017 to 0.97 ± 0.010;p = 5.7 × 10⁻⁵, pairedt test) and significantly stronger (i.e., farther from 1) during manipulations that increased release (from 0.86 ± 0.044 to 0.66 ± 0.084; p = 0.004). The value ofd1 was not significantly altered by manipulations of postsynaptic responsiveness (from 0.87 ± 0.013 to 0.88 ± 0.022; p = 0.64). The amplitude of the slower form of depression (d2) was also significantly decreased during decreased release (p = 0.016) but was not significantly increased during increased release (p = 0.74) or altered postsynaptic responsiveness (p = 0.89). The recovery time constants were not significantly altered during any of the treatments.
DISCUSSION
The present results show that synaptic responses in layer 2/3 evoked by temporally patterned stimulation of layer 4 exhibit a mixture of facilitation and depression with depression predominating under normal conditions. More importantly, they show that most of the apparently complex dynamics of these responses can be well described by a simple three-component model in which facilitation and two forms of depression are updated with each presynaptic stimulus and recover exponentially between stimuli. Describing synaptic dynamics in this way may provide some quantitative constraints that will be useful in delineating underlying mechanisms, but this is not the primary advantage of this approach. Its utility (and that of a similar approach developed independently by Tsodyks and Markram, 1997) is that it provides a concise and portable description that is useful for predicting synaptic responses to more complex patterns of stimulation, for computational studies of circuit dynamics, and for comparing dynamic properties across different synaptic pathways within or between preparations.
The present study focused primarily on understanding the average dynamics of populations of simultaneously activated synapses. As such, the information it provides is complimentary to that obtained from studies in which dynamic properties of individual synaptic connections have been examined (Thomson and Deuchars, 1994; Tsodyks and Markram, 1997). The similarity between the dynamic properties measured extracellularly from large populations of synapses and those measured by activating small numbers of inputs to individual neurons both in this study and in paired recordings of Tsodyks and Markram (1997)suggests that short-term plasticity at individual synapses is the dominant factor determining the dynamics of the population response. An important reason for measuring the dynamics of population responses is that it is large populations of synapses, rather than single connections, that are activated during sensory stimuli (although during sensory stimulation synapses may not be activated as synchronously as during extracellular stimulation). Even for individual cortical neurons, it is likely that sensory stimuli that evoke robust responses activate a substantial fraction of the many thousands of synaptic inputs of the cell. Measurements of the average dynamics of those inputs are therefore crucial to understanding how dynamic properties of synapses contribute to the dynamics of sensory responses.
The depression observed in the present study bears a number of similarities to forms of synaptic depression identified at other synapses. At the neuromuscular junction and squid giant synapse, the amplitudes of responses to successive presynaptic stimuli fall exponentially (Liley and North, 1952; Kusano and Landau, 1975). The mechanism underlying synaptic depression is believed to be depletion of a readily releasable pool of vesicles. The results of the pharmacological manipulations performed here are also consistent with a presynaptic mechanism for depression at cortical synapses. Decreasing the amount of release by lowering external calcium or by applying baclofen or adenosine reduced depression. Conversely, increasing release by increasing extracellular calcium or by applying 4-AP, a potassium channel blocker that augments calcium influx by decreasing action potential repolarization at synaptic terminals, increased depression. We cannot rule out the possibility that some of the manipulations presumed to alter presynaptic release may have also had postsynaptic effects. However, we also observed that reducing postsynaptic responsiveness with CNQX had no effect on the observed depression. In addition, depression was similar during field potential recordings of large synaptic responses and whole-cell voltage-clamp recordings of small synaptic responses. These data suggest that it is not the degree of postsynaptic depolarization that is correlated with the magnitude of depression but rather the amount of presynaptic release. An additional candidate postsynaptic mechanism, AMPA receptor desensitization, also seemed not to contribute significantly to depression over the range of intervals tested (>30 msec), because CTZ, although it had a clear effect on the duration of individual responses, did not alter the kinetics or amplitude of the observed depression. Similar findings have been reported for paired-pulse depression between neurons in hippocampal slice cultures (Debanne et al., 1996).
Another recent quantitative study of depression at neocortical synapses observed a single component of depression comparable to the faster component in this study but did not observe a longer time constant (Tsodyks and Markram, 1997). Several methodological differences could account for this difference. First, it is possible that in the present study, multiple populations of synapses with differing recovery rates are being sampled. Recent studies of cat visual cortex (Stratford et al., 1996) and rodent somatosensory and motor cortex (Thomson and Deuchars, 1994; Castro-Alamancos and Connors, 1996) indicate that different classes of synapses may exhibit different forms of short-term plasticity. Arguing against this interpretation, however, is the fact that the slower form of depression was also observed in EPSCs that, from their amplitudes, were unlikely to represent coactivation of more than a few synapses. As noted above, multiple time constants of recovery are common at single synapses in the case of facilitation and have occasionally been demonstrated in the case of depression (Kusano and Landau, 1975; also see Rosenmund and Stevens, 1996, their Fig. 7). Second, it is possible that the difference is attributable to the different synaptic pathways studied (layer 5 of somatosensory cortex vs layer 2/3 of visual cortex) or to differences in the ages of the animals (postnatal days 13–15 vs postnatal days 14–40). Finally, the longer-lasting component may be more easily recognized when fitting responses to longer duration (20–60 sec) trains. The slower form of depression observed in the present study has an amplitude and time constant similar to that observed for the replenishment of the readily releasable pool of transmitter at synapses between hippocampal neurons grown in culture (Liu and Tsien, 1995; Ryan and Smith, 1995; Rosenmund and Stevens, 1996).
Functional significance
We have suggested previously that depression at cortical synapses is a form of gain control that allows cortical neurons to respond to relative, rather than absolute, changes in firing rate (Abbott et al., 1997; for related ideas, see Grossberg, 1984; Tsodyks and Markram, 1997). Simulations of the responses of depressing synapses to fluctuations in presynaptic firing rate also reveal that such synapses are not performing linear temporal filtering. Instead, postsynaptic responses are enhanced for transients (Abbott et al., 1997; Tsodyks and Markram 1997; i.e., temporal “high-pass” behavior) yet also exhibit temporal “low-pass” behavior in that they respond poorly to high-frequency (>10–20 Hz) sinusoidal fluctuations in presynaptic firing rates (F. Chance, S. B. Nelson, and L. F. Abbott, unpublished observations). To the extent that synapses in the primary visual cortex of higher mammals are similar to those measured in rodent cortex, these properties of synaptic depression may explain some of the temporal nonlinearities noted previously in extracellular responses to visual stimuli. For example, the enhanced response to transients suggests that responses to flashed gratings should be larger than predicted on the basis of temporal frequency tuning for counterphased gratings, as has been observed (Tolhurst et al., 1980).
Perhaps the most dramatic temporal nonlinearity exhibited by cortical neurons is contrast adaptation. Contrast adaptation can occur locally within a portion of the receptive field of a cell (Marlin et al., 1991). It can also decrease the sensitivity of a neuron to particular stimuli without changing the maximal firing rate of the cell (Ohzawa et al., 1982). In single-unit and evoked-potential studies, contrast adaptation recovers with a time constant of 5–10 sec (Ho and Berkley, 1988; Maddess et al., 1988; Giaschi et al., 1993), although a more rapid form of adaptation recovering over the course of hundreds of milliseconds has also been described (Bonds, 1991; Nelson, 1991a). The magnitude and rate of onset of adaptation increase as the temporal frequency of the visual stimulus increases (Maddess et al., 1988;Bonds, 1991; Nelson, 1991a). These properties are consistent with a mechanism that depends on synaptic depression (Nelson, 1991b; Finlayson and Cynader, 1995; Somers et al., 1996; Nelson et al., 1997). Recent pharmacological (McLean and Palmer, 1996) and intracellular studies (Carandini and Ferster, 1997) in vivo support the hypothesis that contrast adaptation is caused by a reduction in excitatory synaptic drive, although the class of synapses affected and the biophysical mechanism involved remain undetermined. Our characterization of visual cortical short-term plasticity and identification of pharmacological means of manipulating that plasticity may permit a more-detailed analysis of its function in shaping the dynamics of cortical responses to visual stimuli.
Footnotes
This work was supported by National Science Foundation Grants 9511094 and 9421388, the Sloan Foundation, National Institutes of Health Grant EY11115, and the W. M. Keck Foundation. We thank Gina Turrigiano for helpful discussions.
Correspondence should be addressed to Dr. Sacha Nelson, Department of Biology MS 008, Brandeis University, Waltham, MA 02254.
Dr. Gibson’s present address: Neuroscience Department, Box 1953, Brown University, Providence, RI 02912.
REFERENCES
- 1.Abbott LF, Sen K, Varela JA, Nelson SB. Synaptic depression and cortical gain control. Science. 1997;275:220–222. doi: 10.1126/science.275.5297.221. [DOI] [PubMed] [Google Scholar]
- 2.Betz WJ. Depression of transmitter release at the neuromuscular junction of the frog. J Physiol (Lond) 1970;206:629–644. doi: 10.1113/jphysiol.1970.sp009034. [DOI] [PMC free article] [PubMed] [Google Scholar]
- 3.Bode-Greuel KM, Singer W, Aldenhoff JB. A current source density analysis of field potentials evoked in slices of visual cortex. Exp Brain Res. 1987;69:213–219. doi: 10.1007/BF00247044. [DOI] [PubMed] [Google Scholar]
- 4.Bonds AB. Temporal dynamics of contrast gain in single cells of the cat striate cortex. Vis Neurosci. 1991;6:239–255. doi: 10.1017/s0952523800006258. [DOI] [PubMed] [Google Scholar]
- 5.Carandini M, Ferster D. Visual adaptation hyperpolarizes cells of the cat striate cortex. Science. 1997;276:949. doi: 10.1126/science.276.5314.949. [DOI] [PubMed] [Google Scholar]
- 6.Castro-Alamancos M, Connors B. Spatiotemporal properties of short-term plasticity in sensorimotor thalamocortical pathways of the rat. J Neurosci. 1996;16:2767–2779. doi: 10.1523/JNEUROSCI.16-08-02767.1996. [DOI] [PMC free article] [PubMed] [Google Scholar]
- 7.DeAngelis GC, Ohzawa I, Freeman RD. Receptive-field dynamics in the central visual pathways. Trends Neurosci. 1995;18:451–458. doi: 10.1016/0166-2236(95)94496-r. [DOI] [PubMed] [Google Scholar]
- 8.Debanne D, Guérineau NC, Gähwiler BH, Thompson SM. Paired-pulse facilitation and depression at unitary synapses in rat hippocampus: quantal fluctuation affects subsequent release. J Physiol (Lond) 1996;491:163–176. doi: 10.1113/jphysiol.1996.sp021204. [DOI] [PMC free article] [PubMed] [Google Scholar]
- 9.Deisz R, Prince D. Frequency-dependent depression of inhibition in guinea-pig neocortex in vitro by GABAb receptor feedback on GABA release. J Physiol (Lond) 1989;412:513. doi: 10.1113/jphysiol.1989.sp017629. [DOI] [PMC free article] [PubMed] [Google Scholar]
- 10.Deisz R, Fortin G, Zieglgänsberger W. Voltage dependence of excitatory postsynaptic potentials of rat neocortical neurons. J Neurophysiol. 1991;65:371–382. doi: 10.1152/jn.1991.65.2.371. [DOI] [PubMed] [Google Scholar]
- 11.del Castillo J, Katz B. Statistical factors involved in neuromuscular facilitation and depression. J Physiol (Lond) 1954;124:574–585. doi: 10.1113/jphysiol.1954.sp005130. [DOI] [PMC free article] [PubMed] [Google Scholar]
- 12.Domenici L, Harding GW, Burkhalter A. Patterns of synaptic activity in forward and feedback pathways within rat visual cortex. J Neurophysiol. 1995;74:2649–2664. doi: 10.1152/jn.1995.74.6.2649. [DOI] [PubMed] [Google Scholar]
- 13.Ferster D. Linearity of synaptic interactions in the assembly of receptive fields in cat visual cortex. Curr Opin Neurobiol. 1994;4:563–568. doi: 10.1016/0959-4388(94)90058-2. [DOI] [PubMed] [Google Scholar]
- 14.Finlayson PG, Cynader MS. Synaptic depression in visual cortex tissue slices: an in vitro model for cortical neuron adaptation. Exp Brain Res. 1995;106:145–155. doi: 10.1007/BF00241364. [DOI] [PubMed] [Google Scholar]
- 15.Fisher SA, Fischer TM, Carew TJ. Multiple overlapping processes underlying short-term synaptic enhancement. Trends Neurosci. 1997;20:170–177. doi: 10.1016/s0166-2236(96)01001-6. [DOI] [PubMed] [Google Scholar]
- 16.Giaschi D, Douglas R, Marlin S, Cynader M. The time course of direction-selective adaptation in simple and complex cells in cat striate cortex. J Neurophysiol. 1993;70:2024–2034. doi: 10.1152/jn.1993.70.5.2024. [DOI] [PubMed] [Google Scholar]
- 17.Grossberg S. Some psychophysiological and pharmacological correlates of a developmental, cognitive, and motivational theory. In: Karrer R, Cohen J, Tueting P, editors. Brain and information: event related potentials. New York Academy of Science; New York: 1984. pp. 58–142. [DOI] [PubMed] [Google Scholar]
- 18.Hawken MJ, Shapley RM, Grosof DH. Temporal-frequency selectivity in monkey visual cortex. Vis Neurosci. 1996;13:477–492. doi: 10.1017/s0952523800008154. [DOI] [PubMed] [Google Scholar]
- 19.Herrington J, Norton KR, Bookman RJ. Pulse control V4.5 IGOR XOPs for patch clamp data acquisition and capacitance measurements. Miami: University of Miami; 1995. [Google Scholar]
- 20.Hess G, Aizenman CD, Donoghue JP. Conditions for the induction of long-term potentiation in layer II/III horizontal connections of the rat motor cortex. J Neurophysiol. 1996;75:1765–1778. doi: 10.1152/jn.1996.75.5.1765. [DOI] [PubMed] [Google Scholar]
- 21.Hestrin S. Activation and desensitization of glutamate-activated channels mediating fast excitatory synaptic currents in the visual cortex. Neuron. 1992;9:991–999. doi: 10.1016/0896-6273(92)90250-h. [DOI] [PubMed] [Google Scholar]
- 22.Hirsch JA, Gilbert CD. Synaptic physiology of horizontal connections in the cat’s visual cortex. J Neurosci. 1991;11:1800–1809. doi: 10.1523/JNEUROSCI.11-06-01800.1991. [DOI] [PMC free article] [PubMed] [Google Scholar]
- 23.Ho WA, Berkley MA. Evoked potential estimates of the time course of adaptation and recovery to counterphase grating. Vision Res. 1988;28:1287–1296. doi: 10.1016/0042-6989(88)90059-4. [DOI] [PubMed] [Google Scholar]
- 24.Jagadeesh B, Wheat HS, Ferster D. Linearity of summation of synaptic potentials underlying direction selectivity in simple cells of the cat visual cortex. Science. 1993;262:1901–1904. doi: 10.1126/science.8266083. [DOI] [PubMed] [Google Scholar]
- 25.Kirkwood A, Bear MF. Hebbian synapses in visual cortex. J Neurosci. 1994;14:1634–1645. doi: 10.1523/JNEUROSCI.14-03-01634.1994. [DOI] [PMC free article] [PubMed] [Google Scholar]
- 26.Kulikowski JJ, Bishop PO, Kato H. Sustained and transient responses by cat striate cells to stationary flashing light and dark bars. Brain Res. 1979;170:362–367. doi: 10.1016/0006-8993(79)90115-x. [DOI] [PubMed] [Google Scholar]
- 27.Kusano K, Landau EM. Depression and recovery of transmission at the squid giant synapse. J Physiol (Lond) 1975;245:13–32. doi: 10.1113/jphysiol.1975.sp010832. [DOI] [PMC free article] [PubMed] [Google Scholar]
- 28.Langdon RB, Sur M. Components of field potentials evoked by white matter stimulation in isolated slices of primary visual cortex: spatial distributions and synaptic order. J Neurophysiol. 1990;64:1484–1501. doi: 10.1152/jn.1990.64.5.1484. [DOI] [PubMed] [Google Scholar]
- 29.Larkman A, Stratford K, Jack J. Quantal analysis of excitatory synaptic action and depression in hippocampal slices. Nature. 1991;350:344–347. doi: 10.1038/350344a0. [DOI] [PubMed] [Google Scholar]
- 30.Liley AW, North KAK. An electrical investigation of effects of repetitive stimulation on mammalian neuromuscular junction. J Neurophysiol. 1952;16:509–527. doi: 10.1152/jn.1953.16.5.509. [DOI] [PubMed] [Google Scholar]
- 31.Lisman JE. Bursts as a unit of neural information: making unreliable synapses reliable. Trends Neurosci. 1997;20:38–43. doi: 10.1016/S0166-2236(96)10070-9. [DOI] [PubMed] [Google Scholar]
- 32.Liu G, Tsien RW. Properties of synaptic transmission at single hippocampal synaptic boutons. Nature. 1995;375:404–408. doi: 10.1038/375404a0. [DOI] [PubMed] [Google Scholar]
- 33.Maddess T, McCourt ME, Blakeslee B, Cunningham RB. Factors governing the adaptation of cells in area-17 of the cat visual cortex. Biol Cybern. 1988;59:229–236. doi: 10.1007/BF00332911. [DOI] [PubMed] [Google Scholar]
- 34.Magleby KL. Short-term changes in synaptic efficacy. In: Edelman G, Gall W, Cowan W, editors. Synaptic function. Wiley; New York: 1987. pp. 21–56. [Google Scholar]
- 35.Magleby KL, Zengel JE. A quantitative description of tetanic and post-tetanic potentiation of transmitter release at the frog neuromuscular junction. J Physiol (Lond) 1976;245:183–208. doi: 10.1113/jphysiol.1975.sp010840. [DOI] [PMC free article] [PubMed] [Google Scholar]
- 36.Markram H, Tsodyks MV. Redistribution of synaptic efficacy between neocortical pyramidal neurones. Nature. 1996;382:807. doi: 10.1038/382807a0. [DOI] [PubMed] [Google Scholar]
- 37.Marlin SG, Douglas RM, Cynader MS. Position-specific adaptation in simple cell receptive fields of the cat striate cortex. J Neurophysiol. 1991;66:1769–1784. doi: 10.1152/jn.1991.66.5.1769. [DOI] [PubMed] [Google Scholar]
- 38.McLean J, Palmer LA. Contrast adaptation and excitatory amino acid receptors in cat striate cortex. Vis Neurosci. 1996;13:1069–1087. doi: 10.1017/s0952523800007720. [DOI] [PubMed] [Google Scholar]
- 39.Metherate R, Ashe JH. Facilitation of an NMDA receptor-mediated EPSP by paired-pulse stimulation in rat neocortex via depression of GABAergic IPSPs. J Physiol (Lond) 1994;481:331–348. doi: 10.1113/jphysiol.1994.sp020443. [DOI] [PMC free article] [PubMed] [Google Scholar]
- 40.Mitzdorf U, Singer W. Prominent excitatory pathways in the cat visual cortex (A17 and A18): a current source density analysis of electrically evoked potentials. Exp Brain Res. 1978;33:371–394. doi: 10.1007/BF00235560. [DOI] [PubMed] [Google Scholar]
- 41.Movshon JA, Lennie P. Pattern-selective adaptation in visual cortical neurones. Nature. 1979;278:850–852. doi: 10.1038/278850a0. [DOI] [PubMed] [Google Scholar]
- 42.Movshon JA, Thompson ID, Tolhurst DJ. Spatial and temporal contrast sensitivity of neurones in areas 17 and 18 of the cat’s visual cortex. J Physiol (Lond) 1978;283:101–120. doi: 10.1113/jphysiol.1978.sp012490. [DOI] [PMC free article] [PubMed] [Google Scholar]
- 43.Nelson SB. Temporal interactions in the cat visual system. I. Orientation-selective suppression in the visual cortex. J Neurosci. 1991a;11:344–356. doi: 10.1523/JNEUROSCI.11-02-00344.1991. [DOI] [PMC free article] [PubMed] [Google Scholar]
- 44.Nelson SB. Temporal interactions in the cat visual system. III. Pharmacological studies of cortical suppression suggest a presynaptic mechanism. J Neurosci. 1991b;11:369–380. doi: 10.1523/JNEUROSCI.11-02-00369.1991. [DOI] [PMC free article] [PubMed] [Google Scholar]
- 45.Nelson SB, Smetters DK. Short-term plasticity of minimal synaptic currents in visual cortical neurons. Soc Neurosci Abstr. 1993;19:629. [Google Scholar]
- 46. Nelson SB, Varela JA, Sen K, Abbott LF. Functional consequences of synaptic depression between cortical neurons. CNS ’96 Bower JM. 1997. Plenum; New York, in press. [Google Scholar]
- 47.Ohzawa I, Sclar G, Freeman RD. Contrast gain control in the cat visual cortex. Nature. 1982;298:266–268. doi: 10.1038/298266a0. [DOI] [PubMed] [Google Scholar]
- 48.Orban GA, Hoffmann KP, Duysens J. Velocity selectivity in the cat visual system. I. Responses of LGN cells to moving bar stimuli: a comparison with cortical areas 17 and 18. J Neurophysiol. 1985;54:1026–1049. doi: 10.1152/jn.1985.54.4.1026. [DOI] [PubMed] [Google Scholar]
- 49.Pinco M, Lev-Tov A. Modulation of monosynaptic excitation in the neonatal rat spinal cord. J Neurophysiol. 1993;70:1151–1158. doi: 10.1152/jn.1993.70.3.1151. [DOI] [PubMed] [Google Scholar]
- 50.Prince DA, Stevens CF. Adenosine decreases neurotransmitter release at central synapses. Proc Natl Acad Sci USA. 1992;89:8586–8590. doi: 10.1073/pnas.89.18.8586. [DOI] [PMC free article] [PubMed] [Google Scholar]
- 51.Regehr WG, Delaney KR, Tank DW. The role of presynaptic calcium in short-term enhancement at the hippocampal mossy fiber synapse. J Neurosci. 1994;14:523–537. doi: 10.1523/JNEUROSCI.14-02-00523.1994. [DOI] [PMC free article] [PubMed] [Google Scholar]
- 52.Reid RC, Soodak RE, Shapley RM. Direction selectivity and spatiotemporal structure of receptive fields of simple cells in cat striate cortex. J Neurophysiol. 1991;66:505–529. doi: 10.1152/jn.1991.66.2.505. [DOI] [PubMed] [Google Scholar]
- 53.Rosenmund C, Stevens CF. Definition of the readily releasable pool of vesicles at hippocampal synapses. Neuron. 1996;16:1197–1207. doi: 10.1016/s0896-6273(00)80146-4. [DOI] [PubMed] [Google Scholar]
- 54.Rutecki PA, Lebeda FJ, Johnston D. 4-Aminopyridine produces epileptiform activity in hippocampus and enhances synaptic excitation and inhibition. J Neurophysiol. 1987;57:1911–1924. doi: 10.1152/jn.1987.57.6.1911. [DOI] [PubMed] [Google Scholar]
- 55.Ryan TA, Smith SJ. Vesicle pool mobilization during action potential firing at hippocampal synapses. Neuron. 1995;14:983–989. doi: 10.1016/0896-6273(95)90336-4. [DOI] [PubMed] [Google Scholar]
- 56.Sen K, Jorge-Rivera JC, Marder E, Abbott LF. Decoding synapses. J Neurosci. 1996;16:6307–6318. doi: 10.1523/JNEUROSCI.16-19-06307.1996. [DOI] [PMC free article] [PubMed] [Google Scholar]
- 57.Shapley R, Lennie P. Spatial frequency analysis in the visual system. Annu Rev Neurosci. 1985;8:547–583. doi: 10.1146/annurev.ne.08.030185.002555. [DOI] [PubMed] [Google Scholar]
- 58.Somers D, Todorov E, Siapas A, Nelson SB. Contrast adaptation effects modeled as thalamocortical and intracortical synaptic transmission changes. Soc Neurosci Abstr. 1996;22:643. [Google Scholar]
- 59. Song S, Varela JA, Abbott LF, Turrigiano G, Nelson SB. The dynamics of synaptic depression at monosynaptic inhibitory inputs to visual cortical pyramidal neurons. CNS ’97 Bower JM. 1997. Plenum; New York, in press. [Google Scholar]
- 60.Stevens CF, Wang Y. Facilitation and depression at single central synapses. Neuron. 1995;14:795–802. doi: 10.1016/0896-6273(95)90223-6. [DOI] [PubMed] [Google Scholar]
- 61.Stratford KJ, Tarczy-Hornuch K, Martin KAC, Bannister NJ, Jack JJB. Excitatory synaptic inputs to spiny stellate cells in cat visual cortex. Nature. 1996;382:258–261. doi: 10.1038/382258a0. [DOI] [PubMed] [Google Scholar]
- 62.Sutor B, Hablitz JJ. EPSPs in rat neocortical neurons in vitro. I. Electrophysiological evidence for two distinct EPSPs. J Neurophysiol. 1989;61:607–620. doi: 10.1152/jn.1989.61.3.607. [DOI] [PubMed] [Google Scholar]
- 63.Swandulla D, Hans M, Zipser K, Augustine GJ. Role of residual calcium in synaptic depression and posttetanic potentiation: fast and slow calcium signaling in nerve terminals. Neuron. 1991;7:915–926. doi: 10.1016/0896-6273(91)90337-y. [DOI] [PubMed] [Google Scholar]
- 64.Thompson SM, Capogna M, Scanziani M. Presynaptic inhibition in the hippocampus. Trends Neurosci. 1993;16:222–226. doi: 10.1016/0166-2236(93)90160-n. [DOI] [PubMed] [Google Scholar]
- 65.Thomson AM, Deuchars J. Temporal and spatial properties of local circuits in neocortex. Trends Neurosci. 1994;17:119–126. doi: 10.1016/0166-2236(94)90121-x. [DOI] [PubMed] [Google Scholar]
- 66.Thomson AM, West DC. Fluctuations in pyramid–pyramid excitatory postsynaptic potentials modified by presynaptic firing pattern and postsynaptic membrane potential using paired intracellular recordings in rat neocortex. Neuroscience. 1993;54:329–346. doi: 10.1016/0306-4522(93)90256-f. [DOI] [PubMed] [Google Scholar]
- 67.Thomson AM, Deuchars J, West DC. Large, deep layer pyramid–pyramid single axon EPSPs in slices of rat motor cortex display paired pulse and frequency-dependent depression, mediated presynaptically and self-facilitation, mediated postsynaptically. J Neurophysiol. 1993;70:2354–2369. doi: 10.1152/jn.1993.70.6.2354. [DOI] [PubMed] [Google Scholar]
- 68.Tolhurst DJ, Walker NS, Thompson ID, Dean AF. Non-linearities of temporal summation in neurones in area 17 of the cat. Exp Brain Res. 1980;38:431–435. doi: 10.1007/BF00237523. [DOI] [PubMed] [Google Scholar]
- 69.Trussell LO, Zhang S, Raman IM. Desensitization of AMPA receptors upon multiquantal neurotransmitter release. Neuron. 1993;10:1185–1196. doi: 10.1016/0896-6273(93)90066-z. [DOI] [PubMed] [Google Scholar]
- 70.Tsodyks MV, Markram H. The neural code between neocortical pyramidal neurons depends on neurotransmitter release probability. Proc Natl Acad Sci USA. 1997;94:719–723. doi: 10.1073/pnas.94.2.719. [DOI] [PMC free article] [PubMed] [Google Scholar]
- 71.Varela JA, Richards K, Nelson SB. Modulation of synaptic inputs to visual cortical neurons by adenosine and 5-HT. Soc Neurosci Abstr. 1995;21:1653. [Google Scholar]
- 72.Zucker RS. Short-term synaptic plasticity. Annu Rev Neurosci. 1989;12:13–31. doi: 10.1146/annurev.ne.12.030189.000305. [DOI] [PubMed] [Google Scholar]