

Summary
Reactivation of T cell immunity by PD-1/PD-L1 immune checkpoint blockade has been shown to be a promising cancer therapeutic strategy. However, PD-L1 immunohistochemical readout is inconsistent with patient response, which presents a clinical challenge to stratify patients. Because PD-L1 is heavily glycosylated, we developed a method to resolve this by removing the glycan moieties from cell surface antigens via enzymatic digestion, a process termed sample deglycosylation. Notably, deglycosylation significantly improves anti-PD-L1 antibody binding affinity and signal intensity, resulting in more accurate PD-L1 quantification and prediction of clinical outcome. This proposed method of PD-L1 antigen retrieval may provide a practical and timely approach to reduce false-negative patient stratification for guiding anti-PD-1/PD-L1 therapy.
Keywords: PD-1, PD-L1, immune checkpoint, immunotherapy, immunohistochemistry, antibody-based detection, glycosylation/deglycosylation, heterogeneity/homogeneity, biomarker
Graphical Abstract
In Brief:
Histological detection of PD-L1 may guide therapy with anti-PD-1/PD-L1 antibodies but some PD-L1-negative tumors respond to these treatments. Lee et al. show that enzymatic deglycosylation of tissue sections improves PD-L1 detection and its predictive value, and could potentially impact patient stratification.
Introduction
The triumphs of immunotherapy by programmed death 1 (PD-1) and programmed death-ligand 1 (PD-L1) blockade have revolutionized cancer treatment in the clinic and have provided significant survival benefits to cancer patients (Chen and Han, 2015; Nishino et al., 2017; Sharma and Allison, 2015; Topalian et al., 2016). Antibodies specifically targeting PD-1 (nivolumab and pembrolizumab) or PD-L1 (atezolizumab, avelumab, and durvalumab) have been approved by the U.S. Food and Drug Administration (FDA) for second- and even first-line treatment against various cancer types, such as non-small cell lung cancer, head and neck squamous cell carcinoma, renal cell carcinoma, urothelial cancers, melanoma, and classical Hodgkin’s lymphoma (Borghaei et al., 2015; Brahmer et al., 2015; Garon et al., 2015; Herbst et al., 2016; Rittmeyer et al., 2017; Wei et al., 2018; Zou et al., 2016). Nevertheless, accumulating evidence from both preclinical and clinical studies mostly initiated in 2014 indicates that the pathological assessment of PD-L1 levels in patients’ cancer tissues is neither a consistent nor reliable predictor of anti-PD-1/PD-L1 therapy outcomes (Gubin et al., 2014; Herbst et al., 2014; Powles et al., 2014; Tumeh et al., 2014; Yadav et al., 2014). Indeed, based on the current PD-L1 detection method, both PD-L1-positive and PD-L1-negative patients are reported to associate with favorable response to immunotherapy in a number of trials (Eggermont et al., 2018; Forde et al., 2018; Gandhi et al., 2018; Socinski et al., 2018). The inconsistencies between PD-L1 levels and patient response present a clinical challenge to the application of anti-PD-1/PD-L1 therapy as precision medicine and suggest an urgent need to determine if PD-L1 expression level is a reliable biomarker predictive of clinical outcome.
Post-translational modifications, such as glycosylation, regulate many important cellular processes, including protein biosynthesis, localization, and function, by affecting the structure of proteins and their interactions with other molecules (Jayaprakash and Surolia, 2017; Schwarz and Aebi, 2011). Notably, N-linked glycosylation of cell surface PD-L1 accounts for about 52% (17 kDa) of the observed molecular weight (MW) of the PD-L1 protein, which has an estimated MW of 33 kDa (Li et al., 2018). Thus, glycosylation of PD-L1 could render its polypeptide antigens inaccessible to PD-L1 antibodies, which could lead to inaccurate immunohistochemical (IHC) readouts in some patient samples and conflicting results regarding therapeutic outcomes. Therefore, we hypothesized that removal of the glycan moieties on PD-L1 to expose its polypeptide antigens has the potential to improve its detection and to utilize it as a diagnostic biomarker to predict response to anti-PD-1/PD-L1 therapy.
Results
Removal of N-linked glycosylation enhances PD-L1 detection in human cancer cells
Consistent with previous studies (Li et al., 2016), the migration pattern of PD-L1 from cell lysates on gel electrophoresis was heterogeneous, as illustrated by a range of bands at ~50 kDa suggestive of heavy glycosylation, in a panel of human lung and basal-like breast cancer (BLBC) (Figures S1A and S1B); non-BLBC cell lines that do not express PD-L1 were used as a negative control. Treatment with a recombinant glycosidase (peptide-N-glycosidase F; PNGase F) to remove global N-linked glycosylation (deglycosylation, hereinafter) resulted in a homogenous pattern of PD-L1 immunodetection at ~33 kDa (Figures S1A and S1C). To determine whether the N-linked glycan structure of PD-L1 hinders its antibody-based detection at the cell surface, we first pretreated fixed cells with or without PNGase F followed by immunofluorescence confocal microscopy analysis. The fluorescence intensity of PD-L1 was significantly enhanced after PNGase F treatment in lung cancer and BT-549 BLBC cells compared with no treatment (Figures 1A, 1B, and S1D). These results were further supported by an enzyme-linked immunosorbent assay (ELISA)-based method. First, we quantified the chemiluminescence intensity of the positive control concanavalin A (Con A), a lectin that binds to mannose/glucose on glycoproteins, as indicator of the deglycosylation efficiency of PNGase F. As shown in Figure 1C, the addition of PNGase F, which removes the sugar moieties on target proteins, substantially reduced the chemiluminescence intensity of HRP-conjugated Con A with increasing amounts of PNGase F. Subsequent experiments revealed significantly increased anti-PD-L1 signal in BT-549 BLBC cells (Figure 1D) and in lung cancer cells (Figure 1E) treated with PNGase F using the FDA-approved diagnostic rabbit monoclonal antibody (clone 28-8 mAb) against the extracellular domain of human PD-L1 (Phillips et al., 2015). Next, we performed a saturation binding assay to determine the binding affinity of clone 28-8 mAb to the cell surface PD-L1 antigen and found that the PD-L1 antigen-antibody binding affinity increased by ~25- and 55-fold after deglycosylation in A549 and H1299 cells, respectively (Figure 1F and S1E). It is worth noting that in addition to the improved PD-L1 detection, the anti-PD-L1 signal detected by another FDA-approved therapeutic PD-L1 antibody, atezolizumab, was also significantly enhanced after deglycosylation in lung cancer cells (Figure S1F).
Figure 1. Removal of N-linked glycosylation enhances anti-PD-L1 signal in human cancer cells in a variety of bioassays.

(A and B) Immunofluorescence confocal microscopy of BT-549 (A) and A549 (B) cells processed with or without deglycosylation by PNGase F (5%) pretreatment stained with DAPI and an anti-PD-L1 antibody (Abcam, ab58810). Bar, 10 μm. Quantification is shown to the right. Data are representative of 3 independent experiments, randomly chosen in 3 different fields.
(C and D) ELISA of Con A (C) and PD-L1 (clone 28-8 mAb) (D) levels in BT-549 cells processed with deglycosylation by increasing concentrations of PNGase F (1, 2, 5%) pretreatment for comparison with cells without deglycosylation (PNGase F; 0%). The intensity of Con A and PD-L1 was normalized to that without PNGase F pretreatment and set to 1.
(E) ELISA of PD-L1 levels (clone 28-8 mAb) in lung cancer cells processed with deglycosylation by PNGase F (1%) pretreatment for comparison with cells without deglycosylation (0%). Negative control, secondary Ab only control.
(F) Left: saturation binding assay of A549 cell lysates binding to anti-PD-L1 clone 28-8 mAb. Right: scatchard plot of cell number binding to anti-PD-L1 antibody transformed from the left.
(G) Representative images (left) and quantification (right) of H-score of IHC staining for BLBC (BT-549, BT-20, and MDA-MB-231) and non-BLBC (MCF-7) cancer cell blocks processed with or without deglycosylation by PNGase F (5%) pretreatment. Bar, 50 μm.
(H) Representative images (top) and quantification (bottom) of H-score of IHC staining for a panel of lung cancer cell blocks processed with or without deglycosylation by PNGase F (5%) pretreatment. Bar, 50 μm.
(A–F) Results are presented as mean ± SD. *p < 0.05, **p < 0.01, ***p < 0.001, Student’s t test.
See also Figure S1.
PD-L1 IHC assay is the standard method used in the clinic to stratify patients for immune checkpoint therapy. To address whether sample deglycosylation is suitable for PD-L1 expression assessment by IHC, we first utilized formalin-fixed paraffin-embedded (FFPE) cancer cell line samples as a test model and examined the effects of deglycosylation on PD-L1 detection. Consistently, PD-L1 detection as determined by histoscore (H-score) was enhanced after deglycosylation of lung cancer and BLBC cell samples, but not in the MCF-7 cells used as negative controls (Figures 1G and 1H). Together, these results indicated that N-linked glycosylation of PD-L1 impedes its detection by anti-PD-L1 antibodies, and PD-L1 deglycosylation likely eliminates the steric hindrance for antibody recognition, which can significantly improve the antibody-based detection sensitivity.
Deglycosylation significantly enhances PD-L1 detection in human tumor tissue samples
We further evaluated the anti-PD-L1 signals in pathological staining of patient samples from a multi-organ carcinoma tissue microarray (TMA) that included five cancer types: breast, lung, colon, prostate, and pancreatic cancers (n = 200). The H-score of PD-L1 between samples processed with and without deglycosylation varied significantly (p < 0.0001; Figure 2A). Among these cases, the majority of samples were categorized as either having no changes in H-scores or having a more than two-fold increase in H-score (Figure 2B and 2C). A similar pattern was observed when analyzing each cancer type individually (Figures S2A) and in two independent patient cohorts of lung (n = 149; Figures 2D–2F) and rectal (n = 92; Figures S2B–S2D) cancers. These results revealed that the number of patients (37.5–57.5%) with positive IHC staining for PD-L1 increased significantly by more than two-fold after deglycosylation, indicating N-linked glycosylation of PD-L1 critically affects its recognition by the anti-PD-Ll antibody in the clinical diagnosis of various cancer types. We further analyzed tumor tissues from three independent cohorts of lung cancer patients in which PD-L1 tumor proportion score (TPS), defined by the percentage of PD-L1 membrane staining of positive tumor cells, was detected mostly at < 1% or within 0–49% by conventional IHC without prior deglycosylation (Figures 2G and S2E). Among them, sample deglycosylation significantly increased PD-L1 TPS to ≥ 5% and > 49%, the clinically agreed-upon cutoffs to be considered eligible for nivolumab and pembrolizumab therapy, respectively. Thus, the removal of N-linked glycosylation identified that about 16.4–24.5% of the patients who could have received anti-PD-1/PD-L1 therapy were excluded based on the current staining method (Bironzo and Di Maio, 2018). Interestingly, sample deglycosylation increased PD-L1 detection only in a relatively small population (4.2%) of patients whose PD-Ll-positive cells were > 49% by conventional IHC without deglycosylation (Figure 2G). Together, the proposed sample deglycosylation may be a feasible method to eliminate or reduce false-negative PD-L1 detection and has the potential to benefit a significant population of patients with false-negative PD-L1 detection (within 0–49% by conventional IHC staining), rendering them eligible for immune checkpoint therapy.
Figure 2. Deglycosylation significantly enhances anti-PD-L1 signal in a major population of patient samples from a human tumor tissue microarray.

(A) H-score values representing PD-L1 protein expression from IHC staining of a human multi-organcarcinoma tissue microarray (TMA, n = 200) processed with or without deglycosylation by PNGase F (5%) pretreatment. Results were analyzed by the Wilcoxon signed-rank test.
(B) A pie chart highlighting the fold change of H-score after N-linked glycosylation removal through PNGase F treatment from (A).
(C) Two representative cases of IHC staining from (A). Bar, 50 μm.
(D) H-score values representing PD-L1 protein expression from IHC staining of a human lung cancer TMA (n = 149) processed with or without deglycosylation by PNGase F (5%) pretreatment. Results were analyzed by the Wilcoxon signed-rank test.
(E) A pie chart highlighting the fold change of H-score after N-linked glycosylation removal through PNGase F treatment from (D).
(F) Two representative cases of IHC staining from (D). Bar, 50 μm.
(G) The average population of three individual cohorts of lung cancer patients (total n = 233) expressing PD-L1 positive cells (PD-L1 TPS; %) from the indicated cutoffs without and with deglycosylation (deglyco.). Results are presented as mean ± SD.
See also Figure S2.
Improved PD-L1 detection after deglycosylation is associated with response to anti-PD-1/PD-L1 therapy
To address the inconsistent observations between PD-L1 IHC readout and patient response, which has been a long-term puzzle in the clinic, we collected 95 pre-immunotherapy archived FFPE blocks containing tumor tissues from patients with different types of cancers who received or were undergoing immunotherapy. Samples were treated with or without PNGase F glycosidase and subjected to IHC staining followed by correlation analysis between pathological PD-L1 expression and clinical response rates. Consistently, the H-score of samples processed with deglycosylation increased significantly compared with those without deglycosylation (p < 0.0001; Figure 3A). We further grouped the fold changes in H-score after deglycosylation into four categories: 1) no change (44.2%), 2) increased by more than two-fold (34.7%), 3) increased by less than two-fold (20%), and 4) repression within two-fold (1.1%) (Figures 3B and 3C). In addition, the percentage of PD-L1-positive signal also varied significantly between samples processed with and without deglycosylation (p < 0.0001; Figure S3A). Two comparable groups were identified: a) cases whose PD-L1 TPS did not change (67.4%) and b) those that increased (32.6%), among which 10.5% (n = 10) increased by more than two-fold (Figure S3B).
Figure 3. Improved PD-L1 detection after deglycosylation is associated with response to anti-PD-1/PD-L1 therapy.

(A) H-score values representing PD-L1 protein expression from IHC staining of the archived FFPE tumor tissue blocks before treatments from patients with different types of cancer who received or are undergoing anti-PD-1/PD-L1 immunotherapy (n = 95) processed with or without deglycosylation by PNGase F (5%) pretreatment. Results were analyzed by the Wilcoxon signed-rank test.
(B) A pie chart highlighting the fold change in H-score after N-linked glycosylation removal through PNGase F treatment from (A).
(C) Representative cases of IHC staining from (A). Bar, 50 μm.
(D) Pearson correlation test between H-score representing PD-L1 protein expression in patient tissue slides processed with or without deglycosylation and the corresponding PFS from anti-PD-1/PD-L1 therapy from (A).
(E) Pearson correlation test between the percentage of PD-L1 positive cells (TPS) in patient tissue slides processed with or without deglycosylation and the corresponding PFS from anti-PD-1/PD-L1 therapy from (A).
(F and G) Pearson correlation test between PD-L1 H-score (F) or PD-L1 TPS (G) in patient tissue slides processed with or without deglycosylation and the corresponding OS from anti-PD-1/PD-L1 therapy from (A) (n = 49 with the OS available).
See also Figures S3 and S4.
Notably, the H-score readout of PD-L1 correlated significantly with the patient progression-free survival (PFS) only after sample pretreatment with PNGase F but not without PNGase F (Figure 3D; p = 0.018 versus p = 0.663). The improved p value was also observed in the correlation between the PD-L1 TPS and the patient PFS after sample deglycosylation (Figure 3E; p = 0.013 versus p = 0.480). Statistical analyses of pathological PD-L1 levels and PFS of the majority of patients in the cohort, who received anti-PD-1 therapy nivolumab (Figures S3C and S3D; n = 39), showed improved p values between the PFS following nivolumab therapy and the PD-L1 H-score readout (Figure S3C; p = 0.016 versus p = 0.287) or the PD-L1 TPS (Figure S3D; p = 0.049 versus p = 0.423) after sample deglycosylation. In addition, we also observed similar results in other groups of patients who received anti-PD-1 therapy, e.g., nivolumab, pembrolizumab, and camrelizumab (Figures S3E and S3F; n = 75), or anti-PD-L1 therapy, e.g., atezolizumab and durvalumab (Figures S3G and S3H; n = 12), in the same cohort. Together, sample deglycosylation renders a more accurate assessment of PD-L1 levels to predict clinical outcomes of patients. In addition to the PFS, we identified 49 cases of this cohort with available overall survival (OS) data to study the correlation between the OS of patients and pathological PD-L1 levels. The results indicated similarly improved p values for the correlation between the OS and PD-L1 H-score readout (Figure 3F; p = 0.033 versus p = 0.798) or PD-L1 TPS (Figure 3G; p = 0.005 versus p = 0.293) after PNGase F treatment. Collectively, using both PFS and OS, we demonstrated that sample deglycosylation indeed resulted in a more accurate assessment of PD-L1 expression, allowing better prediction of clinical response to anti-PD-1/PD-L1 therapy.
Increased PD-L1 signal after deglycosylation is beneficial to therapeutic selection
Traditionally in lung cancer, patients whose PD-L1 expression is < 1% are excluded from anti-PD-1/PD-L1 therapy, whereas those with ≥ 1% are preferentially administered immunotherapy alone (> 49%) or with concurrent chemotherapy (1–49%) (Bironzo and Di Maio, 2018). Among those 95 cases, we found that deglycosylation of tissue samples from a major group of lung cancer patients (n = 44) also significantly improved the correlation between the patient PFS and the pathological PD-L1 levels determined either by PD-L1 H-score (Figure 4A; p = 0.016 versus p = 0.362) or PD-L1 TPS (Figure 4B; p = 0.017 versus p = 0.460). Next, we asked whether patients within the 0–49% PD-L1 TPS by conventional IHC would benefit from sample deglycosylation in therapeutic selection by increasing PD-L1-positive cells to > 49%. A significant increase in the PFS was observed in group 2 (> 49% after deglycosylation) compared with group 1 (0–49% with and without deglycosylation) (Figure 4C; p = 0.003; mean, 256.6 days versus 70.1 days), suggesting that about 16% of patients in group 2 whose PD-L1 TPS appeared to be detected inaccurately by conventional IHC would therapeutically benefit from sample deglycosylation to increase PD-L1 TPS to > 49%. Notably, the PFS of patients in group 2 was comparable to those in group 3 whose PD-L1 TPS were > 49% with and without deglycosylation (Figure 4C; mean, 256.6 days versus 252.9 days), indicating that PD-L1 levels after deglycosylation more accurately predicts clinical outcomes. Thus, the deglycosylation-mediated increase in PD-L1 signal could render ~16% of patients sensitive for immunotherapy alone instead of with concurrent chemotherapy.
Figure 4. Increased PD-L1 signal after deglycosylation is beneficial to therapeutic selection.

(A and B) Pearson correlation test between PD-L1 H-score (A) or PD-L1 TPS (B) in lung cancer patient tissue slides (n = 44) processed with or without deglycosylation from Figure 3A and the corresponding PFS from anti-PD-1/PD-L1 therapy.
(C) The PFS of lung cancer patients expressing PD-L1 TPS in the indicated cutoffs without or with deglycosylation. n = 12 for group (1), n = 7 for group (2), n = 25 for group (3).
(D) The PFS of lung cancer patients expressing PD-L1 TPS from < 1% in the indicated cutoffs without or with deglycosylation. n = 10 for group (4), n = 5 for group (5), n = 3 for group (6).
(C and D) Results are presented as mean ± SD. *p < 0.05, **p < 0.01, ***p < 0.001, NS, not significant, Student’s t test.
Next, to further investigate whether patients whose PD-L1 expression is < 1% would benefit from sample deglycosylation by increasing PD-L1 TPS to greater than 5% (Figure 4D; designated as group 5) or > 49% (Figure 4D; group 6), we analyzed the PFS of lung cancer patients (15 out of 44) with < 1% PD-L1 TPS by conventional IHC. A significant increase in the PFS was observed between group 4 and group 5 (p = 0.029; mean, 70.9 days versus 175.2 days) and between group 4 and group 6 (p = 0.0006; mean, 70.9 days versus 248.0 days). This suggested that about 7–11% of patients in this cohort, whose PD-L1 expression was < 1% staining by conventional IHC, increased to > 49% staining (7% of cases) or ≥ 5% staining (11% of cases) after sample deglycosylation, and those patients appeared to respond to anti-PD-1/PD-L1 therapy (Figure 4D), but would have otherwise been ineligible for the immune checkpoint therapy. Indeed, this number is close to the estimated potential PD-L1 false-negative patient population (9–17%) who still responded to immunotherapy in clinical trials (Borghaei et al., 2015; Brahmer et al., 2015). Collectively, sample deglycosylation identified a significant population (7–16%) of patients who are eligible to receive immune checkpoint inhibitors and likely benefit from the treatment, especially those with false-negative detection of PD-L1 within 0–49% by conventional IHC staining.
PD-L1 deglycosylation enhances its detection in a small fraction of tumor-associated immune cells
PD-L1 expression score in immune and tumor cells has been assessed in patients who received PD-L1 inhibitors, such as atezolizumab (Fehrenbacher et al., 2016; Kowanetz et al., 2018). To determine whether deglycosylation also affects the detection of PD-L1 in immune cells, we first assessed the status of PD-L1 glycosylation in human immune cells, e.g., Jurkat (T lymphocytes) and THP1 (monocytes), by immunoblotting. Pretreatment with PNGase F resulted in a homogenous detection of PD-L1 at ~33 kDa in both Jurkat and THP1 cells (Figure S4A), indicating heavy glycosylation of PD-L1 also occurs in human immune cells. We further performed a quantitative ELISA to determine whether anti-PD-L1 signal intensity is affected after N-linked glycosylation removal in Jurkat and THP1 cells. Following PNGase F treatment, anti-PD-L1 signal intensity was significantly enhanced in THP1 cells but only slightly increased in Jurkat cells (Figure S4B). These results suggested that the degree of increase in the intensity of anti-PD-L1 signal in immune cells after deglycosylation may vary in different types of immune cells. Next, we validated the effects of deglycosylation on PD-L1 detection in tumor-associated immune cells from the existing clinical samples in FFPE tissue samples. Due to the presence of immune cell infiltration in the tumor microenvironment, about 46 out of 95 cases containing tumor-associated immune cells (lymphocytes) were available for reassessment (Figures S4C–S4E). The percentage of PD-L1-positive (PD-L1+) signal in immune cells varied between samples processed with and without deglycosylation but was less significant compared with tumor cells (p = 0.016 versus p < 0.0001; Figure S4C versus Figure S4F). Moreover, the distribution of increase in PD-L1 detection after deglycosylation in immune cells was proportionally less than that in tumor cells. Specifically, the increase in the percentage of PD-L1+ immune cells (Figure S4D; 15.2%) was less than that in tumor cells (Figure S4G; 34.8%). Likewise, the percentage that increased by more than two-fold were only 2.2% compared with that of 10.9% in tumor cells after deglycosylation (Figure S4D versus Figure S4G). Notably, the deglycosylation-mediated increase in PD-L1 intensity change and clinical outcome of the TPS of this cohort (Figures S4F–S4H) was similar to that of the combined positive score (CPS) (Figures S4I–S4K), in which PD-L1 was scored in both tumor and immune cells (Kulangara et al., 2019), supporting the minimal effects of deglycosylation of PD-L1 on scoring immune cell PD-L1 expression. In brief, both TPS and CPS of PD-L1 varied significantly between samples processed with and without deglycosylation (p < 0.0001; Figures S4F and S4I). The distribution of increase in PD-L1 TPS and CPS after deglycosylation was also proportionally comparable (Figures S4G and S4J). Moreover, in the presence of PNGase F, the correlation between patient response and either PD-L1 TPS (Figure S4H; p = 0.062 versus p = 0.430) or CPS (Figure S4K; p = 0.065 versus p = 0.424) demonstrated a near-significant trend. These results suggested that measuring PD-L1 levels either by TPS or CPS following deglycosylation more accurately predicts anti-PD-1/PD-L1 clinical outcome.
In summary, sample deglycosylation of the current cohort enhanced the detection of PD-L1 in a small fraction of tumor-associated immune cells (lymphocytes). In addition, the increase in the number of positive-responding cells by more than two-fold was less significant in immune cells than in tumor cells (2.2% versus 10.9%), implying that the profiles of glycan composition between these two cell types may be different.
Antigen retrieval by protein deglycosylation improves predictive ability of PD-L1 as a biomarker for immunotherapy
Finally, to study whether deglycosylated PD-L1 in tumor cells increases the predictive power of PD-L1 as biomarker to guide anti-PD-1/PD-L1 therapy in clinical practice, we divided PD-L1 H-score values into high or low using the median value as a cutoff (H-score = 57.5) from a total 95 cases in both groups treated with and without PNGase F. No statistically significant benefits in the PFS of patients with high levels of PD-L1 (Figure 5A; p = 0.346) was observed by conventional IHC, which is consistent with results from multiple clinical trials. However, with deglycosylation by pretreating samples on IHC slides with PNGase F, patients with high levels of PD-L1 exhibited significantly improved response to immunotherapy that associated with a decline in an estimated hazard ratio (HR) from 0.82 to 0.58 (Figures 5A and 5B) compared with those with low levels of PD-L1 (Figure 5B; p = 0.015). Similar results were observed using the respective median value of PD-L1 H-score as a cutoff in the groups treated either with or without PNGase F (Figures 5C and 5D). Together with the results from OS analysis using the median value of PD-L1 H-score (Figures S5A–S5D) or PD-L1 TPS (Figures S5E–S5H) as a cutoff, the removal of N-linked glycosylation enhances the predictive power of PD-L1 as a biomarker to guide immunotherapy. We also validated the clinical response by lung imaging screening which demonstrated an increase in H-score by greater than two-fold in three randomly selected cases (cases 6, 7, and 11) after deglycosylation. Interestingly, tumors from 2 out of 3 patients exhibited apparent shrinkage under PD-1 inhibitor treatment (Figures 5E and 5F), which further illustrated our objective to identify the most responsive patient group. Collectively, these results suggested that removing the glycan moieties from tumor samples prior to IHC staining leads to a more accurate assessment of PD-L1 expression to allow better prediction of clinical response to anti-PD-1/PD-L1 therapy.
Figure 5. Deglycosylation improves predictive ability of PD-L1 as a biomarker for immunotherapy.

(A and B) The PFS of cancer patient samples processed without (A) or with (B) deglycosylation by PNGase F (5%) pretreatment. Cases with H-score equal to or higher than the median value of total 95 cases (H-score = 57.5) were considered as high expression and those with H-score less than the median value as low expression.
(C and D) The PFS of cancer patient samples processed without (C) or with (D) deglycosylation by PNGase F (5%) pretreatment. Cases with H-score equal to or higher than the median value of individual group [H-score = 40 in the group of without glycosylation (C) and H-score = 90 in the group of with glycosylation (D), respectively] were considered as high expression and those with H-score less than the respective median value as low expression.
(E and F) Representative images of computed tomography (CT) scan and chest X-ray from case 6 (E) and case 11 (F) from Figure 3A, pre- and post-anti-PD-1 (nivolumab) immunotherapy.
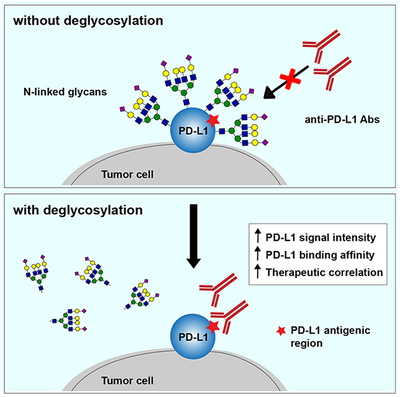
(G) A proposed model of PD-L1 antigen retrieval through sample deglycosylation. In brief, the glycan structure of PD-L1 hinders antibody-based detection targeting the PD-L1 antigen. Sample deglycosylation more accurately assesses PD-L1 expression to allow better estimation of PD-L1 levels to prevent false-negative readouts in clinical settings.
(A–D) Cohort size for each group is indicated. p values were determined by Log-rank (Mantel-Cox) test. Hazard Ratio (HR) and 95% confidence interval (CI) were determined by Mantel-Haenszel method.
See also Figure S5.
Discussion
On the basis of our current findings, we present a model (Figure 5G) showing that heavy glycosylation of PD-L1 hinders its detection by PD-L1 antibodies, which could lead to an inaccurate readout from a variety of bioassays, such as IHC, ELISA, immunofluorescence microscopy, and immunoblotting. Here, we demonstrate that removal of PD-L1 N-linked glycosylation from tissue samples by enzymatic digestion increases antibody-based PD-L1 detection to prevent false-negative readouts. Therefore, deglycosylation of PD-L1 prior to detection may be a more accurate method to quantify its expression than conventional IHC to identify patients who may receive the most benefit from immune checkpoint therapy.
PD-L1 is heavily N-linked glycosylated, and the glycan moiety is important for its immunosuppressive function, supporting a positively critical role of the glycan structures on PD-L1 for interaction with its cognate receptor PD-1 in vivo (Li et al., 2018; Li et al., 2016). However, as demonstrated in the current study, N-linked glycosylation of PD-L1 plays a negative role in antibody recognition of PD-L1. Antibodies are generally produced by the recognition of synthetic peptide antigens or recombinant protein antigens expressed in E. coli or other host organisms, which do not harbor post-translational modifications to recapitulate those that correspond to the native antigens, and thus presents a challenge when considering the heterogeneity of protein glycosylation in higher organisms (Lee et al., 2010; Rancour et al., 2010; Spadiut et al., 2014). Therefore, using the FDA approved PD-L1 mAb clone 28-8 for pathological diagnosis in FFPE tissues as an example (Phillips et al., 2015; Schats et al., 2018), we demonstrated that such heavy glycosylation of PD-L1 renders the polypeptide antigen region less accessible for binding to the PD-L1 diagnostic antibody, leading to inaccurate IHC readouts in some patient samples and resulting in apparent inconsistent therapeutic outcomes. Our results indicated that removal of the glycan moiety of PD-L1 enhances its detection by IHC using antibodies that recognize PD-L1 polypeptide.
Together with other disease parameters, such as tumor mutational burden and immune cell infiltration (Nishino et al., 2017; Wei et al., 2018; Zou et al., 2016), deglycosylation of PD-L1 might be an effective method to improve the predictive power of PD-L1 as a biomarker for immune checkpoint therapy in clinical practice. Whether deglycosylation affects PD-L1 scoring in immune cells is yet not clear; however, our data indicated that the improvement in PD-L1+ immune cells detection was statistically significant (Figure S4C; p = 0.016). Interestingly, we did not observe statistical significance of the effects of the patient PFS correlation on scoring PD-L1 TPS or CPS in this cohort (Figures S4H and S4K), suggesting that protein deglycosylation might improve PD-L1 scoring in immune cells in a certain population of patients. A comprehensive investigation with better clinical sample assessment to recapitulate the spatial heterogeneity of tumor-infiltrated immune cells in the tumor microenvironment (Hendry et al., 2017a; Hendry et al., 2017b) would be required to validate this in the future. Morales-Betanzos et al. recently showed that high levels of PD-L1 glycosylation as measured by quantitative mass spectrometry analysis associates with poor detection of PD-L1 by IHC estimation in melanoma patient samples (Morales-Betanzos et al., 2017). Given that cell surface proteins are frequently glycosylated at different levels, protein deglycosylation can be used as a general approach to improve antibody binding by decreasing antigen heterogeneity and structural hindrance attributed to heavy glycosylation on certain membrane proteins and provide potential benefits to biomedical research and personalized medicine.
STAR Methods
CONTACT FOR REAGENT AND RESOURCE SHARING
Further information and requests for resources and reagents should be directed to and will be fulfilled by the Lead Contact, Mien-Chie Hung (mhung@mail.cmu.edu.tw).
EXPERIMENTAL MODEL AND SUBJECT DETAILS
Cell culture
All human cells lines were cultured at 37 °C under 5% CO2 and were obtained from the American Type Culture Collection (Manassas, VA, USA), including breast cancer (BT-549, BT-20, MDA-MB-231, MCF-7), lung cancer (H1437, A549, Calu3, H1299, H1355, H358, H1435, H226, H322), and immune (Jurkat T lymphocytes, THP1 monocytes) cell lines. Human breast cancer cell lines and H1435 cells are female-derived cell lines; other cell lines used are male-derived cells. All cell lines were independently validated by STR DNA fingerprinting at The University of Texas MD Anderson Cancer Center and characterized as mycoplasma negative. BT-549, BT-20, MDA-MB-231, MCF-7, and A549 cells were maintained in Dulbecco’s modified Eagle’s medium (DMEM)/F12, supplemented with 10% fetal bovine serum (FBS) and 1% antibiotic mixture. Calu3 cells were cultured in Eagle’s Minimum Essential Medium, supplemented with 10% FBS and 1% antibiotic mixture. Other cells used were cultured in RPMI-1640, supplemented with 10% FBS and 1% antibiotic mixture.
Human tissue samples
Human tissue samples were collected following the guidelines approved by the Institutional Review Board at China Medical University Hospital (CMUH106-REC1-145), Chang Gung Memorial Hospital (201800036B0), The Affiliated Tumor Hospital of Harbin Medical University, and The University of Texas MD Anderson Cancer Center (LAB05-0127). Written informed consent to publish identifiable images was obtained from patients in all cases at the time of tissue sample collection. All tissue samples were collected before immunotherapy. A total of 95 human tissue samples were obtained from patients with cancers of lung (n = 44), head and neck (n = 22), esophageal (n = 13), bladder (n = 5), and others (n = 13) (gender: 68 males and 27 females; mean ± SD age, 59.29 ± 11.18 years; median age, 59.00 years; range, 25–92 years). Progression free survival (PFS) was obtained from all 95 patients with overall survival (OS) available for 49 patients. The differences in PFS (p = 0.395) or OS (p = 0.639) between males and females were not significant as determined by Student’s t test. Pearson correlation test was utilized to confirm an insignificant association of patient age with PD-L1 H-score without deglycosylation (p = 0.26) and with deglycosylation (p = 0.42). The objective response rate (ORR) and the disease control rate (DCR) (n = 93 out of 95 of this cohort with immunotherapy response rate available) were 10.8% and 39.8%, respectively, which are comparable to that reported in clinical trial studies in unselected patients with 14–23% of ORR and 36% of DCR (Califano et al., 2018; Huang et al., 2016; Shukuya and Carbone, 2016). For the human tumor tissue microarrays (TMAs), the study from 92 cases of rectal cancer was approved by the Institutional Review Board at China Medical University Hospital (CMUH106-REC1-145). Informed consent was obtained from all patients (gender: 66 males and 26 females; mean ± SD age, 59.43 ± 12.99 years; median age, 59 years; range, 31–90 years). Pearson correlation test was utilized to confirm an insignificant association of patient age with PD-L1 H-score without deglycosylation (p = 0.84) and with deglycosylation (p = 0.39). Both human carcinoma TMAs of multi-organ and lung were purchased from Biomax, #BC000119 (n = 200) and #NSC151 (n = 149), respectively. For the study using different cutoffs as threshold, three independent cohorts of lung cancer patients expressing PD-L1 (233 cases total) were used, including a group of 44 out of 95 cancer patients who received immunotherapy, 40 out of 200 cases in the multi-organ cancer TMA, and 149 cases in the lung cancer TMA.
METHOD DETAILS
Deglycosylation of cell lysates and immunoblotting (IB)
Cells were lysed in RIPA buffer (150 mM NaCl, 50 mM Tris [pH 7.5], 1% Nonidet P-40, and protease inhibitor mixture) and sonicated using a Vibra-Cell sonicator. Following the manufacturer’s instruction with a slight modification for PNGase F (NEB Inc., P0704) treatment, 5–20 μg of cell lysates were combined with 1 μl of 10× Glycoprotein Denaturing Buffer and water to make up a 10 μl total reaction volume. The mixture was denatured by heating at 100°C for 10 min and chilled on ice, and 2 μl of 10× GlycoBuffer 2, 2 μl of 10% Nonidet P-40, and 6 μl of water were then added to make up a 20 μl total reaction volume. The denatured mixture was incubated at 37 °C overnight without or with 1 μl of PNGase F to keep the final glycerol concentration equal to 5% and subjected to IB analysis with the indicated antibodies.
Cell deglycosylation and immunofluorescence confocal microscopy
Cells seeded in 8-well chamber slide were fixed in 4% paraformaldehyde at 4 °C overnight. After washing three times with PBS, the fixed cells were incubated with 1× glycoprotein denaturing buffer (0.5% SDS and 40 mM DTT), denatured by heating at 100 °C for 10 min, and chilled on ice. The denaturing buffer was removed from the chamber, and cells were washed with PBS three times, treated without or with PNGase F (5%) containing PBS at 37 °C overnight, and then subjected to immunofluorescence confocal microscopy. In brief, cells were then permeabilized with 0.5% Triton X-100 for 15 min and blocked with 5% bovine serum albumin (BSA) for 1 hr at room temperature. After the incubation with PD-L1 antibody (1:100; Abcam, ab58810) at 4 °C overnight, cells were incubated with an anti-rabbit secondary antibody tagged with fluorescein isothiocyanate (1:500) at room temperature for 1 hr. Nuclei were stained with DAPI contained in the mounting reagent. Confocal fluorescence images were captured using a Zeiss LSM 710 laser microscope. In all cases, optical sections were obtained through the middle planes of the nuclei, as determined with use of nuclear counterstaining.
Sample deglycosylation and ELISA-based quantitation
We performed sample deglycosylation quantitatively based on a common ELISA method described below. Cells seeded at 1 × 10³ cells/well in ELISA 96-well plates were fixed in 4% paraformaldehyde at 4 °C overnight. After washing three times with PBS, the fixed cells were incubated with 1× glycoprotein denaturing buffer, denatured by heating at 100 °C for 10 min, and chilled on ice. The denaturing buffer was then removed from the well, washed with PBS three times, treated without or with PNGase F containing PBS at 37 °C overnight, followed by quantitative ELISA-based method. For the detection of PD-L1 or Con A (positive control) in BT-549 cells, cells were pretreated increasing amounts of PNGase F (1, 2, 5%) for comparison with cells without PNGase F (0%). After incubation at 37 °C overnight, the PNGase F-pretreated cells were then blocked with 1% BSA solution at 37 °C for 3 hr. After rinsing three times with PBS with 0.05% Tween 20 (PBST), cells were incubated with an anti-PD-L1 antibody (1:100 in blocking buffer; clone 28-8 mAb) at 4 °C overnight or with HRP-conjugated Con A (1:100 in blocking buffer) at room temperature for 2 hr. Cells were then washed with PBST three times with shaking for 1 min and incubated with a Peroxidase-AffiniPure goat anti-rabbit IgG secondary antibody (1:5,000 in blocking buffer) at room temperature for 1 hr (except for the Con A set). Cells were washed with PBST three more times with shaking, and peroxidase substrate TMB (3,3′,5,5′-tetramethylbenzidine) was added and incubated for 30 min at room temperature. The reaction was terminated by the addition of STOP solution. The optical density representing the chemiluminescence intensity was determined at 450 nm using a BioTek Synergy Neo multi-mode reader and corrected by subtraction of readings at 570 nm.
For PD-L1 detection in lung cancer cells, PNGase F-pretreated cells (1% PNGase F) were incubated overnight at 37 °C overnight followed by blocking with 1% BSA solution at 37 °C for 3 hr. After rinsing three times with PBST, cells were incubated with or without (secondary Ab only control) an anti-PD-L1 antibody (1:100 in blocking buffer for clone 28-8 mAb; 1:500 in blocking buffer for atezolizumab) at 4 °C overnight. Cells were then washed with PBST three times with shaking for 1 min and incubated with a Peroxidase-AffiniPure goat anti-rabbit IgG (for clone 28-8 mAb; 1:5000 in blocking buffer) or anti-human IgG (for atezolizumab; 1:5,000 in blocking buffer) secondary antibody at room temperature for 1 hr. Cells were washed with PBST three more times with shaking, and TMB as a peroxidase substrate was added and incubated for 30 min at room temperature. The reaction was terminated by the addition of STOP solution. The optical density representing the chemiluminescence intensity was determined at 450 nm using a BioTek Synergy Neo multi-mode reader and corrected by subtraction of readings at 570 nm.
Detection of PD-L1 antibody binding affinity by quantitative ELISA-based method
A saturation binding assay was performed based on the above-mentioned ELISA-based quantitation to determine the binding affinity of anti-PD-L1 clone 28-8 mAb to cell surface PD-L1 antigen. To calculate the number of cells with antigen sites half-saturated by clone 28-8 mAb, cells were seeded in ELISA 96-well plates at a series of cell numbers (2, 1, 0.5, 0.25, 0.125, 0.0625, and 0.03125 × 10³ cells/well) and fixed in 4% paraformaldehyde at 4 °C overnight. After washing three times with PBS, the fixed cells were incubated with 1× glycoprotein denaturing buffer, denatured by heating at 100 °C for 10 min, and chilled on ice. The denaturing buffer was then removed from the well, washed with PBS three times, and treated with (1%) or without (0%) PNGase F at 37 °C overnight. The PNGase F-pretreated cells were then blocked with 1% BSA solution at 37 °C for 3 hr. After rinsing three times with PBST, cells were incubated with an anti-PD-L1 antibody (1:100 in blocking buffer; clone 28-8 mAb) at 4 °C overnight. Cells were then washed with PBST three times with shaking for 1 min and incubated with a Peroxidase-AffiniPure goat anti-rabbit IgG secondary antibody (1:5,000 in blocking buffer) at room temperature for 1 hr. Cells were washed with PBST three more times with shaking, and TMB as a peroxidase substrate was added and incubated for 30 min at room temperature. The reaction was terminated by the addition of STOP solution. The optical density representing the chemiluminescence intensity was determined at 450 nm using a BioTek Synergy Neo multi-mode reader and corrected by subtraction of readings at 570 nm. The cell number at which cells were half-saturated with anti-PD-L1 mAb was estimated by the above binding data and then transformed to create a Scatchard plot using GraphPad Prism (version 7; Prism Software Inc., San Diego, USA).
Sample deglycosylation in IHC assay
Formalin-fixed paraffin-embedded (FFPE) tissue sections were incubated at 40 °C overnight and then at 58–65 °C for 1–3 hr, deparaffinized with xylene and ethanol, and hydrated in distilled water. Antigen retrieval was performed with 10 mM citric acid (pH 6.0) in the microwave for 10 min (1000W for 2 min and 200W for 8 min) and cooled at room temperature for 60 min. After washing twice with PBS, tissue sections were incubated with 1× glycoprotein denaturing buffer at room temperature for 3 hr, washed with PBS four times, treated without or with PNGase F (5%) containing PBS at 37 °C overnight (12–18 hr), and subjected to IHC staining. In brief, sections were then blocked with 3% H2O2/methanol for 10 min at room temperature and washed with PBS three times. Normal serum (10%) in PBS was added to the sections for 30 min in a humid chamber at room temperature. After wiping off normal serum, PD-L1 primary antibodies (1:100; Abcam, ab205921, clone 28-8 mAb) were added to the sections in a humid chamber at 40 °C overnight, washed with PBS three times, and incubated with an anti-rabbit secondary antibody (1:200) for 1 hr in a humid chamber at room temperature. Sections were then washed with PBS three times and peroxidase conjugated avidin biotin complex (1:100) was added for 1 hr in a humid chamber at room temperature. After washing with PBS three more times, sections were incubated with AEC chromogen substrate (3-amino-9-ethylcarbazole dissolved in N,N-dimethylformamide) for 5–10 min, washed with distilled water three times, counterstained with Mayer’s hematoxylin for 30 sec, washed again with distilled water three times, and mounted with aqua-mount mounting medium.
Validation of IHC staining
Validation of IHC assay was performed according to all relevant guidelines from the College of American Pathologists Pathology and Laboratory Quality Center (Fitzgibbons et al., 2014). To set optimal cutoff values, we performed PD-L1 IHC staining using PD-L1 mAb clone 28-8 in the lung cancer tumor microarray (Biomax, #NSC151) to verify the IHC performance. Samples displayed different percentages of the stained cells, ranging from negative (0%) to strongly positive (100%) staining of the tumor cells in the validation set. These percentages in staining obtained from the validation set were applied to other clinical samples described in the manuscript. All staining procedures performed resulted in a characteristic tumor cell pattern of PD-L1 membrane staining. For the analysis of tumor tissues from three independent cohorts of lung cancer patients, we analyzed a population of patients in which the percentage of PD-L1 positive cells (PD-L1 TPS) was detected at less than 1%, 0–49%, or 50–74% by conventional IHC without deglycosylation, and then re-categorized after deglycosylation accordingly to the clinically defined cutoffs of PD-L1 TPS, e.g., ≥ 5%, ≥ 25%, > 49%, and > 74%, for those patient samples.
Evaluation of IHC staining
Two pathologists were tasked with evaluating IHC results independently using an established semi-quantitative approach to assess a Histoscore (H-score) (Detre et al., 1995), which was calculated by both the intensity of staining and the TPS defined by the percentage of PD-L1 positive cells in tumor cells. In brief, for H-score assessment performed as previously described (Wang et al., 2018), we randomly chose 10 fields at 400× magnification, and scored the staining intensity in the malignant cell as 0, 1, 2, or 3 for the presence of negative, weak, intermediate, and strong red staining, respectively. Then we counted the total number of cells in each field and the number of cells stained at each intensity, and calculated the average percentage of positive cells using the following formula: H-score = [1 × (% of cells stained at intensity category 1) + 2 × (% of cells stained at intensity category 2) + 3 × (% of cells stained at intensity category 3)]. The final H-score ranging from 0 to 300 was obtained for each staining and the average of H-score for all the cases was calculated. Cases with H-score higher than average were regarded as high expression and those with H-score equal or less than average as low expression.
QUANTIFICATION AND STATISTICAL ANALYSIS
Each sample was assayed in triplicate, unless otherwise noted. All error bars denote standard deviation (SD). Statistical analyses were performed using the GraphPad Prism program (version 7; Prism Software Inc., San Diego, USA). Student’s t-test was used to compare two groups of independent samples. Two-tailed Wilcoxon signed-rank test was used to compare two groups of matched samples. Pearson correlation test, two-tailed unless otherwise noted, was used to determine the linear correlation between two variables. Log-rank (Mantel-Cox) and Mantel-Haenszel tests were used to evaluate the statistical significance for the comparison of survival curves and hazard ratios. A p value of < 0.05 was considered statistically significant. NS, not significant; no statistical methods were used to predetermine sample size.
Supplementary Material
KEY RESOURCES TABLE
| REAGENT or RESOURCE | SOURCE | IDENTIFIER |
|---|---|---|
| Antibodies | ||
| PD-L1 antibody (clone 28-8 mAb) | Abcam | Cat#ab205921; RRID:AB_2687878 |
| CD274 rabbit polyclonal antibody | Abcam | Cat#ab58810; RRID:AB_940872 |
| PD-L1 (E1L3N) XP rabbit antibody | Cell Signaling Technology | Cat#13684; RRID:AB_2687655 |
| Atezolizumab | MDACC | N/A |
| α-tubulin antibody (monoclonal) | Sigma-Aldrich | Cat#T5168; RRID:AB_477579 |
| Actin antibody | Sigma-Aldrich | Cat#A2066; RRID:AB_476693 |
| Peroxidase-AffiniPure Goat anti-Mouse IgG (H+L) | Jackson ImmunoResearch | Cat#115-035-003; RRID:AB_10015289 |
| Peroxidase-AffiniPure Goat anti-Rabbit IgG (H+L) | Jackson ImmunoResearch | Cat#111-035-003; RRID:AB_2313567 |
| Goat Anti-Rabbit IgG (H+L) antibody, Fluorescein Conjugated | Thermo Fisher Scientific | Cat#F2765; RRID:AB_10562896 |
| Bacterial and Virus Strains | ||
| N/A | ||
| Biological Samples | ||
| Multi-organ carcinoma tissue array | Biomax | Cat#BC000119 |
| Lung cancer tissue array | Biomax | Cat#NSC151 |
| Rectal cancer tissue array | This paper | N/A |
| Human pre-immunotherapy archived tissue samples | This paper | N/A |
| Chemicals, Peptides, and Recombinant Proteins | ||
| PNGase F | New England BioLabs | Cat#P0704 |
| AEC chromogen substrate (3-amino-9-ethylcarbazole) | Sigma-Aldrich | Cat#A5754 |
| N,N-dimethylformamide | Sigma-Aldrich | Cat#D4254 |
| Aqua-mount mounting medium | DAKO | Cat#S1964 |
| ProLong™ Gold Antifade Mountant with DAPI | Invitrogen | Cat#P36931 |
| TMB Substrate | Cell Signaling Technology | Cat#7004 |
| TMB High Sensitivity Substrate Solution | BioLegend | Cat#421501 |
| STOP Solution | Cell Signaling Technology | Cat#7002 |
| Stop Solution for TMB Substrate | BioLegend | Cat#423001 |
| BSA blocking solution for ELISA | Santa Cruz Biotechnology | Cat#293965 |
| Animal-Free Blocking Solution | Cell Signaling Technology | Cat#15019 |
| Concanavalin A, HRP-conjugated | Sigma-Aldrich | Cat#L6397 |
| Critical Commercial Assays | ||
| N/A | ||
| Deposited Data | ||
| N/A | ||
| Experimental Models: Cell Lines | ||
| BT-549 | ATCC | ATCC#HTB-122 |
| BT-20 | ATCC | ATCC#HTB-19 |
| MDA-MB-231 | ATCC | ATCC#HTB-26 |
| MCF-7 | ATCC | ATCC#HTB-22 |
| H1437 | ATCC | ATCC#CRL-5872 |
| A549 | ATCC | ATCC#CCL-185 |
| Calu3 | ATCC | ATCC#HTB-55 |
| H1299 | ATCC | ATCC#CRL-5803 |
| H1355 | ATCC | ATCC#CRL-5865 |
| H358 | ATCC | ATCC#CRL-5807 |
| H1435 | ATCC | ATCC#CRL-5870 |
| H226 | ATCC | ATCC#CRL-5826 |
| H322 | ATCC | ATCC#CRL-5806 |
| Jurkat | ATCC | ATCC#TIB-152 |
| THP1 | ATCC | ATCC#TIB-202 |
| Experimental Models: Organisms/Strains | ||
| N/A | ||
| Oligonucleotides | ||
| N/A | ||
| Recombinant DNA | ||
| N/A | ||
| Software and Algorithms | ||
| Prism (version 7) | GraphPad | N/A |
| Other | ||
| N/A | ||
Significance.
Heavy glycosylation of PD-L1 hinders its detection by anti-PD-L1 antibodies and could lead to inaccurate readout from a variety of bioassays. The removal of PD-L1 N-linked glycosylation by enzymatic digestion of tissue samples can be used to increase antibody-based detection for a more precise estimation of PD-L1 levels to prevent false-negative readouts in clinical settings. Since cell surface proteins are frequently N-link glycosylated at different levels, this deglycosylation method can be used as a general approach to eliminate structural hindrance prior to antibody detection with great potential to improve biomedical research and personalized medicine.
HIGHLIGHTS.
N-linked glycosylation of PD-L1 hinders its recognition by PD-L1 antibodies
Removal of glycosylation enhances anti-PD-L1 signal in a variety of bioassays
Patient sample deglycosylation prevents false-negative detection of PD-L1
Deglycosylated PD-L1 is a more reliable biomarker to guide immunotherapy
Acknowledgments
We thank John V. Heymach, Lauren A. Bayers, and Carl M. Gay at MD Anderson Cancer Center for their constructive advice on clinical input. This work was partially supported by the following: MDA Startup Fund; The University of Texas MD Anderson-China Medical University and Hospital Sister Institution Fund; Breast Cancer Research Foundation (BCRF-17-069); Cancer Prevention and Research Institute of Texas (Multi-Investigator Research Awards; RP160710); T32 Training Grant in Cancer Biology (5T32CA186892 to H.-H.L); The Ministry of Health and Welfare, China Medical University Hospital Cancer Research Center of Excellence (MOHW108-TDU-B-212-124024; MOHW108-TDU-B-212-122015 to S.-C.W.); and Center for Biological Pathways.
Footnotes
Publisher's Disclaimer: This is a PDF file of an unedited manuscript that has been accepted for publication. As a service to our customers we are providing this early version of the manuscript. The manuscript will undergo copyediting, typesetting, and review of the resulting proof before it is published in its final citable form. Please note that during the production process errors may be discovered which could affect the content, and all legal disclaimers that apply to the journal pertain.
Declaration of Interests
H.-H.L., Y.-N.W., and M.-C.H. are listed as inventors on a patent application (U.S. patent application number UTSC.P1325US.P1, entitled Detection of immune checkpoint molecules by deglycosylation) submitted by The University of Texas MD Anderson Cancer Center. All other authors declare no non-financial and financial competing interests.
References
- Bironzo P, and Di Maio M (2018). A review of guidelines for lung cancer. J Thorac Dis. 10, S1556–S1563. [DOI] [PMC free article] [PubMed] [Google Scholar]
- Borghaei H, Paz-Ares L, Horn L, Spigel DR, Steins M, Ready NE, Chow LQ, Vokes EE, Felip E, Holgado E, et al. (2015). Nivolumab versus Docetaxel in Advanced Nonsquamous Non-Small-Cell Lung Cancer. N Engl J Med. 373, 1627–1639. [DOI] [PMC free article] [PubMed] [Google Scholar]
- Brahmer J, Reckamp KL, Baas P, Crino L, Eberhardt WE, Poddubskaya E, Antonia S, Pluzanski A, Vokes EE, Holgado E, et al. (2015). Nivolumab versus Docetaxel in Advanced Squamous-Cell Non-Small-Cell Lung Cancer. N Engl J Med. 373, 123–135. [DOI] [PMC free article] [PubMed] [Google Scholar]
- Califano R, Lal R, Lewanski C, Nicolson MC, Ottensmeier CH, Popat S, Hodgson M, and Postmus PE (2018). Patient selection for anti-PD-1/PD-L1 therapy in advanced non-small-cell lung cancer: implications for clinical practice. Future Oncol. 14, 2415–2431. [DOI] [PubMed] [Google Scholar]
- Chen L, and Han X (2015). Anti-PD-1/PD-L1 therapy of human cancer: past, present, and future. J Clin Invest. 125, 3384–3391. [DOI] [PMC free article] [PubMed] [Google Scholar]
- Detre S, Saclani Jotti G, and Dowsett M (1995). A “quickscore” method for immunohistochemical semiquantitation: validation for oestrogen receptor in breast carcinomas. J Clin Pathol. 48, 876–878. [DOI] [PMC free article] [PubMed] [Google Scholar]
- Eggermont AMM, Blank CU, Mandala M, Long GV, Atkinson V, Dalle S, Haydon A, Lichinitser M, Khattak A, Carlino MS, et al. (2018). Adjuvant Pembrolizumab versus Placebo in Resected Stage III Melanoma. N Engl J Med. 378, 1789–1801. [DOI] [PubMed] [Google Scholar]
- Fehrenbacher L, Spira A, Ballinger M, Kowanetz M, Vansteenkiste J, Mazieres J, Park K, Smith D, Artal-Cortes A, Lewanski C, et al. (2016). Atezolizumab versus docetaxel for patients with previously treated non-small-cell lung cancer (POPLAR): a multicentre, open-label, phase 2 randomised controlled trial. Lancet. 387, 1837–1846. [DOI] [PubMed] [Google Scholar]
- Fitzgibbons PL, Bradley LA, Fatheree LA, Alsabeh R, Fulton RS, Goldsmith JD, Haas TS, Karabakhtsian RG, Loykasek PA, Marolt MJ, et al. (2014). Principles of analytic validation of immunohistochemical assays: Guideline from the College of American Pathologists Pathology and Laboratory Quality Center. Arch Pathol Lab Med. 138, 1432–1443. [DOI] [PubMed] [Google Scholar]
- Forde PM, Chaft JE, Smith KN, Anagnostou V, Cottrell TR, Hellmann MD, Zahurak M, Yang SC, Jones DR, Broderick S, et al. (2018). Neoadjuvant PD-1 Blockade in Resectable Lung Cancer. N Engl J Med. 378, 1976–1986. [DOI] [PMC free article] [PubMed] [Google Scholar]
- Gandhi L, Rodriguez-Abreu D, Gadgeel S, Esteban E, Felip E, De Angelis F, Domine M, Clingan P, Hochmair MJ, Powell SF, et al. (2018). Pembrolizumab plus Chemotherapy in Metastatic Non-Small-Cell Lung Cancer. N Engl J Med. 378, 2078–2092. [DOI] [PubMed] [Google Scholar]
- Garon EB, Rizvi NA, Hui R, Leighl N, Balmanoukian AS, Eder JP, Patnaik A, Aggarwal C, Gubens M, Horn L, et al. (2015). Pembrolizumab for the treatment of non small-cell lung cancer. N Engl J Med. 372, 2018–2028. [DOI] [PubMed] [Google Scholar]
- Gubin MM, Zhang X, Schuster H, Caron E, Ward JP, Noguchi T, Ivanova Y, Hundal J, Arthur CD, Krebber WJ, et al. (2014). Checkpoint blockade cancer immunotherapy targets tumour-specific mutant antigens. Nature. 515, 577–581. [DOI] [PMC free article] [PubMed] [Google Scholar]
- Hendry S, Salgado R, Gevaert T, Russell PA, John T, Thapa B, Christie M, van de Vijver K, Estrada MV, Gonzalez-Ericsson PI, et al. (2017a). Assessing Tumor-Infiltrating Lymphocytes in Solid Tumors: A Practical Review for Pathologists and Proposal for a Standardized Method from the International Immuno-Oncology Biomarkers Working Group: Part 2: TILs in Melanoma, Gastrointestinal Tract Carcinomas, Non-Small Cell Lung Carcinoma and Mesothelioma, Endometrial and Ovarian Carcinomas, Squamous Cell Carcinoma of the Head and Neck, Genitourinary Carcinomas, and Primary Brain Tumors. Adv Anat Pathol. 24, 311–335. [DOI] [PMC free article] [PubMed] [Google Scholar]
- Hendry S, Salgado R, Gevaert T, Russell PA, John T, Thapa B, Christie M, van de Vijver K, Estrada MV, Gonzalez-Ericsson PI, et al. (2017b). Assessing Tumor-infiltrating Lymphocytes in Solid Tumors: A Practical Review for Pathologists and Proposal for a Standardized Method From the International Immunooncology Biomarkers Working Group: Part 1: Assessing the Host Immune Response, TILs in Invasive Breast Carcinoma and Ductal Carcinoma In Situ, Metastatic Tumor Deposits and Areas for Further Research. Adv Anat Pathol. 24, 235–251. [DOI] [PMC free article] [PubMed] [Google Scholar]
- Herbst RS, Baas P, Kim DW, Felip E, Perez-Gracia JL, Han JY, Molina J, Kim JH, Arvis CD, Ahn MJ, et al. (2016). Pembrolizumab versus docetaxel for previously treated, PD-L1-positive, advanced non-small-cell lung cancer (KEYNOTE-010): a randomised controlled trial. Lancet. 387, 1540–1550. [DOI] [PubMed] [Google Scholar]
- Herbst RS, Soria JC, Kowanetz M, Fine GD, Hamid O, Gordon MS, Sosman JA, McDermott DF, Powderly JD, Gettinger SN, et al. (2014). Predictive correlates of response to the anti-PD-L1 antibody MPDL3280A in cancer patients. Nature. 515, 563–567. [DOI] [PMC free article] [PubMed] [Google Scholar]
- Huang J, Zhang Y, Sheng J, Zhang H, Fang W, Zhan J, Zhou T, Chen Y, Liu L, and Zhang L (2016). The efficacy and safety of nivolumab in previously treated advanced non small-cell lung cancer: a meta-analysis of prospective clinical trials. Onco Targets Ther. 9, 5867–5874. [DOI] [PMC free article] [PubMed] [Google Scholar]
- Jayaprakash NG, and Surolia A (2017). Role of glycosylation in nucleating protein folding and stability. Biochem J. 474, 2333–2347. [DOI] [PubMed] [Google Scholar]
- Kowanetz M, Zou W, Gettinger SN, Koeppen H, Kockx M, Schmid P, Kadel EE 3rd, Wistuba I, Chaft J, Rizvi NA, et al. (2018). Differential regulation of PD-L1 expression by immune and tumor cells in NSCLC and the response to treatment with atezolizumab (anti-PD-L1). Proc Natl Acad Sci U S A. 115, E10119–E10126. [DOI] [PMC free article] [PubMed] [Google Scholar]
- Kulangara K, Zhang N, Corigliano E, Guerrero L, Waldroup S, Jaiswal D, Ms MJ, Shah S, Hanks D, Wang J, et al. (2019). Clinical Utility of the Combined Positive Score for Programmed Death Ligand-1 Expression and the Approval of Pembrolizumab for Treatment of Gastric Cancer. Arch Pathol Lab Med. 143, 330–337. [DOI] [PubMed] [Google Scholar]
- Lee BS, Huang JS, Jayathilaka GD, Lateef SS, and Gupta S (2010). Production of antipeptide antibodies. Methods Mol Biol. 657, 93–108. [DOI] [PubMed] [Google Scholar]
- Li CW, Lim SO, Chung EM, Kim YS, Park AH, Yao J, Cha JH, Xia W, Chan LC, Kim T, et al. (2018). Eradication of Triple-Negative Breast Cancer Cells by Targeting Glycosylated PD-L1. Cancer Cell. 33, 187–201 e110. [DOI] [PMC free article] [PubMed] [Google Scholar]
- Li CW, Lim SO, Xia W, Lee HH, Chan LC, Kuo CW, Khoo KH, Chang SS, Cha JH, Kim T, et al. (2016). Glycosylation and stabilization of programmed death ligand-1 suppresses T-cell activity. Nat Commun. 7, 12632. [DOI] [PMC free article] [PubMed] [Google Scholar]
- Morales-Betanzos CA, Lee H, Gonzalez Ericsson PI, Balko JM, Johnson DB, Zimmerman LJ, and Liebler DC (2017). Quantitative Mass Spectrometry Analysis of PD-L1 Protein Expression, N-glycosylation and Expression Stoichiometry with PD-1 and PD-L2 in Human Melanoma. Mol Cell Proteomics. 16, 1705–1717. [DOI] [PMC free article] [PubMed] [Google Scholar]
- Nishino M, Ramaiya NH, Hatabu H, and Hodi FS (2017). Monitoring immune-checkpoint blockade: response evaluation and biomarker development. Nat Rev Clin Oncol. 14, 655–668. [DOI] [PMC free article] [PubMed] [Google Scholar]
- Phillips T, Simmons P, Inzunza HD, Cogswell J, Novotny J Jr., Taylor C, and Zhang X (2015). Development of an automated PD-L1 immunohistochemistry (IHC) assay for non small cell lung cancer. Appl Immunohistochem Mol Morphol. 23, 541–549. [DOI] [PMC free article] [PubMed] [Google Scholar]
- Powles T, Eder JP, Fine GD, Braiteh FS, Loriot Y, Cruz C, Bellmunt J, Burris HA, Petrylak DP, Teng SL, et al. (2014). MPDL3280A (anti-PD-L1) treatment leads to clinical activity in metastatic bladder cancer. Nature. 515, 558–562. [DOI] [PubMed] [Google Scholar]
- Rancour DM, Backues SK, and Bednarek SY (2010). Protein antigen expression in Escherichia coli for antibody production. Methods Mol Biol. 657, 3–20. [DOI] [PubMed] [Google Scholar]
- Rittmeyer A, Barlesi F, Waterkamp D, Park K, Ciardiello F, von Pawel J, Gadgeel SM, Hida T, Kowalski DM, Dols MC, et al. (2017). Atezolizumab versus docetaxel in patients with previously treated non-small-cell lung cancer (OAK): a phase 3, open-label, multicentre randomised controlled trial. Lancet. 389, 255–265. [DOI] [PMC free article] [PubMed] [Google Scholar]
- Schats KA, Van Vre EA, Boeckx C, De Bie M, Schrijvers DM, Neyns B, De Meester I, and Kockx MM (2018). Optimal Evaluation of Programmed Death Ligand-1 on Tumor Cells Versus Immune Cells Requires Different Detection Methods. Arch Pathol Lab Med. 142, 982–991. [DOI] [PubMed] [Google Scholar]
- Schwarz F, and Aebi M (2011). Mechanisms and principles of N-linked protein glycosylation. Curr Opin Struct Biol. 21, 576–582. [DOI] [PubMed] [Google Scholar]
- Sharma P, and Allison JP (2015). Immune checkpoint targeting in cancer therapy: toward combination strategies with curative potential. Cell. 161, 205–214. [DOI] [PMC free article] [PubMed] [Google Scholar]
- Shukuya T, and Carbone DP (2016). Predictive Markers for the Efficacy of Anti-PD-1/PD-L1 Antibodies in Lung Cancer. J Thorac Oncol. 11, 976–988. [DOI] [PMC free article] [PubMed] [Google Scholar]
- Socinski MA, Jotte RM, Cappuzzo F, Orlandi F, Stroyakovskiy D, Nogami N, Rodriguez-Abreu D, Moro-Sibilot D, Thomas CA, Barlesi F, et al. (2018). Atezolizumab for First-Line Treatment of Metastatic Nonsquamous NSCLC. N Engl J Med. 378, 2288–2301. [DOI] [PubMed] [Google Scholar]
- Spadiut O, Capone S, Krainer F, Glieder A, and Herwig C (2014). Microbials for the production of monoclonal antibodies and antibody fragments. Trends Biotechnol. 32, 54–60. [DOI] [PMC free article] [PubMed] [Google Scholar]
- Topalian SL, Taube JM, Anders RA, and Pardoll DM (2016). Mechanism-driven biomarkers to guide immune checkpoint blockade in cancer therapy. Nat Rev Cancer. 16, 275–287. [DOI] [PMC free article] [PubMed] [Google Scholar]
- Tumeh PC, Harview CL, Yearley JH, Shintaku IP, Taylor EJ, Robert L, Chmielowski B, Spasic M, Henry G, Ciobanu V, et al. (2014). PD-1 blockade induces responses by inhibiting adaptive immune resistance. Nature. 515, 568–571. [DOI] [PMC free article] [PubMed] [Google Scholar]
- Wang YN, Lee HH, Chou CK, Yang WH, Wei Y, Chen CT, Yao J, Hsu JL, Zhu C, Ying H, et al. (2018). Angiogenin/Ribonuclease 5 Is an EGFR Ligand and a Serum Biomarker for Erlotinib Sensitivity in Pancreatic Cancer. Cancer Cell. 33, 752–769 e758. [DOI] [PMC free article] [PubMed] [Google Scholar]
- Wei SC, Duffy CR, and Allison JP (2018). Fundamental Mechanisms of Immune Checkpoint Blockade Therapy. Cancer Discov. 8, 1069–1086. [DOI] [PubMed] [Google Scholar]
- Yadav M, Jhunjhunwala S, Phung QT, Lupardus P, Tanguay J, Bumbaca S, Franci C, Cheung TK, Fritsche J, Weinschenk T, et al. (2014). Predicting immunogenic tumour mutations by combining mass spectrometry and exome sequencing. Nature. 515, 572–576. [DOI] [PubMed] [Google Scholar]
- Zou W, Wolchok JD, and Chen L (2016). PD-L1 (B7-H1) and PD-1 pathway blockade for cancer therapy: Mechanisms, response biomarkers, and combinations. Sci Transl Med. 8, 328rv324. [DOI] [PMC free article] [PubMed] [Google Scholar]
Associated Data
This section collects any data citations, data availability statements, or supplementary materials included in this article.