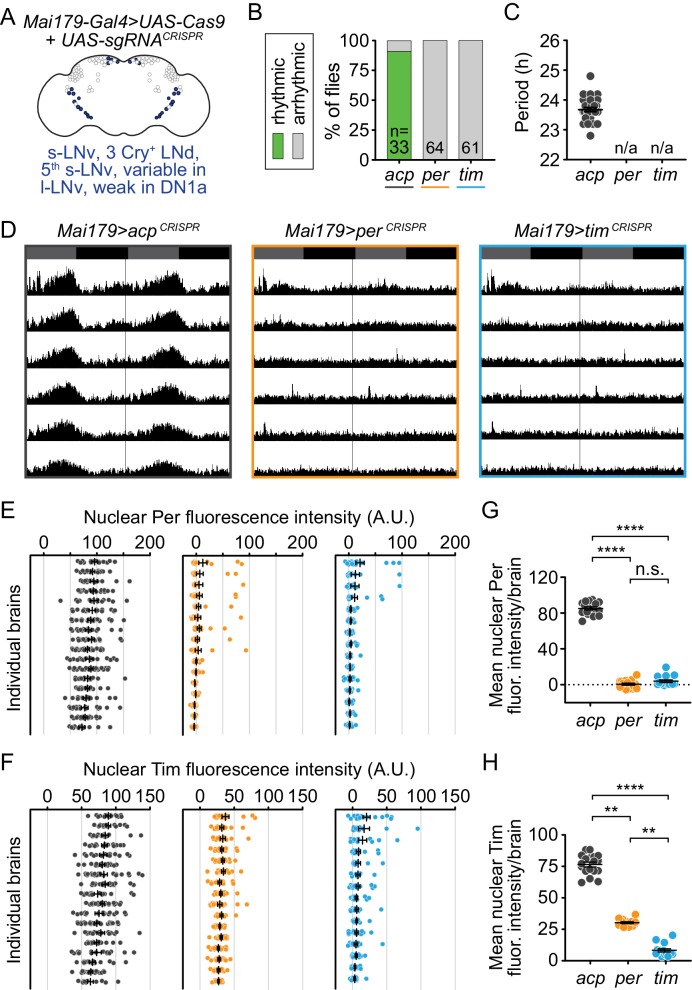
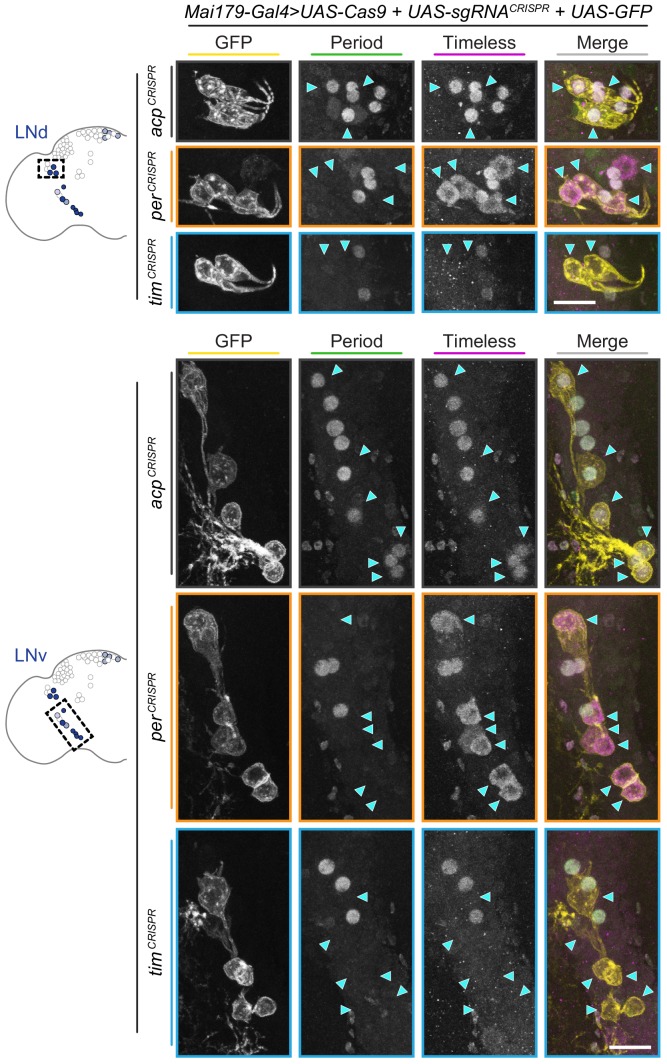
Figure 3. Cell-specific disruption of per or tim in Mai179+ neurons causes complete loss of behavioral rhythmicity and efficient loss of the targeted protein.
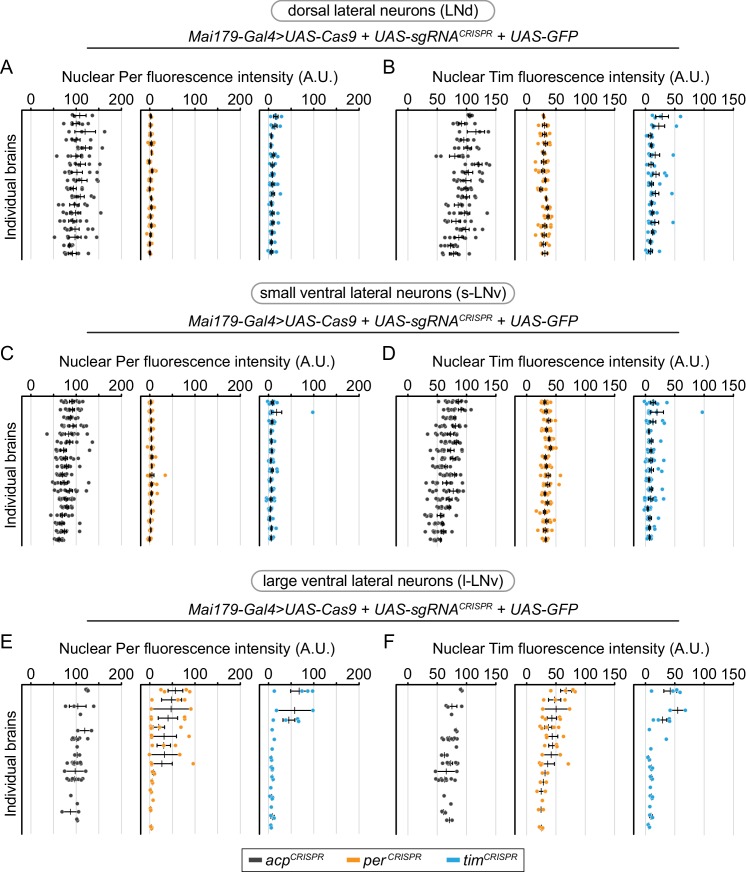
(A) Diagram of the circadian neuron subset marked by Mai179-Gal4. (B) Disruption of per or tim in Mai179+ neurons caused complete loss of behavioral rhythmicity. (C) Scatter plot showing the period of rhythmic flies with Mai179-Gal4-driven disruption of acp, per, or tim. (D) Average actograms showing the activity of flies in constant darkness with Mai179-Gal4-driven disruption of acp, per, or tim. Six days of activity are displayed, double-plotted. Dark gray rectangles = subjective day, black rectangles = subjective night. (E and F) Background-subtracted nuclear fluorescence intensity of Per (E) or Tim (F) at ZT0 in GFP+ neurons, grouped by brain with mean ± SEM shown. Individual brains are shown in the same order in both E and F. (G and H) Mean nuclear fluorescence intensity of Per (G) or Tim (H) at ZT0 in GFP+ neurons, averaged per brain (acp n = 18; per n = 16; tim n = 15). **: p<0.01; ****: p<0.0001; n.s.: not significant, p>0.05. Significance determined by Kruskal-Wallis nonparametric ANOVA (to account for non-normality of samples) followed by Dunn’s multiple comparisons test; reported p-values are multiplicity adjusted to account for multiple comparisons.
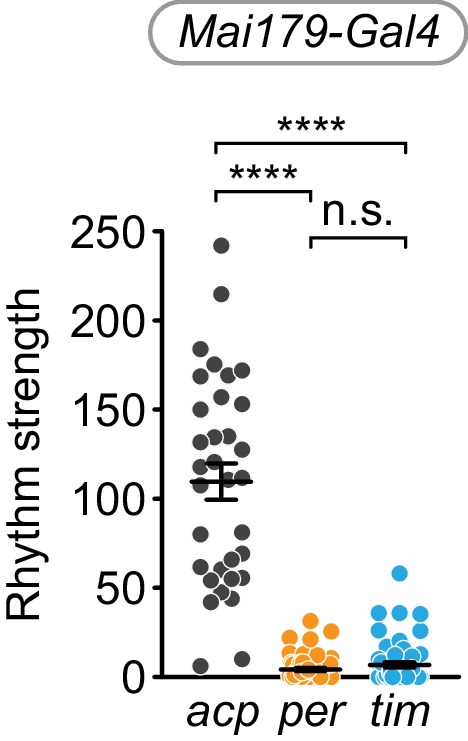
Figure 3—figure supplement 1. Cell-specific disruption of per or tim in Mai179+ cells causes loss of rhythm strength.


