

Abstract
Interactions between hydrogen protons of water molecules and macromolecules within the myelin sheath surrounding the axons are a major factor influencing the magnetic resonance (MR) contrast in white matter (WM) regions. In past decades, several studies have investigated the underlying effects and reported a wide range of R1 rates for the myelin associated compartments at different field strengths. However, it was also shown that the experimental quantification of the compartment-specific R1 rates is associated with large uncertainties. The current study therefore investigates the longitudinal relaxation rates within the myelin sheath using a molecular dynamic (MD) simulation. For this purpose, a realistic molecular model of the myelin sheath was employed to determine the dipole-dipole induced R1 relaxation rate of the hydrogen protons at clinically relevant field strengths. The results obtained clearly reflect the spatial heterogeneity of R1 with a increased relaxivity of myelin water due to a reduced molecular mobility near the membrane surface. Moreover, the calculated R1 rates for both myelin water and macromolecules are in excellent agreement with experimental findings from the literature at different field strengths.
Subject terms: Biological physics, Neurology
Introduction
Longitudinal relaxation is one of the major contrast mechanisms in the central nervous system and is widely used for the investigation of WM morphology. Even though the underlying effects causing this excellent contrast are a frequently investigated issue in the neuroimaging community, they are still not completely understood. It is well known, for example, that the longitudinal relaxation rate in WM regions depends on local tissue concentration and is strongly correlated with the degree of myelinated axons1,2. In these myelin rich areas, approximately 12% of the water molecules occur as thin films with a thickness of 35 nm between the lipid membranes surrounding the axons3,4. Even though this so-called myelin water is not visible in all MRI acquisitions, it mixes with the MR-visible free water pool in the intra-/extra-cellular space, thereby affecting the observable R1 relaxation rate. Here and in the following, the term “water” refers exclusively to the pool of H2O molecules which are bound between the myelin bilayers.
In contrast to the intra-/extra-cellular water, myelin water molecules diffuse predominantly close to the membrane surface and interact with the macromolecules, thereby affecting their R1 rate. One important mechanism is the transfer of magnetization between the macromolecular pool and the surrounding water. This magnetization transfer (MT) is mainly governed by two effects, namely the through space dipole-dipole coupling between the hydrogen nuclei and the direct exchange of individual protons or hydroxide groups between water and macromolecules5–7. These biophysical and biochemical processes between adjacent compartments are referred to as through space cross-relaxation and chemical exchange, respectively. However, it is controversial and still under discussion to what amount the individual mechanisms contribute to the total magnetization transfer8.
Another mechanism that is assumed to play an important role is the reduced diffusivity of water molecules between the lipid membrane due to electrodynamic interactions. The myelin sheath, for example, is composed of various lipid types such as cerebrosides, phospholipids and cholesterol with different tail lengths and head group structures9,10. The corresponding spatial variations in length and structure cause a complex and grained membrane surface which constrains the mobility of individual water molecules11. In addition, the polar head groups of the phospholipid reduce the diffusivity of water molecules in its immediate neighborhood due to their hydrophilic character. Recent MD simulation studies have shown that this effect is present up to a few nanometers away from the membrane surface and could thus affect the water dynamics over the whole myelin water space12. Since the longitudinal relaxation is direct related to the molecular mobility, it is thought that these restrictions strongly affect the R1 rate of the myelin water associated molecules13.
However, several studies in the past years have shown that an accurate isolation of the MR signal of myelin associated water and a reproducible quantification of its R1 rate is quite complicated and associated with uncertainties13–25. In addition to the limited accuracy, many of these experiments were performed at different field strengths, which complicates a direct comparison of their findings. On the other hand, in the past decades classical molecular dynamic (MD) simulations have become a reliable and well established tool for modeling the physical properties of molecules and reconstructing experimental data. Moreover, the continuous improvement of molecular force field simulations and the variety of parameterized lipid and protein molecules allows to simulate complex biological structures, i.e. a myelin-alike environment on atomistic scale.
The aim of the current work was therefore the theoretical investigation of the dipole-dipole induced R1 relaxation rate in the myelin sheath using an MD simulation. For this purpose, we first carried out an MD simulation of a lipid-water system representing a small fraction of the membrane structure inside the myelin sheath (the lack of protein molecules in this model is discussed in the Limitations section). The hydrogen trajectories obtained from this atomistic simulation were employed in the next step to determine the dipolar induced relaxation rate of the 1H protons inside the myelin sheath at field strengths of 1.5 T, 3 T and 7 T. Based on these results, the average R1 rates of the lipid membrane and the water compartment were calculated and compared with experimental findings at different field strength. In addition, the cross-relaxation rate between the water and the macromolecules was determined to assess its contribution to the total magnetization transfer.
Methods
Dipolar relaxation in a two-compartment system
The formalism for the calculation of nuclear spin relaxation employed in this study is based on the well-established approach introduced by Bloembergen, Purcell and Pound26. In this approach the authors derived the relaxation rates in liquid substances for spin-½ particles by treating the motion of the molecules classically whereas the dipolar interaction Hamiltonian was described quantum mechanically. It is assumed that secondary relaxation mechanisms such as j–coupling, spin-rotation or chemical shift anisotropy of the molecules are negligible. Under these conditions, the relevant interaction between two equivalent spins I and S is given by the dipole-dipole Hamiltonian which can be written in terms of second-rank tensors as
| 1 |
where are spin operators and Fq are second degree spherical harmonics of order q. The polar coordinates r, θ and φ describe the position of spin S relative to I, whereas the main magnetic field, B0, defines the -direction of the coordinate system. Spin operators and spherical harmonics satisfy the relationships and , respectively, where the asterisk indicates the complex conjugate, and the latter are given by:
| 2a |
| 2b |
| 2c |
A full definition of the spin operators can be found in27. For the case of molecules that are subject to thermal motion, the relative position and thus the Hamiltonian becomes time dependent. Fluctuations with spectral components around the Lamor frequency, , serve as energy source for the longitudinal relaxation process. The relevant frequencies for the spin transitions can be obtained from the real part of the corresponding spectral densities which are given by
| 3 |
where Gq is the time autocorrelation function of the q-th spherical harmonic and τ is the lag time. The angular brackets on the right-hand side denote the average over time. For isotropic tumbling particles such as water molecules in the liquid phase, the autocorrelation function decays exponentially on timescales of a few picoseconds and the corresponding spectral density can be described by a simple Lorentzian curve. In macromolecules, however, hydrogen nuclei are bonded in a flexible lattice resulting in an overall motion that is governed by the internal vibrations of the nuclei and the global rotation of the whole molecule. Since both processes occur simultaneous and independently on different time scales, the corresponding correlation functions can be factored and written in a normalized form as
| 4 |
where is the global correlation time of the macromolecule, the internal vibrational correlation time, S2 the order parameter describing the restriction of the motion of individual protons and can take values from 0 to 128. The respective spectral density can then be written as linear combination as
| 5 |
where is the magnitude of the correlation function given by . Following the semiclassical approach from Bloembergen et al., the transition probability per unit time between two two-particle spin states and , W, is given to first order by
| 6 |
where is the reduced Planck constant, q = 1,2 is the order of the spherical harmonics and γI(S) is the gyromagnetic ratio of spin I(S). Using these definitions and the relationship between the transition probabilities and the longitudinal relaxation rate, which can be derived from the kinetic equations of the state population, the R1 rate for two hydrogen nuclei () can be expressed in terms of the spectral densities as27
| 7 |
Here, μ0 is the vacuum permeability and γH is the gyromagnetic ratio of the hydrogen nuclei. Eq. (7) holds true for two nuclei in magnetically equivalent environments and can easily be extended for a many spin system. In order to apply Eq. (7) to the myelin sheath, it must be taken into account that the dynamics of hydrogen nuclei within rigid macromolecules is different from those within the mobile water molecules. The motion-restricted nuclei are subject to static magnetic fields from neighbouring spins and ions which make them insensitive to exciting pulses near the Lamor frequency29,30. Such an excitation pulses, for example, would depose energy in the water molecules but does not affect the net spin population within the macromolecules. Due to their different absorption properties, it follows that the relaxation processes of hydrogen nuclei assigned to the water-pool (WP) and hydrogen nuclei assigned to the macromolecule-pool (MP) have to be determined separately. For this purpose, Eq. (7) has to be extended to account for the different environments:
| 8 |
Here, jR1,A is the longitudinal relaxation rate of the j-th proton and NA is the total number of hydrogen protons in pool A (WP or MP), i. e. the hydrogen nuclei are exclusively assigned to either WP or MP. In addition to this compartment-intrinsic induced relaxation, it must be taken into account that the hydrogen nuclei still interact across pools, thereby enhancing their transition probability mutually. Moreover, the unbalanced spin populations due to spectral broadening causes a MT between the two pools. These inter-compartmental interactions, which exclusively involve 1H protons from the respective other pool, are referred as auto- and cross-relaxation31 and are given by
| 9 |
| 10 |
where NB is the total number of 1H protons assigned to the pool B. Figure 1 shows how the different relaxation processes can be classified in context of the pool affiliation. In order to determine the average auto- and cross-relaxation rates, the Eqs (7–10) have to be averaged over all hydrogen nuclei within the respective pools. For cross-relaxation, this procedure leads to the expression , which can be interpreted as the transfer of magnetization per time unit from pool B to A. Since the latter expression corresponds to a double sum over NA and NB weighted by the pool size, the average cross-relaxation rates satisfy
| 11 |
which holds also true for the average auto-relaxation rates. To compare the calculated relaxation rates with experimental findings, it has to be considered that the influence of cross-relaxation cannot be distinguished from the influence of chemical exchange in conventional MR experiments. Although both mechanisms gover the transfer of magnetization between different pools, they do not change the sum magnetization of the combined system and can thus be decoupled from the auto- and intrinsic relaxation rates. The effective relaxation rates, , for the each of the pool, without the contribution of MT effects, can then be defined as
| 12a |
| 12b |
Figure 1.

Left: Illustration of the different relaxation mechanism between hydrogen nuclei residing on water and macromolecules; Right: Coordinate system which defines the frame of reference. In this frame, the hydrocarbon tails of the lipids are directed along the x- or y-axis while the main magnetic field points along z.
It should be mentioned that Eqs (7–10) are expressed in a general form without any assumptions regarding the molecular structure or motion. In the literature it is often assumed that the molecular motion is unrestricted and isotropic. For such a stochastic process, the spherical harmonics yield an exponentially decaying spectral density and the relaxation rates can be expressed in terms of the reorientational correlation time of the water molecules. Since the water molecules are motionally restricted and thus the molecular tumbling is not necessarily isotropic, the general form was used here.
System preparation and molecular dynamics simulation
To simulate the dynamics of hydrogen atoms inside the myelin sheath, a MD simulation was performed using the GROMACS package 5.1.2 and the CHARMM36 all-atom force field32,33. The membrane structure of the myelin sheath was represented by two lipid-leaflets and was modeled according to a realistic myelin alike molecular composition using the CHARMM-GUI web interface34. Each leaflet was composed of 27 cholesterol (CHL: C27H46O), 23 phosphatidylcholines (DPPC: C40H80NO8P), 23 phosphatidylethanolamines (POPE: C39H76NO8P), 23 galactocerebrosides (GalC: C40H77NO7) and 4 sulfatides (GalS: C40H76NO11S). This composition corresponds to a phosphor- and galactolipid content of 46% and 27%, respectively, in accordance with histological observations10. The space between the leaflets was solvated with 4699 water molecules, which corresponds to a water mass-ratio of 40%. In addition, 8 sodium molecules were added to the water compartment to neutralize the net charge of the sulfatides. The water molecules between the leaflets were represented by the TIP4p-FB model35. This water model yields significantly better results for water specific characteristics compared to the standard mTIP3p model and is, as far as we can judge, compatible with the CHARMM36 force field (see supporting information).
Before the production runs, during which the trajectories were saved for the further analysis, the system was thermodynamically equilibrated for a MD simulation time of 50 ns to body temperature (310.15 K) and normal pressure according the following settings: The equations of motion were solved using the leap-frog algorithm with a simulation time step of 2 fs. The cut-off lengths of the Lennard-Jones potential and short-range Coulomb interaction were set to 12 nm using the Verlet-scheme. Long-range electrostatic interactions were calculated using the particle-mesh Ewald summation with a grid spacing of 0.5 Å. During all simulation steps, the temperature and pressure were kept constant and controlled by the Nosé-Hoover and Parrinello-Rahmen coupling with a time constant of ps and ps, respectively. The length (but not the angles) of the hydrogen bonds in the membranes was constrained using the LINCS algorithm.
Based on the equilibrated system, the production runs were conducted using the same settings as described above. The run was performed for TMD = 20 ns and a saving frequency of ΔT = 0.5 ps. During the production run, the lipid layers were in the Lβ – phase (gel phase) and the tail distance fluctuates around 8.2 nm, which is in accordance with the typical periodicity of the myelin sheath36,37. After the run, the trajectories were recomposed again to avoid broken molecule structures due to the periodic boundary condition using the subroutines provided by the GROMACS package. Finally, the trajectories of the hydrogen nuclei of the WP and MP were separately extracted. The final configuration after the trajectory conversion and the density profiles of the corresponding membrane components are shown in Fig. 2a,b.
Figure 2.
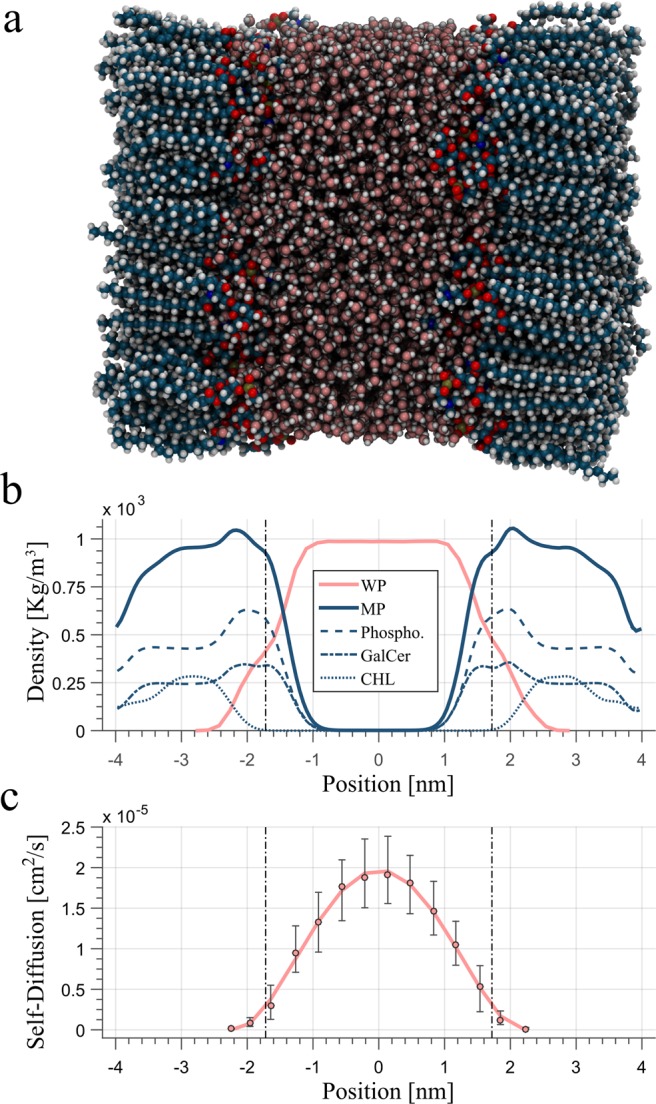
Snapshot of the lipid-water system after the production run and the trajectory conversation (a). Density profile of different lipid species inside the membrane as well as water molecules (b). Self-Diffusion profile of water molecules across the water pool (c). The dotted lines indicate the Gibbs-dividing surface and the error bars the 25th and 75th percentile.
It should be mentioned that the production run was also performed as an NVE (constant particle number, volume and energy) instead of an NPT (constant particle number, pressure, and temperature) ensemble in order to avoid additional molecular fluctuations due to the temperature and pressure couplings. However, both ensemble configurations yielded, within the standard error, similar relaxation rates for the water molecules. In addition, it should also be mentioned that employing the original water model (mTIP3p) of the CHARMM36 force field instead of the TIP4p-FB model would lead to quite different relaxation rates for the water pool (see supporting information).
Computation of the relaxation rates
Based on the extracted trajectory sets, the compartment-intrinsic relaxation rates of the WP protons were calculated as follows: First, a single hydrogen nucleus was randomly selected and the relative positions to the remaining hydrogen nuclei (NWP = 9397) within the WP were computed for each time step and converted into polar coordinates. Then, from the polar coordinates, the spherical harmonics given by Eq. (2b,c) and the corresponding correlation functions G1(τ) and G2(τ) were calculated in the interval τ = 0, …, 0.3TMD using fast Fourier transformation. The truncation at τ = 0.3TMD was performed to take into account that the tail of the correlation function is dominated by noise due to the finite trajectory length. Next, the spectral densities and were calculated for field strengths of 1.5 T, 3 T and 7 T by explicit integration of Eq. (3). Finally, from the spectral densities, the relaxation rate, , of the selected hydrogen nucleus was determined using Eq. (8).
Since the water molecules diffuse several times across the water compartment within TMD = 20 ns, the calculation above yields representative results for the average relaxation rate of the WP but is not well suited for studying the specific influence of the reduced molecular mobility near the membrane surface. For this purpose, the procedure describe above was repeated for ns, whereby the starting points for the trajectory analysis were randomly selected from the original data set. The time interval of this short-time analysis was chosen so that the average WP-R1 rate is comparable with the results where the whole trajectory set was analysed, but the averaged positions of the individual hydrogen nuclei still reflect the location within the WP. In addition to the R1 rates, the diffusion coefficients of the water molecules were calculated by fitting the Stokes-Einstein relation to the mean square displacement of the oxygen trajectories. This short-term analysis was performed for 2000 randomly selected trajectory parts and yields the diffusion profile shown in Fig. 2c.
The determination of the relaxation rates of the MP associated hydrogen nuclei (NMP = 13810) was performed similarly, except for the determination of the spectral densities and the short-time analysis. First, the relative positions between a randomly selected hydrogen nucleus and the remaining nuclei were computed and converted into polar coordinates. To determine the spatial distribution of the R1 rates within the lipid membrane, the average positions of the selected hydrogen nuclei were stored. Then, the spherical harmonics and the correlation functions were computed using Eqs (2) and (3). Next and in contrary to the calculation for the for the hydrogen nuclei in the WP, the correlation functions were normalized, , and fitted to Eq. (4) using a least square algorithm. This additional step is necessary since the correlation function of some hydrogen nuclei in the rigid macromolecules does not fully decay to zero within the simulation time of 50 ns. Based on the fit results, the spectral densities and and the relaxation rates were computed using Eqs (6–8). Due to the long computation time of the fitting procedure, the relaxation rates of the MP-protons were calculated for 1381 random selected hydrogen nuclei, which corresponds to 10% of the total compartment size. These hydrogen nuclei were also used to calculate the auto- and cross-relaxation in the MP. For this purpose, the relative positions between one proton and all hydrogen nuclei from the WP were calculated to determine the correlation functions. Since the correlation function describing the inter-compartmental interactions completely converged within the simulation time, the spectral densities , and could be directly computed using explicit integration. Next, from the spectral densities, the auto- and cross-relaxation rates were calculated according Eqs (9) and (10). Then, the computed rates were averaged in order to determine auto- and cross-relaxation rates of the WP using Eq. (11). Finally, the effective relaxation rates, , were determined according Eq. (12) and, in order to compare the results to experimental findings at different field strength, fitted with a least-square algorithm to the function with parameters n0 and n138.
Results
Table 1 contains the averaged relaxation rates calculated for WP and MP at 1.5 T, 3 T and 7 T. As is evident from the results, all rates increase with decreasing field strength. For , the average relaxation rates decrease from 1.175 Hz at 1.5 T by a factor of 1.6 to 0.712 Hz at 7 T. A similar decrease by a factor of 2.0 and 1.7 is also observed for and , respectively. In contrast, for the cross-relaxation rates, a decrease from 0.061 Hz and 0.042 Hz by factor of 3.8 to 0.016 and 0.011 Hz is observed for the WP and MP, respectively. The self-diffusion coefficient of water obtained from the short-term analysis is shown in Fig. 2c. As can be seen in this Figure, diffusion of the water molecules near the membrane surface is significant reduced and reaches a maximum of approximately cm2/s in the centre of the WP.
Table 1.
Averaged relaxation rates for the water and macromolecular pool at different field strengths.
| B0 = 1.5 T | 1.175 | 0.061 | 0.165 | 4.95 | 0.042 | 0.112 |
| B0 = 3.0 T | 0.978 | 0.039 | 0.132 | 3.72 | 0.027 | 0.090 |
| B0 = 7.0 T | 0.718 | 0.016 | 0.095 | 2.43 | 0.011 | 0.065 |
Figure 3 shows the different relaxation rates of the WP and MP as a function of the hydrogen positions and the different field strengths. As it is evident from this Figure, the relaxation rates of the macromolecules increases from R1, MP ≈ 1Hz at the end of the hydrocarbon tails to approximate 5 Hz for 1.5 T, and 4 Hz for 7 T, in the head groups. For the relaxation rates in the WP shown in Fig. 3b, a parabolic relaxation profile is observed with a minimum of R1, MP ≈ 0.5 Hz at the middle of the WP and a signification increase of near the macromolecules up to 16 Hz for 1.5 T and 5 Hz for 7 T. Figure 3c,d shows the relaxation profiles of and , respectively. Here, the auto- and cross-relaxation rates increase sharply from a few mHz at the tail positions by a factor at the head groups, which can be directly attributed to the dependency of the dipolar interaction between the WP and MP. The fitting procedure of the effective relaxation rates according Eq. (12) yielded the equations for WP and for MP.
Figure 3.

R1 relaxation rates in MP (a) and WP (b) as a function of the proton positions. The macromolecular cross- and auto-relaxation rates are shown in (c,d), respectively. The error bars indicate the standard error of mean.
Discussion
The aim of this work was to determine the relaxation rates inside the myelin sheath and its surrounding water compartment using an MD simulation. As is evident from Table 1 and Fig. 3, the calculated relaxation rates clearly reflect the expected R1 dispersion in WM structures38,39. Moreover, the results obtained demonstrate that the relaxation rate of the myelin water is strongly affected by motional restrictions near the membrane surface. As can be derived from the Stokes-Einstein relation and the relaxation theory, the diffusivity of spherical particles such as water molecules is inverse proportional to the rotational correlation time and thus to the R1 rate. This inverse relationship becomes also evident when one compares the spatial distribution of R1 rates in water (Fig. 3a) and the spatial profile of the self-diffusion coefficient (Fig. 2c). The influence of the reduced molecular mobility on the R1 rate of water is evident over the entire WP and increases the average R1 rate in the WP significantly in comparison to water in the liquid phase (1.1 Hz vs 0.3 Hz). In the molecular pool a distinct increase of the relaxation rates along the tail structure was observed at all three field strengths. This behaviour can be attributed to the decreased nuclei mobility in the hydrocarbon chains for lipids in the -phase40 and illustrates a spatial inhomogeneity of R1 within the myelin sheath.
Relaxation rate
The results of the current work fit well with experimental findings at different field strength13,16–25. In17–20, phospholipid membranes were extracted from lecithin probes and their R1 rates were examined at different temperatures and field strengths between 0.2 T and 8.45 T. For body temperature, the authors reported R1 rates between 12 Hz at 0.2 T and 2 Hz at 8.45 T. The function fitted to the effective relaxation rate of the MP as determined theoretically in the current study yields R1 rates of 12.4 Hz and 2.3 Hz, respectively, in agreement with experimental findings. In contrast to the measurement on membrane model systems, an experimental quantification of R1 within the myelin WP and thus a comparison with the findings of the current study is more complicated. For field strength of 1.5 T, for example, the reported R1 rates range between 1.8 HZ and 2.7 HZ (see Table 1 in ref.41). These findings are slightly larger than the calculated R1 rates of 1.34 Hz at the same field strength in this study. However, it has to be considered that some of these studies employed a two-component (free and bound water) analysis and reported the relaxation rate of the fast decaying component whose relative contribution is between 8–20% as the of myelin water. This method, however, is not sensitive to the MR invisible macromolecules and as such provides a rate which contains a signal contribution from the MP due to magnetization transfer. An accurate quantification of R1, therefore, includes a proper distinction of the respective molecular compartments, which requires a complex multi-component analysis of the tissue samples. Even if this technique is well understood, the underlying model has several degrees of freedoms or covarying parameters and is therefore associated with systematic uncertainties even in sophisticated experiments. For example, in ref.21 the authors combined MT experiments with a multi-echo gradient echo measurement to determine the residence time of water molecules in the myelin sheath at 7 T. Even though this study provided important insights in the WM microstructure, it fails to separate the relaxation rates of two pools and reported an intermediated R1 of 1.84 Hz for the myelin sheath. Given the consistent results of the calculated and experimental R1 rates for the MP, the reported R1 rate can be compared with the average relaxation rate obtained in this work. The latter is given by
| 13 |
where denotes the average relaxation rate of the myelin sheath, the hydrogen fractions and the function fitted to the effective relaxation rates. For a field strength of 7 T, Eq. (13) yields an average relaxation rate for the myelin sheath of 1.8 Hz which is very close to the experimental finding. To provide a comprehensive and more illustrative comparison, the reported experimental findings for R1 of the myelin water associated compartment at the different field strength are shown in Fig. 4. The R1 rates which could be clearly assigned to the WP, MP or to the weighted average , are illustrated in the corresponding colours. In contrast, the R1 rates, which were assigned to the WP but might still contain a signal contribution from the MP were plotted as black circles. As is evident from this Figure, the experimental findings of the MP agree well with the calculated R1 rates. In addition, the experimental findings for the myelin water are constrained by the effective relaxation rates of the WP and MP. This means that an appropriate weighting of the respective R1 rates as well as the inclusion of magnetization transfer between the pools should allow to reconstruct the experimental data.
Figure 4.
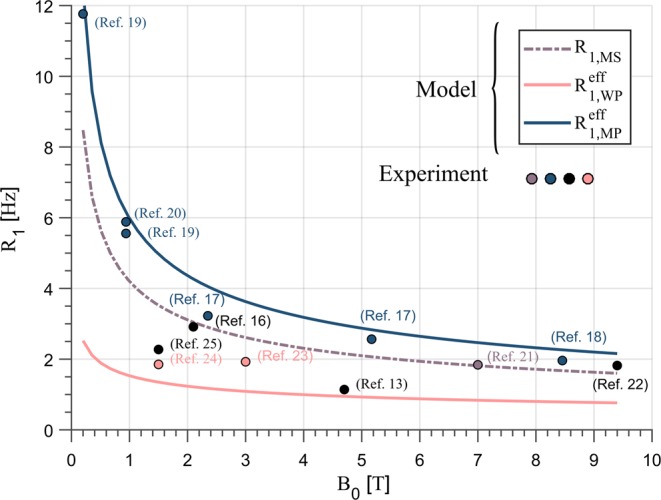
Longitudinal relaxation rates of the WP, MP and the weighted average of the myelin sheath calculated in this study (lines) and the experimental findings (circles) at different field strength. The details of the colorization are described in the main text. The experiments of ref.16,22,24 were performed at room temperature between 20° C to 24° C. The remaining data were either in vivo experiments or were performed at 39° C (ref.19) and 45° C (ref.18).
Cross-relaxation and magnetization transfer
Apart from the compartment-specific relaxation rates, the dipolar-induced cross-relaxation rates between WP and MP were calculated. As already mentioned in the introduction, it is still unclear how strong this mechanism contributes to the total magnetization transfer. In saturation-transfer experiments, for example, the magnetization transfer between lecithin/cholesterol and isotopically substituted protons was investigated42. The authors concluded that the signal differences between 3H protons and 1H protons in the surrounding water compartment could be explained by a dominance of magnetically induced exchange over chemical exchange. In contrast, other experiments in tissue and model systems have shown significant pH effects, suggesting chemical exchange43,44. If one compares the calculated cross-relaxation rates with results obtained from the measurement of magnetization transfer, this conclusion is also supported by the current study. The total exchange rate, kWP, from the WP to the MP, for example, can be written as
| 14 |
where Rce is the contribution due to chemical exchange. Studies on bovine WM have shown that kWP is in the order of 12 Hz which is approximately two orders of magnitude higher than the few hundred mHz calculated in this study16. This result indicates that the dipole-dipole induced cross-relaxation is negligible compared to chemical exchange and thus plays a minor role for the total magnetization transfer. Unfortunately, and in contrast to the physically well defined cross-relaxation, chemical exchange is characterised by complex chemical (and kinetic) processes on nanosecond-millisecond time scales and requires a comprehensive analysis of the bound enthalpy and the electron configurations of the reactants. Since these parameters are not extractable from a classical MD simulation, a more detailed investigation of the chemical exchange contribution is outside the scope of the current work.
Relating the calculated R1 rates within the myelin sheath to the typical exchange rate of approx. 12 Hz as determined in MT experiments reveals that it might be difficult to extract individual compartment-intrinsic R1 rates. The magnetisation transfer is fast compared to the relaxation rates in SM and MW. Therefore, the two pools are in rapid exchange so that hydrogen nuclei within the myelin appear as a single magnetisation pool on the longitudinal relaxation time scale.
Limitations
The current study is subject to some limitations that may have an impact on the interpretation of the reported findings. First, it should be noted that the R1 rates were determined for a perpendicular orientation of the membrane normal relative to the main magnetic field (see Fig. 1). As NMR studies have shown, however, the relaxation rate of macromolecules is affected by the membrane orientation relative to B045,46. This orientation dependency should also hold true for the R1 relaxation rates of the MP as reported in Table 1. Second, it should be mentioned that the membrane model employed here did not consider the protein content inside the myelin sheath. Previous studies have shown that the protein fraction makes up between 19% to 27% of the dry mass47,48 of the myelin sheath and consists mainly of myelin basic (∼30%) and proteolipid proteins (∼50%)49. Several studies have shown that some of these proteins are located only in the cytoplasmic space or are surrounded by a unique lipid composition50,51. The inclusion of proteins employing a realistic localization within the cellular environment and molecular distribution would therefore significantly increase the simulation run-time. However, the absence of proteins might not signifcantly alter the calculated R1 rates as can be roughly estimated from the results presented in18. Here, the authors investigated the effects of proteins on the R1 rate of choline lipids. It was demonstrated that the relaxation rate increases by about 38% for a lipid to protein ratio of 114, which approximately corresponds to the ratio within the myelin sheath. It was suggested that the higher R1 rate can be explained by the restriction of the lipid motion due to the heavier protein molecules. However, in the current study calcium pump proteins (∼110 kD) were added to the choline layers, which are approx. five times heavier than the myelin basic or proteolipid proteins (∼18 kD to 30 kD). It can therefore be assumed that the lighter proteins within the myelin sheath might have less influence on the lipid dynamics and thus on the R1 of the membrane sheath. This assumption is also supported by a recently published ex vivo study, which concluded that the R1 relaxation in WM regions is mainly governed by the lipid and not the protein content52. Therefore, it can be presumed that a more realistic molecular system including proteins would yield a slightly higher R1 rate for the solid myelin but should not significantly affect the final interpretations of this work. Finally, the current study only investigated the effect of the 1H induced dipole-dipole relaxation. Although this should be the most effective relaxation mechanism in biological tissue, it can be assumed that other spin = 1/2 particles such as the phosphorus nuclei and secondary effects such as J-coupling, susceptibility anisotropy or the iron content additionally affect the R1 rate.
Conclusion
In this work we investigated the dipolar-induced R1 relaxation inside the myelin sheath at several clinical relevant field strengths of 1.5 T, 3 T and 7 T. For this purpose, we employed an atomistic model of the myelin sheath using a realistic lipid composition and a suitable water model. The calculated results are in excellent agreement with experimental findings over a wide range of clinically relevant field strengths. Given the consistent results, the presented model might serve as a basis to investigate further MR properties of the myelin sheath on a microscopic scale. Furthermore, the results obtained suggest that the dipolar induced cross-relaxation plays a minor role for MT and illustrates the increased R1 rate of water molecules due to the reduced molecular mobility. Especially the accurate determination of the compartment specific relaxation rates shown in Table 1 might be helpful in future studies to assess experimental findings or to reconstruct the MR signal evolution in myelin rich structures.
Supplementary information
Supplementary Information for: Dipolar induced spin-lattice relaxation in the myelin sheath: A molecular dynamics study
Author Contributions
F.S. performed the MD simulations, the data analysis, wrote the manuscript and prepared the figures. H.N., U.J. contributed to the study design and scientific discussions on methods and conclusions. H.N., U.J. and F.P. contributed to the discussion of the results and did a comprehensive and critical review of the final manuscript.
Data Availability
The simulation files to generate the MD data are available from the corresponding author on request.
Competing Interests
The authors declare no competing interests.
Footnotes
Publisher’s note Springer Nature remains neutral with regard to jurisdictional claims in published maps and institutional affiliations.
Supplementary information
Supplementary information accompanies this paper at 10.1038/s41598-019-51003-4.
References
- 1.Mottershead J, et al. High field MRI correlates of myelin content and axonal density in multiple sclerosis. Journal of neurology. 2003;250:1293–1301. doi: 10.1007/s00415-003-0192-3. [DOI] [PubMed] [Google Scholar]
- 2.Koenig S, Brown R, III., Spiller M, Lundbom N. Relaxometry of brain: why white matter appears bright in MRI. Magnetic resonance in medicine. 1990;14:482–495. doi: 10.1002/mrm.1910140306. [DOI] [PubMed] [Google Scholar]
- 3.Whittall KP, et al. In vivo measurement of T2 distributions and water contents in normal human brain. Magnetic resonance in medicine. 1997;37:34–43. doi: 10.1002/mrm.1910370107. [DOI] [PubMed] [Google Scholar]
- 4.Alonso‐Ortiz E, Levesque IR, Pike GB. MRI‐based myelin water imaging: a technical review. Magnetic Resonance in Medicine. 2015;73:70–81. doi: 10.1002/mrm.25198. [DOI] [PubMed] [Google Scholar]
- 5.Edzes HT, Samulski ET. Cross relaxation and spin diffusion in the proton NMR of hydrated collagen. Nature. 1977;265:521. doi: 10.1038/265521a0. [DOI] [PubMed] [Google Scholar]
- 6.Fung, B. In Methods in enzymology Vol. 127 151–161 (Elsevier, 1986). [DOI] [PubMed]
- 7.Grad J, Bryant RG. Nuclear magnetic cross-relaxation spectroscopy. Journal of Magnetic Resonance (1969) 1990;90:1–8. doi: 10.1016/0022-2364(90)90361-C. [DOI] [PubMed] [Google Scholar]
- 8.Henkelman R, Stanisz G, Graham S. Magnetization transfer in MRI: a review. NMR in Biomedicine: An International Journal Devoted to the Development and Application of Magnetic Resonance In Vivo. 2001;14:57–64. doi: 10.1002/nbm.683. [DOI] [PubMed] [Google Scholar]
- 9.DeVries, G. H. In Research Methods in Neurochemistry 3–38 (Springer, 1981).
- 10.DeVries GH, Zetusky WJ, Zmachinski C, Calabrese V. Lipid composition of axolemma-enriched fractions from human brains. Journal of lipid research. 1981;22:208–216. [PubMed] [Google Scholar]
- 11.Peters R, Beck K. Translational diffusion in phospholipid monolayers measured by fluorescence microphotolysis. Proceedings of the National Academy of Sciences. 1983;80:7183–7187. doi: 10.1073/pnas.80.23.7183. [DOI] [PMC free article] [PubMed] [Google Scholar]
- 12.von Hansen Y, Gekle S, Netz RR. Anomalous anisotropic diffusion dynamics of hydration water at lipid membranes. Physical review letters. 2013;111:118103. doi: 10.1103/PhysRevLett.111.118103. [DOI] [PubMed] [Google Scholar]
- 13.Does MD, Gore JC. Compartmental study of T1 and T2 in rat brain and trigeminal nerve in vivo. Magnetic Resonance in Medicine: An Official Journal of the International Society for Magnetic Resonance in Medicine. 2002;47:274–283. doi: 10.1002/mrm.10060. [DOI] [PubMed] [Google Scholar]
- 14.Stanisz GJ, Kecojevic A, Bronskill M, Henkelman R. Characterizing white matter with magnetization transfer and T2. Magnetic Resonance in Medicine: An Official Journal of the International Society for Magnetic Resonance in Medicine. 1999;42:1128–1136. doi: 10.1002/(SICI)1522-2594(199912)42:6<1128::AID-MRM18>3.0.CO;2-9. [DOI] [PubMed] [Google Scholar]
- 15.Kalantari S, Laule C, Bjarnason TA, Vavasour IM, MacKay AL. Insight into in vivo magnetization exchange in human white matter regions. Magnetic resonance in medicine. 2011;66:1142–1151. doi: 10.1002/mrm.22873. [DOI] [PubMed] [Google Scholar]
- 16.Bjarnason T, Vavasour I, Chia C, MacKay A. Characterization of the NMR behavior of white matter in bovine brain. Magnetic Resonance in Medicine: An Official Journal of the International Society for Magnetic Resonance in Medicine. 2005;54:1072–1081. doi: 10.1002/mrm.20680. [DOI] [PubMed] [Google Scholar]
- 17.Feigenson G, Chan SI. Nuclear magnetic relaxation behavior of lecithin multilayers. Journal of the American Chemical Society. 1974;96:1312–1319. doi: 10.1021/ja00812a009. [DOI] [PubMed] [Google Scholar]
- 18.Deese AJ, Dratz EA, Hymel L, Fleischer S. Proton NMR T1, T2, and T1 rho relaxation studies of native and reconstituted sarcoplasmic reticulum and phospholipid vesicles. Biophysical journal. 1982;37:207–216. doi: 10.1016/S0006-3495(82)84670-5. [DOI] [PMC free article] [PubMed] [Google Scholar]
- 19.Cornell B, Pope J, Troup G. A pulsed NMR study of D2O bound to 1, 2 dipalmitoyl phosphatidylcholine. Chemistry and physics of lipids. 1974;13:183–201. doi: 10.1016/0009-3084(74)90035-8. [DOI] [PubMed] [Google Scholar]
- 20.Daycock J, Darke A, Chapman D. Nuclear relaxation (T1) measurements of lecithin-water systems. Chemistry and Physics of Lipids. 1971;6:205–214. doi: 10.1016/0009-3084(71)90060-0. [DOI] [Google Scholar]
- 21.van Gelderen P, Duyn JH. White matter intercompartmental water exchange rates determined from detailed modeling of the myelin sheath. Magnetic resonance in medicine. 2019;81:628–638. doi: 10.1002/mrm.27398. [DOI] [PMC free article] [PubMed] [Google Scholar]
- 22.Dortch RD, Harkins KD, Juttukonda MR, Gore JC, Does MD. Characterizing inter‐compartmental water exchange in myelinated tissue using relaxation exchange spectroscopy. Magnetic resonance in medicine. 2013;70:1450–1459. doi: 10.1002/mrm.24571. [DOI] [PMC free article] [PubMed] [Google Scholar]
- 23.Does MD, Beaulieu C, Allen PS, Snyder RE. Multi-component T1 relaxation and magnetisation transfer in peripheral nerve. Magnetic resonance imaging. 1998;16:1033–1041. doi: 10.1016/S0730-725X(98)00139-8. [DOI] [PubMed] [Google Scholar]
- 24.Harrison R, Bronskill MJ, Mark Henkelman R. Magnetization transfer and T2 relaxation components in tissue. Magnetic resonance in medicine. 1995;33:490–496. doi: 10.1002/mrm.1910330406. [DOI] [PubMed] [Google Scholar]
- 25.Deoni SC, Rutt BK, Arun T, Pierpaoli C, Jones DK. Gleaning multicomponent T1 and T2 information from steady‐state imaging data. Magnetic Resonance in Medicine: An Official Journal of the International Society for Magnetic Resonance in Medicine. 2008;60:1372–1387. doi: 10.1002/mrm.21704. [DOI] [PubMed] [Google Scholar]
- 26.Bloembergen N, Purcell EM, Pound RV. Relaxation effects in nuclear magnetic resonance absorption. Physical review. 1948;73:679. doi: 10.1103/PhysRev.73.679. [DOI] [Google Scholar]
- 27.Abragam, A. & Abragam, A. The principles of nuclear magnetism. (Oxford university press, 1961).
- 28.Lipari G, Szabo A. Model-free approach to the interpretation of nuclear magnetic resonance relaxation in macromolecules. 1. Theory and range of validity. Journal of the American Chemical Society. 1982;104:4546–4559. doi: 10.1021/ja00381a009. [DOI] [Google Scholar]
- 29.Wolff SD, Balaban RS. Magnetization transfer contrast (MTC) and tissue water proton relaxation in vivo. Magnetic resonance in medicine. 1989;10:135–144. doi: 10.1002/mrm.1910100113. [DOI] [PubMed] [Google Scholar]
- 30.Eng J, Ceckler TL, Balaban RS. Quantitative 1H magnetization transfer imaging in vivo. Magnetic resonance in medicine. 1991;17:304–314. doi: 10.1002/mrm.1910170203. [DOI] [PubMed] [Google Scholar]
- 31.Solomon I. Relaxation processes in a system of two spins. Physical Review. 1955;99:559. doi: 10.1103/PhysRev.99.559. [DOI] [Google Scholar]
- 32.Lindahl E, Hess B, Van Der Spoel D. GROMACS 3.0: a package for molecular simulation and trajectory analysis. Molecular modeling annual. 2001;7:306–317. doi: 10.1007/s008940100045. [DOI] [Google Scholar]
- 33.Vanommeslaeghe K, et al. CHARMM general force field: A force field for drug‐like molecules compatible with the CHARMM all‐atom additive biological force fields. Journal of computational chemistry. 2010;31:671–690. doi: 10.1002/jcc.21367. [DOI] [PMC free article] [PubMed] [Google Scholar]
- 34.Jo S, Kim T, Iyer VG, Im W. CHARMM‐GUI: a web‐based graphical user interface for CHARMM. Journal of computational chemistry. 2008;29:1859–1865. doi: 10.1002/jcc.20945. [DOI] [PubMed] [Google Scholar]
- 35.Wang L-P, Martinez TJ, Pande VS. Building force fields: An automatic, systematic, and reproducible approach. The journal of physical chemistry letters. 2014;5:1885–1891. doi: 10.1021/jz500737m. [DOI] [PMC free article] [PubMed] [Google Scholar]
- 36.Kirschner D, Caspar D. Comparative diffraction studies on myelin membranes. Annals of the New York Academy of Sciences. 1972;195:309–320. doi: 10.1111/j.1749-6632.1972.tb54811.x. [DOI] [PubMed] [Google Scholar]
- 37.Worthington C. Structural parameters of nerve myelin. Proceedings of the National Academy of Sciences. 1969;63:604–611. doi: 10.1073/pnas.63.3.604. [DOI] [PMC free article] [PubMed] [Google Scholar]
- 38.Bottomley PA, Foster TH, Argersinger RE, Pfeifer LM. A review of normal tissue hydrogen NMR relaxation times and relaxation mechanisms from 1–100 MHz: dependence on tissue type, NMR frequency, temperature, species, excision, and age. Medical physics. 1984;11:425–448. doi: 10.1118/1.595535. [DOI] [PubMed] [Google Scholar]
- 39.Rooney WD, et al. Magnetic field and tissue dependencies of human brain longitudinal 1H2O relaxation in vivo. Magnetic Resonance in Medicine: An Official Journal of the International Society for Magnetic Resonance in Medicine. 2007;57:308–318. doi: 10.1002/mrm.21122. [DOI] [PubMed] [Google Scholar]
- 40.Jacobs RE, Oldfield E. NMR of membranes. Progress in Nuclear Magnetic Resonance Spectroscopy. 1980;14:113–136. doi: 10.1016/0079-6565(80)80006-9. [DOI] [Google Scholar]
- 41.Lancaster JL, Andrews T, Hardies LJ, Dodd S, Fox PT. Three‐pool model of white matter. Journal of Magnetic Resonance Imaging: An Official Journal of the International Society for Magnetic Resonance in Medicine. 2003;17:1–10. doi: 10.1002/jmri.10230. [DOI] [PubMed] [Google Scholar]
- 42.Ceckler TL, Balaban RS. Tritium-proton magnetization transfer as a probe of cross relaxation in aqueous lipid bilayer suspensions. Journal of Magnetic Resonance (1969) 1991;93:572–588. doi: 10.1016/0022-2364(91)90084-7. [DOI] [Google Scholar]
- 43.Kucharczyk W, Macdonald P, Stanisz G, Henkelman RM. Relaxivity and magnetization transfer of white matter lipids at MR imaging: importance of cerebrosides and pH. Radiology. 1994;192:521–529. doi: 10.1148/radiology.192.2.8029426. [DOI] [PubMed] [Google Scholar]
- 44.Hills B, Favret F. A comparative multinuclear relaxation study of protein-DMSO and protein-water interactions. Journal of Magnetic Resonance, Series B. 1994;103:142–151. doi: 10.1006/jmrb.1994.1022. [DOI] [Google Scholar]
- 45.Morrison C, Bloom M. Orientation dependence of 2H nuclear magnetic resonance spin‐lattice relaxation in phospholipid and phospholipid: cholesterol systems. The Journal of chemical physics. 1994;101:749–763. doi: 10.1063/1.468491. [DOI] [Google Scholar]
- 46.Winsborrow BG, Smith I, Jarrell HC. Dynamics of glycolipids in the liquid-crystalline state. 2H NMR study. Biophysical journal. 1991;59:729–741. doi: 10.1016/S0006-3495(91)82286-X. [DOI] [PMC free article] [PubMed] [Google Scholar]
- 47.Chrast R, Saher G, Nave K-A, Verheijen MH. Lipid metabolism in myelinating glial cells: lessons from human inherited disorders and mouse models. Journal of lipid research. 2011;52:419–434. doi: 10.1194/jlr.R009761. [DOI] [PMC free article] [PubMed] [Google Scholar]
- 48.O’Brien JS, Sampson EL. Lipid composition of the normal human brain: gray matter, white matter, and myelin. Journal of lipid research. 1965;6:537–544. [PubMed] [Google Scholar]
- 49.Trapp, B. D. & Kidd, G. J. In Myelin biology and disorders 3–27 (Elsevier, 2004).
- 50.Hardy RJ, Lazzarini RA, Colman DR, Friedrich VL., Jr. Cytoplasmic and nuclear localization of myelin basic proteins reveals heterogeneity among oligodendrocytes. Journal of neuroscience research. 1996;46:246–257. doi: 10.1002/(SICI)1097-4547(19961015)46:2<246::AID-JNR13>3.0.CO;2-0. [DOI] [PubMed] [Google Scholar]
- 51.Grassi S, et al. The role of 3-O-sulfogalactosylceramide, sulfatide, in the lateral organization of myelin membrane. Neurochemical research. 2016;41:130–143. doi: 10.1007/s11064-015-1747-2. [DOI] [PubMed] [Google Scholar]
- 52.Leuze C, et al. The separate effects of lipids and proteins on brain MRI contrast revealed through tissue clearing. Neuroimage. 2017;156:412–422. doi: 10.1016/j.neuroimage.2017.04.021. [DOI] [PMC free article] [PubMed] [Google Scholar]
Associated Data
This section collects any data citations, data availability statements, or supplementary materials included in this article.
Supplementary Materials
Supplementary Information for: Dipolar induced spin-lattice relaxation in the myelin sheath: A molecular dynamics study
Data Availability Statement
The simulation files to generate the MD data are available from the corresponding author on request.