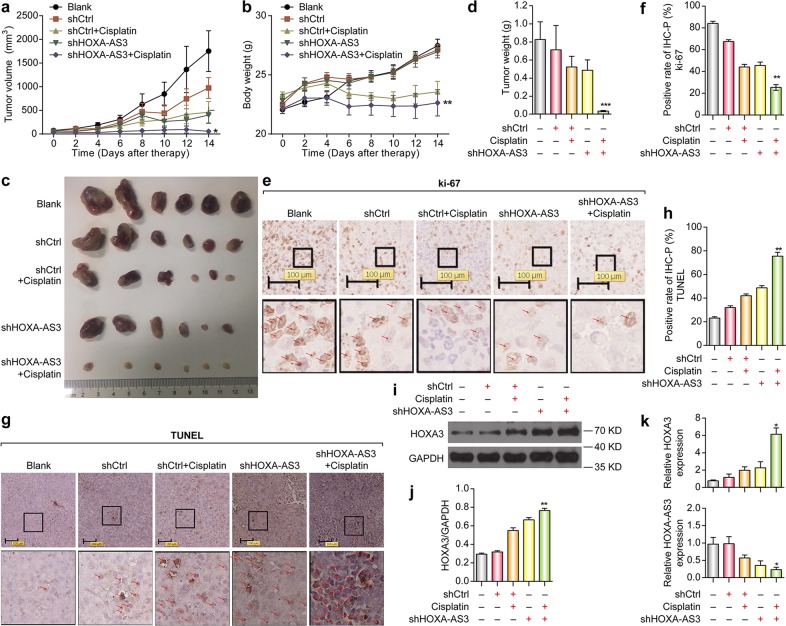
Fig. 7. Antitumor effects of HOXA-AS3 inhibition on tumor xenograft mice.
a Growth curve of tumor volumes and b Growth curve of body weight calculated every 2 days after inoculation. c Tumor size after the tumors was harvested. d Tumor weight after the tumors was harvested. e–f Representative images of immunohistochemical detection of the proliferation index Ki-67 in vivo. g, h Representative images of immunohistochemical detection of the apoptosis index TUNEL in vivo. i, j Western blotting detection of HOXA3 in vivo. k qPCR detection of the mRNA expression levels of HOXA3 and HOXA-AS3 in vivo. (* vs cisplatin, *p < 0.05, **p < 0.01, ***p < 0.001)

