

Abstract
After injury, the CNS undergoes an astrocyte stress response characterized by reactive astrocytosis/proliferation, boundary formation, and increased glial fibrillary acidic protein (GFAP) and chondroitin sulfate proteoglycan (CSPG) expression. Previously, we showed that in vitro astrocytes exhibit this stress response when in contact with Schwann cells but not olfactory ensheathing cells (OECs). In this study, we confirm this finding in vivo by demonstrating that astrocytes mingle with OECs but not Schwann cells after injection into normal spinal cord. We show that Schwann cell-conditioned media (SCM) induces proliferation in monocultures of astrocytes and increases CSPG expression in a fibroblast growth factor receptor 1 (FGFR1)-independent manner. However, SCM added to OEC/astrocyte cocultures induces reactive astrocytosis and boundary formation, which, although sensitive to FGFR1 inhibition, was not induced by FGF2 alone. Addition of heparin to OEC/astrocyte cultures induces boundary formation, whereas heparinase or chlorate treatment of Schwann cell/astrocyte cultures reduces it, suggesting that heparan sulfate proteoglycans (HSPGs) are modulating this activity. In vivo, FGF2 and FGFR1 immunoreactivity was increased over grafted OECs and Schwann cells compared with the surrounding tissue, and HSPG immunoreactivity is increased over reactive astrocytes bordering the Schwann cell graft. These data suggest that components of the astrocyte stress response, including boundary formation, astrocyte hypertrophy, and GFAP expression, are mediated by an FGF family member, whereas proliferation and CSPG expression are not. Furthermore, after cell transplantation, HSPGs may be important for mediating the stress response in astrocytes via FGF2. Identification of factors secreted by Schwann cells that induce this negative response in astrocytes would further our ability to manipulate the inhibitory environment induced after injury to promote regeneration.
Keywords: glia, reactive astrocytes, FGF2, heparin, rat, Schwann cell
Introduction
After CNS injury, a series of cellular and molecular events develop over several days, culminating in the formation of a glial scar. Many cell types contribute to this scar, but astrocytes predominate (Fawcett and Asher, 1999). These astrocytes become activated in response to injury and undergo numerous cytological and biochemical changes ranging from increased synthesis of glial fibrillary acidic protein (GFAP), chondroitin sulfate proteoglycans (CSPGs), growth factors, and enzymes to increase proliferation (Eng et al., 1994; Norenberg, 1994; McKeon et al., 1999). Their most dramatic response is seen in the formation of the glial scar accompanied by extensive hypertrophy of their cell body and cytoplasmic processes. The formation of this scar is thought to isolate areas of tissue necrosis and exclude non-neural cells from the CNS parenchyma filling the tissue cavity resulting from injury (Eddleston and Mucke, 1993). In the context of CNS injury, this astrocytic response also prevents axonal regeneration (Silver and Miller, 2004; Pekny and Nilsson, 2005). The search for the initial molecular inducer of inhibitory astrocytosis/gliosis is ongoing.
In this context, the relative merits of two types of candidate transplant cells, Schwann cells (SCs) and olfactory ensheathing cells (OECs), require evaluation regarding their capacity to induce the astrocyte stress response. Both OECs and Schwann cells have been widely advocated for transplant-mediated repair of CNS lesions (Doucette, 1995; Franklin and Barnett, 2000; Raisman, 2001; Chuah and West, 2002; Wewetzer et al., 2002; Barnett and Chang, 2004; Ruitenberg et al., 2006). Although it is apparent that both cell types offer advantages for promoting repair (Xu et al., 1995; Li et al., 1997; Ramon-Cueto et al., 1998; Pearse et al., 2004a), there is much debate as to which is the preferred candidate (Takami et al., 2002; Garcia-Alias et al., 2004; Pearse et al., 2004b; Barnett and Riddell, 2004; Riddell et al., 2004).
OECs and Schwann cells have many similarities, sharing common growth factor responses (Dong et al., 1997; Pollock et al., 1999), antigenic and morphological characteristics (Ramon-Cueto and Valverde, 1995; Franceschini and Barnett, 1996), and transcriptional regulation (Smith et al., 2001). However, a distinct difference between OECs and Schwann cells is their contrasting ability to induce the reactive astrocyte response in vitro (Lakatos et al., 2000; Fairless et al., 2005) and in vivo (Plant et al., 2001; Lakatos et al., 2003). In previous studies, using assays devised to observe the inhibitory interactions between Schwann cells and astrocytes (Ghirnikar and Eng, 1994; Wilby et al., 1999), we demonstrated that Schwann cells and astrocytes occupied distinct, nonoverlapping areas in coculture, termed boundary formation (Lakatos et al., 2000). Furthermore, astrocytes in contact with Schwann cells became hypertrophic with an increase in cytoplasmic area and increased expression of both GFAP and CSPG (Wu et al., 1998; Lakatos et al., 2000). In contrast, OECs and astrocytes frequently intermingled in the same area and did not induce astrocyte hypertrophy.
The mechanisms underlying these differences are not known. Here, we show that the reactive astrocyte phenotype can be induced by OECs if factor(s) secreted by Schwann cells are introduced. Our data suggest that this factor is likely to belong to the fibroblast growth factor (FGF) family, because inhibition of FGF receptor 1 (FGFR1) promoted cell mingling in OECs/astrocyte cultures treated with Schwann cell-conditioned media (SCM). Furthermore, OECs cannot activate astrocytes by FGF2 unless heparin is added, and Schwann cell/astrocyte cultures can be induced to mingle if treated with heparinase or chlorate. This suggests that heparan sulfate proteoglycans (HSPGs) are necessary for this aspect of the stress response. Injections of green fluorescent protein (GFP)-expressing OECs and Schwann cells into the normal spinal cord show similar differences in their ability to coexist with astrocytes. In addition, increased levels of HSPG were detected in astrocyte processes bordering the Schwann cell graft, supporting the physiological relevance of the observations made in vitro. These results add to the accumulating data that OECs are distinct from Schwann cells and may have advantages over them for transplant-mediated repair of CNS injury because their HSPG profile induces a less-severe astrocyte stress response.
Materials and Methods
Generation of purified glial cells.
Astrocytes, OECs, and Schwann cells were purified as described previously (Lakatos et al., 2000) and maintained on poly-l-lysine (PLL; 13.3 μg/ml; Sigma-Aldrich, Dorset, UK)-coated flasks. Astrocytes were maintained in DMEM containing 10% fetal bovine serum (FBS) (DMEM-FBS; Autogen Bioclear, Wiltshire, UK). Fluorescence-activated cell sorting (FACS)-purified OECs were cultured in serum-free modified DMEM (DMEM-BS) (Bottenstein et al., 1979; Barnett et al., 1993) with 5% FBS and further supplemented with FGF2 (500 ng/ml; Peprotech, London, UK), heregulin β-1 (Hrgβ1; 50 ng/ml; R&D Systems, Abingdon, UK), forskolin (5 × 10⁻⁷ m; Sigma-Aldrich), and astrocyte conditioned medium (ACM) (Noble and Murray, 1984), which has been shown to be a potent mitogen for promoting prolonged growth of p75 neurotrophin receptor (p75NTR)-expressing OECs (Alexander et al., 2002). Schwann cells were maintained in DMEM-FBS containing forskolin (10−6 m) and Hrgβ1 (20 ng/ml; R&D Systems).
Confrontation assay.
This assay was performed as described by Wilby et al. (1999) and Lakatos et al. (2000). Briefly, 10 μl strips containing 10,000 cells of either OECs or Schwann cells were set up opposing a parallel 10 μl strip containing 10,000 astrocytes on a PLL-coated coverslip. Cells were allowed to attach for 1 h before washing in DMEM-FBS to remove nonattached cells. Cultures were then maintained in DMEM-FBS and allowed to grow toward each other over a period of 12–14 d, giving time for cells to make contact and interact (Lakatos et al., 2000). In some experiments, growth factor receptor inhibitors, heparin, chlorate, or heparinase were added to the cultures after the cells had contacted each other. Cultures were then immunolabeled for astrocytes using anti-GFAP [anti-rabbit (Dako, Ely, UK) or anti-mouse IgG1 (Sigma-Aldrich)] and for OECs and Schwann cells using anti-p75NTR [1:1; IgG1; hybridoma supernatant (Yan and Johnson, 1988) or anti-rabbit (Abcam, Cambridge, UK)]. Using NIH Image J, a 300 μm line was drawn along the interface between astrocytes and either OECs or Schwann cells (see Fig. 1Aiii,Aiv). The numbers of OECs or Schwann cells crossing the cell:cell boundary were counted and averaged over five randomly chosen fields. Fields are variable, and strong boundaries are not always seen if the two cell populations have not met in the allotted time. However, in general we see many areas in which clear boundaries are made in astrocyte/Schwann cell cultures. Experiments were repeated at least three times.
Figure 1.
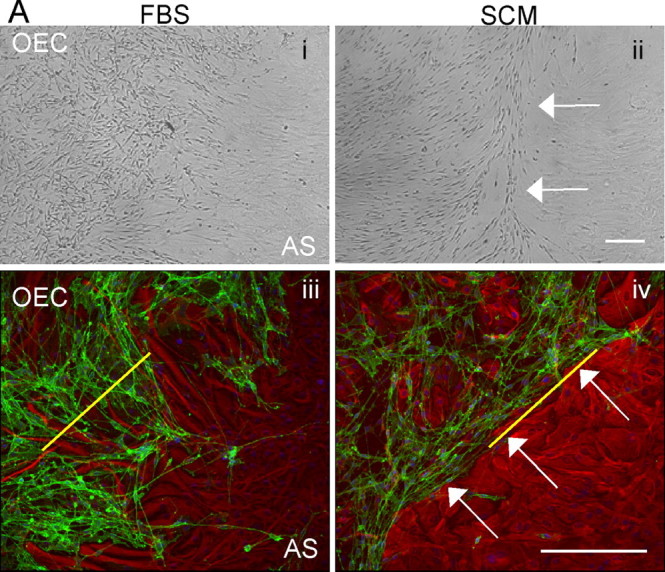
SCM induces boundary formation in OEC/astrocyte confrontation assays. Confrontation assays between astrocytes and OECs were set up in DMEM-FBS (FBS; Ai, Aiii), and between day 10–14 experimental cultures were switched to DMEM-FBS containing 50% SCM (Aii, Aiv). After 2 d, clear boundaries could be seen between astrocytes (AS) and OECs after SCM addition (white arrows). Ai, Aii, Phase image. Aiii, Aiv, Immunocytochemistry with p75NTR (OECs; green) and GFAP (astrocytes; red). The yellow line illustrates a typical 300 μm line drawn to quantify the number of cells that cross the boundary between the astrocytes and either OECs (Aiii) or Schwann cells. OECs or Schwann cells would be counted below the line. Scale bars, 200 μm.
Coculture assay.
In some cases, cocultures were used when measurements were made of astrocyte area and GFAP expression or larger contact areas were needed for Western blot analysis. Astrocyte:OEC and astrocyte:Schwann cell cocultures were performed by mixing either OECs or Schwann cells with astrocytes at a ratio of 3:1. Primary cultures were generally maintained for 2–6 weeks before setting up the assays. Cells were mixed in suspension at a total cell number of 4 × 10³ per well and then added to PLL-coated coverslips in 24-well plates containing 500 μl of DMEM-FBS. Alternatively, for creating cell lysates, a total cell number of 1.6 × 10⁴ was added to each well of a six-well plate, containing 2 ml of DMEM-FBS. These cultures were maintained for 14 d [for hypertrophy analysis, by which time an astrocytic response had occurred (Eng and Ghirnikar, 1994; Lakatos et al., 2000)]. After this time, cultures grown on coverslips in 24 wells were fixed and immunolabeled, and cultures grown in 6-well plates were lysed for immunoblotting.
Collection of SCM, OEC-conditioned medium, and ACM.
When cultures of purified Schwann cells or OECs in T25 (cm2) flasks were confluent (maintained in vitro for 2–6 weeks), they were rinsed twice with PBS and 4 ml of DMEM-BS without growth factors added. Cultures were maintained for an additional 2 d before medium collection, which was centrifuged to remove cell debris, and filtrated through a 0.2 μm filter (Millipore, Hertfordshire, UK). Exactly the same procedure was used for generating ACM, apart from confluent astrocyte cultures were maintained in T75 (cm2) flasks, to which 10 ml of DMEM-BS was added. SCM and OEC-conditioned medium (OCM) were added to cell cultures at a 1:1 ratio with DMEM-FBS, except for proliferation studies, in which media were titrated with DMEM-BS.
Treatment of confrontation assays by SCM, heparin, heparinase, or chlorate.
Confrontation assays were set up as described above until the cells were in contact. In OEC/astrocyte cultures, the medium was replaced with SCM/DMEM-FBS (1:2) or with DMEM-FBS containing 10 μg/ml heparin (Sigma-Aldrich). In Schwann cell/astrocyte cultures, 5 mm chlorate [Sigma-Aldrich; dissolved in RPMI (Roswell Park Memorial Institute) medium containing 10% FBS (Invitrogen, Paisley, UK)] or 5 U/ml heparinases I, II, and III (Sigma-Aldrich) were added. Both cultures were treated for 2 d, and heparin and heparinase were reapplied every day and then immunolabeled as described above.
Digestion of SCM.
SCM was digested to assess whether its activity was proteinaceous in nature. SCM (2 ml) was incubated with 100 μl of trypsin-agarose bead suspension (50:50 suspension beads to PBS; 2.5 U; Sigma-Aldrich) left to digest for 24 h at 37°C on a rotating platform and then collected after centrifugation. The digested SCM was then filtered through a 0.22 μm syringe filter (Millipore) and tested in the various assays.
Inhibitor treatment.
Inhibitors of various tyrosine receptor kinases and an inhibitor of the nonreceptor tyrosine kinase Src were added to the confrontation assays. These include epidermal growth factor receptor (EGFR; AG1478; 300 nm; Merck Biosciences, Nottingham, UK), platelet-derived growth factor receptor [PDGFR; 6,7-dimethyl-2-phenyl-quinoxaline (AG1295); 10 μm; Merck Biosciences], FGFR1 (3-[3-(2-carboxyethyl)-4-methylpyrrol-2-methylidenyl]-2-indolinone (SU5402); 10 μm; Merck Biosciences), and the Src inhibitor (SU6656; 10 μm; Merck Biosciences). The EGFR inhibitor [4-(3-chloroanilino)-6,7-dimethoxyquinazoline] is a very potent and selective inhibitor of epidermal growth factor receptor kinase (Liu et al., 1999). The PDGFR inhibitor selectively inhibits PDGF receptor kinase (Kovalenko et al., 1994). The FGFR inhibitor selectively inhibits the tyrosine kinase activity of FGFR1 with little cross-reactivity to PDGFR or EGFR (Mohammadi et al., 1997). SU6656, a Src family kinase inhibitor, inhibits Src as well as closely related kinases such as Fyn, Yes, and Lyn. It acts as a weak inhibitor of Lck and PDGF receptor kinase (Blake et al., 2000). Controls included DMEM-FBS and SCM without the addition of inhibitors. Inhibitors were added to the cells at the same time as SCM, which was on day 10 of coculture between the various glial cells. After 2 d, cultures were immunolabeled with antibodies to GFAP (astrocytes) and p75NTR (OECs).
ELISA assay for FGF2.
An ELISA assay was performed using conditioned medium prepared by omitting bovine serum albumin from the DMEM-BS mix, which was incubated on confluent cultures of astrocytes (ACM), OECs (OCM), and Schwann cells (SCM) for 48 h. FGF2 levels were estimated using a commercial ELISA kit (the Quantikine HS Immunoassay kit; R&D Systems) following the manufacturer's instructions. The assay was repeated three times with different sources of conditioned medium.
Expression of mRNA for FGF receptors.
To check for the presence of all four FGFR mRNAs in astrocytes, OEC and Schwann cell reverse transcription (RT)-PCR was carried out. Briefly, RNA was prepared from the three cell types using RNA-Bee isolation reagent (AMS Biotechnology, Oxon, UK) and chloroform following the manufacturer's protocol. The RNA was precipitated with isopropanol and resuspended in water. Primers for FGFR1–FGFR4 (Table 1) were synthesized by Sigma-Genosys or MWG Biotech (London, UK) resuspended in water and used at 0.1 μg/μl. For the reverse transcription, a master mix containing random primers (250 ng/μl), RNA (2 μg), and dNTP (10 mm; Invitrogen) was incubated at 65°C for 5 min quenched on ice and spun briefly. A second master mix containing 5× first strand buffer (Invitrogen), DTT (0.1 m; Invitrogen), and RNase Out (40 U; Invitrogen) was added, and the samples were incubated at 25°C for 2 min. After the addition of SuperScript II reverse transcriptase (200 U; Invitrogen), the samples were incubated at 25°C for 10 min and at 42°C for 50 min. The reaction was terminated at 70°C for 15 min. The cDNAs were amplified using primers for each FGFR isoform. Rat brain cDNAs and cyclophilin were used as controls. The PCR was performed using two protocols. The first, for FGFR1IIIc, FGFR2IIIC, and FGFR3IIIC, was set at 94°C for 3 min, 30 cycles of 94°C for 30 s, 54°C for 30 s, 72°C for 30 s, and 72°C for 5 min (Kirby et al., 2003). The second protocol, for FGFR1IIIB, FGFR2IIIB, FGFR3IIIB, and FGFR4, was identical apart from an annealing temperature of 58°C.
Table 1.
Primer pairs used for PCR amplification
| Receptor | Forward primer | Reverse primer |
|---|---|---|
| FGFR1IIIB | 5′-CTC GGA TGC GGA GGT GCT GA-3′ | 5′-GCA CAG GTC TGG TGA CAG TGA-3′ |
| FGFR1IIIC | 5′-GGT GCT TCA TCT ACG GAA TGT CTC C-3′ | 5′-TCA GAG ACG CCA GCT AGC ATG G-3′ |
| FGFR2IIIB | 5′-CCA GGA TGG ACC CCT CTA TGT CA-3′ | 5′-TGC AGT TGG TGG GCT TGT CCA-3′ |
| FGFR2IIIC | 5′-GGA ATG TAA CTT TTG AGG ACG CTG G-3′ | 5′-GAT GTC TCC CGT TGA GGA AAG ACG-3′ |
| FGFR3IIIB | 5′-GAT CAG TGA GAA TGT GGA GGC AGA-3′ | 5′-TTG GGG CCC GTG AAC ACG AA-3′ |
| FGFR3IIIC | 5′-ACA CCA CCG ACA GGG AGC TAG AGG-3′ | 5′-CTT GTC GAT GTT CTT GTG TCT TCC G-3′ |
| FGFR4 | 5′-AGC TAT CTG CTG GAT GTG CTG GA-3′ | 5′-TTC TGT ACA GTG ACA GGC TGT CGA-3′ |
The FGFRB series primers were designed using GeneFischer interactive primer design program. The FGFRC primer sequences were taken from the literature (Kirby et al., 2003).
Adhesion assay.
Cells were labeled with Vybrant [Vybrant CFDA SE (carboxyfluorescein diacetate, succinimidyl ester) Cell Tracer Kit; Invitrogen] by incubating with Vybrant diluted in PBS (1:500) for 15 min, followed by washing in 1% DMEM-BS. Labeled cells (20,000 Schwann cells or OECs) were then plated onto PLL-coated coverslips previously grown to confluency as a monolayer of astrocytes. After 30 min at 37°C with gentle shaking, coverslips were removed, washed three times in Hanks staining medium (Invitrogen) and then fixed in 3.7% formaldehyde for 10 min. The number of Vybrant-labeled cells remaining adhered to the coverslip was then counted. All experiments were performed in duplicate and performed thrice.
Time-lapse video microscopy.
Speeds of migrating cells were measured using time-lapse microscopy. OECs or Schwann cells were plated at a low density (10,000 per coverslip) on either PLL-coated coverslips or coverslips containing confluent astrocyte monolayers and left to adhere overnight. Images were then taken every 20 min for 3 h using the Open Lab Time-lapse Video Microscopy System. Distances moved by individual cells were measured and averaged over approximately five cells per experiment. Experiments were performed in duplicate and performed thrice.
Antibodies.
For FACS purification, hybridoma supernatants were used against O4 (IgM) (Sommer and Schachner, 1981) and GalC (IgG3) (Ranscht et al., 1982) at a dilution of 1:1.
For immunocytochemistry, hybridoma supernatants were used against p75NTR (IgG1) (Yan and Johnson, 1988) at a dilution of 1:1. Both hybridoma supernatants were collected from a confluent monolayer of the hybridoma cells. The following primary antibodies were also used, anti-GFAP [anti-rabbit (Dako); anti-mouse IgG1 (Sigma-Aldrich)] at 1:100, anti-p75NTR (anti-rabbit; Abcam), anti-bromodeoxyuridine (BrdU; IgG1; Dako) at 1:20, and anti-neurocan (IG2; IgG) (Oohira et al., 1994) at 1:20. In addition, the pan anti-CSPGs, CS-56 (Sigma-Aldrich; IgM) at 1:100, and 473HD, which recognizes the DSD-1 epitope embedded in the CS side chains (IgM) (Faissner et al., 1994) at 1:25, were used. Class-specific fluorophore-conjugated antibodies were diluted 1:100 (Southern Biotechniques; Cambridge Bioscience, Cambridge, UK).
For immunoblotting, the following antibodies were used: anti-vinculin (IgG; BD Biosciences, San Jose, CA) at 1:1000, anti-GFAP (IgG1; Sigma-Aldrich) at 1:1000, and anti-neurocan (IG2 antibody; IgG) at 1:2. Secondary antibodies were HRP conjugated (anti-mouse; IgG; Jackson ImmunoResearch, Suffolk, UK) and used at 1:7000.
Immunocytochemistry for in vitro studies.
Immunocytochemistry was performed on cells plated on PLL-coated coverslips as described previously (Franceschini and Barnett, 1996; Lakatos et al., 2000). Cells were fixed in 3.7% formaldehyde for 10 min at room temperature and then washed in PBS. Permeabilization was performed using 0.5% Triton X-100/1% BSA in PBS for 15 min at room temperature. After additional washes in PBS, cells were blocked in 10% FBS in PBS for 30 min at room temperature. Antibody dilutions were made (as above) in 10% FBS in PBS and applied for 60 min. After washing with PBS/0.025% Tween 20 (PT), secondary antibodies were added for 45 min, followed by a final wash and mounting in Vectashield (Vector Laboratories, Peterborough, UK) supplemented with 4′,6′-diaminidino-2-phenylindole (DAPI; Sigma-Aldrich). In some experiments for GFAP immunocytochemistry, cells were fixed with methanol at −20°C for 15 min before antibody incubation. Images were visualized using an Axioskop fluorescent microscope (Zeiss, Thornwood, NY) and collected using MetaMorph with a monochrome camera (Princeton Instruments, Trenton, NJ).
BrdU uptake.
Cell proliferation was assayed by measuring the incorporation of BrdU (Roche Diagnostics, Mannheim, Germany) during the S phase of the cell cycle, as described previously (Pollock et al., 1999). Astrocytes were seeded at low density onto PLL-coated coverslips and left to adhere overnight. Cells were then treated with SCM dilutions or control medium for 12 h before the addition of 20 μm BrdU, to label dividing cells, and incubated for an additional 16 h. After this time, cells were fixed in 100% methanol (−20°C for 10 min), before 1 min incubation in 0.2% paraformaldehyde at room temperature, followed by 7 min of incubation at room temperature in 0.07 m NaOH. Fixed cells were directly immunolabeled with anti-BrdU antibody for 40 min, followed by the secondary IgG1-FITC (1:100) for 30 min. The percentage of BrdU-positive cells was calculated by counting ∼200 DAPI-labeled nuclei at three random sites. Experiments were performed thrice.
Immunoblotting.
Whole cell lysates were prepared using ice-cold lysis buffer (50 mm HEPES, pH 7.5, 150 mm NaCl, 1 mm EDTA, 2.5 mm EGTA, 1 mm DTT, 0.1% Tween 20, and 10% glycerol) with inhibitors (1 mm Na-fluoride, 10 μg/ml leupeptin, 20 U/μl aprotinin, 10 mm glycerophosphate, 0.1 mm Na-orthovanadate, and 0.1 mm phenylmethylsulfonyl fluoride; Sigma-Aldrich). The lysates were sonicated and spun at 12,000 rpm for 10 min at 4°C, and protein levels of the supernatants were estimated using a bicinchoninic acid assay (Sigma-Aldrich). Fifteen micrograms of proteins were electrophoresed through a 10% SDS-containing polyacrylamide gel and blotted onto a 0.45 mm pore-size nitrocellulose membrane (Millipore) The membrane was incubated in blocking buffer (PT containing 5% milk powder) for 1 h at room temperature, followed by three washes in PT. All primary antibodies were diluted accordingly (see above) in blocking buffer and incubated overnight at 4°C. After washing three times for 5 min in PT, the blots were incubated with the appropriate HRP-conjugated secondary antibody for 30 min at room temperature (1:7000). Blots were visualized using the enhanced chemiluminescence (ECL) detection system (GE Healthcare, Little Chalfont, UK).
Protein extracts for immunoblotting with antibodies against the CSPGs were pretreated with chondroitinase (Sigma) to remove GAG chains, which can smear the blotting profile (McKeon et al., 1999; Asher et al., 2000). Chondroitinase (0.2 U) was diluted 1:10 with chondroitinase-activating buffer (50 mm Tris, pH 8.0, 60 mm sodium acetate, and 0.2% bovine serum albumin) from which 0.02 U/ml was added to protein extracts, before incubation at 37°C for 3 h.
Assessment of cellular interactions in vivo.
Purified OECs and Schwann cells were generated from 7-d-old Fischer rat pups for transplantation into adult Fischer rats. The cells were marked with the reporter gene GFP by lentiviral infection. Cells were >90% GFP positive. Confluent 25 cm3 flasks of both cells were trypsinized and spun, and a cell slurry was generated to contain between 5 × 10⁵ and 1 × 10⁶ cells in 20 μl. Three Fischer adult rats were injected with GFP-expressing OECs and/or GFP-expressing Schwann cells into the normal spinal cord. Animals were anesthetized with halothane, and the fourth lumbar spinal segment was exposed by laminectomy at the T13/L1 vertebral junction. OECs and Schwann cells were injected at the same rostrocaudal location but on opposite sides of the spinal cord, such that the two cell types were transplanted within the same transverse plane. These sites were located just lateral to the surface central vein on the left and right sides of the cord and at an angle of 25° (pipette tip pointing medially). Pipettes were filled with ∼1 μl of a concentrated cell suspension (∼100,000 cells/μl) and inserted into the dorsal columns at parallel sites. Cells were pressure injected through beveled glass pipettes (inner tip diameter, 60–70 μm). Wounds were closed in layers, and an analgesic was routinely administered (Vetergesic; 0.06 mg, s.c.; Alstoe, York, UK).
Histological processing.
After a survival period of 10 d, animals were deeply anesthetized with intraperitoneal sodium pentobarbital (Euthatal; 200 mg/ml; Vericore, Dundee, UK) and perfused through the left ventricle with mammalian Ringer's solution (containing 0.1% lidocaine) followed by freshly depolymerized 4% paraformaldehyde in 0.1 m phosphate buffer, pH 7.4. A block of tissue encompassing the injection sites was removed and postfixed overnight in the same fixative with 30% sucrose. Transverse sections (70 μm) through the injection sites were cut on a freezing microtome and incubated free-floating for 30 min in 50% ethanol and then washed for 10 min in 0.3 m PBS. Sections were then incubated for 72 h at 4°C in combinations of the following primary antibodies: sheep anti-GFP (1:1000; Biogenesis, Kingston, NH), mouse anti-GFAP (1:1000; Sigma-Aldrich), rabbit anti-GFAP (1:1000; Dako), mouse anti-heparan sulfate 10E4 (1:1000; Seikagaku, Tokyo, Japan), rabbit anti-FGF-2 (1:100; Millipore), and rabbit anti-FGFR1 (1:200; Santa Cruz Biotechnology, Santa Cruz, CA). Sections were subsequently incubated in fluorophore-conjugated species-specific donkey IgG secondary antibodies (or IgM for anti-HSPG) for 4 h at room temperature. All antibodies were diluted in PBS with 0.3% Triton X-100. Sections were mounted onto plain glass slides using Vectashield (Vector Laboratories) and stored at −20°C.
Epifluorescence and confocal microscopy.
Sections were initially examined at low power using a Nikon (Tokyo, Japan) Eclipse E600 epifluorescence microscope, and sections containing GFP-expressing cells were examined further using either a Bio-Rad (Hercules, CA) MRC1024 or Radiance 2100 confocal system. Three-channel serial scans were made through the full thickness of the stained tissue at low (10× or 20×; 2 μm steps) and high (40× oil immersion; 0.5 μm steps) powers. Image stacks of each fluorescence channel were projected using Confocal Assistant software (Todd Clark Brelje, University of Minnesota, Minneapolis, MN) and exported to Adobe Photoshop CS2 version 9.0 (Adobe Systems, San Jose, CA) for processing for illustration.
Results
SCM induces boundary formation in OEC/astrocyte confrontation assays
Confrontation assays are commonly used to demonstrate that Schwann cells are less able than OECs to mingle with astrocytes and induce characteristics of hypertrophy (Wilby et al., 1999; Lakatos et al., 2000; Grimpe et al., 2005; Fairless et al., 2005). Astrocytic hypertrophy is only induced when in contact with Schwann cells. Here, we confirm that OECs are able to migrate within astrocytic areas (Fig. 1Ai,Aiii). However, when SCM (diluted 1:1 with DMEM-FBS) was added to confrontation assays of OECs and astrocytes 10 d after initial plating and left for an additional 2 d, distinct boundaries formed at the interface between OECs and astrocytes (Fig. 1Aii,Aiv, arrows), as seen in Schwann cell and astrocyte confrontation assays (Wilby et al., 1999; Lakatos et al., 2000; Fairless et al., 2005). As seen for Schwann cell/astrocyte confrontation assays, astrocytic hypertrophy only occurs in astrocytes that are in contact with OECs in the presence of SCM.
SCM and OEC contact with astrocytes is necessary for the induction of astrocyte hypertrophy as assessed by an increase in astrocyte area and GFAP expression
To assess whether astrocytes require contact with OECs or Schwann cells for the induction of astrocytic hypertrophy, we compared the effect of adding SCM and OCM (diluted 1:1 with DMEM-FBS) to either astrocytes cultured alone (DMEM-FBS) or cocultured with OECs or Schwann cells as described previously (Lakatos et al., 2000; Fairless et al., 2005). Astrocyte hypertrophy was assessed by measuring changes in astrocyte area using NIH Image and GFAP expression by immunoblotting. In this way, cultures were incubated with DMEM-FBS, SCM, or a 1:1 mixture of SCM and OCM (SCM+OCM) for 2 d before immunolabeling for GFAP (astrocytes) or p75NTR (OECs or Schwann cells) (Fig. 2A,B) or immunoblotting for GFAP (Fig. 2C,D).
Figure 2.

Both SCM and OEC contact are required for induction of astrocytic hypertrophy as assessed by astrocyte area and GFAP immunoreactivity. A, Cultures were generated of astrocyte monolayers alone (control; Ai, Aiv), astrocytes in confrontation assays with OECs with (Av) or without the addition of SCM (Aii) or SCM and OCM (Avi) or in confrontation assay with Schwann cells as a positive control (Aiii). The effect of the various culture conditions on astrocytic area was assessed by immunocytochemistry [astrocytes, GFAP (red); OECs or Schwann cells, p75NTR (green)]. Hypertrophic astrocytes are indicated with a white asterisk. Scale bar, 100 μm. B), Quantification of astrocytic area was performed using NIH Image analysis. *p < 0.001. Error bars represent SEM. C, Western blot showing GFAP expression after treatment of astrocytes. Treatments included astrocytes cultured in FBS (control with no additions), cocultured with OECs, SCs, 50% SCM, and OECs with 50% SCM treatment (OECs+SCM). Vinculin was used as a protein loading control. D, Densitometry of GFAP expression, relative to vinculin. GFAP was upregulated in Schwann cell:astrocyte cocultures and in OEC:astrocyte cocultures only after treatment with SCM. AS, Astrocytes.
Astrocyte area and GFAP expression did not change in astrocyte cultures treated with SCM (Fig. 2Aiv; C, lane 4). However, if SCM was added to cocultures of astrocytes with OECs, astrocyte area increased from 2495 ± 218 to 5438 ± 615 μm2 (p < 0.001) (Fig. 2Av) and GFAP expression increased twofold (Fig. 2C, lane 5). In these experiments, astrocyte/Schwann cell cocultures were used as a positive control (Fig. 2Aiii; C, lane 3). It is possible that OECs cocultured with astrocytes could also secrete factors that synergized with SCM to induce astrocyte hypertrophy. For this reason, astrocyte cultures were treated with both SCM and OCM. Similar to the single factors, combining SCM and OCM did not have any effect on astrocyte area (Fig. 2Avi; B, lane 6). These results suggest that induction of hypertrophy in astrocytes as assessed by an increase in astrocyte area and GFAP expression requires both SCM and OEC contact.
SCM did not affect cellular adhesion or migration of OECs and Schwann cells to astrocyte monolayers
To ensure that SCM did not affect boundary formation by altering the migration and adhesion properties of OECs or Schwann cells, we performed time-lapse studies and adhesion assays. Confluent astrocyte cultures were maintained in DMEM-FBS and then switched to test conditions for 2 d (e.g., SCM or OCM), after which migration and adhesion assays were performed (Fig. 3). Vybrant-labeled OECs and Schwann cells were allowed to adhere to control and SCM-treated astrocyte monolayers overnight, after which their migration speeds were measured using time-lapse microscopy. As has been reported previously (Fairless et al., 2005), Schwann cells migrated at slower speeds than OECs on astrocyte monolayers (Fig. 3A), demonstrating astrocyte-induced impairment of Schwann cell migration, compared with OECs. The treatment of astrocyte monolayers with SCM did not affect the migration ability of either Schwann cells or OECs. Similar comparisons were made using adhesion assays in which Vybrant-labeled cells were allowed to adhere to astrocyte monolayers previously treated for 2 d with DMEM-FBS, SCM, or OCM, while on a shaking platform. The number of cells that adhered after 30 min to the astrocyte monolayers was quantified. The addition of SCM and OCM to astrocyte monolayers did not significantly affect the ability of either OECs or Schwann cells to adhere to astrocytes (Fig. 3B).
Figure 3.

Treatment of astrocyte monolayers with SCM does not affect SC or OEC migration and adhesion but is mitogenic for astrocytes. A, Migration was measured using time-lapse microscopy and the average migration speed was calculated [SC, 11.14 ± 2.8 μm/h (n = 8); SC+SCM, 12.15 ± 2.4 (n = 11); OEC, 20.1 ± 1.7 (n = 16); OEC+SCM, 17.9 ± 2.2 (n = 12)]. As reported previously, Schwann cell migration was significantly slower on astrocyte monolayers than OEC migration. After SCM treatment, there was no change in the observed migration speeds of either OECs or Schwann cells on astrocytes. B, An adhesion assay was performed using Vybrant-labeled cells to aid detection, which were left to adhere to confluent monolayers of either astrocytes or OECs/Schwann cells for 30 min. Both OEC and Schwann cell adhesion was similar after SCM or OCM treatment. C, BrdU incorporation was assessed by indirect immunofluorescence after treatment with DMEM-BS H/F (control growth media) and compared with the BrdU uptake seen after SCM and OCM treatment. SCM induced a significant increase in BrdU uptake (*p < 0.001). D, SCM was titrated in DMEM-BS H/F (1:50, 1:10, 1:5, and 1:1), and BrdU incorporation into astrocytes was measured. SCM could be titrated to a plateau in which ∼40% of the cells took up BrdU after 16 h of incubation. Cont, Control. *p < 0.001. Experiments were performed three times in duplicate. Error bars represent SEM.
These data demonstrate that SCM treatment of astrocytes does not affect the migration and adhesion characteristics of OECs and Schwann cells, suggesting that there was not a trivial reason for the boundary formation in the coculture and confrontation assays. However, SCM treatment of astrocytes stimulated their proliferation. Astrocyte proliferation in the presence of SCM was measured by uptake of BrdU using indirect immunofluorescence 16 h after preincubation with 20 μm BrdU. Optimal SCM dilutions were estimated using a concentration–response assay in which SCM was titrated from 1:50 to 1:1 SCM:DMEM-BS H/F (serum-free DMEM-BS supplemented with heregulin and forskolin) (Fig. 3C). A significant proliferative response could be detected when SCM was diluted at 1:10 and had reached a plateau by 1:5. Proliferation was also compared for astrocytes incubated in OCM, which were diluted 1:1 with DMEM-BS. DMEM-BS H/F was used as control media because this is the media used to collect the conditioned media and allowed proliferation changes to be measured without being masked by the overriding effect of serum. Under these conditions, astrocyte proliferation was unaffected by addition of OCM but was increased 2.5-fold by SCM (p < 0.001), with the percentage of cells taking up BrdU increasing from 10.2 ± 0.8% to 24.9 ± 3.1% (Fig. 3D).
The activity in SCM is trypsin sensitive
To determine whether the factor in SCM (collected in serum-free medium) was a protein, SCM was subjected to trypsin digestion, and the extent of proteolysis was assessed by SDS-PAGE (Fig. 4A). Although this unknown factor in SCM could not be identified on the gel, we were able to confirm that the trypsin digestion had worked by comparing brilliant blue G-colloidal staining of a more prominent 64 kDa protein, identified as transferrin (confirmed by mass spectrometry). After trypsin treatment, the intensity of the transferrin band was significantly reduced, producing a fragment of lower molecular weight. The biological activity of the digested SCM compared with undigested SCM in OEC/astrocyte confrontation assays was reduced, confirming that a trypsin-sensitive component of SCM is responsible for the promotion of boundary formation (Fig. 4C). Furthermore, trypsin treatment of SCM reduced its ability to promote astrocyte proliferation (Fig. 4B).
Figure 4.

The activity in SCM is trypsin sensitive. A, SDS-PAGE gel stained with brilliant blue G-colloidal, showing breakdown of a major protein band in SCM after digestion with trypsin-agarose beads. As the factor in SCM is unknown, we were not able to visualize directly any reduction in band intensity; however, the known 64 kDa protein transferrin was reduced in intensity on trypsin treatment. B, Digested SCM (SCM tryp) was less potent at inducing astrocyte proliferation (percentage of astrocytes taking up BrdU in 16 h after treatment). Both SCM- and SCM tryp-treated sets have significantly greater proliferation than control media (DMEM-BS H/F), but this is significantly different between SCM and SCM-tryp (*p < 0.05; **p < 0.001). Error bars represent SEM. C, Digested SCM was less efficient at promoting boundary formation between astrocytes and OECs. OEC/astrocyte confrontation assays treated with DMEM-FBS (FBS), SCM-50% (SCM), and digested SCM-50% (SCM tryp) are shown. Astrocytes were detected by GFAP (red), and OECs and Schwann cells were detected by p75NTR immunoreactivity (green). Arrows show boundaries. Scale bar, 100 μm.
Fibroblast growth factor receptor inhibition disrupts SCM-induced boundary formation in OEC astrocyte cultures
To investigate the signaling pathways that might induce boundary formation between OECs and astrocytes in the presence of SCM, various tyrosine receptor kinase inhibitors and an inhibitor of the nonreceptor tyrosine kinase Src were added to the confrontation assays. These included EGFR (AG1478), PDGFR (AG1295), and FGFR1 (SU5402). Although these inhibitors may nonspecifically affect related receptors, they provide an indication of which growth factor may be mediating this effect. Controls included incubating cells in DMEM-FBS (negative control) (Fig. 5Ai; B, lane 1) and SCM without inhibitors (positive control) (Fig. 5Aii; B, lane 2). When comparing these two controls, it can again be seen that OECs mingle among astrocytes when not inhibited by the addition of SCM. The EGFR and PDGFR inhibitors did not affect SCM-induced boundary formation. The inhibitor of the Src family of kinase induced morphological changes in both OECs and astrocytes, but OECs did not cross into astrocyte domains, suggesting that despite a change in cellular alignment of the cellular boundary, OECs could not migrate within the astrocytic domains. In the presence of the FGFR1 inhibitor, however, the SCM-induced boundary between OECs and astrocytes was disrupted to a certain extent with astrocytic process stretching into the OEC domains, which appear to interact directly with OECs (Fig. 5Avi; B, lane 6). Treatment with the FGFR1 inhibitor significantly increased the number of cells that entered the astrocyte domain from 14.2 ± 1.5 to 23.7 ± 2.4 cells/300 μm of boundary (p < 0.01). This value is no longer significantly different from the number of cells that crossed the boundary in control OEC/astrocyte confrontation assays (30.22 ± 3.2 cells/300 μm of boundary). In addition, treatment with the tyrosine receptor kinase inhibitors (EGFR, PDGFR, and FGFR1) did not significantly reduce SCM-induced astrocyte proliferation, suggesting that the proliferative response was not induced via signaling pathways dependent on these receptors (Fig. 5C).
Figure 5.
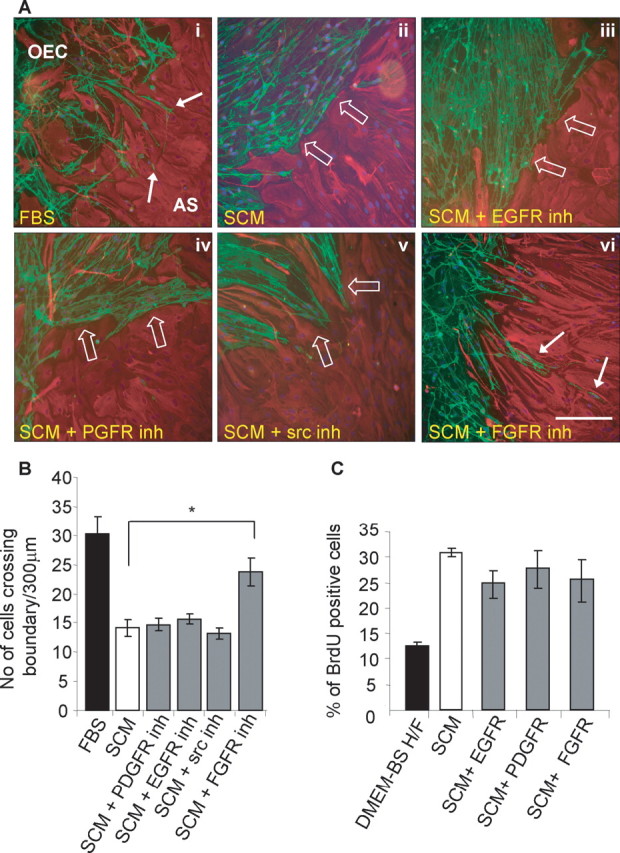
FGFR1 inhibition prevents OEC/astrocyte boundary formation after SCM treatment but does not influence astrocyte proliferation. A, Tyrosine kinase inhibitors were applied to OEC/astrocyte (AS) confrontation assays to examine their effects on SCM-induced boundary formation (boundaries are indicated by white open arrows). Boundaries were not disrupted by the presence of EGFR and PDGFR inhibitors (inh), although astrocytes became very elongated in the presence of the Src inhibitor. In the presence of an FGFR1 inhibitor, OECs and astrocytes formed a weaving interlay, with some cell intermingling. Astrocytes were detected by their GFAP expression (red), and OECs and Schwann cells were labeled for p75NTR (green). Migrating cells are indicated with a solid white arrow. Scale bar, 200 μm. B, Quantification of confrontation assays. FGFR1 inhibition increases the number (No) of cells migrating into astrocytic territories significantly compared with SCM treatment as assessed by the number of cells crossing a 300 μm boundary. *p < 0.01. C, Astrocyte proliferation was assessed by BrdU incorporation using indirect immunofluorescence. Astrocytes were incubated with SCM in the presence or absence of receptor tyrosine kinase (EGFR, PDGFR, and FGFR1) inhibitors, which had no effect on proliferation. Error bars represent SEM.
FGF receptor inhibitor treatment reduces Schwann cell and OEC plus SCM-mediated astrocyte area increase
Because the FGFR inhibitor affected boundary formation, we performed additional OEC and astrocyte coculture experiments to assess its effect on astrocyte area as a measurement of astrocyte hypertrophy (Fig. 6A,B). The inhibitor was added either at the time of SCM treatment or 2 d before immunolabeling in non-SCM-treated cultures and reapplied every day for 2 d. Cells were then immunolabeled for GFAP (astrocytes) and p75NTR (OECs and Schwann cells) (Fig. 6A), and astrocyte areas were measured and quantified (Fig. 6B). As seen for the confrontation assays, astrocytes in coculture with Schwann cells alone and those cultured with OECs and treated with SCM became enlarged with an increase in area from 1939 ± 150 μm2 (control) to 5286 ± 302 μm2 (Schwann cell coculture) and 5524 ± 377 μm2 (OEC coculture with SCM). Inhibition of FGFR1 significantly reduces this effect, although not to control levels (OEC coculture with SCM plus FGFR1 inhibitor, 2468 ± 396 μm2; Schwann cell coculture plus FGFR inhibitor, 3632 ± 499 μm2). This suggests that both Schwann cell-induced and OEC/SCM-induced hypertrophy is mediated in part via the FGFR1.
Figure 6.

FGFR1 inhibitor treatment reduces Schwann cell- and OECs plus SCM (OEC+SCM)-induced hypertrophy. A, Astrocytes were cultured alone (Ai) or cocultured with OEC+SCM (Aii), with OECs plus SCM plus FGFR1 inhibitors (OEC+SCM+FGFR inh) (Aiii), with Schwann cells (Aiv), or with Schwann cells and FGFR1 inh (Av). The cultures were incubated in various inhibitors either at the time of SCM addition or 2 d before immunolabeling in the non-SCM-treated cultures and reapplied every day for 2 d. Cells were immunolabeled for GFAP (astrocytes; red) and p75NTR (OECs and Schwann cells; green), as well as nuclear staining (DAPI; blue). Hypertrophic astrocytes are indicated with a white asterisk. Scale bar, 200 μm. B, Quantification of astrocyte area using NIH Image analysis, which demonstrates that the FGFR1 inhibitor (inh) can counteract the increase in astrocyte area. *p < 0.02; **p < 0.001. Error bars represent SEM.
The effect of FGF2 on boundary formation
The FGFR inhibitor data raise the question of whether a member of the FGF family induces boundary formation in OEC and astrocyte cocultures. Therefore, we assessed whether all three glia could respond to FGFs by examining their FGFR mRNA profile by RT-PCR (Fig. 7A,B). Astrocytes consistently expressed the highest levels of FGFR1, FGFR2, and FGFR3 and therefore expression levels in OECs and Schwann cells were normalized to that of astrocytes. None of the glia expressed FGFR4, and only astrocytes expressed FGFR3IIIB, but varying levels of FGFR1, FGFR2, and FGFR3 were seen. Possible differences between OECs and Schwann cell mRNA levels were seen for FGFR2IIIB, FGFR2IIIC, and FGFR3IIIC. We also assayed the levels of FGF2 by ELISA and found that conditioned medium from OECs, astrocytes, and Schwann cells contained similar levels of FGF2. The ELISA was performed three times, and although levels were variable between experiments, the average values were comparable between all three glia, with FGF2 levels of ∼80 pg/ml detected (Fig. 7C).
Figure 7.
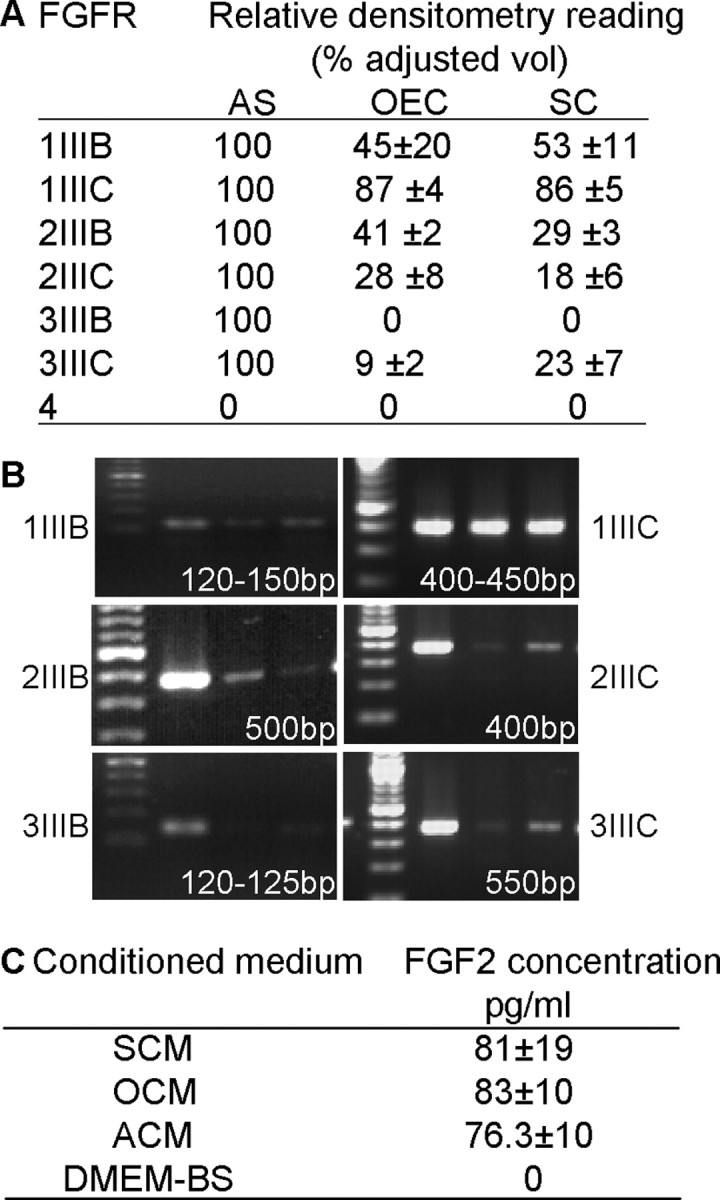
OECs, Schwann cells, and astrocytes express mRNA for FGFR1, FGFR2, and FGFR3, but not FGFR4, and secrete similar levels of FGF2. A, B, RT-PCR was performed for all four FGFR mRNA isoforms using cDNA synthesized from OECs, Schwann cells, and astrocytes (AS). Levels were normalized to astrocyte levels (100%), and typical bands with the expected product sizes are illustrated in B. C, The levels of FGF2 (pg/ml) in SCM, OCM, and ACM were estimated using ELISA. DMEM-BS lacked FGF2 and was used to collect conditioned medium from the three glial cell cultures. Levels were very similar in all conditioned media.
Modulation of HSPG expression in confrontation assays effects boundary formation
Because all three glia secrete FGF2, and the addition of 50 or 100 ng/ml FGF2 was not sufficient to induce boundary formation (Fig. 8A), we investigated whether FGF2 required activation in confrontation assays of astrocytes and OECs. Because it is known that heparin can activate FGF binding to its receptor (Lundin et al., 2000), heparin was added to confrontation assays between astrocytes and OECs at days 10–14 after the cells had grown toward each other (Fig. 8Bi–Biv). In these experiments, boundary formation between OECs and astrocytes after the addition of heparin was promoted in the absence of SCM, and a reduction in the number of cells crossing boundaries was observed. Furthermore, incubation with the FGFR1 inhibitor in the presence of heparin increased the number of cells that crossed the boundary, although levels were not restored to control. These data suggest that HSPG may be mediating boundary formation in Schwann cell/astrocyte cultures. For this reason, we treated these cultures with heparinase or chlorate to disrupt endogenous HSPG levels. After treatment, Schwann cells could be seen to mingle with astrocytes (Fig. 8Av,Avi), suggesting that HSPGs are mediating the effect.
Figure 8.

The effect of FGF2, heparin, chlorate, and heparinase on confrontation assays. Ai–Aiv, OEC/astrocyte (AS) confrontation assays were incubated in DMEM-FBS (Ai), SCM (Aii), 10 μg/ml heparin (Aiii), or FGFR1 inhibitor (inh) (10 μm) and 10 μg/ml heparin (Aiv). Two days after treatment, the cells were immunolabeled for GFAP (astrocytes; red) and p75NTR (OECs and Schwann cells; green). Arrowheads illustrate the boundary. Av, Avi, The addition of chlorate (Av) and heparinase (Avi) to Schwann cell astrocyte confrontation assays resulted in disruption of the cell boundary. Scale bars: (in Aii) Ai–Aiv, 100 μm; (in Avi) Av, Avi, 50 μm. B, Quantification of the number (No.) of cells that crossed the boundary. Control (FBS) cultures had the greater number of cells crossing the boundary, whereas SCM (positive control) treatment gave similar results to heparin treatment, with an increase in boundary formation and a reduction in the number of cells crossing the boundary. Addition of the FGFR1 inhibitor (inh) (SU5402; 10 μm) increased the number of cells crossing boundary distances of 300 μm but did not reach control levels. Addition of FGF2 had no significant effect (N.S., not significant; p > 0.01) on the number of cells crossing the boundary. Error bars represent SEM.
Interaction of Schwann cells and OECs with astrocytes in the normal spinal cord
To confirm the physiological relevance of our in vitro findings, OECs and Schwann cells expressing GFP were injected into opposite sides of the spinal cord (Fig. 9). Tissue sections were then labeled with antibodies against GFP to detect grafted OECs and Schwann cells, and counterstained against GFAP (blue) or HSPGs, FGF2, and FGFR1 (red). GFP-expressing OECs were transplanted into the left-hand side of the spinal cord, and GFP-expressing Schwann cells were injected into the right-hand side of the spinal cord. It could be seen that fewer GFAP-positive cells invaded the Schwann cell graft than the OEC graft (Fig. 9Ai, Aii,Bi–Biv). The asterisk in Figure 9Aii indicates a larger area devoid of GFAP-positive astrocytes after Schwann cell injection. Figure 9, Bv and Bvi (OECs) and Bvii and Bviii (Schwann cells), illustrates strong immunoreactivity to HSPG in astrocytic processes bordering the Schwann cell graft (arrows). Astrocytes mingling in the OEC graft also expressed diffuse HSPG (Fig. 9Bv,Bvi). Extracellular HSPG immunoreactivity was slightly higher over the SC graft (Fig. 9Bvii,Bviii, arrowheads). Both cell grafts showed increased immunoreactivity to FGFR1 (Fig. 9Ci,Cii, OECs; Ciii,Civ, Schwann cells) and FGF2 (Fig. 9Cv,Cvi, OECs; Cvii–Cviii, Schwann cells) compared with background tissue (Fig. 9C).
Figure 9.
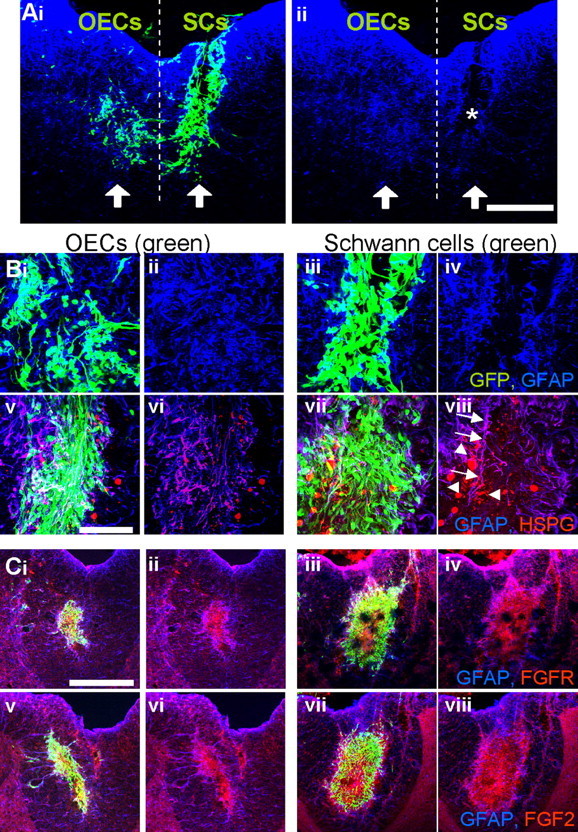
GFAP, HSPG, FGFR1, and FGF2 expression after GFP-OEC and GFP-Schwann cell injected into the nonlesioned spinal cord. GFP (green)-expressing OECs and Schwann cells were injected into parallel sites in the spinal cord with OECs injected into the left-hand side and Schwann cells into the right-hand side. The dotted line illustrates these two areas. The arrows represent the injection site. Ai, Aii, Immunolabeling of freezing microtome sections with anti-GFP (green) and anti-GFAP (blue) illustrates a lack of GFAP immunoreactivity and therefore astrocytes within the Schwann cell graft (*). Bi–Biv, High-power section from Ai and Aii illustrating the merged (Bi, Biii) GFP (green) and GFAP (blue) and GFAP alone (Bii, Biv) for OECs (Bi, Bii) and Schwann cells (Biii, Biv). Bv–Bviii, Pan-HSPG antibody (red) immunoreactivity was examined together with GFP (green) and GFAP (blue) for OECs (Bv) and Schwann cells (Bvii) or GFAP (blue) and HSPG (red) alone for OECs (Bvi) and Schwann cells (Bviii). Arrows denote HSPG immunoreactivity associated with astrocyte processes lining the Schwann cell grafted cells. Arrowheads point to extracellular HSPG expression. Bv, Bvi, Astrocytes mingling in the OEC graft also expressed diffuse HSPG. C, Both cell grafts showed increased immunoreactivity to FGFR1 (Ci, Cii, OECs; Ciii, Civ, Schwann cells; GFP, green; FGFR1, red) and FGF2 (Cv, Cvi, OECs; Cvii, Cviii, Schwann cells; GFP, green; FGF2, red) compared with background tissue. Scale bars: A, C, 200 μm; B, 50 μm.
SCM and OCM increase astrocyte CSPG expression, particularly neurocan
The above results indicate that SCM can influence several features of the astrocyte stress response, including increases in astrocyte area, GFAP expression, and boundary formation. An additional indicator of the astrocyte stress response is the upregulation of the inhibitory molecules from the CSPG family. Astrocytes were cultured in DMEM-FBS, SCM, or OCM, or cocultured with Schwann cells. As a positive control for astrocyte reactivity, astrocyte monolayers in DMEM-FBS were wounded with a pipette tip and immunolabeled 24 h later. All cultures were immunolabeled for GFAP and CSPGs, which were assessed using either a pan-CSPG antibody (CS-56), an antibody that recognizes the DSD-1 epitope embedded in the CS side chains (473HD), or a neurocan-specific antibody. All antibodies had strong immunoreactivity in the positive wound control in which strongly immunoreactive astrocyte processes could be seen throughout the cultures (Fig. 10Avi) (data only shown for neurocan). CS-56 immunoreactivity in the negative control (FBS) was higher than our previous experiments (Lakatos et al., 2000) (Fig. 10Bi). In the presence of SCM and OCM, expression of CSPGs using three of the antibodies was higher than FBS controls, although the increases in CSPG induced by OCM treatment were generally lower (Fig. 10A) (data only shown for neurocan). However, changes in immunoreactivity were not significantly different between control FBS-treated astrocytes and cocultures of astrocyte and Schwann cells (Fig. 10B). The most obvious changes were found for neurocan expression after both SCM and OCM treatment, because astrocytes grown in FBS expressed very little neurocan (Fig. 10Aiv,Av).
Figure 10.

Neurocan expression is upregulated in astrocytes after SCM and OCM treatment. A, B, Monolayers of astrocytes were grown in FBS (Ai, Bi, Biv; negative controls), scraped with a pipette tip (Avi; positive controls), cocultured with OECs (Aii) or SCs (Aiii, Bii, Bv), or treated with SCM (Aiv, Biii, Bviii) or OCM (Av). Immunocytochemistry of astrocytes (GFAP; red) was performed in conjunction with the antibody to neurocan (Ai–Avi; green), CS-56 (Bi–Biii, green), or 473HD (Biv–Bvi, green). Scale bars, 200 μm. C, Lysates were made from cultures under the same conditions and subjected to immunoblotting with a neurocan antibody, with vinculin as a protein loading control. Quantification was made of neurocan changes relative to vinculin. Neurocan expression is raised in Schwann cell/astrocyte cocultures, after SCM and OCM treatment and after a wound. Arrows point to areas of high CSPG expression.
To quantify these increases in CSPG expression in more detail, immunoblotting was performed using both pan-CSPG antibodies (CS-56 and 473HD) and the 1G2 antibody (neurocan). Positive controls were generated by scratching astrocyte monolayers with a pipette tip. Vinculin was used as a loading control. Before probing with anti-neurocan, lysates were digested with chondroitinase to resolve neurocan into discrete bands for identification and quantification (McKeon et al., 1999; Asher et al., 2000). Both the CS-56 and 473HD antibodies were not suitable for Western blotting, producing bands with varying apparent molecular weights, preventing a comparative analysis (data not shown). However, full-length neurocan (275 kDa) was identified using the neurocan antibody (Fig. 10C). Quantification clearly showed an increase in neurocan expression after SCM treatment (12-fold) and also after OCM treatment (10.5-fold). Levels were also elevated in the wound control (10.7-fold). Interestingly, unlike the immunocytochemistry study, neurocan levels were upregulated after astrocyte coculture with Schwann cells (6.3-fold), suggesting that protein quantification was more sensitive. In conclusion, SCM and OCM treatment cause astrocytes to upregulate expression of neurocan.
To provide an indication of which signaling pathways may mediate the upregulation of CSPG expression, tyrosine receptor kinase inhibitors were added to SCM-treated cultures at the time of treatment and reapplied every day for 2 d before cultures were immunolabeled. The addition of the FGFR1 inhibitor had no effect on SCM-induced expression of either the CS-56 epitope or neurocan (Fig. 11). Similarly, addition of EGFR and PDGFR inhibitors had no effect on CSPG expression in these cultures (data not shown). This suggests that SCM does not activate essential FGFR1-, EGFR-, or PDGFR-dependent signals necessary for upregulation of CSPGs.
Figure 11.

FGFR1 inhibitor treatment had no effect on SCM-induced CSPG expression. Astrocytes were grown in FBS (negative control; iiv) or incubated with SCM (ii, v) and SCM with FGFR1 inhibitor (iii, vi) for 2 d before immunocytochemistry with anti-GFAP (red), anti-neurocan (green; i–iii), or the CS-56 antibody (green; iv–vi). Arrows point to areas of high CSPG expression. Scale bar, 200 μm.
Discussion
In this study, we have shown that SCM added to cultures of OECs and astrocytes induces characteristics of reactive astrocytosis. These characteristics include an increase in astrocyte area, an increase in GFAP expression, and the formation of a boundary between the two cell types. This effect was only seen if astrocytes were in contact with OECs and was not attributable to the addition of a soluble factor from Schwann cells alone. Furthermore, our data suggests that the cell contact-dependent induction of reactive astrocytosis was mediated in part by FGF2, because it was susceptible to blockage by an FGFR1 inhibitor. However, this effect could not be induced by FGF2 alone, either added exogenously or when produced constitutively by either OECs or Schwann cells. When heparin was added to OEC/astrocyte cultures, boundary formation was induced, whereas addition of heparinase and chlorate to Schwann cell/astrocyte cultures reduced boundary formation. This suggests that OECs may secrete a different HSPG profile to Schwann cells and therefore lack the soluble HSPG required for effective FGF-FGFR1 signaling in astrocytosis. Although SCM induced the proliferation of astrocytes in monocultures and increased their CSPG expression, these responses were not inhibited by the FGFR1 inhibitor. Likewise, despite CSPG expression and astrocyte proliferation being dependent only on the addition of SCM, the increase in GFAP expression and astrocytosis required an addition signal from OEC or Schwann cell contact. Thus, these different characteristics of reactive astrocytosis are mediated by different signaling events. In vivo studies in which GFP-expressing OECs and GFP-expressing Schwann cells were injected into the normal spinal cord provide physiological relevance to the observations made in vitro of differential intermingling of OECs and Schwann cells with astrocytes.
CSPG expression and hypertrophy
In this study, the increase in expression of CSPGs in confrontation assays between Schwann cells and astrocytes (using a pan-antibody, CS-56) was less pronounced than in our previous study (Lakatos et al., 2000). Despite this, these in vitro assays were useful for assessing characteristics of astrocytosis because many markers of reactivity, including CSPG expression, were elevated significantly in the treated sets above those of control cultures, particularly in the presence of SCM. The fact that exogenous application of SCM to astrocytes produced significant changes in CSPG expression may reflect a concentration difference between the SCM and Schwann cell/astrocyte cocultures. These results suggest that the previously reported increase in CSPG expression in these cocultures (Lakatos et al., 2000) may have been mediated by secreted factors rather than being a cell-contact-mediated event.
The CSPG family of proteins have been shown to both inhibit and elicit neurite outgrowth (Snow et al., 1990; Faissner et al., 1994). This may reflect variability in expression levels or different properties of the various members of the CSPG family in response to CNS injury. For example, after the transplantation of OECs or Schwann cells into models of spinal cord injury, CSPG expression was lower around OEC grafts than around Schwann cell grafts (Takami et al., 2002). However, neurocan expression was increased to a similar level in response to both glial cells after injection into the noninjured spinal cord (Asher et al., 2000; Lakatos et al., 2003). This correlates with our in vitro findings in which SCM and OCM were able to stimulate neurocan expression in astrocytes. In contrast, it has been shown that there was no change in neurocan expression in response to Schwann cell grafting in a lesion model, despite noticeable changes in CS-56 (Plant et al., 2001). It is apparent that growth factors can modulate the cellular expression of individual CSPGs. Recent in vitro studies demonstrated that addition of EGF or TGF-β1 to astrocytes increased expression of phosphacan and neurocan, respectively (Smith and Strunz, 2005). These data would explain why the increase in neurocan on astrocytes by OCM and SCM in our study was not susceptible to FGFR1 inhibition.
FGF signaling
In this study, we demonstrated that inhibition of the FGFR1 was sufficient to reduce astrocyte area, leading to an increase in the number of OECs that could interdigitate with astrocytic processes in the presence of SCM. Therefore, the next step was to determine whether any of the FGF family members could induce boundary formation between these cell types. FGF2 is the most likely candidate, because it is expressed in the brain after birth by neurons and astrocytes, it binds to FGFR1 (Gómez-Pinilla et al., 1995), and it is upregulated after injury, contributing to glial scar formation (Eddleston and Mucke 1993; Goddard et al., 2002). FGF2 can also stimulate astrocyte proliferation, hypertrophy, changes in morphology, and an increase in GFAP expression (Eclancher et al., 1996; Goddard et al., 2002). However, addition of FGF2 to OEC/astrocyte cultures did not induce boundary formation; likewise, similar levels of FGF2 were secreted into the culture medium by both OECs and Schwann cells. These results do not exclude the possibility that FGF2 is involved in the generation of boundaries, because it is known that FGF2 requires presentation to the cell by heparan sulfates for activation. Instead, it may be that a different repertoire of heparan sulfates is secreted by Schwann cells and OECs.
We cannot rule out the fact that other members of the FGF family are involved. The FGF family of growth factors is composed of 23 members, and among them only FGF1, FGF2, FGF9, and FGF22 are expressed postnatally (Miyamoto et al., 1993; Beyer et al., 2003; Reuss and von Bohlen und Halbach, 2003). FGF22 is an unlikely candidate because it is in the same family grouping as FGF7 and FGF10, which are associated with epithelial cells. It is possible that FGF9 or FGF1 may be exerting the effect, because both of these FGFs can influence CNS cells, but there is no evidence that they play a role in injury, as has been reported for FGF2 (Eddleston and Mucke, 1993; Goddard et al., 2002; Leadbeater et al., 2006). To get an indication of the FGF responsiveness of the three different glial cells, FGFR1–FGFR4 mRNA levels were determined by RT-PCR. OECs, Schwann cells, and astrocytes expressed a repertoire of FGFR1–FGFR3 but lacked the mRNA for FGFR4. This agrees with the literature, which has reported FGFR4 expression only during development (Reuss and von Bohlen und Halbach, 2003). FGFR1IIIC, one of the receptors used by FGF2, was strongly expressed by all three glia. Differences in the FGFR profile were seen for all three glial cells, with astrocytes expressing the highest levels of FGFR1–FGFR3 mRNA. Differential expression for FGFR2IIIB, FGFR2IIIC, and FGFR3IIIC were found for OECs and Schwann cells, supporting the view that they are distinct glial cells (Barnett et al., 1993; Ramon-Cueto and Valverde, 1995; Wewetzer et al., 2002).
The addition of heparin to OEC/astrocyte cultures was sufficient to induce boundary formation. Conversely, the addition of two reagents that inhibit the function of HSPG, either by inhibiting HS sulfation (chlorate) or by digesting HSPGs directly (heparinases), promoted Schwann cell and astrocyte mingling. These data suggest that HSPGs are playing a role in boundary formation. The addition of the FGFR1 inhibitor together with heparin increased the number of cells crossing the boundary, but values did not reach control levels, suggesting that other factors apart from FGF may be involved. Heparin, although well known as an anticoagulant polysaccharide, is also active in many other biological systems because of its structural similarity to HS. Heparin and HS have been shown to bind and regulate the activities of many proteins, including enzymes, growth factors, ECM (extracellular matrix) proteins, and the cell surface proteins of pathogens (for review, see Bernfield et al., 1999). HS is expressed on the cell surface and in the extracellular matrix of virtually all mammalian cells and is strategically positioned to act as a cellular regulator of protein function (Guimond et al., 2006). FGF2 requires activation by heparin/HS through dimerization, which in turn facilitates FGFR dimerization and transmembrane signaling (Plotnikov et al., 1999). It has been shown that the level of sulfation of HSPGs can either positively or negatively regulate the biological activity of FGF2 (Bashkin et al., 1989; Delehedde et al., 1996; Lundin et al., 2000). This raises the possibility that HSPGs secreted by Schwann cells might (1) promote or enhance the FGF2 signaling response that results in an astrocyte/OEC boundary or (2) inhibit an endogenous HSPG-dependent activity that promotes mixing between the cells.
Because treatment with the FGFR1 inhibitor decreased the size of astrocytes in contact with OECs and therefore reduced the large physical astrocyte barrier, it is possible that this was sufficient to allow OECs to migrate among the astrocytes. However, it was found that the number of cells that crossed this boundary was less than that seen in control (non-SCM-treated) cultures. This suggests that SCM may also be influencing other aspects of astrocytosis, such as CSPG expression, which was FGFR1 independent. In these experiments, many OECs were able to migrate among astrocytes, suggesting that the presence of CSPG is unlikely to be a major determinant, with hypertrophy playing the more significant role. This is in contrast to a recent report suggesting that CSPGs play a critical role in determining the ability of Schwann cells to enter astrocytic areas, using confrontation assays similar to those used here (Grimpe et al., 2005). This may highlight another difference between Schwann cells and OECs, in that Schwann cell migration may be more susceptible than OEC migration to CSPG inhibition, although the role of CSPGs in OEC/astrocyte interactions still remains to be determined.
Expression of FGFR1, FGF2, HSPG, and GFAP after injection into the normal spinal cord
In this study, we suggest that the FGF2/FGFR1 system is involved in the astrocyte stress response in vitro, which is potentiated by HSPG presented by the Schwann cells (Fig. 12). To confirm the physiological relevance of these in vitro observations, we injected GFP-expressing OECs and Schwann cells into the normal spinal cord. Sections were immunolabeled with antibodies against FGF2, FGFR1, GFAP, and pan-HSPG, 10 d after the injections. GFAP immunoreactivity demonstrated coexistence of grafted OECs and astrocytes, whereas grafted Schwann cells did not intermingle with astrocytes. Increased immunoreactivity was also found for FGF2 and FGFR1 over both grafts typical of an injury response (Goddard et al., 2002). HSPG immunoreactivity was intense in astrocytic processes lining the border of the Schwann cell graft, although astrocytes within the OEC graft were also immunoreactive for HSPG. This is not surprising because the antibody to HSPG can recognize several HSPGs. Immunoreactivity was also seen extracellularly over both glia grafts, with higher levels over Schwann cell grafts. It is possible that there are HSPG differences expressed between OECs and Schwann cells that may differentially trigger the astrocyte stress response. These data are consistent with the hypothesis that HSPGs secreted by Schwann cells potentiate the astrocyte stress response. Other reports have shown that HS can modify the astrocyte stress response after brain injury. In one study, a small bilateral lesion was made into the rat sensorimotor cortex, into which Gelfoam soaked in FGF2, FGF2 plus HS, HS, or saline was applied. After the lesion, FGF2 and FGFR1 immunoreactivity increased compared with control groups and was augmented in rats that received FGF2 combined with HS (Gómez-Pinilla et al., 1995). Furthermore, a more detailed study of the intracellular dynamics of FGFR1, FGF2, and HSPGs after a lesion in the rat cerebral cortex suggests that HSPGs regulate FGF2 storage, nuclear trafficking, and cell-specific injury responses in CNS wounds (Leadbeater et al., 2006). In this study, a similar low level of HSPG expression was seen in the normal CNS before injury as we found in the spinal cord. These data support the hypothesis that differential expression of HSPGs by OECs and Schwann cells can influence the formation of a boundary between these cells and astrocytes.
Figure 12.

Schematic for Schwann cell-induced astrocytic response. A, To induce the stress response in astrocytes (AS), the Schwann cell secretes HSPG(s), which activate a member of the FGF family (secreted by glial cells) to bind to its receptor on the astrocyte (R). This response also requires an unknown contact signal between astrocytes and Schwann cells. It is also possible that a second factor activates the release of the HSPG(s), which in turn activates FGF binding to its receptor. B, In OEC/astrocyte cultures, the HSPG(s) that activate FGF binding are absent and cannot instigate the stress response even though astrocytes and OECs are in contact. However, the stress response can be induced in astrocytes when HSPGs from SCM or heparin is added.
Implications for transplantation strategies to promote CNS repair
The potential cellular interactions that take place after cell transplantation are complex. This can be seen by the in vitro assays used in this study, in which several secreted and contact-mediated factors interplay in the induction of the astrocytic stress response. A better understanding of the mechanisms by which Schwann cells induce astrocyte reactivity could allow us to reduce the growth-inhibitory response and thus improve repair after glial cell transplantation. This would not only be beneficial for strategies involving the transplantation of Schwann cells, but also for other injury scenarios, because it has been well documented that after the disruption of the glia limitans, Schwann cells from the dorsal root are able to invade the CNS environment of the spinal cord (Franklin and Blakemore, 1993; Bruce et al., 2000; Ramer et al., 2004; Boyd et al., 2005), where they may add to the inhibitory nature of the glial scar. Furthermore, in the situation in which OECs are transplanted into the injured CNS to promote repair, the infiltrating Schwann cells may then promote the reactive phenotype in astrocytes that are in contact with the grafted OECs. Identification of factors secreted by Schwann cells that induce this response in astrocytes whether these cells have been transplanted with the intent of promoting repair or result from endogenous invading populations would further our ability to enhance the growth-promoting properties of the astrocyte-rich environment.
Footnotes
This work was supported by the International Spinal Research Trust (R.F.) and the Wellcome Trust (A.S.S.). S.C.B. is a Multiple Sclerosis Society Senior Research Fellow. We thank Dr. Val Brunton for advice, Tom Gilbey for FACS sorting, Prof. Oohera for the neurocan antibody, Prof. A. Faissner for the 473HD antibody, and Dr. Giles Plant for the p75NTR hybridoma.
References
- Alexander CL, FitzGerald UF, Barnett SC. Identification of growth factors that promote long-term proliferation of olfactory ensheathing cells and modulate their antigenic phenotype. Glia. 2002;37:349–364. [PubMed] [Google Scholar]
- Asher RA, Morgenstern DA, Fidler PS, Adcock KH, Oohira A, Braistead JE, Levine JM, Margolis RU, Rogers JH, Fawcett JW. Neurocan is upregulated in injured brain and in cytokine-treated astrocytes. J Neurosci. 2000;20:2427–2438. doi: 10.1523/JNEUROSCI.20-07-02427.2000. [DOI] [PMC free article] [PubMed] [Google Scholar]
- Barnett SC, Chang L. Olfactory ensheathing cells and CNS repair: going solo or in need of a friend? Trends Neurosci. 2004;27:54–60. doi: 10.1016/j.tins.2003.10.011. [DOI] [PubMed] [Google Scholar]
- Barnett SC, Riddell JS. Olfactory ensheathing cells (OECs) and the treatment of CNS injury; advantages and possible caveats. J Anat. 2004;24:57–67. doi: 10.1111/j.1469-7580.2004.00257.x. [DOI] [PMC free article] [PubMed] [Google Scholar]
- Barnett SC, Hutchins AM, Noble M. Purification of olfactory nerve ensheathing cells from the olfactory bulb. Dev Biol. 1993;155:337–350. doi: 10.1006/dbio.1993.1033. [DOI] [PubMed] [Google Scholar]
- Bashkin P, Doctrow S, Klagsbrun M, Svahn CM, Folkman J, Vlodavsky I. Basic fibroblast growth factor binds to subendothelial extracellular matrix and is released by heparitinase and heparin-like molecules. Biochemistry. 1989;28:1737–1743. doi: 10.1021/bi00430a047. [DOI] [PubMed] [Google Scholar]
- Bernfield M, Gotte M, Park PW, Reizes O, Fitzgerald ML, Lincecum J, Zako M. Functions of cell surface heparan sulfate proteoglycans. Annu Rev Biochem. 1999;68:729–777. doi: 10.1146/annurev.biochem.68.1.729. [DOI] [PubMed] [Google Scholar]
- Blake RA, Broome MA, Liu X, Wu J, Gishizky M, Sun L, Courtneidge SA. SU6656, a selective src family kinase inhibitor, used to probe growth factor signaling. Mol Cell Biol. 2000;20:9018–9027. doi: 10.1128/mcb.20.23.9018-9027.2000. [DOI] [PMC free article] [PubMed] [Google Scholar]
- Bottenstein J, Hayashi I, Hutchings S, Masui H, Mather J, McClure DB, Ohasa S, Rizzino A, Sato G, Serrero G, Wolfe R, Wu R. The growth of cells in serum-free hormone supplemented media. Methods Enzymol. 1979;58:94–109. doi: 10.1016/s0076-6879(79)58127-0. [DOI] [PubMed] [Google Scholar]
- Boyd JG, Doucette R, Kawaja MD. Defining the role of olfactory ensheathing cells in facilitating axon remyelination following damage to the spinal cord. FASEB J. 2005;19:694–703. doi: 10.1096/fj.04-2833rev. [DOI] [PubMed] [Google Scholar]
- Bruce JH, Norenberg MD, Kraydieh S, Puckett W, Marcillo A, Dietrich D. Schwannosis: role of gliosis and proteoglycan in human spinal cord injury. J Neurotrauma. 2000;17:781–788. doi: 10.1089/neu.2000.17.781. [DOI] [PubMed] [Google Scholar]
- Chuah MI, West AK. Cellular and molecular biology of ensheathing cells. Microsc Res Tech. 2002;58:216–227. doi: 10.1002/jemt.10151. [DOI] [PubMed] [Google Scholar]
- Delehedde M, Deudon E, Boilly N, Hondermarck H. Heparan sulfate proteoglycans play a dual role in regulating fibroblast growth factor-2 mitogenic activity in human breast cancer cells. Exp Cell Res. 1996;229:398–406. doi: 10.1006/excr.1996.0385. [DOI] [PubMed] [Google Scholar]
- Dong Z, Dean C, Walters JE, Mirsky R, Jessen K. Response of Schwann cells to mitogens in vitro is determined by pre-exposure to serum, time in vitro and developmental age. Glia. 1997;20:219–230. [PubMed] [Google Scholar]
- Doucette R. Olfactory ensheathing cells: potential for glial cell transplantation into areas of CNS injury. Histol Histopathol. 1995;10:503–507. [PubMed] [Google Scholar]
- Eddleston M, Mucke L. Molecular profile of reactive astrocytes—implications for their role in neurologic disease. Neuroscience. 1993;54:15–36. doi: 10.1016/0306-4522(93)90380-X. [DOI] [PMC free article] [PubMed] [Google Scholar]
- Eng LF, Ghirnikar RS. GFAP and astrogliosis. Brain Pathol. 1994;4:229–237. doi: 10.1111/j.1750-3639.1994.tb00838.x. [DOI] [PubMed] [Google Scholar]
- Fairless R, Frame MC, Barnett SC. N-cadherin differentially determines Schwann cell and olfactory ensheathing cell adhesion and migration upon contact with astrocytes. Mol Cell Neurosci. 2005;28:253–263. doi: 10.1016/j.mcn.2004.09.009. [DOI] [PubMed] [Google Scholar]
- Faissner A, Clement A, Lochter A, Streit A, Mandl C, Schachner M. Isolation of a neural chondroitin sulfate proteoglycan with neurite outgrowth promoting properties. J Cell Biol. 1994;126:783–799. doi: 10.1083/jcb.126.3.783. [DOI] [PMC free article] [PubMed] [Google Scholar]
- Fawcett JW, Asher RA. The glial scar and central nervous system repair. Brain Res Bull. 1999;49:377–391. doi: 10.1016/s0361-9230(99)00072-6. [DOI] [PubMed] [Google Scholar]
- Franceschini IA, Barnett SC. Low affinity NGF-receptor and E-N-CAM expression define two types of olfactory nerve ensheathing cells that share a common lineage. Dev Biol. 1996;173:327–343. doi: 10.1006/dbio.1996.0027. [DOI] [PubMed] [Google Scholar]
- Franklin RJ, Barnett SC. Olfactory ensheathing cells and CNS regeneration—the sweet smell of success? Neuron. 2000;28:15–18. doi: 10.1016/s0896-6273(00)00080-5. [DOI] [PubMed] [Google Scholar]
- Franklin RJM, Blakemore WF. Requirements for Schwann cell migration within CNS environments: a viewpoint. Int J Dev Neurosci. 1993;11:641–649. doi: 10.1016/0736-5748(93)90052-F. [DOI] [PMC free article] [PubMed] [Google Scholar]
- Garcia-Alias G, Lopez-Vales R, Fores J, Navarro X, Verdu E. Acute transplantation of olfactory ensheathing cells or Schwann cells promotes recovery after spinal cord injury in the rat. J Neurosci Res. 2004;75:632–641. doi: 10.1002/jnr.20029. [DOI] [PubMed] [Google Scholar]
- Ghirnikar RS, Eng LF. Astrocyte-Schwann cell interactions in culture. Glia. 1994;11:367–377. doi: 10.1002/glia.440110409. [DOI] [PubMed] [Google Scholar]
- Goddard DR, Berry M, Kirvell S, Butt AM. Fibroblast growth factor-2 induces astroglial and microglial reactivity in vivo. J Anat. 2002;2000:57–67. doi: 10.1046/j.0021-8782.2001.00002.x. [DOI] [PMC free article] [PubMed] [Google Scholar]
- Gómez-Pinilla F, Vu L, Cotman CW. Regulation of astrocyte proliferation by FGF-2 and heparan sulfate in vivo. J Neurosci. 1995;15:2021–2029. doi: 10.1523/JNEUROSCI.15-03-02021.1995. [DOI] [PMC free article] [PubMed] [Google Scholar]
- Grimpe B, Pressman Y, Lupa MD, Horn KP, Bunge MB, Silver J. The role of proteoglycans in Schwann cell/astrocyte interactions and in regeneration failure at PNS/CNS interfaces. Mol Cell Neurosci. 2005;28:18–29. doi: 10.1016/j.mcn.2004.06.010. [DOI] [PubMed] [Google Scholar]
- Guimond SE, Turnbull JE, Yates EA. Bio-active polysaccharides from heparin. Macromol Biosci. 2006;6:681–686. doi: 10.1002/mabi.200600042. [DOI] [PubMed] [Google Scholar]
- Kirby JL, Yang L, Labus JC, Hinton BT. Characterization of fibroblast growth factor receptors expressed in principal cells in the initial segment of the rat epididymis. Biol Reprod. 2003;68:2314–2321. doi: 10.1095/biolreprod.102.011270. [DOI] [PubMed] [Google Scholar]
- Kovalenko M, Gazit A, Bohmer A, Rorsman C, Ronnstrand L, Heldin CH, Waltenberger J, Bohmer FD, Levitzki A. Selective platelet-derived growth factor receptor kinase blockers reverse sis-transformation. Cancer Res. 1994;5:6106–6114. [PubMed] [Google Scholar]
- Lakatos A, Franklin RJM, Barnett SC. Olfactory ensheathing cells and Schwann cells differ in their in vitro interactions with astrocytes. Glia. 2000;32:214–225. doi: 10.1002/1098-1136(200012)32:3<214::aid-glia20>3.0.co;2-7. [DOI] [PubMed] [Google Scholar]
- Lakatos A, Barnett SC, Franklin RJM. Olfactory ensheathing cells induce less host astrocyte response and chondroitin sulphate proteoglycan expression than Schwann cells following transplantation into adult CNS white matter. Exp Neurol. 2003;184:237–246. doi: 10.1016/s0014-4886(03)00270-x. [DOI] [PubMed] [Google Scholar]
- Leadbeater WE, Gonzalez A-M, Logaras N, Berry M, Turnbull JE, Logn A. Intracellular trafficking in neurones and glia of fibroblast growth factor-2, fibroblast growth factor receptor 1 and heparan sulphate proteoglycans in the inured adult cerebral cortex. J Neurochem. 2006;96:1189–1200. doi: 10.1111/j.1471-4159.2005.03632.x. [DOI] [PubMed] [Google Scholar]
- Li Y, Field PM, Raisman G. Repair of adult rat corticospinal tract by transplants of olfactory ensheathing cells. Science. 1997;277:2000–2002. doi: 10.1126/science.277.5334.2000. [DOI] [PubMed] [Google Scholar]
- Liu W, Akhand AA, Kato M, Yokoyama I, Miyata T, Kurokawa K, Uchida K, Nakashima I. 4-Hydroxynonenal triggers an epidermal growth factor receptor-linked signal pathway for growth inhibition. J Cell Sci. 1999;112:2409–2417. doi: 10.1242/jcs.112.14.2409. [DOI] [PubMed] [Google Scholar]
- Lundin L, Larsson H, Kreuger J, Kanda S, Lindahl U, Salmivirta M, Claesson-Welsh L. Selectively desulfated heparin inhibits fibroblast growth factor-induced mitogenicity and angiogenesis. J Biol Chem. 2000;275:24653–24660. doi: 10.1074/jbc.M908930199. [DOI] [PubMed] [Google Scholar]
- McKeon RJ, Jurynec MJ, Buck CR. The chondroitin sulfate proteoglycans neurocan and phosphacan are expressed by reactive astrocytes in the chronic CNS glial scar. J Neurosci. 1999;19:10778–10788. doi: 10.1523/JNEUROSCI.19-24-10778.1999. [DOI] [PMC free article] [PubMed] [Google Scholar]
- Miyamoto M, Naruo K, Seko C, Matsumoto S, Kondo T, Kurokawa T. Molecular cloning of a novel cytokine cDNA encoding the ninth member of the fibroblast growth factor family, which has a unique secretion property. Mol Cell Biol. 1993;13:4251–4259. doi: 10.1128/mcb.13.7.4251. [DOI] [PMC free article] [PubMed] [Google Scholar]
- Mohammadi M, McMahon G, Sun L, Tang C, Hirth P, Yeh BK, Hubbard SR, Schlessinger J. Structures of the tyrosine kinase domain of fibroblast growth factor receptor in complex with inhibitors. Science. 1997;276:955–960. doi: 10.1126/science.276.5314.955. [DOI] [PubMed] [Google Scholar]
- Noble M, Murray K. Purified astrocytes promote the in vitro division of a bipotential glial progenitor cell. EMBO J. 1984;3:2243–2247. doi: 10.1002/j.1460-2075.1984.tb02122.x. [DOI] [PMC free article] [PubMed] [Google Scholar]
- Norenberg MD. Astrocyte responses to CNS injury. J Neuropathol Exp Neurol. 1994;53:213–220. doi: 10.1097/00005072-199405000-00001. [DOI] [PubMed] [Google Scholar]
- Oohira A, Matsui F, Watanabe E, Kushima Y, Maeda N. Developmentally regulated expression of a brain specific species of chondroitin sulfate proteoglycan, neurocan, identified with a monoclonal antibody 1G2 in the rat cerebrum. Neuroscience. 1994;60:145–157. doi: 10.1016/0306-4522(94)90210-0. [DOI] [PubMed] [Google Scholar]
- Pearse DD, Pereira FC, Marcillo AE, Bates ML, Berrocal YA, Filbin MT, Bunge MB. cAMP and Schwann cells promote axonal growth and functional recovery after spinal cord injury. Nat Med. 2004a;10:610–616. doi: 10.1038/nm1056. [DOI] [PubMed] [Google Scholar]
- Pearse DD, Marcillo AE, Oudega M, Lynch MP, Wood PM, Bunge MB. Transplantation of Schwann cells and olfactory ensheathing glia after spinal cord injury: does pretreatment with methylprednisolone and interleukin-10 enhance recovery? Neurotrauma. 2004b;21:1223–1239. doi: 10.1089/neu.2004.21.1223. [DOI] [PubMed] [Google Scholar]
- Pekny M, Nilsson M. Astrocyte activation and reactive gliosis. Glia. 2005;50:427–434. doi: 10.1002/glia.20207. [DOI] [PubMed] [Google Scholar]
- Plant GW, Bates ML, Bunge MB. Inhibitory proteoglycan immunoreactivity is higher at the caudal than the rostral Schwann cell graft-transected spinal cord interface. Mol Cell Neurosci. 2001;17:471–487. doi: 10.1006/mcne.2000.0948. [DOI] [PubMed] [Google Scholar]
- Plotnikov AN, Schlessinger J, Hubbard SR, Mohammadi M. Structural basis for FGF receptor dimerization and activation. Cell. 1999;98:641–650. doi: 10.1016/s0092-8674(00)80051-3. [DOI] [PubMed] [Google Scholar]
- Pollock GS, Franceschini IA, Graham G, Barnett SC. Neuregulin is a mitogen and survival factor for olfactory bulb ensheathing cells and an isoform is produced by astrocytes. Eur J Neurosci. 1999;11:769–780. doi: 10.1046/j.1460-9568.1999.00484.x. [DOI] [PubMed] [Google Scholar]
- Raisman G. Olfactory ensheathing cells-another miracle cure for spinal cord injury. Nat Rev Neurosci. 2001;2:369–374. doi: 10.1038/35072576. [DOI] [PubMed] [Google Scholar]
- Ramer LM, Au E, Richter MW, Liu J, Tetzlaff W, Roskams AJ. Peripheral olfactory ensheathing cells reduce scar and cavity formation and promote regeneration after spinal cord injury. J Comp Neurol. 2004;473:1–15. doi: 10.1002/cne.20049. [DOI] [PubMed] [Google Scholar]
- Ramon-Cueto A, Valverde F. Olfactory bulb ensheathing glia: a unique cell type with axonal growth-promoting properties. Glia. 1995;14:163–173. doi: 10.1002/glia.440140302. [DOI] [PubMed] [Google Scholar]
- Ramon-Cueto A, Plant GW, Avila J, Bunge MB. Long-distance axonal regeneration in the transected adult rat spinal cord is promoted by olfactory ensheathing glia transplants. J Neurosci. 1998;18:3803–3815. doi: 10.1523/JNEUROSCI.18-10-03803.1998. [DOI] [PMC free article] [PubMed] [Google Scholar]
- Ranscht B, Clapshaw PA, Price J, Noble M, Seifert W. Development of oligodendrocytes and Schwann cells studied with a monoclonal antibody against galactocerebroside. Proc Natl Acad Sci USA. 1982;79:2709–2713. doi: 10.1073/pnas.79.8.2709. [DOI] [PMC free article] [PubMed] [Google Scholar]
- Reuss B, von Bohlen und Halbach O. Fibroblast growth factors and their receptors in the central nervous system. Cell Tissue Res. 2003;313:139–157. doi: 10.1007/s00441-003-0756-7. [DOI] [PubMed] [Google Scholar]
- Riddell JS, Enriquez-Denton M, Toft A, Fairless R, Barnett SC. Olfactory ensheathing cell grafts have minimal influence on regeneration at the dorsal root entry zone following rhizotomy. Glia. 2004;47:150–167. doi: 10.1002/glia.20041. [DOI] [PubMed] [Google Scholar]
- Ruitenberg MJ, Vukovic J, Sarich J, Busfield SJ, Plant GW. Olfactory ensheathing cells: characteristics, genetic engineering, and therapeutic potential. J Neurotrauma. 2006;23:468–478. doi: 10.1089/neu.2006.23.468. [DOI] [PubMed] [Google Scholar]
- Silver J, Miller JH. Regeneration beyond the glial scar. Nat Rev Neurosci. 2004;5:146–156. doi: 10.1038/nrn1326. [DOI] [PubMed] [Google Scholar]
- Smith GM, Strunz C. Growth factor and cytokine regulation of chondroitin sulphate proteoglycans by astrocytes. Glia. 2005;52:209–218. doi: 10.1002/glia.20236. [DOI] [PubMed] [Google Scholar]
- Smith PM, Sim FJ, Barnett SC, Franklin RJM. SCIP/Oct-6, Krox-20 and desert hedgehog mRNA expression during CNS remyelination by transplanted olfactory ensheathing cells. Glia. 2001;36:342–353. doi: 10.1002/glia.1121. [DOI] [PubMed] [Google Scholar]
- Snow DM, Lemmon V, Carrino DA, Caplan AI, Silver J. Sulfated proteoglycans in astroglial barriers inhibit neurite outgrowth in vitro. Exp Neurol. 1990;109:111–130. doi: 10.1016/s0014-4886(05)80013-5. [DOI] [PubMed] [Google Scholar]
- Sommer I, Schachner M. Monoclonal antibodies (O1 to O4) to oligodendrocyte cell surfaces: an immunological study in the central nervous system. Dev Biol. 1981;83:311–327. doi: 10.1016/0012-1606(81)90477-2. [DOI] [PubMed] [Google Scholar]
- Takami T, Oudega M, Bates ML, Wood PM, Kleitman N, Bunge MB. Schwann cell but not olfactory ensheathing glia transplants improve hindlimb locomotor performance in the moderately contused adult rat thoracic spinal cord. J Neurosci. 2002;22:6670–6681. doi: 10.1523/JNEUROSCI.22-15-06670.2002. [DOI] [PMC free article] [PubMed] [Google Scholar]
- Wewetzer K, Verdu E, Angelov DN, Navarro X. Olfactory ensheathing cells and Schwann cells: two of a kind? Cell Tissue Res. 2002;309:337–345. doi: 10.1007/s00441-002-0607-y. [DOI] [PubMed] [Google Scholar]
- Wilby MJ, Muir EM, Fok-Seang J, Gour BJ, Blaschuk OU, Fawcett JW. N-cadherin inhibits Schwann cell migration on astrocytes. Mol Cell Neurosci. 1999;14:66–84. doi: 10.1006/mcne.1999.0766. [DOI] [PubMed] [Google Scholar]
- Wu VW, Nishiyama N, Schwartz J. A culture model of reactive astrocytes: increased nerve growth factor synthesis and reexpression of cytokine responsiveness. J Neurochem. 1998;71:749–756. doi: 10.1046/j.1471-4159.1998.71020749.x. [DOI] [PubMed] [Google Scholar]
- Xu XM, Guenard V, Kleitman N, Bunge MB. Axonal regeneration into Schwann cell-seeded guidance channels grafted into transected adult rat spinal cord. J Comp Neurol. 1995;351:145–160. doi: 10.1002/cne.903510113. [DOI] [PubMed] [Google Scholar]
- Yan Q, Johnson EM., Jr An immunohistochemical study of the nerve growth factor receptor in developing rats. J Neurosci. 1988;8:3481–3498. doi: 10.1523/JNEUROSCI.08-09-03481.1988. [DOI] [PMC free article] [PubMed] [Google Scholar]