

Abstract
To address questions of whether brain-derived neurotrophic factor (BDNF) released from active excitatory neurons acts locally only on GABAergic presynaptic terminals contacting these neurons or generally also on GABAergic terminals contacting other inactive neurons, we developed a single-cell gene knock-out method in organotypic slice culture of visual cortex of floxed BDNF transgenic mice. A biolistic transfection of Cre recombinase with green fluorescence protein (GFP) plasmids to layer II/III of the cortex resulted in loss of BDNF in a single neuron or a small number of neurons, which expressed GFP at 13–14 d in vitro. Analysis with in situ hybridization and immunohistochemistry confirmed that neurons expressing GFP lacked BDNF mRNA and protein, respectively. Analysis with immunohistochemistry using antibody against GABA synthesizing enzyme showed that the number of GABAergic terminals on the soma of BDNF knock-out neurons was smaller than that of neighboring control neurons. Morphological analysis indicated that there was no significant difference in the soma size and branch points and length of dendrites between the BDNF knock-out and control neurons. Recordings of miniature IPSCs (mIPSCs) showed that the frequency of mIPSCs of BDNF knock-out neurons was lower than that of control neurons, although the amplitude was not significantly different, suggesting the smaller number of functional GABAergic synapses on whole the BDNF knock-out neuron. The present results suggest that BDNF released from postsynaptic target neurons promotes the formation or proliferation of GABAergic synapses through its local actions in layer II/III of visual cortex.
Keywords: neurotrophin, BDNF, inhibitory synapse, GABAergic synapse, single-cell gene knock-out, visual cortex
Introduction
Brain-derived neurotrophic factor (BDNF) plays a crucial role in synaptic development and plasticity in the CNS (for review, see Bibel and Barde, 2000; Huang and Reichardt, 2001; Poo, 2001; Lu, 2003). In particular, BDNF was reported to regulate development of inhibitory synapses mediated by GABA. For example, BDNF promotes the phenotype differentiation and dendritic development of GABAergic neurons in the cerebral cortex (Ip et al., 1993; Nawa et al., 1993; Marty et al., 1996; Rutherford et al., 1997; Yamada et al., 2002; Jin et al., 2003; Kohara et al., 2003) and increases the density of inhibitory synapses or the size of inhibitory terminals of hippocampal and neocortical neurons (Vicario-Abejon et al., 1998; Bolton et al., 2000; Marty et al., 2000; Palizvan et al., 2004). Furthermore, an overexpression of BDNF accelerates maturation of GABAergic innervation in visual cortex (Huang et al., 1999) and enhances expression of GABA synthetic enzyme in GABAergic terminals in cultured hippocampal neurons (Ohba et al., 2005).
Because GABAergic neurons cannot produce BDNF by themselves (Ernfors et al., 1990; Cellerino et al., 1996; Rocamora et al., 1996; Gorba and Wahle, 1999), they are supposed to receive BDNF from other, excitatory neurons in an activity-dependent manner (Marty et al., 1997; Jin et al., 2003; Kohara et al., 2003). In the cerebral cortex, single GABAergic neurons are known to innervate many excitatory neurons through extensive axon branches (Fairen et al., 1984; Meinecke and Peters, 1987; Somogyi, 1998). Thus, there are two possible modes of action through which BDNF promotes formation or proliferation of GABAergic synapses: a global action on all GABAergic synaptic terminals from inhibitory neurons that receive BDNF from active, excitatory neurons or a local action only on individual GABAergic terminals directly connected to active excitatory neurons (see Fig. 10). Distinguishing between these two possibilities is fundamental to understanding the role of BDNF in the formation and operation of cortical inhibitory circuits.
Figure 10.
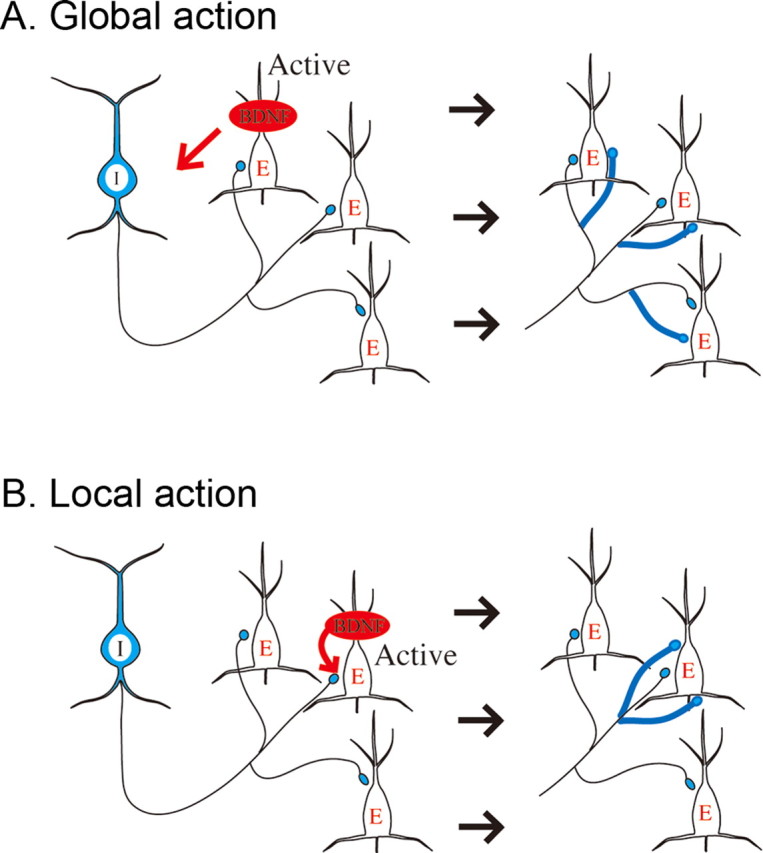
Two possible routes through which BDNF acts on inhibitory synapses. A, Global action of BDNF. BDNF increases the number of GABAergic synapses not only at active, excitatory neurons but also at other excitatory neurons innervated by the same GABAergic neuron. Blue fibers and terminals boutons represent newly formed GABAergic synapses. B, Local action of BDNF. BDNF increases the number of GABAergic synapses only at an active, excitatory neuron. Other conventions are the same as in A. I, Inhibitory; E, excitatory.
This question has not adequately been addressed previously, because the previous studies were performed with the diffuse application of exogenous BDNF or with the nonphysiological level of BDNF. To test the possibility of local actions of endogenous BDNF on GABAergic synapses at single excitatory neurons, it is also inappropriate to use preparations derived from conventional or even area-specific BDNF knock-out (KO) mice. In these preparations, all neurons in a given area of the cortex lack BDNF so that it is difficult to examine local actions of endogenous BDNF on inhibitory synapses at particular neurons.
To overcome these problems, we developed a single-cell gene knock-out method in organotypic slice culture of visual cortex, in which endogenous BDNF is lacking in a single cell or a small number of cells located in layer II/III of the cortex. We found that the formation or proliferation of functional GABAergic synapses at layer II/III neurons was impaired when there was no BDNF in these neurons, and such an effect was not observed in neighboring control neurons, suggesting that endogenous BDNF acts locally on GABAergic synapses contacting BDNF-producing neurons.
Materials and Methods
Organotypic slice culture.
The floxed BDNF transgenic mice (The Jackson Laboratory, Bar Harbor, ME) possessing loxP sites on both sides of exon 5 of BDNF gene that encodes mature BDNF protein (Rios et al., 2001) were used. The expression levels of BDNF and its high-affinity receptor TrkB in the cerebral cortex of these transgenic mice were not significantly different from those of wild-type mice (data not shown). The experimental procedures met the regulation of the Animal Care Committee of Osaka University Graduate School of Medicine. The animals at postnatal 3 or 4 d were anesthetized with ketamine (>30 mg/kg, i.p.) and decapitated, and brain slices (400 μm thick) were dissected from the posterior area of the cerebral cortex, corresponding to visual cortex and were cultured on Millicell membrane inserts (Millipore, Bedford, MA). Each well was filled with 1 ml of culture medium consisting of 25% HBSS, 25% horse serum, 50% minimum essential medium, and 0.65% glucose. Cytosine arabinoside (1 mm, 2.5 μl) was applied to each well at 2 d in vitro (DIV). The slices were kept in a humidified incubator at 37°C with a 5% CO2-enriched atmosphere, and half a volume of the medium was changed every 3 or 4 d. As control, cortical slices were prepared from wild-type mice (BALB/c; Japan Animals, Osaka, Japan) in the same way as above. In some experiments, 30 μg/ml anti-BDNF chicken antibody (Promega, Madison, WI) was applied to slices through the medium at 5 DIV and, at the time when the medium was changed, to block possible intercellular transfer of endogenous BDNF.
Plasmid cDNA and its biolistic transfection by gene gun.
The two kinds of plasmids were used: plasmids containing enhanced green fluorescent protein (GFP)–N1 (Clontech, Palo Alto, CA) and those containing CAG promoter and Cre recombinase with nuclear localized signals (Niwa et al., 1991, Kanegae et al., 1995). Slices were transfected with these plasmids using a Helios gene gun (Bio-Rad, Hercules, CA). Gene gun cartridges were prepared according to the reported methods (Wirth and Wahle, 2003). In brief, gold particles (1.6 μm diameter) were coated with the two kinds of plasmid DNAs at a ratio of 1 mg of gold to 1 μg of GFP plasmid and 2 μg of Cre recombinase plasmid, attached onto the inner wall of Tefzel tubing, and the tubes were cut into individual cartridges. Each cartridge contained ∼0.1 mg gold particles. At 4–5 DIV, gold particles were applied to the slices under 120–140 psi helium pressure. To avoid physical damages of slices and to reduce the amount of gold particles reached to neurons, nylon mesh was attached to the muzzle of gene gun.
In situ hybridization.
In situ hybridization for mRNAs of BDNF and GFP was performed as described previously (Schaeren-Wiemers and Gerfin-Moser, 1993; Morishita et al., 2004). In brief, the cultured slices were freshly frozen in the organotypic culture compound at 13–14 DIV and were cut in the thickness of 7 μm. The full-length cRNA probes of GFP were synthesized using T3/T7 RNA polymerase (Roche, Basel, Switzerland) and labeled with fluorescein. The BDNF cRNA probes labeled with digoxigenin were used (Genostaff, Tokyo, Japan). These two probes were hybridized to frozen sections. To amplify the digoxigenin signals, the probes were detected using an anti-digoxigenin antibody-conjugated alkaline phosphatase (1:1000; Roche) and nitro blue tetrazolium chloride (NBT)/5-bromo-4-chloro-3-indolyl phosphate toluidine salt (BCIP) (1:50; Roche). To amplify the fluorescein signals, the probes were detected using anti-fluorescein peroxidase (1:1000; Roche), the tyramide signal amplification plus 2,4-dinitro-phenyl (DNP) system (PerkinElmer, Wellesley, MA), and anti-DNP antibody conjugated with Alexa 488 (Invitrogen, Carlsbad, CA). The sense controls showed no hybridization signals (data not shown). Alkaline phosphatase staining by NBT/BCIP does not affect or quench the fluorescent signals of mRNAs (Gorba and Wahle, 1999; Tanaka and Ezure, 2004). The fluorescence and bright-field images were taken by a cooled CCD camera (DP50; Olympus, Tokyo, Japan) attached to an inverted fluorescence microscope (IX70; Olympus).
Immunohistochemistry.
For immunohistochemical staining, slices were fixed with 4% paraformaldehyde (Sigma, St. Louis, MO) in PBS for 2 h and washed with PBS at 13–14 DIV. Then they were penetrated by 0.3% Triton X-100 in PBS for 30 min and were incubated with 5 or 10% goat serum for blocking for 1 h. The first antibody, anti-GFP mouse or rabbit antibody (1:500; Invitrogen), anti-Cre mouse antibody (Covance Research Products, Berkeley, CA), anti-BDNF rabbit polyclonal antibody (1:100; provided by R. Katoh-Semba, Institute For Developmental Research, Aichi Human Service Center, Kasugai, Japan) (Katoh-Semba et al., 1997), and anti-glutamic acid decarboxylase (GAD) 65 mouse antibody (isotype, IgG2a; 1:500 or 1000; Chemicon, Temecula, CA) were applied at 4°C for 48 or 60 h. The secondary antibody, anti-mouse antibody conjugated with Alexa 488, 647 (1:200 or 300; Invitrogen), Alexa 546 (1:2000; Invitrogen), and anti-rabbit antibody conjugated with Alexa 488, 647 (1:200) were applied at 4°C for 24–48 h. Neurotracer 435 or 555 (1:50; Invitrogen) was used for fluorescence Nissl staining. In some experiments, anti-GABAA receptor mouse antibody (1:100; Chemicon) was used as primary antibody and treated without Triton X-100 to visualize surface GABAA receptors. The fluorescence images were captured on 1 μm focal plane of fluorescence by an inverted confocal microscope (LSM500; Zeiss, Oberkochen, Germany) or an upright confocal microscope (FV1000, Fluoview; Olympus). In part of the experiments, fixation of slices and subsequent procedures for BDNF immunostaining were made at 7, 10, and 11 DIV.
Analysis of the number of GAD65-positive boutons around soma.
GFP-positive neurons in cortical layer II/III were randomly selected at 13–14 DIV, and their fluorescence images were analyzed at the focus position in which the diameter of their somas were largest. Then, its neighboring neurons as controls were analyzed in the same way as above. In part of the experiments, biocytin (0.2%) was injected into fast-spiking cells, which were assumed to be GABAergic (Kawaguchi and Kubota, 1997; Markram et al., 2004) and to innervate both GFP-positive and neighboring control neurons. Then, the slices were fixed and stained with anti-GAD65 antibody, as mentioned above. The secondary antibody, anti-mouse IgG2a antibody conjugated with Alexa 647 (1:300; Invitrogen) and rhodamine avidin D (1:300; Vector Laboratories, Burlingame, CA) were applied at 4°C for 24–48 h, for visualization of GAD65 and biocytin, respectively. Neurotracer 435 (1:50; Invitrogen) was used for fluorescence Nissl staining. The z-stack fluorescence images were captured by the upright confocal microscope (FV1000; Olympus)
For analysis of the number of GAD65-positive boutons, GAD65 fluorescence images were binarized by the 2.5-fold level of the mean fluorescence intensity on the 2 × 2 μm square in the soma of neighboring control neurons. Secondary, the fluorescence images of Nissl-stained cortex were binarized by the twofold level of the mean fluorescence intensity of background, and the borderlines were traced. To count the number of perisomatic boutons, the borderlines were expanded to outside by 0.5 μm, unless otherwise mentioned. The binarized GAD65-positive boutons within the expanded borderlines were defined GAD65-positive terminals around the soma. To minimize an underestimation of the number of superposed boutons, boutons that had more than two peaks on the 3.5-fold level of the mean fluorescence intensity were defined as consisting of plural boutons. Tracing the borderlines and calculating the number of GAD65-positive boutons around soma were performed by luminavision (Mitani, Tokyo, Japan). In some experiments, such an analysis was performed in untransfected slices, which were fixed at 6, 9, 12, and 15 DIV and processed for GAD65 immunostaining. For analysis of the z-stack images, the images were saved as TIFF files and combined using MetaMorph software (Molecular Devices, Downingtown, PA). Then, the number of GAD65-positive boutons across the soma was calculated, as described above.
Analysis of dendritic morphology.
For morphological analysis of dendrites of BDNF-KO and adjacent control neurons, biocytin was injected into the control neurons. After having recorded fluorescent images, neurons were fixed overnight in 4% paraformaldehyde at 4°C and then rinsed in PBS for three times. After blocked overnight at 4°C in 10% goat serum and 1% Triton X-100, neurons were incubated with anti-GFP IgG (at 1:250 in PBS and 0.5% Triton X-100; Invitrogen) for 2–3 d, again rinsed in PBS for three times, and incubated in biotin-conjugated rabbit IgG (at 1:500 in PBS and 0.5% Triton X-100; Invitrogen) for 2–3 d. Then ABC kit (Vector Laboratories) and 3,3′-diaminobenzidine (Sigma) was used for visualization of biocytin and biotin. Neurolucida (MicroBrightField, Williston, VT) attached to an upright microscope (E600; Nikon, Tokyo, Japan) was used for drawing dendrites of neurons. The quantitative assessment of dendritic morphology was done with an analyzing software, Neuroexplore (MicroBrightField).
Electrophysiology.
To analyze miniature IPSCs (mIPSCs) in transfected neurons and their neighboring cells in layer II/III, whole-cell recordings were performed as described previously (Yasuda et al., 2003). Briefly, 8–10 d after transfection, cultured slices were superfused with the external solution containing the following (in mm): 119 NaCl, 2.5 KCl, 4 MgCl2, 4 CaCl2, 26.2 NaHCO3, 1 NaH2PO4, and 11 glucose (gassed continuously with 95% O2 and 5% CO2). To record mIPSCs, 10 μm 6-cyano-7-dinitroquinoxaline-2,3-dione (CNQX) and 50 μm d-2-amino-5-phosphonovaleric acid, in addition to 0.5 μm tetrodotoxin (TTX), were included in the external solution. Whole-cell recording pipettes (5–7 MΩ) were filled with the internal solution containing the following (in mm): 135–140 CsCl, 10 HEPES, 0.2 EGTA, 8 NaCl, 4 MgATP, and 0.3 Na3GTP, pH 7.2 with CsOH (osmolality adjusted to 280–290 mOsm). GFP-positive neurons were identified by fluorescence, and a pair of GFP-positive and its neighboring neurons were patched simultaneously under visual guidance (BX50WI; Olympus). Neurons were voltage clamped at −70 mV with a multiclamp amplifier (model 700; Molecular Devices, Palo Alto, CA), and input and series resistances were monitored continuously. Recordings of mIPSCs were performed at 2 kHz with Igor Pro software (WaveMetrics, Lake Oswego, OR). Usually, >300 consecutive events were collected and then analyzed with Mini Analysis software (Synaptosoft, Decatur, GA). All miniature events above a threshold value (5 pA) were included in the data analysis, and each event was verified visually. Mean amplitudes and frequencies of mIPSCs were calculated and statistically analyzed with paired t test otherwise mentioned.
Results
Single-cell gene knock-out in organotypic slice culture preparations
To investigate effects of a lack of local endogenous BDNF on the formation or proliferation of GABAergic synapses in visual cortex, we used organotypic slice cultures that were prepared from floxed BDNF transgenic mice, in which two loxP sites were inserted at both sides of BDNF gene (Fig. 1A). It is well known that bacteriophage P1-derived Cre mediates recombination and deletes the gene inserted between two loxP sites (Tsien et al., 1996). Thus, BDNF genes in neurons are expected to be knocked out when Cre recombinase is introduced in these neurons. Transfected neurons were marked with simultaneous introduction of GFP genes. To make the distribution of transfected neurons extremely sparse, nylon mesh was attached to the muzzle of gene guns. Usually, only one neuron that expressed GFP in the soma region and Cre in the nuclear region was detected among many neurons in a visual field under a microscope (112 × 112 μm, at an optimal slice of 30 μm thick), as shown in Figure 1, C and D.
Figure 1.

Biolistic transfection of GFP and Cre into a single cortical neuron. A, A schematic drawing showing that transfection of Cre– nuclear localized signal (NLS) induces a deletion of BDNF gene from neurons of floxed BDNF transgenic mice. Transfected neurons were marked with GFP fluorescence. B, An image of cortical slice, in which somas of many neurons were visualized in blue by fluorescent Nissl staining. Scale bar: (in B) B–D, 10 μm. C, An image of a transfected neuron that expresses GFP (green) in the soma and dendrites and Cre (yellow) in the nucleus. D, A superimposed image of B and C.
To confirm that GFP-positive cells did not express BDNF mRNA, we stained slices with double in situ hybridization of BDNF and GFP signals at 13–14 DIV (9–10 d after the transfection). As shown in Figure 2A–D, BDNF mRNA was not detectable in a neuron that expressed GFP mRNA (Fig. 2A–C, arrows). As expected, many control neurons located in the vicinity of the GFP-expressing neuron showed signals of BDNF mRNAs (Fig. 2B,C). That these signals actually represent the existence of mRNAs was confirmed by negative staining with BDNF sense probes (Fig. 2D). To further confirm that BDNF protein is not present in GFP-expressing neurons, slices were stained with immunohistochemistry using anti-BDNF antibody and anti-GFP antibody at 13–14 DIV. As shown in Figure 2E–H, the immunoreactivity to anti-BDNF antibody was not detected in a GFP-positive transfected neuron (G, H, arrows), although many GFP-negative neurons showed BDNF immunoreactivity.
Figure 2.

Absence of BDNF mRNA and deletion of BDNF protein in a GFP-positive cell. A, Fluorescent image of in situ hybridization of GFP mRNA. The arrow indicates a transfected neuron that expressed green signal. Scale bar: B–D, 10 μm. B, Image of in situ hybridization of BDNF mRNA. The arrow indicates that the cell that expressed GFP mRNA in A does not have BDNF mRNA. C, Superposed image of A and B. Note the deletion of BDNF mRNA in the cell with GFP mRNA. D, Control image of in situ hybridization by BDNF sense probe. E, Fluorescent image of Nissl staining (blue) of cortical slices. Scale bar: F–H, 10 μm. F, Fluorescent image of GFP-positive neuron (green), which was immunohistochemically stained with anti-GFP antibody. G, Fluorescent image of BDNF (red). Arrows indicate a GFP-positive transfected neuron. H, Superposed image of GFP and BDNF.
In part of the experiments, we tested when BDNF protein became undetectable after the transfection of Cre recombinase. For this, we stained slices in the same way as above at 7, 10, and 11 DIV, which corresponded to 3, 6, and 7 d after the transfection. At 7 DIV, all of the 21 GFP-positive cells showed BDNF immunoreactivity. At 10 DIV, only 5 of the 26 GFP-positive cells were immunoreactive, and, at 11 DIV, none of the 28 GFP-positive cells showed such immunoreactivity. Thus, BDNF protein became undetectable from the soma of transfected neurons at least 2–3 d before the time when slices were fixed for immunohistochemical analysis of GAD65-positive terminals or used for electrophysiological recordings of mIPSCs.
With both in situ hybridization and immunohistochemistry, we confirmed that the single-cell gene knock-out method of BDNF is applicable to organotypic slice culture preparations of mouse visual cortex.
Local reduction of GABAergic presynaptic terminals
To examine effects of the loss of endogenous BDNF in single neurons on the formation or proliferation of GABAergic synapses, we analyzed the distribution of GAD65-positive boutons with immunohistochemistry. GAD65 is known as a presynaptic marker of GABAergic synapses. In fact, almost all GAD65-positive boutons around the soma of cortical neurons were confirmed to be accompanied by GABAA receptors at the soma surface (data not shown). Also, axons of GABAergic neurons, in particular those of basket neurons, are known to terminate mostly on soma and bases of dendrites (perisomatic area) (Somogyi, 1998; Chattopadhyaya et al., 2004). Thus, GAD65-positive boutons in the perisomatic area were taken as a marker of inhibitory synapses. We also observed that most of the GAD65-positive boutons were colocalized with TrkB-positive puncta (data now shown).
To evaluate effects of the loss of BDNF on GABAergic synapses, we counted the number of GAD65-positive boutons in the somatic area of BDNF-KO cells and compared these values with those of the neighboring control cells that were innervated by the same GABAergic neurons. To confirm that the two neurons were innervated by the same GABAergic neuron, biocytin was injected into a fast-spiking neuron, which was assumed to be GABAergic (Kawaguchi and Kubota, 1997; Markram et al., 2004). Subsequently this biocytin-injected cell was confirmed to be GABAergic based on immunoreactivity to anti-GAD65 antibody. Representative results are shown in Figure 3. A GFP-positive, BDNF-KO cell (marked by square C) was contacted by axons of a large basket cell (marked by rectangle B), which was filled with biocytin (Fig. 3A). This biocytin-injected cell was GABAergic, because it was GAD65 positive (Fig. 3B). Each image in Figure 3C1–D2 represents a projection of a z-stack of stained images across the GFP-positive neuron (C1,C2) and a neighboring GFP-negative neuron (D1, D2), which were both innervated by axons of the same biocytin-injected basket cell. As seen in C1 and C2, the number of GAD65-positive boutons of the biocytin-injected neuron across the somatic area of the BDNF-KO neuron was only four, whereas the number of such boutons across the somatic area of the neighboring control neuron was 13 (D1, D2). In these images, GAD65-positive but biocytin-negative boutons were also seen in the soma area of the neurons. These boutons were probably derived from other GABAergic neurons. The total number of GAD65-positive boutons across the soma of the control neuron (22) was again larger than that (10) of the BDNF-KO neuron. We also counted the total number of GAD65-positive axonal boutons across the soma of the neurons that were located far (>200 μm) from the BDNF-KO neurons and outside the territory of neurites of the biocytin-injected neurons (image not shown, but see Fig. 3E,F, rightmost columns).
Figure 3.

Reduction of GABAergic presynaptic boutons across the soma of BDNF-KO neurons. A, Superposed image of a biocytin-injected cell (red) and a GFP-expressing cell (green). The former is a fast-spiking neuron, and the latter is a BDNF-KO neuron. Scale bar, 30 μm. B, Superposed image of the biocytin-injected cell stained immunohistochemically by anti-GAD65 antibody (yellow). Scale bar, 30 μm. C1, Superposed image of biocytin (red) and Nissl (blue) staining of the square C in A. Biocytin image was stacked on the Nissl image. C2, Superposed image of biocytin (red), Nissl (blue), and anti-GAD65 (yellow) staining of the same frame as C1. D1, Superposed image of biocytin (red) and Nissl (blue) staining of the frame shown as the square D in A. D2, Superposed image of biocytin (red), Nissl (blue), and anti-GAD65 (yellow) staining of the same frame as D1. E, Stack numbers of GAD65-positive boutons around the somas of BDNF-KO neurons and near- and far-located control neurons. Hatched columns indicate the stack number of both biocytin- and GAD65-positive boutons. The mean and SEM of the eight cells each. F, Area of the soma of the three groups of cells, as indicated. The mean and SEM of the eight cells each.
The quantitative data obtained from eight slices are shown in Figure 3, E and F. The stack numbers of GAD65- and biocytin-positive boutons across the somas of the BDNF-KO and nearby control neurons that were both innervated by the same GABAergic neurons were 4.1 ± 0.5/cell (mean ± SEM) and 11.5 ± 0.9/cell, respectively (Fig. 3E, hatched part of the left two columns). The difference between the two values was statistically significant (paired t test, p < 0.01). The total numbers of GAD65-positive boutons that included axon terminals of other GABAergic neurons were 12.1 ± 0.7/cell and 21.6 ± 1.1/cell, respectively, for the BDNF-KO and near-control cells. The difference between these two values was again statistically significant (paired t test, p < 0.01). The total number of GAD65-positive boutons across the somas of the eight far-located (>200 μm) neurons was 21.1 ± 1.0/cell. This value was nearly the same as the total number of GAD65-positive boutons across the soma of the near-control cells.
There is a possibility that such a small number of GABAergic boutons across the soma of the BDNF-KO neurons might be ascribable to the small size of their somas. To test this possibility, we measured the areas of the soma of the GFP-positive neurons and near-control neurons, which were both innervated by the same GABAergic neurons and those of the far-control neurons. As shown in Figure 3F, the mean value of the soma area of the former neurons (135 ± 13 μm2) was almost the same as those of the near- and far-control neurons (138 ± 13 and 136 ± 11 μm2, respectively).
As seen in Figure 3A, there is a high possibility that BDNF-KO cells and neighboring control cells are innervated at least in part by the same GABAergic neurons. To increase the number of analyzed cells in most of the experiments, we therefore counted the number of GAD65-positive boutons around the somas of BDNF-KO neurons and neighboring control neurons without biocytin injection into fast-spiking neurons. Without biocytin staining, GAD65-positive boutons in the soma area were sometimes seen vaguely because of superposition with stained soma. To avoid such ambiguity, we counted the boutons in the perisomatic region only at the single confocal section at the maximum diameter of each soma. As shown in Figure 4, the number of GAD65-positive boutons in the confocal section at the maximum diameter of the soma was proportional to that of the total number of z-stack of GABAergic boutons. The correlation between the two values was statistically significant (r = 0.715; n = 24; p < 0.001). In the subsequent analysis, therefore, we counted the number of perisomatic boutons in BDNF-KO and neighboring control neurons.
Figure 4.

Relationship between the stack and single-section numbers of the total GAD65-positive boutons around GFP-positive (filled circles), near-control (open circles), and far-control (open diamonds) cells, respectively. Near-control cells were innervated by the same GABAergic neurons as the corresponding GFP-positive cells. Dotted lines represent a regression line of the correlation diagram.
In this analysis, we also found that the number of GAD65-positive boutons around the soma of BDNF-KO neurons was reduced. An example obtained from these experiments is shown in Figure 5. It is seen that the number of GAD65-positive puncta around the soma of GFP-positive, BDNF-KO neurons was only three at the single plane (Fig. 5C, green arrows), whereas that around the soma of a neighboring GFP-negative neuron was six (Fig. 5C, white arrows). Such a difference in the number of GAD65-positive puncta was confirmed by the group analysis of the data obtained from 15 slices of transgenic mice (Fig. 5D). The mean number of GAD65-positive terminals at the soma of the 15 GFP-positive neurons was 4.7 ± 0.6/cell, whereas that of the neighboring neurons was 7.7 ± 1.4/cell. The difference between these two values was statistically significant (paired t test, p < 0.02). We also measured the area of the soma of the 15 GFP-positive neurons and neighboring GFP-negative neurons. As shown in Figure 5E, the mean value of the soma area of the former neurons (126 ± 10 μm2) was not significantly different from that of the latter neurons (130 ± 7 μm2).
Figure 5.

Reduction of GABAergic presynaptic terminals around the soma of BDNF-KO neurons. A, Fluorescent image of a GFP-expressing neuron (green). Scale bar: (in A), A–C, 10 μm. B, Fluorescent image of GAD65-positive presynaptic pucnta (red). C, Superposed image of A and B. Green and white arrows indicate GAD65-positve puncta around the soma of BDNF-KO and neighboring control neurons, respectively. D, Mean numbers of GAD65-positive puncta around soma of BDNF-KO and neighboring control neurons. Error bars indicate SEM. E, Mean area of soma of the BDNF-KO and neighboring control neurons.
There is another possibility that the biolistic transfection by gene guns and the overexpressions of GFP and Cre might have impaired the infected neurons so that the number of GAD65-positive boutons was reduced. To test this possibility, we further made the analysis in slices of wild-type mice, which were transfected with GFP cDNA and Cre recombinase using gene guns as in the slices of transgenic mice. In the slices obtained from wild-type mice, there was no significant difference in the number of GAD65-positive puncta around the soma between GFP-positive neurons and neighboring GFP-negative neurons (Fig. 6C, white vs green arrows). The group analysis indicated that the mean number of puncta of 18 GFP-positive neurons was 6.5 ± 1.6/cell, which was not significantly different from that (6.2 ± 1.3/cell) of the neighboring GFP-negative neurons. Also, the mean value of the soma area of GFP-positive neurons (129 ± 7 μm2) was not significantly different from that of near-control neurons (133 ± 6 μm2).
Figure 6.

No difference in the number of GABAergic presynaptic terminals around the soma between GFP-positive and -negative neurons of wild-type mice. A, Fluorescent image of a GFP-expressing neuron (green). Scale bar: B, C, 10 μm. B, Fluorescent image of GAD65-positive presynaptic puncta (red). C, Superposed image of A and B. Green and white arrows indicate GAD65-positve puncta around the soma of GFP-expressing and neighboring control neurons, respectively.
The results shown in Figures 3–6 suggest the following two possibilities: the deletion of endogenous BDNF in single neurons resulted in an impairment of the formation or proliferation of GABAergic synapses or in a loss of the once formed GABAergic synapses. To distinguish these two possibilities, we immunohistochemically stained untransfected cortical slices of transgenic mice with anti-GAD65 antibody at 6, 9, 12, and 15 DIV. As shown in Figure 7, the mean number of GAD65-positive boutons around the soma of neurons was 2.1 ± 0.3/cell at 6 DIV and increased almost linearly to 7.6 ± 0.5/cell at 15 DIV. These results suggest that the reduced number of GAD-positive boutons around the GFP-positive neurons in transfected slices may be ascribable to an impairment of the formation or proliferation of GABAergic synapses.
Figure 7.

Increase in the number of GABAergic synaptic terminals with days in vitro. The mean numbers of GAD65-positive puncta around the soma of neurons in the single confocal section are plotted at days in vitro indicated at the abscissa. The mean ± SEM values at 6, 9, 12, and 15 DIV are 2.1 ± 0.3, 4.1 ± 0.4, 6.2 ± 0.4, and 7.6 ± 0.5, respectively. The numbers of cells at each group are shown in parentheses.
Local reduction of functional inhibitory synapses
To examine whether the number of functional inhibitory synapses to BDNF-KO neurons was actually decreased or not, we recorded mIPSCs from both GFP-positive and -negative neu-rons at 13–15 DIV. The input resistance and resting membrane potentials were 421 ± 20 MΩ and −67.5 ± 3.2 mV for seven GFP-positive cells and 448 ± 38 MΩ and −66.4 ± 3.7 mV for five GFP-negative cells, respectively. These membrane properties were not significantly different between the two groups of cells. It is known that the frequency of mIPSCs is related to the total number of functional inhibitory synapses. We found that the frequency of mIPSCs in a GFP-positive, BDNF-KO neuron was very low compared with that of a GFP-negative neighboring neuron (Fig. 8A). In contrast, the amplitude of mIPSCs was not distinguishably different between the two groups of neurons. The group data from these two groups of neurons of transgenic mice are shown in Figure 8, C and D (left two columns of each). It is obvious that the mean amplitude of mIPSCs of seven BDNF-KO neurons (14.7 ± 2.4 pA) was not significantly different from that of neighboring control neurons (17.5 ± 2.7 pA), whereas the mean frequency of mIPSCs of the former neurons (7.5 ± 2.9/s) was significantly (p < 0.05, paired t test) lower than that of the latter neurons (17.0 ± 4.3/s). To exclude a possibility that such a change might be ascribable to the introduction of GFP and Cre recombinase into neurons, mIPSCs were recorded from slices obtained from wild-type mice, which were transfected with GFP cDNA and Cre recombinase (Fig. 8B). No obvious difference in the amplitude and frequency of mIPSCs was detected between GFP-positive and neighboring GFP-negative neurons. This was confirmed in the group analysis of the amplitude and frequency of both groups of neurons from wild-type mice (Fig. 8, C and D, right two columns of each). The mean amplitude and frequency of mIPSCs of 12 GFP-positive neurons (16.3 ± 1.5 pA and 19.3 ± 5.4/s, respectively) were not significantly different from those of GFP-negative neurons (14.9 ± 0.8 pA and 18.0 ± 5.3/s, respectively).
Figure 8.

Reduction in the frequency of mIPSCs of BDNF-KO neurons. A, Representative traces of mIPSC recordings from BDNF-KO and neighboring control neurons in visual cortex of a floxed BDNF transgenic (TG) mouse in the presence of CNQX and AP-5 and TTX. B, Representative traces of mIPSC recordings from GFP-expressing and neighboring neurons in visual cortex of a wild-type mouse in the presence of CNQX and AP-5 and TTX. C, Mean amplitudes of mIPSCs recorded from BDNF-KO and neighboring control neurons of floxed BDNF transgenic mice (first and second columns, respectively) and GFP-positive and neighboring neurons of wild-type (WT) mice (third and fourth columns, respectively). Error bars indicate SEMs. D, Mean frequencies of mIPSCs recorded from BDNF-KO and neighboring control neurons of floxed BDNF transgenic mice (first and second columns, respectively) and GFP-positive and neighboring neurons of wild-type mice (third and fourth columns, respectively). *p < 0.05, statistically significant difference (paired t test).
No difference in dendritic morphology between BDNF-KO and control neurons
To further test the possibility that BDNF-KO neurons might have poor dendrites so that the frequency of mIPSCs was lower than that of neighboring control neurons, we quantitatively analyzed the dendritic morphology of these two groups of neurons. As exemplified in Figure 9, A and B, the complexity of the dendritic arborization of the two groups of neurons seemed to be similar. This was confirmed by the quantitative analysis of the three parameters of dendrites. The mean total lengths of dendrites of the BDNF-KO and neighboring control neurons were 1302.9 ± 73.7 and 1325.2 ± 143.7 μm (n = 5 for each), respectively. The mean numbers of dendritic branch points of the two groups of neurons were 17.0 ± 3.3 and 17.6 ± 0.9, respectively. The mean numbers of primary dendrites of the two groups of neurons were 4.4 ± 0.7 and 4.2 ± 0.9, respectively. In any of these three parameters, there was no significant difference between the two groups of neurons (unpaired t test, p > 0.05).
Figure 9.

No difference in morphology of dendrites between BDNF-KO and neighboring control neurons. A, B, Images of a GFP-positive neuron that had no BDNF and a neighboring control neurons, respectively. Scale bar: (in A) A, B, 50 μm.
Discussion
Reduction in the number of GABAergic synapses on BDNF-KO neurons
In the present study, we demonstrated that the number of GABAergic presynaptic terminals on the soma of excitatory neurons in layer II/III of the visual cortex was reduced when these target neurons did not produce BDNF. This reduction in the number of presynaptic terminals was not ascribable to the possible shrinkage of the soma of the BDNF-KO neurons, because the size of their somas was not smaller than that of the neighboring control neurons (Figs. 3F, 5E).
GABAergic synapses are known to locate not only on soma but also on proximal dendrites and axon hillock of pyramidal neurons (Somogyi, 1998). In the present study, we did not observe GABAergic synapses on dendrites and axon hillock of pyramidal neurons, because it was difficult to visualize GABAergic presynaptic terminals on the whole dendritic tree and axon. Nevertheless, the present observations suggest that the number of functional GABAergic synapses on the whole BDNF-KO neuron was reduced, because the mean frequency of mIPSCs of BDNF-KO neurons was lower than that of neighboring control neurons. The reduction in the frequency of mIPSCs can be regarded as reflecting the decrease in the number of functional GABAergic synapses. There is a possibility, however, that such a reduction in the frequency might be attributable to the shrinkage of dendrites of the BDNF-KO neurons, because a previous study suggested a possibility for BDNF to regulate dendritic growth of excitatory neurons by autocrine loop (Kokaia et al., 1993; Miranda et al., 1993; Horch et al., 1999; Kohara et al., 2003). This possibility seems unlikely, however, because the numbers of primary dendrites and dendritic branch points and the total length of dendrites of BDNF-KO neurons were not significantly reduced from those of neighboring control neurons.
There is another possibility that the reduction of mIPSC frequency observed in the BDNF-KO neurons might be ascribable to alterations in release probability, because previous studies using cultured hippocampal neurons reported that the application of exogenous BDNF led to a higher paired-pulse depression, reflecting the increased vesicle depletion (Baldelli et al., 2002) and to an enhancement of GABA release probability (Baldelli et al., 2005). In solitary neurons cultured from visual cortex, however, it was reported that the application of BDNF did not change the paired-pulse ratio of evoked IPSCs but increased the frequency of mIPSCs (Palizvan et al., 2004). Although the observation of paired pulse ratio alone is not enough to conclude no involvement of presynaptic sites, there might be a regional difference in the BDNF action on the release probability of GABA between hippocampus and visual cortex. In summary, it seems reasonable to conclude that the reduced frequency of mIPSCs of BDNF-KO neurons may in part at least reflect the decreased number of GABAergic terminals around their somas.
Thus, the present morphological and physiological results suggest that the reduction in the number of GABAergic presynaptic terminals on the soma of BDNF-KO neurons reflect the decrease in the number of functional GABAergic synapses on the whole excitatory neuron.
Local action of endogenous BDNF
Because GABAergic neurons do not have mRNA of BDNF and, thus, do not produce BDNF by themselves (Ernfors et al., 1990; Cellerino et al., 1996; Rocamora et al., 1996; Gorba and Wahle, 1999), the transfer of BDNF from excitatory neurons that are known to produce BDNF (Yan et al., 1997; Friedman et al., 1998) may be crucial for development of GABAergic synapses. This transfer is suggested to be dependent on activity of excitatory neurons (Kohara et al., 2001). As mentioned in Introduction and seen in Figure 3A, the morphological observations that single GABAergic neurons in the cortex innervate many excitatory neurons through extensive axon branches raise two possibilities of modes of BDNF action: a global action on all GABAergic synapses innervated by single inhibitory neurons or a local action only on GABAergic synapses attaching to active excitatory neurons (Fig. 10). The present results that BDNF-KO neurons suffered from the reduction in the number of GABAergic synapses on their soma whereas neighboring control neurons did not show such a change suggest that the second possibility is more likely. If the first possibility were the case, GABAergic synapses on neighboring excitatory neurons also should have suffered from the reduction.
This suggestion seems consistent with the previous finding that the potentiating action of BDNF on Xenopus neuromuscular synapses in culture is spatially restricted to nearby synapses located very close to a BDNF application site (Zhang and Poo, 2002). It was further reported that the localized effect of BDNF requires protein synthesis within activated sites of presynaptic axons (Zhang and Poo, 2002). Thus, it seems possible to assume that the activated BDNF–TrkB signaling system in GABAergic presynaptic terminals contacting active excitatory neurons triggers protein synthesis machinery so as to locally proliferate GABAergic synapses.
The present results further suggest that locally released BDNF from target excitatory neurons might attract GABAergic growth cones and resulted in the increase in the number of GABAergic synapses, because exogenously applied BDNF was reported to attract axonal growth cones in vitro (Song et al., 1997; Ming et al., 2002; Li et al., 2005). Thus, a loss of retrograde transfer of BDNF from postsynaptic excitatory neurons might impair the formation of functional GABAergic synapses in layer II/III of visual cortex, because previous studies in hippocampal neurons suggested that BDNF transferred retrogradely from excitatory neurons to GABAergic neurons promotes dendritic growth of the latter neurons (Marty et al., 1996, 1997).
Functional significance of the local BDNF action
Because the release and transcellular transfer of BDNF are known to depend on neuronal activity (Goodman et al., 1996; Balkowiec and Katz, 2000; Hartmann et al., 2001; Kohara et al., 2001; Kojima et al., 2001; Lever et al., 2001; Gartner and Staiger, 2002), the proliferous action of BDNF on GABAergic synapses is assumed to be activity dependent. It is suggested that the maturation of GABAergic synapses regulates the beginning of the critical period during which visual cortical neurons are highly sensitive to an alteration in inputs (Hensch et al., 1998). Furthermore, an overexpression of BDNF induces a precocious critical period in mouse visual cortex probably through its action on GABAergic synapses (Hanover et al., 1999; Huang et al., 1999). Thus, it is possible to suggest that the activity-dependent action of endogenous BDNF on GABAergic synapses may promote their maturation so as to play a role in the onset of the critical period of the developing visual cortex.
Feasibility of the single-cell gene knock-out method
Finally, it is to be noted that the single-cell gene knock-out method used in the present study is a useful tool to elucidate a local action of a given bioactive molecule at the single-cell level. Although conditional knock-out systems using Cre-loxP and specific promoter have been developed to reveal functions of target proteins in a given brain region and/or at a given timing (Tsien et al., 1996; Minichiello et al., 1999; Iwasato et al., 2000; Xu et al., 2000a,b), it is difficult to elucidate a local action of the target protein on particular synapses of given neuronal circuits at the single-cell level. We previously developed “chimera cell culture” prepared from different type of transgenic mice to elucidate a transcellular action of a given molecule (Kohara et al., 2003). However, this method is applicable only to cell culture preparations, which lose laminated structures of the visual cortex. Conversely, with the present single-cell gene knock-out method in slice culture preparations, it is easy to make single neurons in which particular molecules are lacking in visually identifiable circuits. In fact, we successfully demonstrated that the formation or proliferation of GABAergic synapses is locally regulated by BDNF, which is produced in target neurons.
Footnotes
This study was supported in part by a Grant-in-Aid for Scientific Research from the Japan Society for the Promotion of Science (T.T.) and by Brain Science Foundation and Narishige Neuroscience Research Foundation, Japan (K.K.). We express many thanks to Dr. Hirofumi Morishita for helpful suggestions for the in situ hybridization and to Ritsuko Katoh-Semba for providing anti-BDNF antibody.
References
- Baldelli P, Novara M, Carabelli V, Hernandez-Guijo J-M, Carbone E. BDNF up-regulates evoked GABAergic transmission in developing hippocampal neurons by potentiating presynaptic N- and P/Q-type Ca2+ channel signaling. Eur J Neurosci. 2002;16:2297–2310. doi: 10.1046/j.1460-9568.2002.02313.x. [DOI] [PubMed] [Google Scholar]
- Baldelli P, Hernandez-Guijo J-M, Carabelli V, Carbone E. Brain-derived neurotrophic factor enhances GABA release probability and nonuniform distribution of N- and P/Q-type channels on release sites of hippocampal synapses. J Neurosci. 2005;25:3358–3368. doi: 10.1523/JNEUROSCI.4227-04.2005. [DOI] [PMC free article] [PubMed] [Google Scholar]
- Balkowiec A, Katz DM. Activity-dependent release of endogenous brain-derived neurotrophic factor from sensory neurons detected by ELISA in situ. J Neurosci. 2000;20:7417–7423. doi: 10.1523/JNEUROSCI.20-19-07417.2000. [DOI] [PMC free article] [PubMed] [Google Scholar]
- Bibel M, Barde YA. Neurotrophins: key regulators of cell fate and cell shape in the vertebrate nervous system. Genes Dev. 2000;14:2920–2935. doi: 10.1101/gad.841400. [DOI] [PubMed] [Google Scholar]
- Bolton MM, Pittman AJ, Lo DC. Brain-derived neurotrophic factor differentially regulates excitatory and inhibitory synaptic transmission in hippocampal cultures. J Neurosci. 2000;20:3221–3232. doi: 10.1523/JNEUROSCI.20-09-03221.2000. [DOI] [PMC free article] [PubMed] [Google Scholar]
- Cellerino A, Maffei L, Domenici L. The distribution of brain-derived neurotrophic factor and its receptor trkB in parvalbumin-containing neurons of the rat visual cortex. Eur J Neurosci. 1996;8:1190–1197. doi: 10.1111/j.1460-9568.1996.tb01287.x. [DOI] [PubMed] [Google Scholar]
- Chattopadhyaya B, Di Cristo G, Higashiyama H, Knott GW, Kuhlman SJ, Welker E, Huang ZJ. Experience and activity-dependent maturation of perisomatic GABAergic innervation in primary visual cortex during a postnatal critical period. J Neurosci. 2004;24:9598–9611. doi: 10.1523/JNEUROSCI.1851-04.2004. [DOI] [PMC free article] [PubMed] [Google Scholar]
- Ernfors P, Wetmore C, Olson L, Persson H. Identification of cells in rat brain and peripheral tissues expressing mRNA for members of the nerve growth factor family. Neuron. 1990;5:511–526. doi: 10.1016/0896-6273(90)90090-3. [DOI] [PubMed] [Google Scholar]
- Fairen A, DeFellipe J, Regidor J. Nonpyramidal neurons: General account. In: Peters A, Jones EG, editors. Cerebral cortex. Vol 1. New York: Plenum; 1984. pp. 201–245. Cellular components of the cerebral cortex. [Google Scholar]
- Friedman WJ, Black IB, Kaplan DR. Distribution of the neurotrophins brain-derived neurotrophic factor, neurotrophin-3, and neurotrophin-4/5 in the postnatal rat brain: an immnunocytochemical study. Neuroscience. 1998;84:101–114. doi: 10.1016/s0306-4522(97)00526-5. [DOI] [PubMed] [Google Scholar]
- Gartner A, Staiger V. Neurotrophin secretion from hippocampal neurons evoked by long-term potentiation-inducing electrical stimulation patterns. Proc Natl Acad Sci USA. 2002;99:6386–6391. doi: 10.1073/pnas.092129699. [DOI] [PMC free article] [PubMed] [Google Scholar]
- Goodman LJ, Valverde J, Lim F, Geschwind MD, Federoff HJ, Geller AI, Hefti F. Regulated release and polarized localization of brain-derived neurotrophic factor in hippocampal neurons. Mol Cell Neurosci. 1996;7:222–238. doi: 10.1006/mcne.1996.0017. [DOI] [PubMed] [Google Scholar]
- Gorba T, Wahle P. Expression of TrkB and TrkC but not BDNF mRNA in neurochemically identified interneurons in rat visual cortex in vivo and in organotypic cultures. Eur J Neurosci. 1999;11:1179–1190. doi: 10.1046/j.1460-9568.1999.00551.x. [DOI] [PubMed] [Google Scholar]
- Hanover JL, Huang ZJ, Tonegawa S, Stryker MP. Brain-derived neurotrophic factor overexpression induces precocious critical period in mouse visual cortex. J Neurosci. 1999;19(RC40):1–5. doi: 10.1523/JNEUROSCI.19-22-j0003.1999. [DOI] [PMC free article] [PubMed] [Google Scholar]
- Hartmann M, Heumann R, Lessmann V. Postsynaptic release of brain-derived neurotrophic factor induced by high frequency synaptic stimulation. EMBO J. 2001;20:5887–5897. doi: 10.1093/emboj/20.21.5887. [DOI] [PMC free article] [PubMed] [Google Scholar]
- Hensch TK, Fagiolini M, Mataga N, Stryker MP, Baekkeskov S, Kash SF. Local GABA circuit control of experience-dependent plasticity in developing visual cortex. Science. 1998;282:1504–1508. doi: 10.1126/science.282.5393.1504. [DOI] [PMC free article] [PubMed] [Google Scholar]
- Horch HE, Kruttgen A, Portbury SD, Katz LC. Destablization of cortical dendrites and spines by BDNF. Neuron. 1999;23:353–364. doi: 10.1016/s0896-6273(00)80785-0. [DOI] [PubMed] [Google Scholar]
- Huang EJ, Reichardt LF. Neurotrophins: roles in neuronal development and function. Annu Rev Neurosci. 2001;24:677–736. doi: 10.1146/annurev.neuro.24.1.677. [DOI] [PMC free article] [PubMed] [Google Scholar]
- Huang ZJ, Kirkwood A, Pizzorusso T, Porciatti V, Morales B, Bear MF, Maffei L, Tonegawa S. BDNF regulates the maturation of inhibition and the critical period of plasticity in mouse visual cortex. Cell. 1999;98:739–755. doi: 10.1016/s0092-8674(00)81509-3. [DOI] [PubMed] [Google Scholar]
- Ip NY, Li Y, Yancopoulos GD, Lindsay R. Cultured hippocampal neurons show responses to BDNF, NT-3, and NT-4, but not NGF. J Neurosci. 1993;13:3394–3405. doi: 10.1523/JNEUROSCI.13-08-03394.1993. [DOI] [PMC free article] [PubMed] [Google Scholar]
- Iwasato T, Datwani A, Wolf AM, Nishiyama H, Taniguchi Y, Tonegwawa S, Knopfel T, Erzurumlu RS, Itohara S. Cortex-restricted disruption of NMDAR1 impairs neuronal patterns in the barrel cortex. Nature. 2000;406:726–731. doi: 10.1038/35021059. [DOI] [PMC free article] [PubMed] [Google Scholar]
- Jin X, Hu H, Mathers P, Agmon A. Brain-derived neurotrophic factor mediates activity-dependent dendritic growth in nonpyramidal neocortical interneurons in developing organotypic cultures. J Neurosci. 2003;23:5662–5673. doi: 10.1523/JNEUROSCI.23-13-05662.2003. [DOI] [PMC free article] [PubMed] [Google Scholar]
- Kanegae Y, Lee G, Sato Y, Tanaka M, Nakai M, Sakaki T, Sugano S, Saito I. Efficient gene activation in mammalian cells by using recombinant adenovirus expressing site-specific Cre recombinase. Nucleic Acids Res. 1995;23:3816–3821. doi: 10.1093/nar/23.19.3816. [DOI] [PMC free article] [PubMed] [Google Scholar]
- Katoh-Semba R, Takeuchi IK, Semba R, Kato K. Distribution of brain-derived neurotrophic factor in rats and its changes with development in the brain. J Neurochem. 1997;69:34–42. doi: 10.1046/j.1471-4159.1997.69010034.x. [DOI] [PubMed] [Google Scholar]
- Kawaguchi Y, Kubota Y. GABAergic cell subtypes and their synaptic connections in rat frontal cortex. Cereb Cortex. 1997;7:476–486. doi: 10.1093/cercor/7.6.476. [DOI] [PubMed] [Google Scholar]
- Kohara K, Kitamura A, Morishima M, Tsumoto T. Activity-dependent transfer of brain-derived neurotrophic factor to postsynaptic neurons. Science. 2001;291:2419–2423. doi: 10.1126/science.1057415. [DOI] [PubMed] [Google Scholar]
- Kohara K, Kitamura A, Adachi N, Nishida M, Itami C, Nakamura S, Tsumoto T. Inhibitory but not excitatory cortical neurons require presynaptic brain-derived neurotrophic factor for dendritic development, as revealed by chimera cell culture. J Neurosci. 2003;23:6123–6131. doi: 10.1523/JNEUROSCI.23-14-06123.2003. [DOI] [PMC free article] [PubMed] [Google Scholar]
- Kojima M, Takei N, Numakawa T, Ishikawa Y, Suzuki S, Matsumoto T, Katoh-Semba R, Nawa H, Hatanaka H. Biological characterization and optical imaging of BDNF-GFP suggest an activity-dependent local release of BDNF in neurites of cultured hippocampal neurons. J Neurosci Res. 2001;64:1–10. doi: 10.1002/jnr.1080. [DOI] [PubMed] [Google Scholar]
- Kokaia ZJ, Bengson M, Matsis M, Kokaia M, Persson H. Coexpression of neurotrophins and their receptors in neurons of the central nervous system. Proc Natl Acad Sci USA. 1993;90:6711–6715. doi: 10.1073/pnas.90.14.6711. [DOI] [PMC free article] [PubMed] [Google Scholar]
- Lever IJ, Bradbury EJ, Cunningham JR, Adelson DW, Jones MG, McMahon SB, Marvizon JC, Malcangio M. Brain-derived neurotrophic factor is released in the dorsal horn by distinctive patterns of afferent fiber stimulation. J Neurosci. 2001;21:4469–4477. doi: 10.1523/JNEUROSCI.21-12-04469.2001. [DOI] [PMC free article] [PubMed] [Google Scholar]
- Li Y, Jia YC, Cui K, Li N, Zheng ZY, Wang YZ, Yuan XB. Essential role of TRPC channels in the guidance of nerve growth cones by brain-derived neurotrophic factor. Nature. 2005;434:894–898. doi: 10.1038/nature03477. [DOI] [PubMed] [Google Scholar]
- Lu B. BDNF and activity-dependent synaptic modulation. Learn Mem. 2003;10:86–98. doi: 10.1101/lm.54603. [DOI] [PMC free article] [PubMed] [Google Scholar]
- Markram H, Toledo-Rodrigues M, Wang Y, Gupta A, Silberberg G, Wu C. Interneurons of the neocortical inhibitory system. Nat Rev Neurosci. 2004;5:793–807. doi: 10.1038/nrn1519. [DOI] [PubMed] [Google Scholar]
- Marty S, Berninger B, Carroll P, Thoenen H. GABAergic stimulation regulates the phenotype of hippocampal interneurons through the regulation of brain-derived neurotrophic factor. Neuron. 1996;16:565–570. doi: 10.1016/s0896-6273(00)80075-6. [DOI] [PubMed] [Google Scholar]
- Marty S, Berzaghi MD, Berninger B. Neurotrophins and activity-dependent plasticity of cortical interneurons. Trends Neurosci. 1997;20:198–202. doi: 10.1016/s0166-2236(96)01026-0. [DOI] [PubMed] [Google Scholar]
- Marty S, Wehrle R, Sotelo C. Neuronal activity and brain-derived neurotrophic factor regulate the density of inhibitory synapses in organotypic slice cultures of postnatal hippocampus. J Neurosci. 2000;20:8087–8095. doi: 10.1523/JNEUROSCI.20-21-08087.2000. [DOI] [PMC free article] [PubMed] [Google Scholar]
- Meinecke DL, Peters A. GABA immunoreactive neurons in rat visual cortex. J Comp Neurol. 1987;261:388–404. doi: 10.1002/cne.902610305. [DOI] [PubMed] [Google Scholar]
- Ming GL, Wong ST, Henley J, Yuan XB, Song HJ, Spitzer NC, Poo MM. Adaptation in the chemotactic guidance of nerve growth cones. Nature. 2002;417:411–418. doi: 10.1038/nature745. [DOI] [PubMed] [Google Scholar]
- Minichiello L, Korte M, Wolfe D, Kuhn R, Unsicker K, Cestari V, Rossi-Arnaud C, Lipp HP, Bonhoeffer T, Klein R. Essential role for TrkB receptors in hippocampus-mediated learning. Neuron. 1999;24:401–414. doi: 10.1016/s0896-6273(00)80853-3. [DOI] [PubMed] [Google Scholar]
- Miranda RJ, Sorabji F, Torrand-Allerand D. Neuronal colocalization of mRNAs for neurotrophins and their receptors in the developing central nervous system suggests a potential for autocrine interactions. Proc Natl Acad Sci USA. 1993;90:6439–6443. doi: 10.1073/pnas.90.14.6439. [DOI] [PMC free article] [PubMed] [Google Scholar]
- Morishita H, Murata Y, Esumi S, Hamada S, Yagi T. CNR/Pcdhα family in subplate neurons, and developing cortical connectivity. NeuroReport. 2004;15:2595–2599. doi: 10.1097/00001756-200412030-00007. [DOI] [PubMed] [Google Scholar]
- Nawa H, Bessho Y, Carnahan Y, Nakanishi S, Mizuno K. Regulation of neuropeptide expression in cultured cerebral cortical neurons by brain-derived neurotrophic factor. J Neurochem. 1993;60:772–775. doi: 10.1111/j.1471-4159.1993.tb03216.x. [DOI] [PubMed] [Google Scholar]
- Niwa H, Yamamura K, Miyazaki J. Efficient selection for high-expression transfectants with a novel eukaryotic vector. Gene. 1991;108:193–199. doi: 10.1016/0378-1119(91)90434-d. [DOI] [PubMed] [Google Scholar]
- Ohba S, Ikeda T, Ikegaya Y, Nishiyama N, Matsuki N, Yamada MK. BDNF locally potentiates GABAergic presynaptic machineries: target-selective circuit inhibition. Cereb Cortex. 2005;15:291–298. doi: 10.1093/cercor/bhh130. [DOI] [PubMed] [Google Scholar]
- Palizvan MR, Sohya K, Kohara K, Maruyama A, Yasuda H, Kimura F, Tsumoto T. Brain-derived neurotrophic factor increases inhibitory synapses, revealed in solitary neurons cultured from rat visual cortex. Neuroscience. 2004;126:955–966. doi: 10.1016/j.neuroscience.2004.03.053. [DOI] [PubMed] [Google Scholar]
- Poo M-M. Neurotrophins as synaptic modulators. Nat Rev Neurosci. 2001;2:24–32. doi: 10.1038/35049004. [DOI] [PubMed] [Google Scholar]
- Rios M, Fan G, Fekete C, Kelly J, Bates B, Kuehn R, Lechan RM, Jaenisch R. Conditional deletion of brain-derived neurotrophic factor in the postnatal brain leads to obesity and hyperactivity. Mol Endocrinol. 2001;15:1748–1757. doi: 10.1210/mend.15.10.0706. [DOI] [PubMed] [Google Scholar]
- Rocamora N, Welker E, Pascual M, Soriano E. Upregulation of BDNF mRNA in the barrel cortex of adult mice after sensory stimulation. J Neurosci. 1996;16:4411–4419. doi: 10.1523/JNEUROSCI.16-14-04411.1996. [DOI] [PMC free article] [PubMed] [Google Scholar]
- Rutherford LC, DeVan A, Lauer HM, Turrigiano GG. Brain-derived neurotrophic factor mediates the activity-dependent regulation of inhibition in neocortical cultures. J Neurosci. 1997;17:4527–4535. doi: 10.1523/JNEUROSCI.17-12-04527.1997. [DOI] [PMC free article] [PubMed] [Google Scholar]
- Schaeren-Wiemers N, Gerfin-Moser A. A single protocol to detect transcripts of various types and expression levels in neural tissue and cultured cells: in situ hybridization using digoxigenin-labelled cRNA probes. Histochemistry. 1993;100:431–440. doi: 10.1007/BF00267823. [DOI] [PubMed] [Google Scholar]
- Somogyi P. Salient feature of synaptic organisation in the cerebral cortex. Brain Res Rev. 1998;26:113–135. doi: 10.1016/s0165-0173(97)00061-1. [DOI] [PubMed] [Google Scholar]
- Song HJ, Ming GL, Poo M-M. cAMP-induced switching in turning direction of nerve growth cones. Nature. 1997;388:275–279. doi: 10.1038/40864. [DOI] [PubMed] [Google Scholar]
- Tanaka I, Ezure K. Overall distribution of GLYT2 mRNA-containing versus GAD67 mRNA-containing neurons and colocalization of both mRNAs in midbrain, pons, and cerebellum in rats. Neurosci Res. 2004;49:165–178. doi: 10.1016/j.neures.2004.02.007. [DOI] [PubMed] [Google Scholar]
- Tsien JZ, Chen DF, Gerber D, Tom C, Mercer EH, Anderson DJ, Mayford M, Kandel ER, Tonegawa S. Subregion- and cell type-restricted gene knockout in mouse brain. Cell. 1996;87:1317–1326. doi: 10.1016/s0092-8674(00)81826-7. [DOI] [PubMed] [Google Scholar]
- Vicario-Abejon C, Collin C, McKay RDG, Segal M. Neurotrophins induce formation of functional excitatory and inhibitory synapses between cultured hippocampal neurons. J Neurosci. 1998;18:7256–7271. doi: 10.1523/JNEUROSCI.18-18-07256.1998. [DOI] [PMC free article] [PubMed] [Google Scholar]
- Wirth MJ, Wahle P. Biolistic transfection of organotypic cultures of rat visual cortex using a handheld device. J Neurosci Methods. 2003;125:45–54. doi: 10.1016/s0165-0270(03)00024-4. [DOI] [PubMed] [Google Scholar]
- Xu B, Gottschalk W, Chow A, Wilson RI, Schnell E, Zang K, Wang D, Nicoll RA, Lu B, Reichardt LF. The role of brain-derived neurotrophic factor receptors in the mature hippocampus: modulation of long-term potentiation through a presynaptic mechanism involving TrkB. J Neurosci. 2000a;20:6888–6897. doi: 10.1523/JNEUROSCI.20-18-06888.2000. [DOI] [PMC free article] [PubMed] [Google Scholar]
- Xu B, Zang K, Ruff NL, Zhang A, McConnell SK, Stryker MP, Reichardt LF. Cortical degeneration in the absence of neurotrophin signaling: dendritic retraction and neuronal loss after removal of the receptor TrkB. Neuron. 2000b;26:233–245. doi: 10.1016/s0896-6273(00)81153-8. [DOI] [PubMed] [Google Scholar]
- Yamada MK, Nakanishi K, Ohba S, Nakamura T, Ikegaya Y, Nishiyama N, Matsuki N. Brain-derived neurotrophic factor promotes the maturation of GABAergic mechanisms in cultured hippocampal neurons. J Neurosci. 2002;22:7580–7585. doi: 10.1523/JNEUROSCI.22-17-07580.2002. [DOI] [PMC free article] [PubMed] [Google Scholar]
- Yan Q, Rosenfeld RD, Matheson CR, Hawkins N, Lopez OT, Bennett L, Welcher AA. Expression of brain-derived neurotrophic factor protein in the adult rat central nervous system. Neuroscience. 1997;78:431–448. doi: 10.1016/s0306-4522(96)00613-6. [DOI] [PubMed] [Google Scholar]
- Yasuda H, Barth AL, Stellwagen D, Malenka RC. A developmental switch in the signaling cascades for LTP induction. Nat Neurosci. 2003;6:15–16. doi: 10.1038/nn985. [DOI] [PubMed] [Google Scholar]
- Zhang X-H, Poo M-M. Localized synaptic potentiation by BDNF requires local protein synthesis in the developing axon. Neuron. 2002;36:675–688. doi: 10.1016/s0896-6273(02)01023-1. [DOI] [PubMed] [Google Scholar]