

Abstract
Paraventricular hypothalamic (PVH) corticotropin-releasing hormone (CRH) neuroendocrine neurons mount neurosecretory and transcriptional responses to glycemic challenges [intravenous 2-deoxyglucose (2-DG) or insulin]. Although these responses require signals from intact afferents originating from hindbrain CA (catecholaminergic) neurons, the identity of these signals and the mechanisms by which they are transduced by PVH neurons during glycemic challenge remain unclear. Here, we tested whether the prototypical catecholamine, norepinephrine (NE), can reproduce PVH neuroendocrine responses to glycemic challenge. Because these responses include phosphorylation of p44/42 mitogen-activated protein (MAP) kinases [extracellular signal-regulated kinases 1/2 (ERK1/2)], we also determined whether NE activates ERK1/2 in PVH neurons and, if so, by what mechanism.
We show that systemic insulin and 2-DG, and PVH-targeted NE microinjections, rapidly elevated PVH phospho-ERK1/2 levels. NE increased Crh and c-fos expression, together with circulating ACTH/corticosterone. However, because injections also increased c-Fos mRNA in other brain regions, we used hypothalamic slices maintained in vitro to clarify whether NE activates PVH neurons without contribution of inputs from distal regions. In slices, bath-applied NE triggered robust phospho-ERK1/2 immunoreactivity in PVH (including CRH) neurons, which attenuated markedly in the presence of the α1 adrenoceptor antagonist, prazosin, or the MAP kinase kinase (MEK) inhibitor, U0126 (1,4-diamino-2,3-dicyano-1,4-bis[2-aminophenylthio]butadiene). Therefore, at a systems level, local PVH delivery of NE is sufficient to account for hindbrain activation of CRH neuroendocrine neurons during glycemic challenge. At a cellular level, these data provide the first demonstration that MAP kinase signaling cascades (MEK→ERK) are intracellular transducers of noradrenergic signals in CRH neurons, and implicate this transduction mechanism as an important component of central neuroendocrine responses during glycemic challenge.
Keywords: ERK1, ERK2, p44/42 MAP kinases, MEK, PVH, parvicellular, CRH, neuroendocrine, norepinephrine, catecholamine, α1 adrenoceptor, signal transduction, stress, hypoglycemia, stimulus–response coupling
Introduction
The principles of “stimulus–secretion coupling” and “stimulus–secretion–synthesis coupling” are fundamental neuroscientific concepts that elegantly conceptualize how peripheral neuroendocrine neurons coordinate afferent signals, peptide biosynthesis, and secretion (Douglas and Rubin, 1961; Eiden et al., 1984). However, it remains unclear how central neuroendocrine neurons, such as those in the paraventricular hypothalamic nucleus (PVH) that synthesize and release corticotropin-releasing hormone (CRH), couple afferent signals to specific transcriptional or secretory events. This is partly because CRH neurons receive signals from numerous afferent pathways, which are transduced into specific programs of peptide release and/or synthesis in a signal-dependent manner (Swanson, 1991; Watts, 2005). The chemical signals received by CRH neurons depend on the specific afferents activated by a stimulus and on circulating glucocorticoid levels (Watts, 2005). This complexity challenges efforts to determine precisely how a single homeostatic challenge generates functional linkages among the afferents it recruits, the chemical signals these release, and the signaling programs initiated in CRH neuroendocrine neurons for peptide synthesis/secretion. Identifying these linkages is critical for understanding principles of signal specificity; perturbing these linkages may complicate obesity, diabetes, and/or stress-related disorders (Muglia et al., 2000; Inouye et al., 2002; Müller et al. 2003; Balthasar et al., 2005).
Our laboratory examines such linkages during systemic metabolic challenge by evaluating how insulin or 2-deoxy-d-glucose (2-DG), a synthetic glycolysis inhibitor (Wick et al., 1957), triggers CRH synthesis/secretion in the rat. For example, Ritter et al., (2003) reported that hindbrain catecholaminergic (CA) neurons, which richly innervate the PVH, are absolutely required for full neuroendocrine responses to glycemic challenges. Specifically, selective CA deafferentation markedly reduced corticosterone release triggered by insulin/2-DG (but not that triggered by basal circadian mechanisms or forced-swim challenge) and prevented 2-DG from elevating PVH Crh expression. Thus, CA afferents are absolutely critical for delivering signals to CRH neurons during glycemic challenges, but are dispensable for daily corticosterone rhythms or corticosterone release during forced swim.
The necessity of CA afferents for CRH neuroendocrine responses to insulin/2-DG provides a unique opportunity in the intact animal to explore the cellular mechanisms that couple central neuroendocrine output to glycemic challenge. Because CA afferents contain many releasable chemical signals [epinephrine, norepinephrine (NE), neuropeptide Y, or galanin], we evaluated whether NE alone could reproduce CRH neuroendocrine responses to glycemic challenge.
Three sets of experiments show the following: first, that insulin and 2-DG trigger rapid PVH elevations of phosphorylated p44/42 mitogen-activated protein (MAP) kinases [phospho-extracellular signal-regulated kinases 1/2 (ERK1/2)]; second, that this response, along with other responses to insulin/2-DG, is reproduced by PVH-targeted NE microinjections. Finally, because we found quite broad and potentially confounding neural activation after these injections, we confirmed the PVH-targeted effects of NE using isolated hypothalamic slices maintained in vitro. In slices, NE recruited phospho-ERK1/2 in CRH and other PVH neurons through α1 adrenoceptor- and MAP kinase kinase (MEK)-dependent mechanisms. These studies are the first to identify noradrenergic ERK1/2 recruitment as an important signaling mechanism in CRH neuroendocrine neurons, and suggest its inclusion among neuroendocrine responses during glycemic challenges.
Abstracts of some of this work have been published previously (Khan and Watts, 2003, 2005a,b; Khan et al., 2006).
Materials and Methods
All animal procedures were performed in accordance with the National Research Council Guide for the Care and Use of Laboratory Animals and were approved by the Institutional Animal Care and Use Committees of the University of Southern California and the University of California at Riverside.
Experiment 1: systemic 2-deoxyglucose or insulin challenges
We have performed separate experiments using intravenous 2-DG or insulin challenges. Unless otherwise noted, similar procedures were conducted for both types of glycemic challenge.
Preparation of animals
Adult male Sprague Dawley rats [N = 7 for 2-DG experiments; N = 12 for insulin experiments; 350–450 g body weight (BW)] were maintained on a 12 h light/dark cycle (lights on at 6:00 A.M.), and ad libitum food and water. Each rat, under anesthesia (50% ketamine/25% xylazine/10% Ace-promazine dissolved in 0.9% sterile saline; delivered intramuscularly at 0.1 ml/100 g BW), was surgically fitted with jugular catheters as described previously (Khan and Watts, 2004), and allowed a 7 d recovery period. During this recovery period, their catheters were kept patent using heparinized saline, and they were repeatedly handled to accustom them to the testing procedures.
Glycemic challenges
On the test day, rats were gently removed from their cages, given a 1.0 ml/kg bolus injection through the catheter of 0.9% saline containing 250 mg/kg 2-DG (Sigma, St. Louis, MO), or 2 U/kg of purified pork insulin solution (Regular Iletin II; 100 U/ml stock; Eli Lilly, Indianapolis, IN), and returned to their cages. Each rat was given an intravenous bolus of anesthesia 5–6 min later (2-DG) or 30 min later (insulin). Control animals received intravenously 0.9% saline vehicle (1.0 ml/kg; for insulin experiments), or only anesthesia (2-DG experiments). Immediately after receiving anesthesia, rats were perfused transcardially with 100 ml of 0.1 m PBS, pH 7.4, followed by at least 300 ml of cold 4% paraformaldehyde buffered to pH 9.5 using sodium borate. Brains were postfixed for 12–48 h at 4°C in this same fixative, and then transferred to 0.2 m phosphate buffer containing 20% glycerol (2-DG group) or 12% sucrose (insulin group), in which they remained at 4°C before being frozen in hexane chilled over dry ice.
Tissue preparation and immunocytochemistry
Brains from both sets of glycemic challenge studies were cut into 20 μm coronal sections using the freezing stage of a sliding microtome, collected as eight one-in-eight series in cryoprotectant (50% 0.05 m sodium-phosphate buffer, 30% ethylene glycol, and 20% glycerol) and stored at −20°C. Table 1 lists all reagents used for immunofluorescence cytochemistry. Briefly, sections were rinsed with Tris-buffered saline (TBS) (pH 7.4; two to three rinses; 10 min each), and permeabilized with TBS containing 0.3% Triton X-100 (Triton) for 45–50 min. With additional rinses occurring between each step, sections were incubated sequentially in blocking, primary, secondary, and fluorophore solutions, each containing 2% (v/v) normal donkey serum (Chemicon, Temecula, CA) diluted in TBS. The primary solution contained a mixture of both primary antibodies (Table 1), and 0.1% (v/v) Triton was added to the secondary and fluorophore solutions. Superfrost slides with mounted sections were air-dried, coverslipped using 50% TBS/50% glycerol, sealed with nail polish, and stored at −20°C until confocal analysis was performed.
Table 1.
Reagents used for PVH immunocytochemistry
| Reagent | Antigen/conjugate | Host | Type | Source | Catalog no. | Lot no. | Incubation | Dilution |
|---|---|---|---|---|---|---|---|---|
| Immunoperoxidase reagents | ||||||||
| Primary | p44/42 MAP kinases a | Rb | Polyclonal IgG | CST | 9101 | 12, 13 b | 72 h, 4°C | 1:1000 |
| Secondary | Anti-rabbit IgG | Gt | Biotinylated | KPL | 71-00-30 | Varies | 2 h, RT | 1 part in 3 |
| Conjugate | Streptavidin | HRP conjugated | KPL | 71-00-38 | Varies | 1–1.5 h, RT | 1 part in 2 | |
| Chromagen | DAB | HistoMark Enhanced Black kit | KPL | 54-75-00 | Varies | 4 min, RT | 12% (v/v) c | |
| Immunofluorescence reagents | ||||||||
| Primary | p44/42 MAP kinases a | Ms | Monoclonal IgG | CST | 9106 | 8 d | 72 h, 4°C | 1:1000 |
| Secondary | Anti-mouse IgG e | Dk | Cy3 conjugated | Jackson | 715-165-150 | 65442 | 8–12 h, 4°C | 1:500 |
| Primary | CRH | Rb | Polyclonal IgG | W. Vale | C-70 | 72 h, 4°C | 1:4000 | |
| Secondary | Anti-rabbit IgG f | Dk | Biotinylated | Jackson | 711-065-152 | Varies | 6–8 h, RT | 1:500 |
| Conjugate | Streptavidin | Alexa 488 conjugated | Invitrogen | S-11223 | 37350A | 8–12 h, 4°C | 1:500 |
Rb, Rabbit; Gt, goat; Ms, mouse; Dk, donkey; CST, Cell Signaling Technology (Danvers, MA); KPL, Kirkegaard & Perry Labs (Gaithersburg, MD); Jackson, Jackson ImmunoResearch (West Grove, PA). W. Vale is at The Salk Institute (La Jolla, CA). Invitrogen is located in Carlsbad, CA.
aThe specific epitope recognized is for phosphoryl modifications of human p44/42 MAP kinases at Thr202 and Tyr404 (Thr183 and Tyr185 in rat ERK2). These antibodies recognize single bands on immunoblots, corresponding to ERK1 and ERK2, respectively (according to supplier's data).
bThese lots were assayed by the supplier in February 2002 and July 2002, respectively.
cFor 50 ml of solution, 5 ml of the kit's Enhanced Buffer and 1 ml of its DAB solution were used (thus, 6 ml for every 50 ml, or 12% final concentration). The remaining reagents were as follows: 1 ml of H2O2 and 43 ml of distilled H2O.
dThis lot was assayed by the supplier in August 2004.
eThis secondary was rabbit serum adsorbed.
fThis secondary was mouse serum adsorbed.
Experiment 2: central microinjection studies
Preparation of animals
Adult male Sprague Dawley rats (N = 18; 350–450 g BW) were maintained on a 12 h light/dark cycle (lights on at 6:00 A.M.), with ad libitum food and water. Under either pentobarbital (50 mg · kg−1 · ml−1, i.p.) or tribromoethanol (∼5 ml, i.p.) anesthesia, each rat was stereotaxically fitted with a unilateral, stainless-steel indwelling guide cannula [26 gauge; outer diameter (o.d.), 0.46 mm] targeted toward the PVH, using the general stereotaxic procedure described by Khan et al. (1999). With the incisor bar 3.3 mm below the ear bars, stereotaxic coordinates (Paxinos and Watson, 1998) were as follows: 6.8 mm anterior to the interaural line, 0.4 mm lateral to the midsagittal sinus, and either 6.4 or 7.2 mm ventral to the surface of the skull. Two dorsal–ventral (DV) coordinates were selected to optimize cannula placements so that the microinjector needle targeted tissue in the vicinity of the PVH without damaging the nucleus itself. For rats weighing >425 g, 0.1 mm was added to the anterior–posterior coordinate for every 25 g increment over this body weight. Animals were allowed to recover their presurgical BW, during which time they were repeatedly handled to adapt them to the central injection procedure.
Microinjection and blood collection procedures
All injections and perfusions were conducted between 10:00 A.M. and 2:00 P.M. On the test day, rats received an acute, 300 nl central microinjection of l(−)norepinephrine(+)-bitartrate salt monohydrate (“NE”) (FW 337.3; 40 nmol; Sigma; catalog #A9512) or sterile artificial CSF (aCSF) vehicle from 33 gauge stainless-steel injectors (o.d., 0.2 mm) connected to 10 μl Hamilton syringes via PE20 tubing. The aCSF solution (in mm: 147 Na+, 154.2 Cl−, 3.0 K+, 1.2 Ca2+, and 0.9 Mg2+, pH 7.4) was prepared using double-distilled water buffered with 1.0 mm potassium phosphate, and was filtered through 0.22 μm GS-type or 0.45 μm HV-type filters (Millipore, Bedford, MA). The NE solution was prepared immediately before the experiment without ascorbate stabilizer. Injector needles were designed for both DV placement groups (see above) so as to project beyond the cannulas to terminate either 7.8 or 7.6 mm ventral to the skull surface, respectively. Approximately 15–20 min after injection, conscious rats were killed by decapitation. Brains were immediately immersed in fixative as described below. Trunk blood was collected in chilled heparin- and EDTA-coated collecting vials for plasma corticosterone and ACTH determination, respectively.
Low-temperature fixation procedures and tissue preparation
We used a low-temperature, variable pH immersion fixation procedure (Khan and Watts, 2004), in which brains were immersed in a near-frozen slush consisting of 4% (w/v) freshly depolymerized paraformaldehyde buffered by 0.1 m sodium acetate (pH 6.0). After 6 h at 1–4°C, they were transferred to the same fixative, but now buffered by 0.1 m sodium borate, pH 9.5, for 3–6 d, and then placed in cryoprotectant consisting of 0.1–0.2 m phosphate buffer containing 20% glycerol for 24–48 h at 4°C. Brains were frozen using hexane cooled over dry ice, and sectioned through the PVH into six series of one-in-six, 20-μm-thick coronal sections, using the freezing stage of a sliding microtome. These series were then processed for either immunocytochemistry or in situ hybridization, as described below. One series was saved for Nissl (thionin) staining.
Immunoperoxidase histochemistry
Table 1 lists all antibodies and reagents used for immunoperoxidase cytochemistry. As detailed previously (Khan and Watts, 2004), the blocking step involved a 1 h, room temperature (RT) incubation of the freely floating sections in TBS, pH 7.4, containing 3% (w/v) bovine serum albumin (BSA) and 0.2% Triton. The primary and secondary antibodies, along with the streptavidin-HRP conjugate, were each diluted in TBS containing 3% BSA and 0.2% Triton. At least four to five washes (10 min each) were conducted between incubation steps. The final reaction was developed using the HistoMark Enhanced Black solution prepared using distilled water (Table 1). Reactions were visualized under bright-field optics to optimize staining, and were stopped by rinsing sections in cold TBS. Since our last report of experiments using HistoMark Enhanced Black solution (Khan and Watts, 2004), we have noticed that, whereas nuclear staining of antigens using this kit appears to be specific, the solution, in our hands, stains nucleoli nonspecifically (i.e., in the absence of antibody). This does not affect the results of our studies; we note this observation here simply to alert users of this kit.
In situ hybridization
In situ hybridization was performed using the following [35S]UTP-labeled cRNA probes, prepared and tissue hybridized as described previously (Watts and Sanchez-Watts, 1995; Kovacs and Sawchenko, 1996): (1) a 536 bp PvuII fragment complementary to the sequence within the single CRH intron; (2) a complement to a 2.1 kb region of the cDNA sequence coding for c-fos; and (3) a 700 bp cRNA probe to part of exon 1 and all of exon 2 of the pre-pro-Crh gene.
Quantitation and analysis of [35S]UTP-cRNA hybridization signal
After exposure to Microvision C x-ray film, hybridization signal levels within the PVH for CRH heterogeneous nuclear RNA (hnRNA) were analyzed quantitatively using IPLab Spectrum software coupled to a QImaging Micropublisher Color CCD Digital Camera (Scanalytics, Fairfax, VA). Using Nissl-defined subdivisions of the PVH, mean gray levels of the RNA hybridization signals were measured from images on Microvision C x-ray film as described previously (Watts and Sanchez-Watts, 1995; Watts et al., 1995; Tanimura et al., 1998). Mean gray values for NE-injected subjects were compared with their aCSF-injected controls using one-way ANOVA, with p < 0.05 considered as statistically significant.
Quantitation and analysis of phospho-ERK1/2 immunolabeling
Digital capture of selected PVH hemifields used for quantitative analysis was performed as described previously (Khan and Watts, 2004). The tissue section that matched closest to the PVH level containing the greatest concentration of CRH neuroendocrine neurons, which maps to level 26 of Swanson (1998), was selected for counting. Marked neurons were counted for the PVHmpd (medial parvicellular division of the PVH) of both hemifields and then pooled with counts from all other cases subjected to the same treatment condition. One-way ANOVA was performed to compare aCSF-injected and NE-injected groups, with p < 0.05 being regarded as statistically significant.
Qualitative evaluation of c-fos mRNA levels in the supraoptic nucleus and subfornical organ
The tissue series processed for c-fos mRNA hybridization signal was examined under dark-field illumination. All tissue sections containing the supraoptic nucleus (SO) were examined in aCSF- and NE-injected groups for the presence of silver grain clusters, and levels were scored as either absent (background) to low, moderate, or strong. The strongest labeling was invariably observed for NE-injected subjects, and the strongest of these cases was used as the upper limit for reference; scores were assigned relative to this reference. The levels of c-fos mRNA in the subfornical organ (SFO) were similarly examined for all subjects and rated accordingly. Bright-field illumination of the Nissl counterstain used on hybridized sections assisted in determinations of SO and SFO borders in cases in which hybridization signal was absent under dark-field illumination.
Histological analysis and mapping of microinjection sites
Considerations for analysis.
Histological analysis of microinjection sites in this study required careful considerations. First, since its demonstration nearly 50 years ago (Grossman, 1960), most studies of NE action in various hypothalamic regions (including the PVH) historically have involved measures of primarily hormonal or behavioral end points (e.g., food intake) rather than anatomical end points (e.g., histochemical measurements of molecules). Tissue for these and other central injection studies have been cut with a greater section thickness (as much as ∼100 μm) (Gillard et al., 1998) to ensure that as much of the complete cannula track and injection site remain within a single plane of section for easier histological analysis. In contrast, tissue in this study was cut into 20 μm coronal sections to increase resolution and to facilitate its processing for hybridization and immunocytochemistry. Because six one-in-six series of sections were collected, adjacent Nissl sections used to map the PVH injection sites were 120 μm apart. All injection sites fell within levels 25–27 of the PVH (Swanson atlas), which span a rostrocaudal distance of ∼480 μm (Swanson, 1998). Because the outer diameter of the injector was 200 μm, there were many sections per case that contained a portion of the needle track and injection site.
Second, animals from central injection studies are typically perfused transcardially with the guide cannula left implanted to better preserve the injection site. In contrast, our experiments required conscious decapitation of rats and for the cannula to be removed shortly thereafter; this resulted in injection sites that were more likely to reseal, especially in 20 μm sections. Finally, behavioral experiments are often of counterbalanced design, with each subject receiving multiple injections through the same cannula across several test days (Khan et al., 2004); this results in greater tissue damage at the site of injection. In the present study, each animal was injected only once and therefore displayed a less discernible scar.
Methods of analysis.
Microinjection sites were examined in three ways. First, sections of the Nissl-stained series for each case were examined for clear signs of a cannula track and/or a scar left by the injector tip. Second, for cases in which this was unclear, Nissl-counterstained sections from adjacent series processed for in situ hybridization were often helpful, especially when viewed under dark-field illumination. Finally, injection sites were also evident on occasion within tissue processed for immunocytochemistry. To ensure a careful and accurate mapping analysis, tissue for all subjects was analyzed on seven separate occasions, with each session involving slide and section annotations entered into a common Excel spreadsheet. During the course of these sessions, injection site assignments were refined as the observer became more accustomed to the appearance of the tissue in relation to fiducials provided by adjacent sections. Sites identified using these methods were plotted onto Adobe Illustrator maps of the Swanson atlas (1998), using multiple atlas levels when they were found in sections spanning more than one plane of section.
Radioimmunoassay
Plasma corticosterone and ACTH were measured in duplicate or triplicate unextracted samples from every animal using 125I-antigen-labeled double antibody RIAs for corticosterone (ICN Biochemicals, Costa Mesa, CA) and ACTH (DiaSorin, Stillwater, MN), all supplied in kit form. To increase sensitivity of the corticosterone assay, half volumes of all reagents were used and the percent total binding adjusted to ∼29%. The lower sensitivity limits were 5 ng/ml and 19 pg/ml for the corticosterone and ACTH assays, respectively. Plasma samples from all animals in this study were assayed together in single assays for each hormone.
Experiment 3: effects of NE, prazosin, and U0126 within hypothalamic slices in vitro
Acute slice preparation and drug applications
Slices were prepared as described previously (Hatton et al., 1980; Ponzio and Hatton, 2005). Briefly, 15 adult male Sprague Dawley rats (37–55 d of age) were decapitated, and brains were rapidly removed and placed in ice-cold oxygenated aCSF consisting of the following (in mm): 126 NaCl, 3 KCl, 1.25 NaH2PO4, 1.3 MgSO4, 10 d-glucose, 26 NaHCO3, 2.4 CaCl2, 5 MOPS (3-morpholinopropanesulfonic acid; FW 209.26), pH 7.4. Brains were placed ventral side up, blocked for slicing, and glued to a specimen holder of a vibratome. Gassed (95% O2/5% CO2), ice-cold aCSF bathed the brain blocks, and coronal hypothalamic slices containing the PVH (∼250–300 μm thick) were cut and placed in holding chambers containing gassed aCSF (RT) for 2–3 h. Usually, three to four slices were collected from each block, of which one slice contained the PVH. The level selected for this slice varied between animals, so we later confirmed whether the slice was cut at the correct level to include parvicellular PVH neuroendocrine neurons by examining the presence of CRH immunoreactivity (see below). Slices were transferred to experimental chambers held at 34°C and allowed to equilibrate for 1–1.5 h.
Three sets of experiments were performed (see Table 3). First, tissue slices from eight rats received a 10 min application of NE (100 or 200 μm in aCSF; see central injection experiments for product information), which was freshly prepared without ascorbate stabilizer just before use. These concentrations of NE have been used within acute hypothalamic slice preparations to reliably produce cellular responses from parvicellular and magnocellular paraventricular neurons identified electrophysiologically (Daftary et al., 2000; Chong et al., 2004; Gordon and Bains, 2005; Gordon et al., 2005). In addition, tissue slices from three rats were kept as controls in the aCSF bath and did not receive any treatment.
Table 3.
Summary of pharmacological effects in vitro
| Treatments | Total n | Phospho-ERK1/2 levels in parvicellular PVH |
|||
|---|---|---|---|---|---|
| − | + | ++ | +++ | ||
| Agonist only | |||||
| NE (100 μm) | 4 | 0 | 0 | 1 | 3 |
| NE (200 μm) | 4 | 0 | 0 | 0 | 4 |
| Control/antagonist | |||||
| aCSF | 3 | 3 | 0 | 0 | 0 |
| Prazosin (10 μm) + NE (100 μm) | 5 | 2 | 1 | 1 | 1 |
| U0126 (10 μm) + NE (100 μm) | 4 | 3 | 0 | 1 | 0 |
The numbers in this table denote the number of slices demonstrating parvicellular PVH phospho-ERK1/2 absence/presence, depending on the signal strength. −, Absent; +, low; ++, moderate; +++, strong.
Second, slices from four rats were treated with bath-applied prazosin hydrochloride [1-(4-amino-6,7-dimethoxy-2-quinazolinyl)-4-(2-furanylcarbonyl)piperazine hydrochloride] [Sigma; catalog #P7791; formula weight (FW), 419.9; final bath concentration, 10 μm from a 20 mm stock prepared in dimethyl sulfoxide] 30 min before receiving NE (100 μm). This concentration of prazosin reduces EPSPs triggered by 100 μm NE in putative parvicellular PVH neurons in vitro (Daftary et al., 2000). A lower concentration of NE (100 μm instead of 200 μm) was also used to avoid pharmacological “ceiling” effects (Grollman, 1958) that could prevent prazosin effects from being detected. The prazosin did not alter the pH of the bath (e.g., at 13.3°C, pH 7.48 before and after prazosin treatment).
Finally, slices from four rats were treated with the MEK inhibitor 1,4-diamino-2,3-dicyano-1,4-bis[2-aminophenylthio]butadiene (U0126) (Tocris Bioscience, Ellisville, MO; catalog #1144; batch 3A/73315; FW, 426.5; final bath concentration, 10 μm from a 50 mm stock solution freshly prepared in dimethyl sulfoxide) ∼30–40 min before receiving NE (100 μm). U0126, originally synthesized by Middleton and colleagues (Sausen et al., 1958), is highly selective for MEK1 and MEK2 isoforms (IC50, 60–70 nm) (Duncia et al., 1998; English and Cobb, 2002), and its inhibition of MEK is noncompetitive with respect to ATP and ERK substrates (Favata et al., 1998). Previous work has demonstrated the efficacy of 10 μm U0126 in acute hypothalamic slices (Meyer-Spasche and Piggins, 2004) and cultured hypothalamic neurons (Obrietan et al., 2002).
After the NE application period, all slices were placed in 2–4% paraformaldehyde/PBS (4°C) for at least 24–48 h before additional processing.
Immunofluorescence histochemistry
Slices underwent the same immunofluorescence protocol described above for perfusion-fixed tissue (see Experiment 1 and also Table 1), with primary incubation set up within a 24-well plate (one slice per well; each well with 1.0 ml of antibody solution). After slices were removed from fluorophore solution, they were rinsed briefly in TBS, and then cleared using a solution containing 50% glycerol and 50% TBS for at least 2 h (Teruyama and Armstrong, 2002). Slices were then prepared for confocal analysis as described below.
Mounting of tissue slices for microscopy
A cover glass “sandwich” was used to prepare the thick tissue slices for confocal microscopy. High vacuum silicone grease (Dow Corning, Midland, MI), backfilled into a 3 ml syringe fitted with a blunted 18 gauge needle, was applied as a thin line to the edges of a clean, number 1 type cover glass (24 × 40 mm; Richard-Allan Scientific, Kalamazoo, MI). A few drops of glycerol/TBS clearing solution (see above) were placed within the grease perimeter, and a taklon watercolor brush was used to align and flatten the slice within this perimeter. A second clean cover glass was placed gently on the slice until the grease line of the bottom glass was pressed firmly against the top cover glass. So arranged, the squeezed clearing solution spread to, and was contained within, the limits of the grease perimeter and the solution-covered surface of the tissue slice was pressed firmly against the cover glass. To facilitate viewing on the confocal microscope stage, each sandwich was adhered firmly to a conventional microscope slide with a small drop of water. This also permitted sandwiches to be removed gently from the slide using forceps and inverted to scan the other side of the slice.
Confocal microscopy
Tissue sections from experiment 1 and acute slices from experiment 3 were examined with a Zeiss LSM 510 Meta Confocal System equipped with an Axioplan 2 microscope (Carl Zeiss Microimaging, Thornwood, NY) and interfaced to a tunable 30.0 mW argon laser (488 nm line selected; 75% max output setting) and a 1.0 mW helium–neon laser (543 nm line). An HFT 488/543 main dichroic beam splitter deflected the laser lines onto the tissue slices, and the emitted light passed through the HFT and was split into separate channels by a secondary dichroic (Zeiss NFT 545). Long-pass emissions filters (LP505, LP560) were used to transmit light of appropriate bandwidth into the green and red channels, respectively. Below, details are provided about the imaging protocol we used to scan the acute tissue slices processed in experiment 3. These methods are generally similar to those used for thin tissue sections generated during experiment 1, except that z-axis analysis was not performed and flat-field conditions were more optimal.
Using the LSM 510 “multitracking” configuration, fields containing the PVH were selected under epifluorescence illumination based on the location of the third ventricle and the paraventricular pattern of Alexa 488-labeled CRH immunoreactivity. The z-axis image stacks were acquired in simultaneous, unidirectional scan mode as 1024 × 1024 pixel images using a Neofluor 40× dry objective [numerical aperture (NA), 0.75; working distance, 500 μm]. Scan speeds were usually set for a pixel time of 6.40 μs for both single images and z-axis image stacks. Pinhole settings were adjusted from 1.0 Airy unit to sacrifice resolution in favor of improved photodetection and to compensate for occasional suboptimal flat-field viewing conditions of the thick tissue slices. Care was taken to ensure pinhole settings were closely matched for slices from control and treated groups. For Z-stacks, optical sections (∼1–2 μm thick) were acquired through a depth of 20–40 μm; these were also flattened to generate single projections that were contrast- and brightness-adjusted using Zeiss confocal software, with the range indicator enabled to ensure that these adjustments did not unduly saturate or desaturate the image. High-power images were also obtained using 63 and 100× oil objectives (NA, 1.4 and 1.45, with working distances of 190 and 110 μm, respectively).
Immunocytochemistry controls
Four control procedures were performed. First, we have shown that rats subjected to halothane anesthesia exposure display marked elevations of immunoreactive phospho-ERK1/2 in the PVH (Khan and Watts, 2004). We used tissue from rats receiving this challenge to test whether the mouse and rabbit primary phospho-ERK1/2 antibodies listed in Table 1 stained their common epitope specifically. To this end, these antibodies were each preadsorbed with the immunogen provided by the supplier and used for immunofluorescence cytochemistry as described above. For both antibodies, preadsorption abolished virtually all immunostaining in the PVH (data not shown). Second, no phospho-ERK1/2 immunostaining was observed in sections incubated sequentially with one of the primary phospho-ERK1/2 antibodies and the incorrectly matched secondary antibody (i.e., rabbit primary with anti-mouse secondary and vice versa) (data not shown). Third, to verify that the phospho-ERK1/2 primary antibodies bind to a common epitope, we performed dual indirect immunofluorescence using these antibodies. Phospho-ERK1/2 immunoreactivity was found to be in colocalization within the PVH using the mouse and rabbit phospho-ERK1/2 antibodies (data not shown). Finally, to ensure that the absence of PVH phospho-ERK1/2 immunostaining we observed in prazosin- and U0126-treated slices did not result from a general loss of cell viability, we surveyed these slices for other regions that still displayed phospho-ERK1/2 immunoreactivity after having been exposed to these reagents. These regions, which were scanned with the confocal lasers using 10 and 20× objectives, are described in Results.
Image processing
All confocal images in this study are presented in two formats: (1) as images showing the original red and green color channels used during confocal scanning; and (2) as images with the red channel pseudocolored to magenta (with the original green channel still preserved). The second format is to help readers who have difficulty in differentiating single red or green images from the yellow colocalization signal they produce when merged. [The website by Masataka Okabe and Kei Ito, as referenced helpfully by Ross (2007), was a useful resource for accessing a free downloadable VischeckJ, version 1.0, plug-in for open source NIH ImageJ software, which was used to view our fluorescent images and perform simulations of their appearance to colorblind readers.]
In the magenta-green format, colocalized signal appears as shades ranging from gray to white instead of yellow to orange. Occasionally, the brightness and/or contrast of the images in this format were adjusted to accurately reflect the true colocalized signal. However, this gray-white signal often appeared indistinct in print medium (CMYK color space). For this reason, we have struck a balance between the two formats by providing the original red-green format in the print version of this study and the magenta-green format as supplemental material (available at www.jneurosci.org). Readers printing the supplemental figures containing magenta/green images should be aware that these figures are best viewed on screen in RGB color space.
Results
Experiment 1: systemic insulin and 2-deoxyglucose challenges
2-Deoxyglucose and insulin challenges trigger phospho-ERK1/2 elevations in CRH neurons
Figure 1 and supplemental Figure S1 (available at www.jneurosci.org as supplemental material) (in identically labeled panels) each show the PVH responses of rats subjected to intravenous 2-DG or insulin challenges. Relative to control subjects that received only anesthesia (A4), 2-DG challenge triggered robust phospho-ERK1/2 elevations in the parvicellular and magnocellular PVH within 5 min (A2, A6). A similar effect was observed with insulin, which triggered phospho-ERK1/2 elevations in the parvicellular PVH within 30 min (B2,B6). In contrast to animals receiving insulin, animals receiving only saline did not show appreciable phospho-ERK1/2 labeling in the PVH (B4). For both treatments, phospho-ERK1/2 immunostaining in the parvicellular PVH was observed in CRH-positive and non-CRH neurons, as evident from the multicolored pattern of immunoreactive signal, which ranged from red and green (single-labeled phospho-ERK1/2 and CRH, respectively) to orange and yellow (colocalized signal) (A7,B7). In the corresponding pseudocolored images, the multicolored colocalization signal ranged from gray to white (supplemental Fig. S1A7,B7, available at www.jneurosci.org as supplemental material).
Figure 1.

Intravenous 2-DG and insulin challenges trigger elevations in phospho-ERK1/2 in CRH neurons of the PVH. A1–A7 show single, unprojected confocal images of the PVH in the coronal plane from animals anesthetized and perfused ∼5 min after receiving only anesthesia (control; A4) or 250 mg/kg 2-DG (A1–A3, A5–A7). Similarly, B1–B7 are PVH images from animals perfused 30 min after receiving saline (control; B4) or a 2 U/kg bolus of insulin (B1–B3, B5–B7). A1 and A2, and B1 and B2, are single channel images showing CRH immunoreactivity (green) or phospho-ERK1/2 immunoreactivity (red), and the insets in each figure outline areas enlarged in A5 and A6, and B5 and B6, respectively. Colocalization of CRH with phospho-ERK1/2 in the PVH results in yellow-orange signal, as evident in A3 and B3 for the two challenges. The cellular distribution of the colocalized signals is more readily apparent at 40× magnification in A7 and B7, which are enlargements of the outlined boxes over the PVH shown in A3 and B3, respectively. Scale bars: (in B2) A1, A2, B1, B2, 100 μm; (in B3) A3, B3, 100 μm; (in B4) A4, B4, 100 μm; (inB6) A5, A6, B5, B6, 50 μm; (in B7) A7, B7, 50 μm. All molecule designations in the A panels apply to the corresponding B panels. Note that the fields of view captured in control images A4 and B4 are identical with those shown in A1, A2, and B1, B2, respectively. These data are also presented in pseudocolored form (supplemental Fig. S1, available at www.jneurosci.org as supplemental material).
Experiment 2: central microinjection studies
Microinjections were confined to rostrocaudal levels containing the PVH
Figure 2 shows the distribution of the histologically localized injection sites for all subjects, as mapped onto the atlas of Swanson (1998). All injections were confined to rostrocaudal levels 25–27 of the atlas. Injection sites clustered generally around one of two dorsoventral positions, either directly above the PVH (Fig. 2 B, level 26 sites), or more dorsally within the ventral thalamus (Fig. 2 C, level 27 sites). The final determinations of these injection sites, it must be noted, are conservative (and likely dorsal) estimates; often, it was difficult to see frank scars from the single injections (see Materials and Methods).
Figure 2.
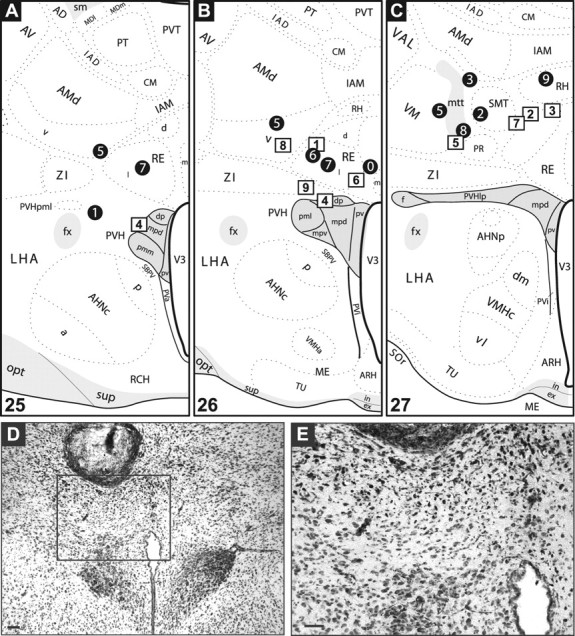
Summary of injection sites. A–C, NE and aCSF injection sites mapped onto plates adapted from the Swanson (1998) atlas. The black circles mark sites where NE was injected; the white squares mark aCSF injections. The numbers refer to individual cases discussed in the text (see Results). Injections were spread across three rostrocaudal levels of the hypothalamus containing the PVH (shaded in gray), which correspond to atlas levels 25 (A), 26 (B), and 27 (C). Note that injections for a particular subject were often visible across multiple atlas levels. Refer to the Swanson atlas for explanations of the abbreviations. D, E, Example of an injection site from case 7 of the NE-injected group (corresponds to black circle 7 in A and B). D shows a low-power view of the injection site, and the inset in D is magnified in E. Scale bars, 100 μm.
Two stereotaxic coordinates were chosen for the dorsoventral placement to help ensure that sufficient cases that had injections that target the PVH without damaging it were available. Consequently, only control case 4 (Fig. 2 A,B, levels 25 and 26, square 4) exhibited a needle track that terminated just within the PVH (as indicated by arrows in supplemental Fig. S2, A1 and A2; available at www.jneurosci.org as supplemental material). Because the PVH did not appear damaged, this case was still included in our analysis. Figure 2, D and E, shows an injection site for a mid-level PVH injection (mapped as circle 7 in Fig. 2 B) in more detail.
NE microinjection robustly elevates phospho-ERK1/2 in the PVH
Figure 3 compares the effects of aCSF and NE injections on cellular indices in the PVH for cases 1 (aCSF) and 7 (NE). Fifteen minutes after NE injection, phospho-ERK1/2 levels in the PVH were markedly elevated (Fig. 3 D) relative to aCSF control (Fig. 3 C). Note that this elevation is similar to that observed after 2-DG in experiment 1, in that most parvicellular and some magnocellular neurons appear labeled. This effect was consistent across all rostrocaudal cannula placements (for mapped cases at atlas levels 25 and 27, see supplemental Fig. S2, B2 and D2, respectively; available at www.jneurosci.org as supplemental material). An analysis of cell counts of phospho-ERK1/2-positive neurons within the PVH revealed significant effects of treatment (p < 0.05). Specifically, the NE-treated group displayed a significantly greater mean number of phospho-ERK1/2-immunostained neurons (272 ± 22) than did the control group (200 ± 11). These data also reflect how control animals displayed higher than expected levels of phospho-ERK immunostaining, probably as a result of handling effects. In support of this, phospho-ERK1/2 immunoreactivity is virtually absent in rats receiving intravenous saline in experiment 1 (Fig. 1 B4) that were anesthetized and perfused after systemic injections.
Figure 3.

A comparison of PVH cellular effects after PVH-targeted aCSF (left column, case 1) and NE injections (right column, case 7). These cases have been mapped to level 26 of the Swanson (1998) atlas (Fig. 2 B). Adjacent sections through the PVH are shown for each case, with phospho-ERK1/2 (C, D) detection performed by immunocytochemistry and c-fos mRNA (E, F), CRH hnRNA (G, H), and CRH mRNA (I, J) detected by in situ hybridization (see Materials and Methods). NE injection markedly increased levels of phospho-ERK1/2, c-fos mRNA and CRH hnRNA (D, F, H, respectively) relative to controls (C, E, G). In contrast, CRH mRNA levels were comparable for both groups (I, J). Scale bar, 100 μm (applies to all panels). For sites mapped to other atlas levels (i.e., levels 25 and 27), examples of injection effects are presented in supplemental Figure S2 (available at www.jneurosci.org as supplemental material).
NE microinjection rapidly elevates levels of c-fos mRNA and CRH hnRNA in PVH
NE treatment was accompanied by robust PVH elevations of c-fos mRNA (Fig. 3 F) and CRH hnRNA (Fig. 3 H), but not CRH mRNA (Fig. 3 J), which normally has a slow turnover rate and which was monitored in this experiment primarily as a means to locate parvicellular neuroendocrine neurons (and CRH hnRNA) in adjacent sections. Quantitation of the hybridization signal from the x-ray films revealed a significant difference of treatment on mean gray levels for the CRH hnRNA signal (Fig. 4), with NE-treated animals showing massive increases in this transcript within the parvicellular PVH (p < 0.005). Similarly, of the nine subjects receiving NE treatment, three showed moderate levels of PVH c-fos mRNA and the remaining six showed strong labeling for this marker. In contrast, all aCSF-treated subjects (n = 9) displayed c-fos mRNA signals that ranged from absent or just above background (n = 4) to moderate (n = 5). The c-fos mRNA signal was prominent in both parvicellular and magnocellular compartments (Fig. 3 F).
Figure 4.

Quantitation of CRH primary transcripts. Photographs of x-ray film showing primary CRH transcript (CRH hnRNA) hybridization signal in the PVH from a pair of subjects receiving PVH-targeted injections of either aCSF or NE. The green outlines enclose areas selected for quantitation, which correspond to the dorsal part of the medial parvicellular PVH. The graph to the right of these photos shows the average hnRNA signal across all subjects tested. The black and white bars in the graph correspond to the treatment assignments coded by the black and white squares in the photographs. Error bars indicate SEM.
In all cases, unilateral NE injection resulted in bilateral PVH elevations of c-fos mRNA, CRH hnRNA, as well as phospho-ERK1/2 (see above). Similar observations have been made by other investigators after NE injection in the PVH (Itoi et al., 1999; Cole and Sawchenko, 2002). Although the reason for the bilateral activation is not clear, NE may have produced this activation by diffusing to both sides of the PVH, or may have engaged known interconnections between both sides of the PVH (see Discussion).
NE microinjection is accompanied by rises in plasma ACTH and corticosterone
NE-treated rats mounted significant increases in circulating levels of ACTH and corticosterone relative to control rats. Specifically, whereas control rats displayed a mean plasma ACTH concentration of 262 ± 55 pg/ml, this value was 39% greater in NE-treated rats (430 ± 55 pg/ml; p < 0.05). For corticosterone, the control group displayed a mean plasma concentration of 254 ± 62 pg/ml, and NE-injected rats mounted levels that were 47% greater than this value (482 ± 42 pg/ml; p < 0.01). Animals injected with aCSF vehicle displayed baseline levels of ACTH and corticosterone that were higher than normal, probably as a result of handling during the time of central injection or during conscious decapitation. As noted above, this is also reflected in the phospho-ERK1/2 levels of control animals. With central injection procedures, higher than normal levels of these hormones have been previously reported in control animals (Cole and Sawchenko, 2002).
NE microinjection triggers increases in c-fos mRNA and phospho-ERK1/2 in SFO and SO
We evaluated the effects of NE injection in regions outside of the PVH. Although we observed activation of other brain regions after NE injection, such as many cortical and thalamic areas (data not shown), we focus here on the SO, because a previous study examining the effects of PVH-targeted NE injection reported observing marked elevations in bilateral Fos immunoreactivity in the SO (Cole and Sawchenko, 2002). In that study, Fos expression was observed with NE injections placed in the rostral, but not mid-level or caudal PVH. The authors attribute this effect to diffusion of their rostrally injected solution to the median preoptic nucleus. In our hands, NE injections were accompanied in most cases by strong elevations in phospho-ERK1/2 and c-fos mRNA in the SO and c-fos mRNA in the SFO (Table 2), confirming the observations of Cole and Sawchenko (2002). However, our injection site mapping analysis revealed no differences in the degree of SO labeling for either phospho-ERK1/2 or c-fos mRNA across any rostrocaudal level (data not shown), suggesting that SO activation does not appear to vary as a function of rostrocaudal injection placement.
Table 2.
Central injection effects on the SO and SFO in vivo
| End points | Strength of labeling across subjects |
|||||
|---|---|---|---|---|---|---|
| aCSF group (n = 9) |
NE group (n = 9) |
|||||
| −/+ | ++ | +++ | −/+ | ++ | +++ | |
| SO labeling | ||||||
| Phospho-ERK1/2 | 6 | 3 | 0 | 2 | 1 | 6 |
| c-fos mRNA | 9 | 0 | 0 | 0 | 1 | 8 |
| SFO labeling | ||||||
| c-fos mRNA | 9 | 0 | 0 | 2 | 2 | 5 |
The numbers in the table refer to the number of subjects displaying a particular level of labeling for a given end point. Note that these ratings reflect qualitative differences in intensity integrated over area. −/+, Absent or light; ++, moderate; +++, strong.
Figure 5 shows examples of activation for both of these regions, as evident from elevated levels of c-fos mRNA. There were marked elevations in c-fos mRNA in both the SO (Fig. 5 F) and SFO (Fig. 5 H) relative to the control tissue (Fig. 5 B,D, respectively), suggesting that secondary effects may have derived from the PVH-targeted NE injection. However, osmotic effects of the injection probably do not account for this activation, because the aCSF vehicle did not elicit the same level of response. Arguably, diffusion of the solution from the injection sites to these regions, by way of the ventricular circulation, may account for these effects. This is borne out by the c-fos mRNA data, which show low-to-moderate elevations of this marker in tissue immediately surrounding the lateral ventricles in NE- but not aCSF-injected rats (data not shown). Although a ventricular route cannot be discounted, it seems at least equally likely that NE injections may have activated circuits that involve SFO and SO neurons. The widespread thalamic and cortical activation we observed in NE-injected rats also supports the idea that secondary activation of circuits occurred.
Figure 5.

PVH-targeted NE, but not aCSF, triggers c-fos mRNA expression in the SO and SFO. A–D, aCSF control case. E–H, NE-injected case. In the control case, both the SO (B) and SFO (D) do not display c-fos mRNA. In contrast, NE injections trigger robust elevations of this transcript in both the SO (F) and SFO (H). Scale bars: (in F) A, B, E, F, 100 μm; (in H) C, D, G, H, 100 μm.
Experiment 3: effects of NE, prazosin, and U0126 within hypothalamic slices in vitro
NE triggers phospho-ERK1/2 elevations in CRH and non-CRH neurons in hypothalamic slices maintained in vitro
Results from experiment 2 demonstrate that secondary recruitment of neural circuits by NE must be considered when interpreting potential mechanisms engaged by central injections. We therefore determined whether NE leads to ERK1/2 phosphorylation in the PVH in the absence of distal connections to the PVH using hypothalamic slices maintained in vitro (Hatton et al., 1980). Figure 6 A shows a typical slice used in our experiments and Figure 6 B shows an enlarged view of the PVH and surrounding area. Even under bright-field illumination, the PVH is seen as a shadowed cluster of cellular elements flanking the third ventricle (within the dotted line border in Fig. 6 B). A blood vessel (probably an arterial or venous branch of the lateral chiasmatic or lateral hypothalamic vessel) (Ambach and Palkovits, 1979) was often seen coursing dorsomedially from the margin of the optic tract into the PVH (Fig. 6 B), and was a useful fiducial for determining the location of neurons in the PVH when switching between objectives during confocal imaging. It often appeared, together with other vessels, intensely immunostained in the red channel (see below).
Figure 6.

A, B, Example of a hypothalamic slice used in this study for evaluating NE actions on the PVH in vitro. A, A low-power view of a hemislice used in an early control experiment, with the area outlined by a rectangle shown in higher magnification in B. Note the locations of the fornix (f), third ventricle (3), as well as the faint presence of clustered cells that mark the location of the PVH, the outer boundary of which is estimated by the dashed line. In B, the arrowheads mark the course of a blood vessel entering the PVH, which originated from the upper margin of the optic tract (o) (A). Scale bars: A, 1 mm; B, 250 μm. These photographs were taken through the top cover glass of the “sandwich” holding the slice (see Materials and Methods). C–J, NE treatment triggers robust elevations in PVH phospho-ERK in coronal hypothalamic slices maintained in vitro. Single-plane, 10× (C, D) and 20× (E–J) confocal images of the PVH on one side of the midline are shown. Slices received either no treatment (Control, aCSF bath only; C–I) or 200 μm NE treatment (D–J) and were then fixed in 4% paraformaldehyde 10 min later. C and D show overlays of CRH immunoreactivity (green) and phospho-ERK1/2 immunoreactivity (red). Note that control cases show only blood vessel labeling in the red channel (C, arrow), whereas NE-treated cases show phospho-ERK1/2 in the PVH but not surrounding area (D). CRH immunoreactivity is sometimes apparent in neurites extending from PVH cell bodies (E, arrowheads), and phospho-ERK1/2 is seen in cell bodies of NE-treated slices (H), but not control slices (G). Colocalization of CRH and phospho-ERK1/2 appears in NE-treated slices (J) as colored signal ranging from yellow to orange, which is not evident in control slices (I). For some readers the colocalization signal is more apparent if red is pseudocolored to magenta; this can be seen in supplemental Figure S3 (available at www.jneurosci.org as supplemental material). The boxes in I and J outline regions analyzed through the z-axis, photomicrographs for which are shown in Figure 7, A and B, respectively. Scale bars: (in C) C, D, 100 μm; (in E) E–J, 50 μm. In D, f is fornix.
Table 3 summarizes the results of the in vitro procedures. Figure 6 and supplemental Figure S3 (available at www.jneurosci.org as supplemental material) highlight the staining results of our slice immunofluorescence procedure and the effects of NE treatment, showing the same PVH neurons at 10 and 20× magnifications. CRH immunoreactivity is evident in both control and treated slices (Fig. 6 E,F; supplemental Fig. S3B,F, available at www.jneurosci.org as supplemental material), providing confirmation of the presence of parvicellular PVH neurons. Occasionally, CRH immunoreactivity was also observed in neurites extending from immunostained somata (arrowheads in Fig. 6 E and supplemental Fig. S3B, available at www.jneurosci.org as supplemental material). In contrast to untreated slices (Fig. 6 G; supplemental Fig. S3C, available at www.jneurosci.org as supplemental material), bath application of 200 μm NE triggered pronounced elevations in phospho-ERK1/2 immunoreactivity within the PVH (Fig. 6 H; supplemental Fig. S3G, available at www.jneurosci.org as supplemental material). These elevations occurred within the CRH population, as evident from the yellow and orange dual-labeled neurons (Fig. 6 D,J), which appear in supplemental Figure S3, E and H (available at www.jneurosci.org as supplemental material), as grayish white-labeled neurons. However, a significant population of non-CRH neurons is also labeled; some of these are probably magnocellular neurons, because they extend laterally from the CRH region. The phospho-ERK1/2 and CRH colocalization is more readily apparent in higher magnification images of these neurons (see below). The results are consistent with what we observed in vivo after 2-DG injection in experiment 1 (Fig. 1 A3; supplemental Fig. S1A3, available at www.jneurosci.org as supplemental material) and after central NE injection in experiment 2 (Fig. 3 D), in which both parvicellular and magnocellular neurons displayed phospho-ERK1/2 immunoreactivity. Also, we confirmed that basal levels of phospho-ERK1/2, which are evident in some regions such as the piriform cortex, were also seen in the slices, showing that sites of phospho-ERK1/2 immunostaining in the slices reflect what has been observed ex vivo (Nadjar et al., 2005; A. M. Khan, unpublished observations). The ability of NE to trigger phospho-ERK1/2 in tissue slices maintained in vitro is also in keeping with previous reports of agonist-induced elevations in phospho-ERK1/2 immunoreactivity in such slices (Lesscher et al., 2003), as well as agonist-induced depolarization of parvicellular neuroendocrine PVH neurons, which reportedly requires ERK1/2 activities (Yuill et al., 2007).
In addition to phospho-ERK1/2 staining in PVH neurons, we also observed immunostaining in blood vessels using the red channel of the confocal microscope. This staining is evident in the control case shown in Figure 6, C and G (supplemental Fig. S3A,C, available at www.jneurosci.org as supplemental material), and to a lesser extent in the NE-treated slice in Figure 6 D (supplemental Fig. S3E, available at www.jneurosci.org as supplemental material). At present, it is unclear whether this staining represents specific phospho-ERK1/2 labeling and whether such staining is altered significantly by NE treatment. We note this staining here, however, because (1) there is at least one report documenting phospho-ERK1/2 staining on endothelial-like cells of blood vessels in brain tissue (Nadjar et al., 2005); (2) both phospho-ERK1/2 (Armstead, 2006) and NE (Raichle et al., 1975; Mulligan and MacVicar, 2004) have similarly directed vasoconstrictor actions on cerebral microvasculature; and (3) central noradrenergic fibers directly innervate blood vessels of the PVH (Swanson et al., 1977) and cortex (Cohen et al., 1997).
To verify that phospho-ERK1/2 immunoreactivity was absent in control slices, and not simply buried deeper in the slice, we generated image stacks at 40× through the z-axis of the slice, acquiring optical sections of 1 μm thickness through a depth of 20 μm. Importantly, these checks were performed with the investigator blind to the treatment condition. The outlined insets in Figure 6, I and J (supplemental Fig. S3D,H, available at www.jneurosci.org as supplemental material), each denoted by a “Z” in the top left corner, show the fields of neurons that were sampled in this manner, for control and treated groups, respectively. In control slices, this analysis did not reveal any neuronal phospho-ERK1/2 in the PVH at any level examined (Fig. 7 A and supplemental Fig. S4A, available at www.jneurosci.org as supplemental material). Specifically, optical sections through control slices revealed only CRH-immunostained neurons and portions of blood vessels. The presence of CRH immunoreactivity argues against the possibility that phospho-ERK1/2 was absent simply because of faulty immunostaining. Note that images were collected until CRH immunoreactivity was attenuated or no longer visible. Whether this was attributable to the confocal scans reaching the outer borders of the CRH-immunoreactive PVH, or reaching the limits of detection because of reduced antibody penetration is not clear. Therefore, to help mitigate the possibility that phospho-ERK1/2-immunoreactive neurons were located at deeper levels, we removed coverslip sandwiches from the microscope slide on which they were mounted, and inverted them to scan the other side. Phospho-ERK1/2 was not observed in any inverted control slice (data not shown).
Figure 7.

Confocal images through the z-axis of NE-treated slices reveals abundant colocalized signal through the depth of the slices. A, The PVH in control slices maintained in vitro does not display neuronal phospho-ERK1/2 labeling, as demonstrated here at four different Z-levels of a slice. The field selected corresponds to that outlined at lower magnification in Figure 6 I. The green staining marks CRH immunoreactivity within the slice, which was used to identify and locate the PVH for imaging. The red labeling shows blood vessel staining labeled by our phospho-ERK1/2 antibody, but no neuronal labeling of this marker is evident at any level. B, In contrast, CRH neurons in the NE-treated slice, shown at lower magnification in Figure 6 J, display robust phospho-ERK1/2 labeling. Specifically, the arrowheads mark the emergence of double-labeled neurons (yellow-orange) at each level that are not observed in the previous level. C, An orthogonal view of the NE-treated slice profiled in B. The Z-level for this optical slice is at −12.0 μm. The white crosshairs intersect over a double-labeled cell body. Note that this neuron is clearly apparent in the X–Z and Y–Z orthogonal panels above and to the right of the main panel, indicating that the colocalized signal is present through the full three-dimensional extent of this cell body. D, An enlarged view of the outlined region in C, showing a line scan that was performed on this double-labeled neuron. The two blue-colored circles mark the locations of signals plotted in E, which is a graph of signal intensity versus distance, showing the distribution of CRH (green) and phospho-ERK1/2 (red) signals along the length of the line scan. Note that the light blue circle, resting over a portion of the cytosolic compartment of the double-labeled cell body in D, corresponds to a region on the plot with especially intense signals for both channels. In contrast, the darker blue circle, which rests outside of any cell in D, marks low levels of signal that correspond to background intensity. Scale bars: (in B) A, B, 50 μm; C, 20 μm; D, 10 μm. Readers preferring to view these data in pseudocolored form may do so by referring to supplemental Figure S4 (available at www.jneurosci.org as supplemental material).
In contrast, phospho-ERK1/2 was observed in every optical section collected from NE-treated slices (Fig. 7 B and supplemental Fig. S4B, available at www.jneurosci.org as supplemental material), creating an “autumn leaves” appearance in the CRH neuron population. This effect, which reflected varying intensities of colocalized signal ranging from light yellow to dark orange (or grayish white in pseudocolor), was similar to the appearance of neurons displaying both CRH and phospho-ERK1/2 immunoreactivities after insulin or 2-DG challenges [compare Fig. 7 B and supplemental Fig. S4B (available at www.jneurosci.org as supplemental material) with Fig. 1, A7 and B7 or supplemental Fig. S1, A7 and B7 (available at www.jneurosci.org as supplemental material)]. Because the optical sections were thin enough (1 μm) for repeated sampling of the same neurons, we analyzed every sixth section for indications of newly visible neurons that were double-labeled, to confirm that unique neurons were detected throughout the depth of the CRH-immunoreactive field. As indicated by the arrowheads in Figure 7 B and supplemental Figure S4B (available at www.jneurosci.org as supplemental material), every sixth 1.0-μm-thick section yielded unique neurons not observed five levels earlier, demonstrating separable recruitment of multiple neurons across varying levels of depth in the CRH-immunoreactive field. As noted in Discussion, few regions with distal projections to the PVH were retained in our slices (e.g., the slices did not contain the suprachiasmatic nucleus, the bed nuclei of the stria terminalis, preoptic nuclei, or hindbrain regions), supporting the idea that NE acted locally to produce this recruitment of CRH neurons. A notable exception is the arcuate nucleus, which was present in a few of the treated slices. However, it is unlikely to account for NE action in our in vivo experiments, given its distal location from the site of injection.
Phospho-ERK1/2 immunoreactivity is mainly in the cytosolic compartment of CRH neuronal somata in acute hypothalamic slices treated with NE
Growing evidence indicates that, on stimulation, ERK1/2 can translocate from the cytoplasm to the nucleus (Cobb and Goldsmith, 2000; Pouysségur and Lenormand, 2003), where it can influence gene expression (Kim and Kahn, 1997; Brunet et al., 1999; Smith et al., 2004). Because, in the single-plane images we acquired, phospho-ERK1/2 immunoreactivity appeared to be mainly in the cytosol, we evaluated whether immunostained cell bodies displayed colocalized signal throughout the entire volume of their cytoplasmic compartment. To this end, we examined these neurons in the X–Z and Y–Z orthogonal planes. In Figure 7 C and supplemental Figure S4C (available at www.jneurosci.org as supplemental material), which show an image acquired at a depth of −12.0 μm, a dual-labeled cell body (targeted under the crosshairs in the X–Y plane in the main panel) was clearly visible in both orthogonal planes (the two smaller panels above and to the right of the main panel). Moreover, most of the colocalized signal was evident in the cytosolic compartment of these neurons in all three planes. A line scan across the outer margin of this neuron (which includes a portion of the cytosolic compartment) and over the tissue immediately lateral to it (Fig. 7 D; supplemental Fig. S4D, available at www.jneurosci.org as supplemental material) revealed a marked difference in signal intensity in both channels (red and green; or under pseudocolored conditions, magenta and green) for the immunostained cell body relative to the background signal. Specifically, as shown in the histograms for these channels in Figure 7 E (supplemental Fig. S4E, available at www.jneurosci.org as supplemental material), the cellular (mainly cytosolic) signal was approximately four times more intense than background levels.
To examine the subcellular compartmentalization of the phospho-ERK1/2 signal more clearly, images were captured under higher magnification using 63 and 100× oil objectives (the identically labeled panels in Fig. 8 and supplemental Fig. S5, available at www.jneurosci.org as supplemental material). Relative to untreated controls (A, G), NE-treated slices display considerable phospho-ERK1/2 immunoreactivity (D, J), which colocalizes with CRH immunoreactivity (arrowheads indicate double-labeled neurons in F and L). Although additional analysis is still required to determine whether nuclear signal is present at very low levels, visualization at these higher magnifications confirms that at least the majority of phospho-ERK1/2 immunoreactivity is detectable in the cytosolic compartment, but not the nucleus of CRH neurons (D, J). Thus, NE treatment may not lead to phospho-ERK1/2 nuclear translocation in these neurons, or if it does, it may do so at a different time point.
Figure 8.

Phospho-ERK1/2 elevations after NE treatment occur within neurons immunoreactive for CRH. Single-plane confocal images show tissue from slices assigned as controls (A–C, G–I) or treated with 200 μm NE (D–F, J–L). Each row shows three images of the same field, sorted according to color channel. A–F show images viewed through a 63× oil objective; G–L are images viewed through a 100× oil objective. Neurons with both CRH and phospho-ERK1/2 immunoreactivities appear yellow (F, L, arrowheads). Scale bars: (in A) A–F, 20 μm; (in G) G, J–L, 20 μm. Readers preferring to view these data in pseudocolored form may do so by referring to supplemental Figure S5 (available at www.jneurosci.org as supplemental material).
Prazosin markedly attenuates phospho-ERK1/2 elevations triggered by NE in vitro
To identify whether NE-induced phospho-ERK1/2 elevations required functional α1 adrenoceptors, we treated hypothalamic slices maintained in vitro with the α1 adrenoceptor antagonist, prazosin (10 μm), followed by bath application of NE (100 μm). This concentration of prazosin has been used in electrophysiological studies of putative parvicellular PVH neurons within the hypothalamic slice preparation (Daftary et al., 2000). Figure 9 B and supplemental Figure S6B (available at www.jneurosci.org as supplemental material) show that hypothalamic slices treated only with 100 μm NE displayed robust phospho-ERK1/2 immunoreactivity in the PVH, similar to that observed after treatment with 200 μm NE (e.g., as shown in Fig. 7 and supplemental Fig. S4, available at www.jneurosci.org as supplemental material). As with these cases, the lower concentration of NE also produced phospho-ERK1/2 that was often colocalized with CRH (see neurons marked by arrowheads in Fig. 9 C and supplemental Fig. S6C, available at www.jneurosci.org as supplemental material). In contrast, NE-treated slices that were first treated with prazosin displayed levels of phospho-ERK1/2 immunoreactivity that were either markedly attenuated or altogether absent (Fig. 9 E; supplemental Fig. S6E, available at www.jneurosci.org as supplemental material); this resulted in little to no frank colocalization of phospho-ERK1/2 and CRH (Fig. 9 F; supplemental Fig. S6F, available at www.jneurosci.org as supplemental material). Indeed, most neurons encountered during Z-series imaging, at 40 and 63×, and through a depth of 20–40 μm (depending on the slice), were labeled for CRH and not phospho-ERK1/2 (data not shown). Occasionally, however, magnocellular neurons in both control (“NE only”) and prazosin-treated slices displayed phospho-ERK1/2 immunoreactivity.
Figure 9.

Phospho-ERK1/2 elevations after NE treatment are attenuated in the presence of prazosin or U10126. Single-plane confocal images show tissue from slices receiving only NE treatment (100 μm) (A–C) or treated with 100 μm NE in the presence of either 10 μm prazosin (D–F) or 10 μm U0126 (G–I). Each row shows three images of an identical field within the parvicellular PVH at 100× magnification, sorted according to color channel: CRH (A, D, G), phospho-ERK1/2 (B, E, H), or the overlay of these channels (C, F, I). Neurons with both CRH and phospho-ERK1/2 immunoreactivities appear yellow in C (marked by arrowheads); this color is not evident under conditions in which prazosin or U0126 are used (E, F; H, I). Scale bar, 20 μm (applies to all panels). Readers preferring to view these data in pseudocolored form may do so by referring to supplemental Figure S6 (available at www.jneurosci.org as supplemental material).
U0126 markedly attenuates phospho-ERK1/2 elevations triggered by NE in vitro
A principal means of controlling ERK1/2 is through activation of the dual-specificity protein kinase MEK, which phosphorylates ERK1/2 at threonine and tyrosine residues (Cobb and Goldsmith, 1995). MEK activity, in turn, is known to be controlled by Raf kinase in many cells. Together, the Raf/MEK/ERK signaling cascade is considered a central signaling module that functions downstream of receptor tyrosine kinases and G-protein-coupled receptors (Cobb and Goldsmith, 1995; Della Rocca et al., 1997; Peyssonnaux and Eychène, 2001). Because MEK1 isoforms have been localized to PVH (Flood et al., 1998), we hypothesized that NE-induced recruitment of ERK1/2 may be mediated by activation of MEK. To test this, we pretreated hypothalamic slices with U0126, a highly selective MEK inhibitor (Duncia et al., 1998), and tested the ability of NE to trigger phospho-ERK1/2 under these conditions. As shown in Figure 9 H and supplemental Figure S6H (available at www.jneurosci.org as supplemental material), the effects of U0126 on phospho-ERK1/2 immunoreactivity were similar to those found for prazosin. Specifically, a pronounced attenuation of phospho-ERK1/2 immunoreactivity was evident in the CRH-immunoreactive field of the PVH in U0126-treated slices. Z-series analysis through the depth of the CRH-immunoreactive field revealed that phospho-ERK1/2 was virtually absent in U0126-treated tissue (data not shown). This resulted in an absence of any colocalized signal within CRH neurons, when compared with slices treated with NE alone (compare I, C in Fig. 9 or in supplemental Fig. S6, available at www.jneurosci.org as supplemental material).
Phospho-ERK1/2 elevations persist in other regions of prazosin- and U0126-treated slices
Although prazosin and U0126 significantly reduced NE-induced phospho-ERK1/2 immunostaining in the PVH, a key question was to what degree was this inhibition pharmacologically specific. To address this question, we surveyed each slice treated with these reagents for regions outside the PVH that displayed persisting phospho-ERK1/2 immunoreactivity. As shown in supplemental Figure S7, C and D (available at www.jneurosci.org as supplemental material), for slices pretreated with prazosin, robust phospho-ERK1/2 immunostaining was observed in a region that appears to correspond to the anteroventral part of the medial amygdala in the Swanson atlas (MEAav) (Swanson, 1998). This staining was mainly evident in fibers in this region, but a few immunoreactive cell bodies were also occasionally found. Notably, this immunostaining was comparable with that found in slices only treated with 100 μm NE (supplemental Fig. S7A,B, available at www.jneurosci.org as supplemental material). Additionally, the piriform cortex of prazosin-treated slices displayed significant phospho-ERK1/2 labeling (data not shown).
Slices treated with U0126 exhibited virtually no phospho-ERK1/2 labeling in any region examined, including the MEAav. Critical exceptions to this were neurons of the magnocellular PVH, which exhibited marked phospho-ERK1/2 immunoreactivity in U0126-treated slices (magenta channel; supplemental Fig. S7E,F, available at www.jneurosci.org as supplemental material). These neurons were judged to be magnocellular on the basis of their size, their lack of CRH immunoreactivity (supplemental Fig. S7F, green channel; available at www.jneurosci.org as supplemental material), and their location, which corresponded to the posterior magnocellular part of the PVH. The persistence of phospho-ERK1/2 in the magnocellular PVH suggests that the reduced phospho-ERK1/2 observed in the parvicellular PVH probably occurred as a result of a specific pharmacological action of U0126 on the MAP kinase signaling pathway, and not from a nonspecific effect of the drug on the entire tissue slice. Such an action is supported further by observations of a similar differential action of U0126 on the electrophysiological responses of cerebellar neurons in slices maintained in vitro (Ito-Ishida et al., 2006).
Discussion
We show that intravenous insulin and 2-DG challenges are associated with a rapid activation of parvicellular CRH neurons in the PVH that is reproduced faithfully by NE in vivo and in vitro. Our results constitute the first demonstration that the phosphorylated forms of p44/42 MAP kinases (phospho-ERK1/2) are elevated robustly both by glycemic challenges and NE delivery to the PVH. We also show that this rapid elevation requires both functional α1 adrenoceptors and MEK activity, and coincides with elevations of CRH hnRNA, c-fos mRNA, and circulating ACTH and corticosterone, which also increase during insulin or 2-DG challenges. Thus, NE recapitulates all hypothalamic–pituitary–adrenal (HPA) responses to glycemic challenges, implicating it as an important endogenous initiator of these responses. Moreover, NE activation of PVH ERK1/2 can be considered part of this repertoire of coincident, stereotyped neuroendocrine responses to glycemic challenges.
Phospho-ERK1/2 tracks CRH neuron activation during glycemic challenges
Phosphorylation is a well established obligatory trigger of ERK1/2 catalytic activities (Ray and Sturgill, 1988; Anderson et al., 1990; Robbins et al., 1993), and phospho-ERK1/2 antibodies are invaluable for localizing activated ERK1/2 (Mandell, 2003). Phospho-ERK1/2, nearly absent in controls, was evident in CRH-immunoreactive neurons within 5 min of 2-DG injection, confirming previous observations (Khan and Watts, 2004). Because insulin triggered a similar response, ERK1/2 rapidly tracks various glycemic challenges. However, the precise CNS linkages between such challenges and CRH neuroendocrine end responses are unclear. Establishing these linkages requires, in part, identifying afferents signaling the PVH during glycemic challenge and the neurotransmitter(s) involved in such signaling.
Ritter et al. (2001) identified an essential afferent pathway by showing that selectively destroying PVH afferents originating from hindbrain CA cell groups impaired the feeding and PVH responses to 2-DG or insulin challenges (elevated CRH hnRNA, Fos mRNA, and circulating corticosterone) but not those occurring basally or from forced-swim challenge (Ritter et al., 2003). These lesions also impair PVH phospho-ERK1/2 responses to insulin (Rapp et al., 2006). Therefore, glycemic challenges require hindbrain CA afferents to engage the CRH neuroendocrine system. However, because it is unclear which signals contained in these afferents are involved (epinephrine, NE, neuropeptide Y, or galanin) (Sawchenko et al., 1985; Levin et al., 1987), we determined whether NE was one such signal.
PVH-injected NE recapitulates neuroendocrine responses to glycemic challenges
Our results using PVH-targeted NE confirm reports that it elevates CRH hnRNA and circulating ACTH/corticosterone (Itoi et al., 1999; Cole and Sawchenko, 2002) and extend these by demonstrating coincident elevations of c-fos mRNA and phospho-ERK1/2. Because these responses also occur after intravenous 2-DG and insulin (Ritter et al., 2003; Khan and Watts, 2004; Gorton et al., 2006; Rapp et al., 2006), our data show that NE is sufficient for recapitulating neuroendocrine responses to these glycemic challenges. Moreover, because hindbrain CA afferents are necessary for these responses (Ritter et al., 2001, 2003; Rapp et al., 2006), NE appears both sufficient and necessary for CRH neuroendocrine neurons to respond to glycemic challenges. Supporting this, local PVH or systemically delivered 2-DG trigger NE release in the PVH vicinity (McCaleb and Myers, 1982; Peinado and Myers, 1987; Nagatani et al., 1996). Importantly, however, this conclusion applies equally to epinephrine (E), because both NE injection and E activate identical receptors, and the critical CA afferents also contain E. Moreover, 2-DG preferentially triggers Fos expression in hindbrain E neurons, well known to project to the PVH (Ritter et al., 1998).
Interpreting the effects of central NE microinjection
Evidence for local PVH actions
Despite their varying dorsoventral placement, much evidence suggests that the NE injections acted directly in the PVH. First, our NE injections elevated circulating ACTH/corticosterone, confirming many reports (Szafarczyk et al., 1987; Leibowitz et al., 1988, 1989; Saphier and Feldman, 1989; Itoi et al., 1994, 1999; Helmreich et al., 2001; Cole and Sawchenko, 2002). Second, corticosterone elevations reportedly occur only from PVH-injected NE [with a small effect in dorsomedial hypothalamus (DMH)] and not from NE injected into surrounding areas (Leibowitz et al., 1989). Our corticosterone-producing injections were restricted to PVH (i.e., not DMH), suggesting a direct action of NE. Third, radiolabeled NE diffuses effectively to the PVH when delivered just dorsal to the nucleus, at locations comparable with our closest injection sites (Itoi et al., 1999; Cole and Sawchenko, 2002), implying that our larger injections likely reached the PVH (Myers, 1966, 1974).
Evidence for secondary recruitment of neural circuits
SFO and bilateral PVH/SO activation after unilateral NE injections strongly suggest that NE secondarily engaged afferents to these regions. Anatomical and functional interconnections between the two sides of the PVH, and/or between the PVH and SON, may account for their bilateral activation (Silverman et al., 1981; Belin et al., 1984; Belin and Moos, 1986; Saphier and Feldman, 1987; Boudaba and Tasker, 2006). Also, NE recruitment of PVH projections to hindbrain cell groups (Swanson and Kuypers, 1980; Sawchenko and Swanson, 1982; Schwanzel-Fukuda et al., 1984; van der Kooy et al., 1984) may, in turn, have engaged SO neurons via ascending relays (Raby and Renaud, 1989). SFO activation may have resulted from NE actions in the reuniens nucleus, which projects to the SFO (Lind et al., 1984) and lies just dorsal to the PVH, directly in the injection path. Clearly, interpreting central injection effects requires careful considerations about circuitry. Therefore, using hypothalamic slices, we isolated the PVH from distal regions and determined whether PVH phospho-ERK1/2 elevations produced by NE in vivo are reproducible in vitro.
NE triggers phospho-ERK1/2 elevations in the PVH in vitro
Unlike control slices, NE-treated slices displayed pronounced PVH phospho-ERK1/2 elevations within 10 min. Thus, viable PVH neurons in this preparation display MAP kinase responses that are indistinguishable from those observed ex vivo. As with systemic 2-DG and PVH-targeted NE injections, bath-applied NE triggered discrete ERK1/2 phosphorylation in magnocellular and parvicellular PVH, but not in regions in their immediate vicinity, showing that NE did not alter ERK1/2 phosphorylation nonspecifically. Supporting this, phospho-ERK1/2 immunostaining was not detectable in other regions of the slice where ERK1/2 is reportedly abundant, such as certain thalamic nuclei (Thomas and Hunt, 1993; Jacobowitz et al., 1996; Flood et al., 1998). Although local afferents cannot be excluded completely, these data, together with our in vivo results, suggest a local PVH site of action for NE, especially because no regions with long axonal projections to the PVH were retained in the slices that could account for the in vivo activation.
NE activation of ERK1/2 in the PVH requires functional α1 adrenoceptors and MEK activity
With prazosin pretreatment, NE-induced PVH ERK1/2 phosphorylation was profoundly impaired, demonstrating that NE activates α1 adrenoceptors to trigger this response. However, it is unclear where the critical α1 adrenoceptor activation occurs. CRH neurons, which receive synaptic contacts from CA afferents (Liposits et al., 1986a,b), express α1 adrenoceptor subtype mRNAs (Day et al., 1999) and could engage NE directly. However, in slice preparations similar to ours, most putative parvicellular PVH neurons recorded by Daftary et al. (2000) displayed increased EPSPs from NE acting indirectly at presynaptic glutamatergic terminals. Importantly, prazosin abolished this action, implicating presynaptic α1 adrenoceptors. Thus, ERK1/2 phosphorylation in the parvicellular PVH neuron may not couple directly to α1 adrenoceptors located on the neuron itself, although α1 adrenoceptor-mediated ERK1/2 activation does occur in several cell types (Zhong and Minneman, 1999; Vanhoose et al., 2002). Rather, other receptors in CRH neurons (perhaps glutamate receptors) may elevate phospho-ERK1/2 in these neurons directly (Bitner et al., 2006; Jia et al., 2006; Yuill et al., 2007). Our results using the MEK inhibitor, U0126, also show that these receptors may include those coupling to G-proteins or possessing intrinsic tyrosine kinase activity, because MEK activation, which drives ERK phosphorylation, often occurs downstream of such receptors (Cobb and Goldsmith, 1995; Della Rocca et al., 1997). Recent PVH work using the MEK inhibitor PD 98059 (2′-amino-3′-methoxyflavone) also supports this (Yuill et al., 2007).
Concluding remarks
This report is the first description of noradrenergic control of phospho-ERK1/2 within the parvicellular PVH neuroendocrine system, including CRH neurons. Specifically, exogenous NE triggers rapid PVH elevations of phospho-ERK1/2 in vivo and in vitro, which require functional α1 adrenoceptors and MEK activity. Although a causal relationship remains to be determined, phospho-ERK1/2 accumulation coincides with parvicellular PVH neurosecretory and transcriptional responses.
Critically, our in vitro experiments show that secondary effects we observed after NE injections (at least in terms of c-Fos mRNA accumulation), including the involvement of distal regions projecting to the PVH, cannot account for the PVH phospho-ERK1/2 produced by these injections. At a systems level, our data extend previous work showing that hindbrain-originating CA afferents to the PVH are essential relays conveying signals during glycemic challenge, and demonstrate that NE can serve as one such signal. NE is therefore a critical linkage within a gradually emerging model describing how signals detected by glucose-sensitive neurons in the hindbrain travel ultimately through a projection system that, among other locations, terminates within the PVH. Identifying NE as a candidate signal conveyed by these projections to CRH neuroendocrine neurons, and MAP kinases as rapid intracellular responders to NE, are important steps toward understanding principles of signal specificity for central neuroendocrine systems.
Footnotes
This work was supported by National Institute of Mental Health Grant 071108 (A.M.K.) and National Institute of Neurological Disorders and Stroke Grants 029728 (A.G.W.) and 009140 (G.I.H.). We thank Kimberly Rapp (University of Southern California) and Dr. Elizabeth Gillard (University of California, Riverside) for technical assistance, Drs. Samantha Butler and Michael Quick (University of Southern California) for providing the Zeiss CLSM, and Dr. Ryoichi Teruyama (University of Tennessee, Memphis, TN) for information about slice immunofluorescence. We also thank Dr. Harold Gainer (National Institutes of Health, Bethesda, MD) for generously allowing us the use of some of the facilities in his laboratory and Dr. Joel Hahn (University of Southern California) for valuable discussions. Dr. Joseph Majzoub (Harvard, Cambridge, MA) generously provided us the cDNA used to prepare the CRH probe.
References
- Ambach G, Palkovits M. The blood supply of the hypothalamus in the rat. In: Morgane PJ, Panksepp J, editors. Handbook of the hypothalamus. Vol 1. New York: Marcel Dekker; 1979. pp. 267–377. Anatomy of the hypothalamus. [Google Scholar]
- Anderson NG, Maller JL, Tonks NK, Sturgill TW. Requirement for integration of signals from two distinct phosphorylation pathways for activation of MAP kinase. Nature. 1990;343:651–653. doi: 10.1038/343651a0. [DOI] [PubMed] [Google Scholar]
- Armstead WM. Differential activation of ERK, p38, and JNK MAPK by nociceptin/orphanin FQ in the potentiation of prostaglandin cerebrovasoconstriction after brain injury. Eur J Pharmacol. 2006;529:129–135. doi: 10.1016/j.ejphar.2005.08.059. [DOI] [PubMed] [Google Scholar]
- Balthasar N, Dalgaard LT, Lee CE, Yu J, Funahashi H, Williams T, Ferreira M, Tang V, McGovern RA, Kenny CD, Christiansen LM, Edelstein E, Choi B, Boss O, Aschkenasi C, Zhang CY, Mountjoy K, Kishi T, Elmquist JK, Lowell BB. Divergence of melanocortin pathways in the control of food intake and energy expenditure. Cell. 2005;123:493–505. doi: 10.1016/j.cell.2005.08.035. [DOI] [PubMed] [Google Scholar]
- Belin V, Moos F. Paired recordings from supraoptic and paraventricular oxytocin cells in suckled rats: recruitment and synchronization. J Physiol (Lond) 1986;377:369–390. doi: 10.1113/jphysiol.1986.sp016192. [DOI] [PMC free article] [PubMed] [Google Scholar]
- Belin V, Moos F, Richard P. Synchronization of oxytocin cells in the hypothalamic paraventricular and supraoptic nuclei in suckled rats: direct proof with paired extracellular recordings. Exp Brain Res. 1984;57:201–203. doi: 10.1007/BF00231147. [DOI] [PubMed] [Google Scholar]
- Bitner RS, Nikkel AL, Otte S, Martino B, Barlow EH, Bhatia P, Stewart AO, Brioni JD, Decker MW, Moreland RB. Dopamine D4 receptor signaling in the rat paraventricular hypothalamic nucleus: evidence of natural coupling involving immediate early gene induction and mitogen protein kinase phosphorylation. Neuropharmacology. 2006;50:521–531. doi: 10.1016/j.neuropharm.2005.10.009. [DOI] [PubMed] [Google Scholar]
- Boudaba C, Tasker JG. Intranuclear coupling of hypothalamic magnocellular nuclei by glutamate synaptic circuits. Am J Physiol. 2006;291:R102–R111. doi: 10.1152/ajpregu.00795.2005. [DOI] [PubMed] [Google Scholar]
- Brunet A, Roux D, Lenormand P, Dowd S, Keyse S, Pouysségur J. Nuclear translocation of p42/p44 mitogen-activated protein kinase is required for growth factor-induced gene expression and cell cycle entry. EMBO J. 1999;18:664–674. doi: 10.1093/emboj/18.3.664. [DOI] [PMC free article] [PubMed] [Google Scholar]
- Chong W, Li LH, Lee K, Lee MH, Park JB, Ryu PD. Subtypes of α1- and α2-adrenoceptors mediating noradrenergic modulation of spontaneous inhibitory postsynaptic currents in the hypothalamic paraventricular nucleus. J Neuroendocrinol. 2004;16:450–457. doi: 10.1111/j.1365-2826.2004.01180.x. [DOI] [PubMed] [Google Scholar]
- Cobb MH, Goldsmith EJ. How MAP kinases are regulated. J Biol Chem. 1995;270:14843–14846. doi: 10.1074/jbc.270.25.14843. [DOI] [PubMed] [Google Scholar]
- Cobb MH, Goldsmith EJ. Dimerization in MAP-kinase signalling. Trends Biochem Sci. 2000;25:7–9. doi: 10.1016/s0968-0004(99)01508-x. [DOI] [PubMed] [Google Scholar]
- Cohen Z, Molinatti G, Hamel E. Astroglial and vascular interactions of noradrenaline terminals in the rat cerebral cortex. J Cereb Blood Flow Metab. 1997;17:894–904. doi: 10.1097/00004647-199708000-00008. [DOI] [PubMed] [Google Scholar]
- Cole RL, Sawchenko PE. Neurotransmitter regulation of cellular activation and neuropeptide gene expression in the paraventricular nucleus of the hypothalamus. J Neurosci. 2002;22:959–969. doi: 10.1523/JNEUROSCI.22-03-00959.2002. [DOI] [PMC free article] [PubMed] [Google Scholar]
- Daftary SS, Boudaba C, Tasker JG. Noradrenergic regulation of parvocellular neurons in the rat hypothalamic paraventricular nucleus. Neuroscience. 2000;96:743–751. doi: 10.1016/s0306-4522(00)00003-8. [DOI] [PubMed] [Google Scholar]
- Day HE, Campeau S, Watson SJ, Jr, Akil H. Expression of α1b adrenoceptor mRNA in corticotropin-releasing hormone-containing cells of the rat hypothalamus and its regulation by corticosterone. J Neurosci. 1999;19:10098–10106. doi: 10.1523/JNEUROSCI.19-22-10098.1999. [DOI] [PMC free article] [PubMed] [Google Scholar]
- Della Rocca GJ, van Biesen T, Daaka Y, Luttrell DK, Luttrell LM, Lefkowitz RJ. Ras-dependent mitogen-activated protein kinase activation by G protein-coupled receptors. J Biol Chem. 1997;272:19125–19132. doi: 10.1074/jbc.272.31.19125. [DOI] [PubMed] [Google Scholar]
- Douglas WW, Rubin RP. Mechanism of nicotinic action at the adrenal medulla: calcium as a link in stimulus-secretion coupling. Nature. 1961;192:1087–1089. doi: 10.1038/1921087b0. [DOI] [PubMed] [Google Scholar]
- Duncia JV, Santella JB, III, Higley CA, Pitts WJ, Wityak J, Frietze WE, Rankin FW, Sun J-H, Earl RA, Tabaka AC, Teleha CA, Blom KF, Favata MF, Manos EJ, Daulerio AJ, Stradley DA, Horiuchi K, Copeland RA, Scherle PA, Trzaskos JM, et al. MEK inhibitors: the chemistry and biological activity of U0126, its analogs, and cyclization products. Bioorg Med Chem Lett. 1998;8:2839–2844. doi: 10.1016/s0960-894x(98)00522-8. [DOI] [PubMed] [Google Scholar]
- Eiden LE, Giraud P, Dave JR, Hotchkiss AJ, Affolter HU. Nicotinic receptor stimulation activates enkephalin release and biosynthesis in adrenal chromaffin cells. Nature. 1984;312:661–663. doi: 10.1038/312661a0. [DOI] [PubMed] [Google Scholar]
- English JM, Cobb MH. Pharmacological inhibitors of MAPK pathways. Trends Pharmacol Sci. 2002;23:40–45. doi: 10.1016/s0165-6147(00)01865-4. [DOI] [PubMed] [Google Scholar]
- Favata MF, Horiuchi KY, Manos EJ, Daulerio AJ, Stradley DA, Feeser WS, Van Dyk DE, Pitts WJ, Earl RA, Hobbs F, Copeland RA, Magolda RL, Scherle PA, Trzaskos JM. Identification of a novel inhibitor of mitogen-activated protein kinase kinase. J Biol Chem. 1998;273:18623–18632. doi: 10.1074/jbc.273.29.18623. [DOI] [PubMed] [Google Scholar]
- Flood DG, Finn JP, Walton KM, Dionne CA, Contreras PC, Miller MS, Bhat RV. Immunolocalization of the mitogen-activated protein kinases p42MAPK and JNK1, and their regulatory kinases MEK1 and MEK4, in adult rat central nervous system. J Comp Neurol. 1998;398:373–392. doi: 10.1002/(sici)1096-9861(19980831)398:3<373::aid-cne6>3.0.co;2-x. [DOI] [PubMed] [Google Scholar]
- Gillard ER, Khan AM, Grewal RS, Mouradi B, Wolfsohn SD, Stanley BG. The second messenger cAMP elicits eating by an anatomically specific action in the perifornical hypothalamus. J Neurosci. 1998;18:2646–2652. doi: 10.1523/JNEUROSCI.18-07-02646.1998. [DOI] [PMC free article] [PubMed] [Google Scholar]
- Gordon GRJ, Bains JS. Noradrenaline triggers multivesicular release at glutamatergic synapses in the hypothalamus. J Neurosci. 2005;25:11385–11395. doi: 10.1523/JNEUROSCI.2378-05.2005. [DOI] [PMC free article] [PubMed] [Google Scholar]
- Gordon GRJ, Baimoukhametova DV, Hewitt SA, Kosala WRA, Rajapaksha JS, Fisher TE, Bains JS. Norepinephrine triggers release of glial ATP to increase postsynaptic efficacy. Nat Neurosci. 2005;8:1078–1086. doi: 10.1038/nn1498. [DOI] [PubMed] [Google Scholar]
- Gorton LM, Bohland MA, Khan AM, Sanchez-Watts G, Donovan CM, Watts AG. Diurnal difference in HPA hormone responses to hypoglycemia is not a function of changing hypoglycemic thresholds. 66th Annual Meeting of American Diabetes Association; June; Washington, DC. 2006. Paper presented at. [Google Scholar]
- Grollman A. Pharmacology and therapeutics: a textbook for students and practitioners of medicine and its allied professions. Philadelphia: Lea and Febiger; 1958. [Google Scholar]
- Grossman SP. Eating or drinking elicited by direct adrenergic or cholinergic stimulation of hypothalamus. Science. 1960;132:301–302. doi: 10.1126/science.132.3422.301. [DOI] [PubMed] [Google Scholar]
- Hatton GI, Doran AD, Salm AK, Tweedle CD. Brain slice preparation: hypothalamus. Brain Res Bull. 1980;5:405–414. doi: 10.1016/s0361-9230(80)80010-4. [DOI] [PubMed] [Google Scholar]
- Helmreich DL, Itoi K, Lopez-Figueroa MO, Akil H, Watson SJ. Norepinephrine-induced CRH and AVP gene transcription within the hypothalamus: differential regulation by corticosterone. Mol Brain Res. 2001;88:62–73. doi: 10.1016/s0169-328x(01)00018-3. [DOI] [PubMed] [Google Scholar]
- Inouye K, Chan O, Riddell MC, Akirav E, Matthews SG, Vranic M. Mechanisms of impaired hypothalamic-pituitary-adrenal (HPA) function in diabetes: reduced counterregulatory responsiveness to hypoglycaemia. Diabetes Nutr Metab. 2002;15:348–355. [PubMed] [Google Scholar]
- Itoi K, Suda T, Tozawa F, Dobashi I, Ohmori N, Sakai Y, Abd K, Demura H. Microinjection of norepinephrine into the paraventricular nucleus of the hypothalamus stimulates corticotropin-releasing factor gene expression in conscious rats. Endocrinology. 1994;135:2177–2182. doi: 10.1210/endo.135.5.7956940. [DOI] [PubMed] [Google Scholar]
- Itoi K, Helmreich DL, Lopez-Figueroa MO, Watson SJ. Differential regulation of corticotropin-releasing hormone and vasopressin gene transcription in the hypothalamus by norepinephrine. J Neurosci. 1999;19:5464–5472. doi: 10.1523/JNEUROSCI.19-13-05464.1999. [DOI] [PMC free article] [PubMed] [Google Scholar]
- Ito-Ishida A, Kakegawa W, Yuzaki M. ERK1/2 but not p38 MAP kinase is essential for the long-term depression in mouse cerebellar slices. Eur J Neurosci. 2006;24:1617–1622. doi: 10.1111/j.1460-9568.2006.05055.x. [DOI] [PubMed] [Google Scholar]
- Jacobowitz DM, Winsky L, Detera-Wadleigh SD. Cellular expression of MAP 2 kinase in rat brain. Histochem Cell Biol. 1996;106:303–310. doi: 10.1007/BF02473240. [DOI] [PubMed] [Google Scholar]
- Jia C, Carrasco GA, Garcia F, Chadda R, Chen Z, Yu Z, Numa NA, Battaglia G. Treatment with SSRIs or 8-OH-DPAT differentially alters 5-HT1A receptor-mediated phosphorylation of ERK and neuroendocrine responses in rats. Soc Neurosci Abstr. 2006;32:33–21. [Google Scholar]
- Khan AM, Watts AG. Norepinephrine rapidly elevates CRH hnRNA, c-Fos mRNA and levels of phosphorylated MAP kinases (ERK 1 and 2) in hypothalamic parvicellular paraventricular neurons in vivo . Soc Neurosci Abstr. 2003;29:397–18. [Google Scholar]
- Khan AM, Watts AG. Intravenous 2-deoxy-d-glucose injection rapidly elevates levels of the phosphorylated forms of p44/p42 mitogen activated protein kinases (extracellularly regulated kinases 1 and 2) in rat hypothalamic parvicellular paraventricular neurons. Endocrinology. 2004;145:351–359. doi: 10.1210/en.2003-0539. [DOI] [PubMed] [Google Scholar]
- Khan AM, Watts AG. Tracking intracellular events associated with glucoprivic challenge in three forebrain regions that contain CRH neurons receiving hindbrain noradrenergic input. American Neuroendocrine Society, 2005, Workshop on the Neuroendocrinology of Stress; Poster 29. [Google Scholar]
- Khan AM, Watts AG. Glucoprivic challenge is associated with elevated levels of phosphorylated signaling intermediates in discrete forebrain regions: immunofluorescence studies of ERK1/2 and CREB. Soc Neurosci Abstr. 2005b;31:634.15. [Google Scholar]
- Khan AM, Currás MC, Dao J, Jamal FA, Turkowski CA, Goel RK, Gillard ER, Wolfsohn SD, Stanley BG. Lateral hypothalamic NMDA receptor subunits NR2A and/or NR2B mediate eating: immunochemical/behavioral evidence. Am J Physiol. 1999;276:R880–R891. doi: 10.1152/ajpregu.1999.276.3.R880. [DOI] [PubMed] [Google Scholar]
- Khan AM, Cheung HH, Gillard ER, Palarca JA, Welsbie DS, Gurd JW, Stanley BG. Lateral hypothalamic signaling mechanisms underlying feeding stimulation: differential contributions of Src family tyrosine kinases to feeding triggered either by NMDA injection or by food deprivation. J Neurosci. 2004;24:10603–10615. doi: 10.1523/JNEUROSCI.3390-04.2004. [DOI] [PMC free article] [PubMed] [Google Scholar]
- Khan AM, Ponzio TA, Hatton GI, Watts AG. Confocal imaging of acute hypothalamic slices maintained in vitro reveals rapid noradrenergic recruitment of MAP kinases in CRH neuroendocrine neurons of the hypothalamic paraventricular nucleus (PVH): comparison with central injection studies. Front Neuroendocrinol. 2006;27:148–149. [Google Scholar]
- Kim S-J, Kahn CR. Insulin regulation of mitogen-activated protein kinase kinase (MEK), mitogen-activated protein kinase and casein kinase in the cell nucleus: a possible role in the regulation of gene expression. Biochem J. 1997;323:621–627. doi: 10.1042/bj3230621. [DOI] [PMC free article] [PubMed] [Google Scholar]
- Kovacs KJ, Sawchenko PE. Sequence of stress-induced alterations in indices of synaptic and transcriptional activation in parvocellular neurosecretory neurons. J Neurosci. 1996;16:262–273. doi: 10.1523/JNEUROSCI.16-01-00262.1996. [DOI] [PMC free article] [PubMed] [Google Scholar]
- Leibowitz SF, Sladek C, Spencer L, Tempel D. Neuropeptide Y, epinephrine and norepinephrine in the paraventricular nucleus: stimulation of feeding and the release of corticosterone, vasopressin and glucose. Brain Res Bull. 1988;21:905–912. doi: 10.1016/0361-9230(88)90025-1. [DOI] [PubMed] [Google Scholar]
- Leibowitz SF, Diaz S, Tempel D. Norepinephrine in the paraventricular nucleus stimulates corticosterone release. Brain Res. 1989;496:219–227. doi: 10.1016/0006-8993(89)91069-x. [DOI] [PubMed] [Google Scholar]
- Lesscher HMB, Burbach JPH, Van Ree JM, Gerrits MAFM. ERK1/2 activation in rat ventral tegmental area by the μ-opioid agonist fentanyl: an in vitro study. Neuroscience. 2003;116:139–144. doi: 10.1016/s0306-4522(02)00552-3. [DOI] [PubMed] [Google Scholar]
- Levin MC, Sawchenko PE, Howe PRC, Bloom SR, Polak JM. Organization of galanin-immunoreactive inputs to the paraventricular nucleus with special reference to their relationship to catecholaminergic afferents. J Comp Neurol. 1987;261:562–582. doi: 10.1002/cne.902610408. [DOI] [PubMed] [Google Scholar]
- Lind RW, Swanson LW, Ganten D. Angiotensin II immunoreactivity in the neural afferents and efferents of the subfornical organ of the rat. Brain Res. 1984;321:209–215. doi: 10.1016/0006-8993(84)90174-4. [DOI] [PubMed] [Google Scholar]
- Liposits Z, Phelix C, Paull WK. Electron microscopic analysis of tyrosine hydroxylase, dopamine-beta-hydroxylase and phenylethanolamine-N-methyltransferase immunoreactive innervation of the hypothalamic paraventricular nucleus in the rat. Histochemistry. 1986a;84:105–120. doi: 10.1007/BF00499821. [DOI] [PubMed] [Google Scholar]
- Liposits Z, Phelix C, Paull WK. Adrenergic innervation of corticotropin releasing factor (CRF)-synthesizing neurons in the hypothalamic paraventricular nucleus of the rat. A combined light and electron microscopic immunocytochemical study. Histochemistry. 1986b;84:201–205. doi: 10.1007/BF00495783. [DOI] [PubMed] [Google Scholar]
- Mandell JW. Phosphorylation state-specific antibodies: applications in investigative and diagnostic pathology. Am J Pathol. 2003;163:1687–1698. doi: 10.1016/S0002-9440(10)63525-0. [DOI] [PMC free article] [PubMed] [Google Scholar]
- McCaleb ML, Myers RD. 2-Deoxy-d-glucose and insulin modify release of norepinephrine from rat hypothalamus. Am J Physiol. 1982;242:596–603. doi: 10.1152/ajpregu.1982.242.5.R596. [DOI] [PubMed] [Google Scholar]
- Meyer-Spasche A, Piggins HD. Vasoactive intestinal polypeptide phase-advances the rat suprachiasmatic nuclei circadian pacemaker in vitro via protein kinase A and mitogen-activated protein kinase. Neurosci Lett. 2004;358:91–94. doi: 10.1016/j.neulet.2003.12.114. [DOI] [PubMed] [Google Scholar]
- Muglia LJ, Jacobson L, Luedke C, Vogt SK, Schaefer ML, Dikkes P, Fukuda S, Sakai Y, Suda T, Majzoub JA. Corticotropin-releasing hormone links pituitary adrenocorticotropin gene expression and release during adrenal insufficiency. J Clin Invest. 2000;105:1269–1277. doi: 10.1172/JCI5250. [DOI] [PMC free article] [PubMed] [Google Scholar]
- Müller MB, Zimmerman S, Sillaber I, Hagemeyer TP, Deussing JM, Timpl P, Kormann MSD, Droste SK, Kühn R, Reul JMHM, Holsboer F, Wurst W. Limbic corticotropin-releasing hormone receptor 1 mediates anxiety-related behavior and hormonal adaptations to stress. Nat Neurosci. 2003;6:1100–1107. doi: 10.1038/nn1123. [DOI] [PubMed] [Google Scholar]
- Mulligan SJ, MacVicar BA. Calcium transients in astrocyte endfeet cause cerebrovascular constrictions. Nature. 2004;431:195–199. doi: 10.1038/nature02827. [DOI] [PubMed] [Google Scholar]
- Myers RD. Injection of solutions into cerebral tissue: relation between volume and diffusion. Physiol Behav. 1966;1:171–174. [Google Scholar]
- Myers RD. Handbook of drug and chemical stimulation of the brain: behavioral, pharmacological and physiological aspects. New York: Van Nostrand Reinhold; 1974. [Google Scholar]
- Nadjar A, Combe C, Busquet P, Dantzer R, Parnet P. Signaling pathways of interleukin-1 actions in the brain: anatomical distribution of phospho-ERK1/2 in the brain of rat treated systemically with interleukin-1β. Neuroscience. 2005;134:921–932. doi: 10.1016/j.neuroscience.2005.04.035. [DOI] [PubMed] [Google Scholar]
- Nagatani S, Tsukamura H, Murahashi K, Bucholtz DC, Foster DL, Maeda K-I. Paraventricular norepinephrine release mediates glucoprivic suppression of pulsatile luteinizing hormone secretion. Endocrinology. 1996;137:3183–3186. doi: 10.1210/endo.137.8.8754737. [DOI] [PubMed] [Google Scholar]
- Obrietan K, Gao XB, van den Pol AN. Excitatory actions of GABA increase BDNF expression via a MAPK-CREB-dependent mechanism—a positive feedback circuit in developing neurons. J Neurophysiol. 2002;88:1005–1015. doi: 10.1152/jn.2002.88.2.1005. [DOI] [PubMed] [Google Scholar]
- Paxinos G, Watson C. The rat brain in stereotaxic coordinates. Ed 4. San Diego: Academic; 1998. [DOI] [PubMed] [Google Scholar]
- Peinado JM, Myers RD. Norepinephrine release from PVN and lateral hypothalamus during perfusion with 2-DG or insulin in the sated and fasted rat. Pharmacol Biochem Behav. 1987;27:715–721. doi: 10.1016/0091-3057(87)90199-7. [DOI] [PubMed] [Google Scholar]
- Peyssonnaux C, Eychène A. The Raf/MEK/ERK pathway: new concepts of activation. Biol Cell. 2001;93:53–62. doi: 10.1016/s0248-4900(01)01125-x. [DOI] [PubMed] [Google Scholar]
- Ponzio TA, Hatton GI. Adenosine postsynaptically modulates supraoptic neuronal excitability. J Neurophysiol. 2005;93:535–547. doi: 10.1152/jn.01185.2003. [DOI] [PubMed] [Google Scholar]
- Pouysségur J, Lenormand P. Fidelity and spatio-temporal control in MAP kinase (ERKs) signalling. Eur J Biochem. 2003;270:3291–3299. doi: 10.1046/j.1432-1033.2003.03707.x. [DOI] [PubMed] [Google Scholar]
- Raby WN, Renaud LP. Dorsomedial medulla stimulation activates rat supraoptic oxytocin and vasopressin neurones through different pathways. J Physiol (Lond) 1989;417:279–294. doi: 10.1113/jphysiol.1989.sp017801. [DOI] [PMC free article] [PubMed] [Google Scholar]
- Raichle ME, Hartman BK, Eichling JO, Sharpe LG. Central noradrenergic regulation of cerebral blood flow and vascular permeability. Proc Natl Acad Sci USA. 1975;72:3726–3730. doi: 10.1073/pnas.72.9.3726. [DOI] [PMC free article] [PubMed] [Google Scholar]
- Rapp KL, Khan AM, Watts AG. Catecholaminergic afferents are required for hypothalamic parvicellular paraventricular neurons to transduce signals associated with hypoglycemia into p44/42 MAP kinase phosphorylation events. Soc Neurosci Abstr. 2006;32:355.9. [Google Scholar]
- Ray LB, Sturgill TW. Insulin-stimulated microtubule-associated protein kinase is phosphorylated on tyrosine and threonine in vivo . Proc Natl Acad Sci USA. 1988;85:3753–3757. doi: 10.1073/pnas.85.11.3753. [DOI] [PMC free article] [PubMed] [Google Scholar]
- Ritter S, Llewellyn-Smith I, Dinh TT. Subgroups of hindbrain catecholamine neurons are selectively activated by 2-deoxy-d-glucose induced metabolic challenge. Brain Res. 1998;805:41–54. doi: 10.1016/s0006-8993(98)00655-6. [DOI] [PubMed] [Google Scholar]
- Ritter S, Bugarith K, Dinh TT. Immunotoxic destruction of distinct catecholamine subgroups produces selective impairment of glucoregulatory responses and neuronal activation. J Comp Neurol. 2001;432:197–216. doi: 10.1002/cne.1097. [DOI] [PubMed] [Google Scholar]
- Ritter S, Watts AG, Dinh TT, Sanchez-Watts G, Pedrow C. Immunotoxin lesion of hypothalamically projecting norepinephrine and epinephrine neurons differentially affects circadian and stressor-stimulated corticosterone secretion. Endocrinology. 2003;144:1357–1367. doi: 10.1210/en.2002-221076. [DOI] [PubMed] [Google Scholar]
- Robbins DJ, Zhen E, Owaki H, Vanderbilt CA, Ebert D, Geppert TD, Cobb MH. Regulation and properties of extracellular signal-regulated protein kinases 1 and 2 in vitro . J Biol Chem. 1993;268:5097–5106. [PubMed] [Google Scholar]
- Ross JA. Colour-blindness: how to alienate a grant reviewer. Nature. 2007;445:593. doi: 10.1038/445593c. [DOI] [PubMed] [Google Scholar]
- Saphier D, Feldman S. Electrophysiology of supraoptico-paraventricular nucleus connections in the rat. Exp Brain Res. 1987;69:60–66. doi: 10.1007/BF00247029. [DOI] [PubMed] [Google Scholar]
- Saphier D, Feldman S. Adrenoceptor specificity in the central regulation of adrenocortical secretion. Neuropharmacology. 1989;28:1231–1237. doi: 10.1016/0028-3908(89)90216-5. [DOI] [PubMed] [Google Scholar]
- Sausen GN, Engelhardt VA, Middleton WJ. Cyanocarbon chemistry. VII. Tricyanoethylenes. J Am Chem Soc. 1958;80:2815–2822. [Google Scholar]
- Sawchenko PE, Swanson LW. Immunohistochemical identification of neurons in the paraventricular nucleus of the hypothalamus that project to the medulla or to the spinal cord in the rat. J Comp Neurol. 1982;205:260–272. doi: 10.1002/cne.902050306. [DOI] [PubMed] [Google Scholar]
- Sawchenko PE, Swanson LW, Grzanna R, Howe PR, Bloom SR, Polak JM. Colocalization of neuropeptide Y immunoreactivity in brainstem catecholaminergic neurons that project to the paraventricular nucleus of the hypothalamus. J Comp Neurol. 1985;241:138–153. doi: 10.1002/cne.902410203. [DOI] [PubMed] [Google Scholar]
- Schwanzel-Fukuda M, Jorrell JI, Pfaff DW. Localization of forebrain neurons which project directly to the medulla and spinal cord of the rat by retrograde tracing with wheat germ agglutinin. J Comp Neurol. 1984;226:1–20. doi: 10.1002/cne.902260102. [DOI] [PubMed] [Google Scholar]
- Silverman AJ, Hoffman DL, Zimmerman EA. The descending afferent connections of the paraventricular nucleus of the hypothalamus (PVN) Brain Res Bull. 1981;6:47–61. doi: 10.1016/s0361-9230(81)80068-8. [DOI] [PubMed] [Google Scholar]
- Smith ER, Smedberg JL, Rula ME, Xu X-X. Regulation of Ras-MAPK pathway mitogenic activity by restricting nuclear entry of activated MAPK in endoderm differentiation of embryonic carcinoma and stem cells. J Cell Biol. 2004;164:689–699. doi: 10.1083/jcb.200312028. [DOI] [PMC free article] [PubMed] [Google Scholar]
- Swanson LW. Biochemical switching in hypothalamic circuits mediating responses to stress. Prog Brain Res. 1991;87:181–200. doi: 10.1016/s0079-6123(08)63052-6. [DOI] [PubMed] [Google Scholar]
- Swanson LW. Brain maps: structure of the rat brain. Ed 2. Amsterdam: Elsevier; 1998. [Google Scholar]
- Swanson LW, Kuypers HG. The paraventricular nucleus of the hypothalamus: cytoarchitectonic subdivisions and organization of projections to the pituitary, dorsal vagal complex, and spinal cord as demonstrated by retrograde fluorescence double-labeling methods. J Comp Neurol. 1980;194:555–570. doi: 10.1002/cne.901940306. [DOI] [PubMed] [Google Scholar]
- Swanson LW, Connelly MA, Hartman BK. Ultrastructural evidence for central monoaminergic innervation of blood vessels in the paraventricular nucleus of the hypothalamus. Brain Res. 1977;136:166–173. doi: 10.1016/0006-8993(77)90142-1. [DOI] [PubMed] [Google Scholar]
- Szafarczyk A, Malaval F, Laurent A, Gibaud R, Assenmacher I. Further evidence for a central stimulatory action of catecholamines on adrenocorticotropin release in the rat. Endocrinology. 1987;121:883–892. doi: 10.1210/endo-121-3-883. [DOI] [PubMed] [Google Scholar]
- Tanimura SM, Sanchez-Watts G, Watts AG. Peptide gene activation, secretion, and steroid feedback during stimulation of rat neuroendocrine corticotropin-releasing hormone neurons. Endocrinology. 1998;139:3822–3829. doi: 10.1210/endo.139.9.6191. [DOI] [PubMed] [Google Scholar]
- Teruyama R, Armstrong WE. Changes in the active membrane properties of rat supraoptic neurons during pregnancy and lactation. J Neuroendocrinol. 2002;14:933–944. doi: 10.1046/j.1365-2826.2002.00844.x. [DOI] [PubMed] [Google Scholar]
- Thomas KL, Hunt SP. The regional distribution of extracellularly regulated kinase-1 and -2 messenger RNA in the adult rat central nervous system. Neuroscience. 1993;56:741–757. doi: 10.1016/0306-4522(93)90371-l. [DOI] [PubMed] [Google Scholar]
- van der Kooy D, Koda LY, McGinty JF, Gerfen CR, Bloom FE. The organization of projections from the cortex, amygdala, and hypothalamus to the nucleus of the solitary tract in rat. J Comp Neurol. 1984;224:1–24. doi: 10.1002/cne.902240102. [DOI] [PubMed] [Google Scholar]
- Vanhoose AM, Emery M, Jimenez L, Winder DG. ERK activation by G protein-coupled receptors in mouse brain is receptor identity-specific. J Biol Chem. 2002;277:9049–9053. doi: 10.1074/jbc.M108309200. [DOI] [PubMed] [Google Scholar]
- Watts AG. Glucocorticoid regulation of peptide genes in neuroendocrine CRH neurons: a complexity beyond negative feedback. Front Neuroendocrinol. 2005;26:109–130. doi: 10.1016/j.yfrne.2005.09.001. [DOI] [PubMed] [Google Scholar]
- Watts AG, Sanchez-Watts G. Physiological regulation of peptide messenger RNA colocalization in rat hypothalamic paraventricular medial parvicellular neurons. J Comp Neurol. 1995;352:501–514. doi: 10.1002/cne.903520403. [DOI] [PubMed] [Google Scholar]
- Watts AG, Kelly AB, Sanchez-Watts G. Neuropeptides and thirst: the temporal response of corticotropin-releasing hormone and neurotensin/neuromedin N gene expression in rat limbic forebrain neurons to drinking hypertonic saline. Behav Neurosci. 1995;109:1146–1157. doi: 10.1037//0735-7044.109.6.1146. [DOI] [PubMed] [Google Scholar]
- Wick AN, Drury DR, Nakada HI, Wolfe JB. Localization of the primary metabolic block produced by 2-deoxyglucose. J Biol Chem. 1957;224:963–969. [PubMed] [Google Scholar]
- Yuill EA, Hoyda TD, Ferri CC, Zhou Q-Y, Ferguson AV. Prokineticin 2 depolarizes paraventricular nucleus magnocellular and parvocellular neurons. Eur J Neurosci. 2007;25:425–434. doi: 10.1111/j.1460-9568.2006.05293.x. [DOI] [PMC free article] [PubMed] [Google Scholar]
- Zhong H, Minneman KP. Differential activation of mitogen-activated protein kinase pathways in PC12 cells by closely related α1-adrenergic receptor subtypes. J Neurochem. 1999;72:2388–2396. doi: 10.1046/j.1471-4159.1999.0722388.x. [DOI] [PubMed] [Google Scholar]