Abstract

Polymeric nanoparticles (NPs) are attractive candidates for the controlled and targeted delivery of therapeutics in vitro and in vivo. However, detailed understanding of the uptake, location, and ultimate cellular fate of the NPs is necessary to satisfy safety concerns, which is difficult because of the nanoscale size of these carriers. In this work, we show how small chemical labels can be appended to poly(lactic acid-co-glycolic acid) (PLGA) to synthesize NPs that can then be imaged by stimulated Raman scattering microscopy, a vibrational imaging technique that can elucidate bond-specific information in biological environments, such as the identification of alkyne signatures in modified PLGA terpolymers. We show that both deuterium and alkyne labeled NPs can be imaged within primary rat microglia, and the alkyne NPs can also be imaged in ex vivo cortical mouse brain tissue. Immunohistochemical analysis confirms that the NPs localize in microglia in the mouse brain tissue, demonstrating that these NPs have the potential to deliver therapeutics selectively to microglia.
Introduction
The use of polymeric NPs for drug delivery has become increasingly popular to achieve controlled release, targeted delivery, and increased lifetime of therapeutics in vivo. NP drug delivery can have wide ranging applications such as the targeting of cancer therapeutics,1,2 delivery of drugs to the brain,3,4 and encapsulation of protein therapeutics, which are sensitive to certain biological environments and may degrade to an inactive form in vivo. PLGA micro and nanoparticles have been used extensively in drug delivery research as they are FDA approved, biocompatible, and biodegradable.5 However, due to the nanoscale size of these drug carriers, imaging their uptake, biodistribution, and ultimate cellular fate in vitro and in vivo is challenging.
Previous efforts to image polymer NPs have mainly focused on the encapsulation of fluorescent dyes inside the NPs to allow imaging by fluorescence microscopy,6 or by various Raman-based methods, which we have recently reviewed.7 The degradation of PLGA NPs in macrophages has been monitored by quantifying the loss of fluorescent signal over time.8 PLGA NPs degrade by hydrolysis under physiological conditions,9 thus the loss of fluorescent signal could correspond to dye being released from the NPs, and not give direct information about the location and state of the NP. Also, fluorophores are generally unstable in biological environments, and photobleaching can also cause signal degradation of the dye (Figure 1).10
Figure 1.
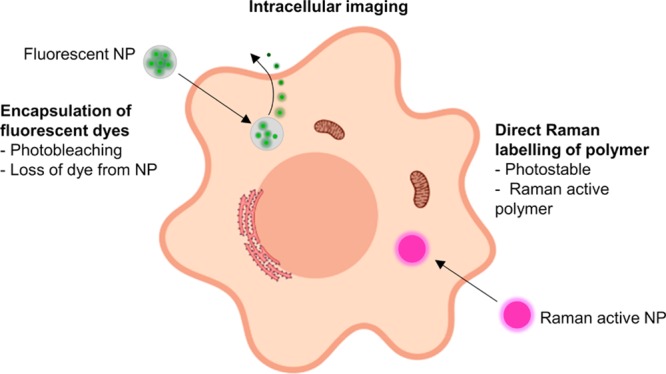
Illustrative summary of different strategies for intracellular NP imaging. Fluorescent dyes have been encapsulated in NPs to allow visualization. Disadvantages of this approach are that dye can leach out of the NPs and suffer from photobleaching. In this work we directly label the polymer with a bioorthogonal Raman tag. Image created with Biorender.com.
Stimulated Raman scattering (SRS) microscopy has emerged as a powerful, label-free optical imaging technique for biological systems that can provide quantitative and bond-specific cellular information.11,12 Spontaneous Raman scattering can be used to probe the chemical signature of cells and biological tissues due to the inelastic scattering of light when the sample is irradiated with a laser, but recording an image may take many minutes to hours. With coherent Raman techniques like SRS, a specific vibrational bond can be probed using two lasers tuned to the bond’s energy difference. This drives a coherent resonance allowing video rate imaging to be achieved.13
In contrast to infrared, Raman spectroscopy has a low background interference from water making it ideally suited to study biological samples. Due to the absence of any cellular vibrational peaks in the spectroscopic region between 1800 and 2800 cm–1, known as the cell-silent region, small, bioorthogonal chemical tags (for example C–D, C≡C, and C≡N) which resonate in this region can be exploited to give imaging free of cellular background.14−19 As such, poly(phenylene ethynylene) NPs, which have an intrinsic alkyne, have been visualized in HeLa cells with spontaneous Raman imaging.20 More recently, SRS has been used to image NP polymer dots bearing alkyne (2163 cm–1), nitrile (2232 cm–1), and carbon-deuterium (2293 cm–1) bonds, which all produce peaks in the cell silent region.21
In this work, we have explored two analogues of PLGA, with deuterium and alkyne labels which are Raman active in the cell-silent region. These polymers were then formulated into NPs and imaged first in cultured primary microglia and then in ex vivo brain tissue by SRS microscopy. As opposed to imaging a fluorescent payload, our approach allows direct imaging of the nanoparticle itself, and can be used to monitor the cellular location of the NPs. SRS microscopy gives a signal enhancement over spontaneous Raman imaging, and also a 1000-fold improvement in image acquisition speed.22 We have therefore used SRS to image NP analogues of PLGA, a highly relevant biocompatible and biodegradable polymer.
Materials and Methods
Synthesis of PLGA
Under a nitrogen atmosphere d,l-lactide (8.0 g, 55 mmol) and glycolide (2.8 g, 24 mmol) were added to a preheated round-bottom flask containing stannous octanoate (0.16 g, 0.40 mmol) and dodecanol (0.07 g, 0.40 mmol) at 130 °C. The reaction mixture was heated and stirred for a further hour until complete conversion was reached. After the reaction was cooled to room temperature, it was dissolved in dichloromethane (DCM) (5 mL) and precipitated in cold methanol (400 mL). The solvent was decanted off, leaving a colorless solid which was dried in vacuo until constant weight. 1H NMR (500 MHz, Chloroform-d) δ 5.30–5.11 (9H, m, CH), 4.97–4.58 (7H, m, CH2), 1.64–1.49 (23H, m, CH3); GPCMn = 5700 g/mol, Đ = 1.11.
Synthesis of PLGA-D
d,l-Lactic acid (0.10 g, 0.94 mmol; 85% in water), l-lactic acid-d3 (0.10 g, 0.91 mmol; 85% in water), and glycolic acid (0.06 g, 0.79 mmol) were dehydrated at 150 °C for 8 h in a flask fitted with an air condenser containing molecular sieves to form oligomers. Tin chloride (0.5 wt %) and para-toluene sulfonic acid (0.5 wt %) were then added to the oligomers followed by heating to 180 °C for a further 8 h. The crude polymer was dissolved in DCM (2 mL) and precipitated into a 50:50 mixture of ice-cold hexane/ether (100 mL) to yield a colorless solid which was dried in vacuo until constant weight. 1H NMR (400 MHz, Chloroform-d) δ 5.30–5.13 (1H, m, CH), 4.93–4.56 (2H, m, CH2), 1.64–1.51 (3H, m, CH3). GPCMn = 4553 g/mol, Đ = 1.84.
Synthesis of PLGA-Alkyne
In a glovebox, PLGA (2.00 g, 0.56 mmol), propargyl-DOX (0.38 g, 2.78 mmol, see Scheme S2 of the Supporting Information, SI), and SnOct2 (0.23 g, 0.56 mmol) were dissolved in toluene (4 mL) and charged to a Schlenk flask. The flask was removed from the glovebox and heated at 110 °C for 24 h. After the reaction was cooled to room temperature, the reaction mixture was diluted further by the addition of DCM (5 mL), and the mixture was precipitated in cold methanol (400 mL). The solvent was decanted off leaving a colorless solid which was dried in vacuo until constant weight. 1H NMR (500 MHz, Chloroform-d) δ 5.43–5.11 (m, 9H), 4.97–4.58 (m, 7H), 2.99–2.77 (m, 2H), 2.14–2.03 (br s, 1H), 1.64–1.49 (m, 23H). GPCMn = 5900 g/mol, Đ = 1.88.
Nanoparticle Synthesis and Characterization
A solution of PLGA-D/PLGA-alkyne (10–20 mg) in DCM (1 mL) was added to an aqueous solution of 1% poly(vinyl alcohol) (MW 31 000–50 000 Da, 98–99% hydrolyzed) and 0.2% sodium dodecyl sulfate (10 mL). The two phases were emulsified using a probe tip sonicator (Soniprep 150, MSE) for 2 min. The resulting emulsion was stirred at room temperature overnight to allow evaporation of the DCM. The nanoparticles were collected by centrifugation at 8000 rpm for 10 min, and washed once with deionized water. Nanoparticle tracking analysis measurements were carried out in triplicate in 1 × PBS on a NanoSight LM10 (Malvern Panalytical) for 60 s with the temperature measured for each individual run. The samples were diluted until in the range of 1–8 × 10⁸ particles mL–1 for more accurate measurements. Dynamic light scattering (DLS) was carried out on a Zetasizer Nano ZS (Malvern Panalytical) in water at 25 °C.
Spontaneous Raman
Spontaneous Raman spectra were acquired on a confocal Raman spectrometer (inVia Raman microscope, Renishaw). A 297 mW (206 mW after objective) 785 nm diode laser, or a 200 mW 532 nm laser excitation source was used to excite the sample through a 20× or 50× objective. All spectra were background subtracted using the background correction algorithm available on the Wire 4.4 software.
SRS Setup
Images were acquired using a custom-built multimodal microscope. A picoEmerald (APE, Berlin, Germany) laser gave a tunable pump laser (720–990 nm, 7 ps, 80 MHz repetition rate) and a spatially and temporally overlapped Stokes laser (1064 nm, 5–6 ps, 80 MHz repetition rate). Back scattered RFP two-photon fluorescence signals were filtered using the following series of filters: FF552-Di02, FF440/520-Di01 (Semrock) and HQ610/75m (Chroma). For SRS measurements, the Stokes beam was modulated with a 20 MHz EoM. Forward scattered light was collected by a 20× Olympus XLUMPLFLN Objective, 1.00 NA lens and filtered using ET890/220m filter (Chroma). A telescope focused the light onto an APE silicon photodiode connected to an APE lock-in amplifier which was fed into the analogue unit of the microscope.
The pump laser was tuned to 810.5 nm (2930 cm–1, protein), 816 nm (2850 cm–1, lipid), 867.5 nm (2128 cm–1, C≡C) and 858.3 nm (2252 cm–1, C–D), and laser powers after the objective were measured up to 40–70 mW for the pump laser, and up to 70 mW for the Stokes laser. All images were recorded at 512 × 512 or 1024 × 1024 pixels with a pixel dwell time between 2 and 20 μs by FV10-ASW software (Olympus).
General Procedures for Cell Culture
Microglia cultures were prepared from neonatal Sprague–Dawley rats. Mixed glia cultures were isolated from postnatal day 1–2 rat pups, and after 10 days microglia were isolated by shaking the culture flasks and relying on differential adhesion of oligodendrocyte precursor cells, microglia, and astrocytes.23 Microglia were cultured in Dulbecco’s Modified Eagle Media (Gibco) + 10% fetal bovine serum + 1% penicillin streptomycin, and were incubated at 37 °C in a humidified atmosphere with 7.5% CO2 and media changes every 2–3 days. To improve cell adherence, all culture dishes were coated in poly-d-lysine before plating the cells by covering dishes in a 1 μg/mL aqueous solution and incubating at 37 °C for 1 h, before removing the solution and washing once with sterile water. Cell fixation was achieved by covering the cells with a solution of 4% formaldehyde (2 mL) for 10 min at room temperature before washing three times with 1 × PBS (3 × 2 mL).
SRS Microglia Experiments
Microglia were plated at 3 × 10⁵ cells per well in FluoroDish Cell Culture Dishes (World Precision Instruments) and left overnight to adhere to the dish. NPs (alkyne or deuterium) were then added at 2 × 10⁹ particles mL–1 followed by a 24 h incubation. The media was then removed, and the cells were washed twice with 1 × PBS (2 × 2 mL) before fixation and imaging with the SRS setup described above.
Slice Culture Experiments
Brains were isolated from P5 C57BL6/N mice pups in cold Hibernate-A medium (Thermo Fisher A12475–01) on ice and cut into 300 μm cortical slices using a vibratome (Leica). The slices were then transferred to Millipore milli cell-CM organotypic inserts (30 mm, hydrophilic PTFE, 0.4 μm, Merck-Millipore, PICM0RG50) in slice media (50% MEM (Invitrogen, 32360–026) with 25% Earle’s Balanced Salt Solution (Invitrogen, 24010–043), 25% heat-inactivated horse serum (Invitrogen, 26050–088), 1% glutamax supplement (Invitrogen, 35050–038), 1% penicillin–streptomycin, 0.5% Fungizone (Invitrogen, 15290–018) and 6.5 mg/mL glucose (Sigma G8769)), and were maintained at 37 °C and 7.5% CO2 with media changes every 2 days. After 6 days in culture, alkyne NPs were added at 2 × 10⁸ and 2 × 10⁹ particles mL–1 for 24 h. The slices were then washed twice with 1 × PBS (2 × 2 mL) before fixation. Slices were fixed with 4% formaldehyde (2 mL) for 1 h at room temperature before washing three times with 1 × PBS (3 × 2 mL).
Immunostaining of Slices
Fixed slices in a 6-well plate were incubated with blocking solution (3% HIHS, 2% BSA, 0.5% Triton in PBS) (1 mL per well) for 2 h before adding the primary antibodies. Rabbit polyclonal anti-IBA1 (1/500, Abcam, AB178846) and mouse monoclonal anti-OLIG2 (1/500, Merck Millipore, MABN50) were diluted in blocking solution and 500 μL was added to each well. The slices were then shaken at 4 °C for 1.5 days before washing three times for 1 h with blocking solution (3 × 2 mL). The secondary antibodies, goat antirabbit 568 (1/1000, Life Technologies, A11011), and donkey antimouse 488 (1/1000, Thermo Fisher Scientific, A21202) were diluted in blocking solution and then incubated with the slices (500 μL per well) with gentle agitation overnight, in the dark at 4 °C. The slices were then washed once for 10 min followed by three 1 h washes with 1 × PBS (4 × 2 mL) and finally imaged using the SRS setup described above.
Image Processing
All images were processed with the Fiji image processing package (https://imagej.net/Fiji). False color assignments and scale bars were added to images. Image overlays and orthogonal views were also processed with Fiji.
Results and Discussion
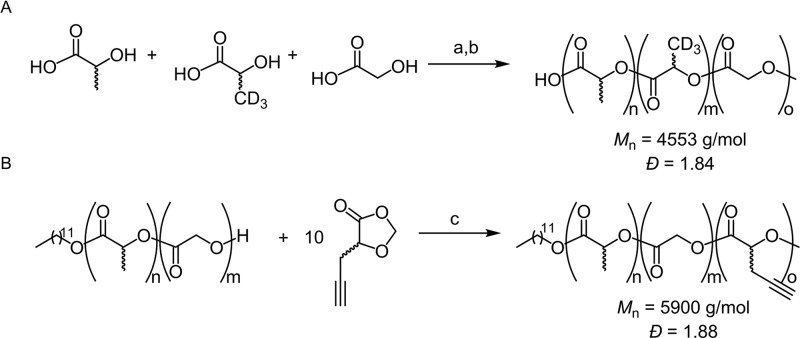
Deuterated PLGA (PLGA-D) was synthesized via a direct poly condensation method from lactic acid, lactic acid-d3, and glycolic acid, which produced a polymer with a molecular weight of 4.5 kDa and a dispersity of 1.84 (Scheme 1A).24,25 Since Raman is an inherently weak effect, with only approximately 1 in every 108 molecules experiencing Raman scattering,26 a deuterium group was introduced into the monomer, as opposed to substitution onto a premade polymer, to maximize the Raman signal of the NPs.
Scheme 1. Synthesis of Raman active PLGA Analogues.
(A) Synthesis of PLGA-D. Reagents and conditions: a; 150°C, 8 h, b; SnCl2, p-TSA, 180°C, 8 h. (B) Synthesis of PLGA-alkyne. Reagents and conditions: c; Sn(oct)2, toluene, 110°C, 24 h.
To produce the alkyne analogue of PLGA (PLGA-alkyne), PLGA was first synthesized by a ring opening copolymerization of lactide and glycolide, using dodecanol as the initiator and stannous octanoate as the catalyst.27 Recent work has shown that 1,3-dioxolan-4-ones (DOX) are a versatile and sustainable family of monomers utilized for the synthesis of biodegradable polyesters by ring opening polymerization.28,29 To introduce the alkyne functionality, the telechelic properties of PLGA were exploited to initiate the polymerization of propargyl-DOX (see Scheme S.2 of the SI for propargyl-DOX synthesis). Ring-opening polymerization from the PLGA macroinitiator initially affords a blocky PLGA-P(propargyl-DOX) copolymer. However, extended reaction times lead to transesterification catalyzed by stannous octanoate, scrambling the terpolymer structure to afford a statistical distribution of the alkyne units throughout the PLGA chain (Scheme 1B). This gave rise to a polymer with comparable molecular weight and dispersity to the deuterium analogue (5.9 kDa and 1.88, respectively). The incorporation of the alkyne into the terpolymer was confirmed by a single cross peak in the diffusion-ordered spectroscopy (DOSY) NMR (Figure S2).
The Raman labeled polymers, along with unlabeled PLGA, were then characterized with spontaneous Raman spectroscopy (Figure 2). PLGA (black) was analyzed as a control to show that there are no peaks in the cell-silent region. In contrast, the PLGA-D (red) shows multiple broad peaks between 2000 and 2300 cm–1, and the PLGA-alkyne (blue) shows a single, intense peak at 2128 cm–1. Notably, the alkyne signal presents a much stronger peak in the cell silent region than the deuterium, which is consistent with previous studies.17
Figure 2.
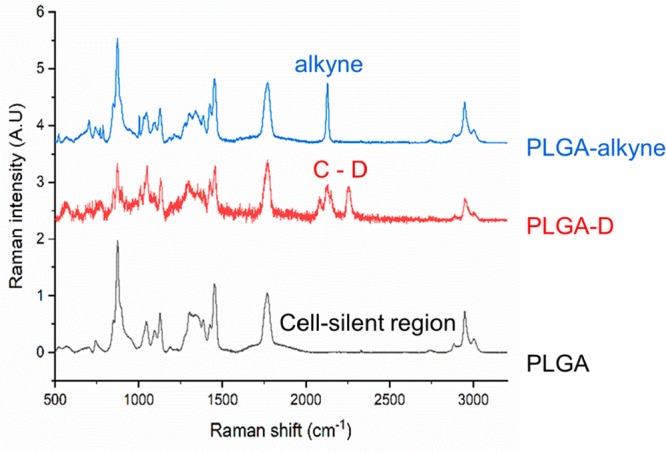
Analysis of polymers by Spontaneous Raman spectroscopy. Spontaneous Raman spectra of PLGA (black), PLGA-D (red), and PLGA-alkyne (blue), with the labeled analogues showing peaks in the cell silent region. Spectra are normalized to the carbonyl peak (C=O) at 1737 cm–1 and offset for clarity, λex = 785 nm.
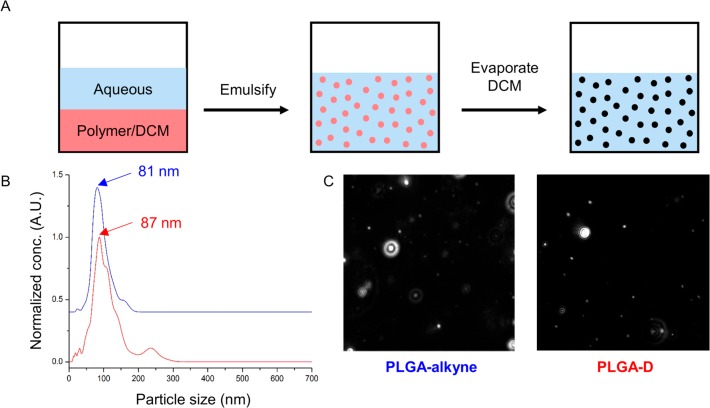
The PLGA analogues were then fabricated into NPs using the standard, and widely used, emulsification–evaporation method (Figure 3A),30 which can be easily modified to encapsulate both hydrophobic and hydrophilic drugs. The NPs were analyzed by nanoparticle tracking analysis (NTA), a technique which uses an optical microscope equipped with a laser to visualize particles according to the light they scatter.31,32 Individual particles were then tracked and their Brownian motion measured, which gives both particle size and particle concentration data (Figure 3B). This showed that the mean size of the PLGA-D and PLGA-alkyne particles are 87 and 81 nm, respectively. Visualization of the particles by the NTA shows that they are uniform and well separated (Figure 3C). Due to the tendency of the PLGA-D NPs to aggregate over time (Figure S4), the NPs were freshly prepared before every biological experiment.
Figure 3.
Synthesis and characterization of polymer NPs. (A) A general representation of the emulsification-evaporation process. (B) Particle size distribution acquired from the NTA of PLGA-alkyne (blue) and PLGA-D (red). Spectra are normalized between 0 and 1 and offset for clarity. (C) A visual representation of the NPs detected by the NTA camera, which is proportional to the amount of light scattered by the particles.
Next, we treated primary rat microglia with our two Raman active NPs. We chose microglia as “proof of principle” cells as they are phagocytes in the brain, and therefore likely to internalize the NPs.33 NPs can cross the blood-brain barrier, and so have great potential for delivery of cargo to the brain.34,35 The microglia used were primary cultures isolated from rat brains to retain more biologically relevant in vivo characteristics as opposed to using cell lines.
To test whether NPs were toxic to microglia, we used a luminescence cell viability assay which quantifies the amount of ATP, indicative of live cells. This assay found that PLGA, PLGA-D, and PLGA-alkyne NPs were all nontoxic to microglia at all concentrations tested (1, 2, and 4 × 10⁹ particles mL–1) (Figure S5).
Microglia were then incubated with PLGA-D or PLGA-alkyne NPs for 24 h before imaging with SRS microscopy (Figure 4). Tuning the energy difference between the pump and Stokes beams of the SRS microscope to 2939 cm–1 excites CH3 vibrations only, showing the protein content of the cells. Similarly, tuning to 2856 cm–1 excites CH2 vibrations, which is indicative of the cellular lipid content. Due to the bioorthogonal deuterium and alkyne chemical labels on our NPs, tuning to 2253 cm–1 (C–D) and 2128 cm–1 (C≡C), respectively, allowed visualization of the cellular location of the NPs, which were shown to be distributed throughout the cytoplasm and absent from the nuclei. Z-stack analysis of the cells also confirmed that the NPs had been internalized (Figure S6).
Figure 4.
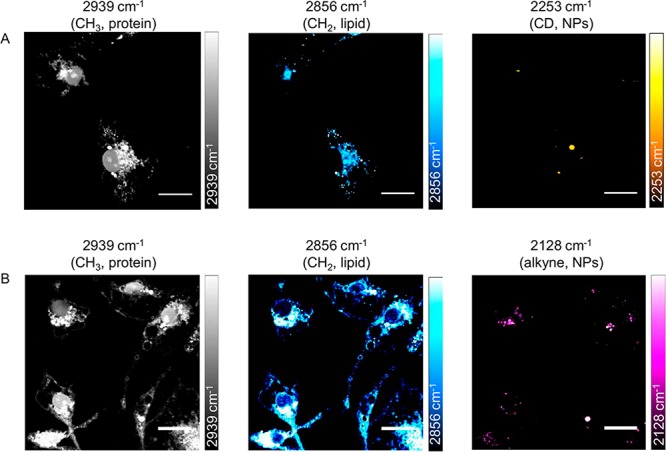
SRS imaging of NPs in microglia. Microglia were incubated with PLGA-D NPs (A) or PLGA-alkyne NPs (B) at 2 × 10⁹ particles mL–1 for 24 h before fixing and imaging with SRS microscopy. Scale bars 20 μm.
Time-dependent analysis of PLGA-alkyne NP internalization into microglia was also carried out over 24 h. The alkyne intensity of individual cells at 0, 12, and 24 h were quantified, and this showed that the alkyne intensity, and therefore the intensity of NPs, increased over time (Figure S7).
As predicted by inspection of the spontaneous Raman spectra in Figure 2, the PLGA-alkyne NPs gave a stronger intracellular signal compared to PLGA-D. For this reason, we chose to carry out further studies with the PLGA-alkyne NPs only. Using a multimodal approach to imaging, NPs encapsulating rhodamine were visualized using SRS (2128 cm–1, NP) and two photon fluorescence (866 and 1064 nm, rhodamine) and the signals were shown to colocalize after 24 h incubation demonstrating that this model payload could be delivered to microglia using these novel PLGA-alkyne NPs (Figure S8).
We then went on to investigate the uptake of the alkyne NPs in ex vivo mouse brain slices. These slices were freshly harvested from mice pups and cultured, bridging the gap between in vitro cell culture and in vivo experiments in rodents.36 The slices were incubated with alkyne NPs at 2 × 10⁸ and 2 × 10⁹ particles mL–1 for 24 h before washing, fixing, and imaging with SRS microscopy. SRS imaging at 2128 cm–1 showed that there are alkyne NPs distributed throughout the tissue.
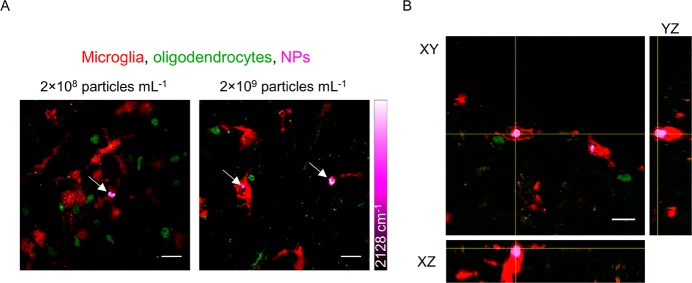
To determine if the NPs were inside cells in the brain tissue, and what type of cells these were, a multimodal imaging technique of both immunofluorescence and Raman imaging was employed. Immunofluorescence uses primary antibodies which bind to markers specific to a certain cell type, and then secondary fluorescent antibodies so that the cells can be visualized by fluorescence microscopy. We used a primary antibody to the protein IBA1, which is found specifically on microglia, and also an antibody to OLIG2 to label oligodendroglia, which are glia that would not be expected to phagocytose NPs. Figure 5A shows the immunostained tissue with microglia in red, oligodendrocytes in green and NPs in magenta. This clearly shows the association of the NPs with microglia at both concentrations tested. Z-stack analysis of the tissue also allowed depth analysis of the NP location, with Figure 5B showing a Z-stack with orthogonal views of the tissue. It is clear from this image that the NPs have been internalized by microglia, although there are many other microglia that do not contain NPs, suggesting that uptake is not as homogeneous as it was with the in vitro microglia cultures.
Figure 5.
Imaging alkyne NPs in ex vivo brain slices. (A) Alkyne NPs were added to ex vivo mouse cortical brain slices at 2 × 10⁸ and 2 × 10⁹ particles mL–1 for 24 h before washing, fixing, and immunostaining. Microglia are shown in red (using antibodies against IBA1), oligodendrocytes in green (using antibodies against OLIG2), and NPs in magenta. Scale bars 20 μm. (B) Orthogonal views of Z-stack images show that the NPs are inside microglia. Scale bars 20 μm.
These experiments have highlighted the clear capability of SRS to image our novel PLGA-alkyne NPs in ex vivo brain tissue, and show that they are preferentially taken up by microglia over oligodendroglia, which give them potential for targeted drug delivery.
Conclusions
Raman imaging, and specifically SRS microscopy, have the potential to give noninvasive information about the location and state of polymeric nanocarriers in biological environments. We have developed two Raman active analogues of PLGA, one of the most commonly used biodegradable polymers for drug delivery research with a long history and proven safety record,37 and have used the location of these deuterium and alkyne tags in the cell-silent region to enhance contrast of the NPs in a biological environment. As neither deuterium nor alkyne bonds are present in biological samples, the signal is certain to derive from the NPs. These NPs have been shown to be nontoxic to living cells and SRS imaging has shown that both PLGA-D and PLGA-alkyne NPs are internalized in primary rat microglia, and additionally the PLGA-alkyne NPs were imaged in mouse cortical ex vivo brain slices. We believe that the strong Raman signal obtained from the alkyne NPs gives them an especially wide ranging imaging potential in many biological applications, including live animal studies which will be a focus of our future work.
Acknowledgments
We thank Dr. Colin Campbell for use of the spontaneous Raman microscope [UK Regenerative Medicine Platform Niche Hub, MRC grant ref MR/K026666/1]. We thank Dr. Marie Bechler, Dr. Matthew Swire and Monica Kim for the gift of microglia.
Glossary
Abbreviations
- DCM
dichloromethane
- NPs
nanoparticles
- PBS
phosphate buffered saline
- PLGA
poly(lactic acid-co-glycolic acid)
- SRS
stimulated Raman scattering
Supporting Information Available
The Supporting Information is available free of charge on the ACS Publications website at DOI: 10.1021/acs.biomac.9b01092. Primary data files can be found at DOI: 10.7488/ds/2608.
Synthetic route to propargyl DOX, selected NMR spectra including DOSY NMR, aqueous stability of the NPs, time dependent analysis of PLGA-alkyne NPs in microglia, results from the cell viability assay, Z-stacks of alkyne NPs inside microglia and images showing encapsulation of rhodamine inside PLGA-alkyne NPs (PDF)
Author Present Address
∥ School of Materials and Henry Royce Institute, University of Manchester.
Author Contributions
A.N.H., A.W., V.G.B., M.P.S., S.C., and S.V.H. designed the experiments. S.V.H., S.C., M.L., and L.Z. carried out the experiments. S.V.H., A.N.H., and M.P.S. wrote the manuscript. S.V.H., S.C., M.L., L.Z., M.P.S., V.G.B., A.W., and A.N.H. read and edited the manuscript.
This work was funded by the BBSRC [EASTBIO studentship to SVH; grant ref BB/M010996/1] the EPSRC [grant to MPS, grant ref EP/P026095/1], Cancer Research UK [grant ref: C157/A25140 and C157/A15703], and the MS Society UK.
The authors declare no competing financial interest.
Supplementary Material
References
- Tran S.; Degiovanni P.-J.; Piel B.; Rai P. Cancer Nanomedicine: A Review of Recent Success in Drug Delivery. Clin. Transl. Med. 2017, 6 (44), 1–21. 10.1186/s40169-017-0175-0. [DOI] [PMC free article] [PubMed] [Google Scholar]
- Wicki A.; Witzigmann D.; Balasubramanian V.; Huwyler J. Nanomedicine in Cancer Therapy: Challenges, Opportunities, and Clinical Applications. J. Controlled Release 2015, 200, 138–157. 10.1016/j.jconrel.2014.12.030. [DOI] [PubMed] [Google Scholar]
- Rittchen S.; Boyd A.; Burns A.; Park J.; Fahmy T. M.; Metcalfe S.; Williams A. Myelin Repair in Vivo Is Increased by Targeting Oligodendrocyte Precursor Cells with Nanoparticles Encapsulating Leukaemia Inhibitory Factor (LIF). Biomaterials 2015, 56, 78–85. 10.1016/j.biomaterials.2015.03.044. [DOI] [PMC free article] [PubMed] [Google Scholar]
- Dong X. Current Strategies for Brain Drug Delivery. Theranostics 2018, 8 (6), 1481–1493. 10.7150/thno.21254. [DOI] [PMC free article] [PubMed] [Google Scholar]
- Qi F.; Wu J.; Li H.; Ma G. Recent Research and Development of PLGA/PLA Microspheres/Nanoparticles: A Review in Scientific and Industrial Aspects. Front. Chem. Sci. Eng. 2019, 13 (1), 14. 10.1007/s11705-018-1729-4. [DOI] [Google Scholar]
- Jonderian A.; Maalouf R. Formulation and in Vitro Interaction of Rhodamine-B Loaded PLGA Nanoparticles with Cardiac Myocytes. Front. Pharmacol. 2016, 7 (DEC), 1–7. 10.3389/fphar.2016.00458. [DOI] [PMC free article] [PubMed] [Google Scholar]
- Vanden-Hehir S.; Tipping W. J.; Lee M.; Brunton V. G.; Williams A.; Hulme A. N. Raman Imaging of Nanocarriers for Drug Delivery. Nanomaterials 2019, 9 (3), 341. 10.3390/nano9030341. [DOI] [PMC free article] [PubMed] [Google Scholar]
- Kalluru R.; Fenaroli F.; Westmoreland D.; Ulanova L.; Maleki A.; Roos N.; Paulsen Madsen M.; Koster G.; Egge-Jacobsen W.; Wilson S.; Roberg-Larsen H.; Khuller G. K.; Singh A.; Nystrom B.; Griffiths G. Poly(Lactide-Co-Glycolide)-Rifampicin Nanoparticles Efficiently Clear Mycobacterium Bovis BCG Infection in Macrophages and Remain Membrane-Bound in Phago-Lysosomes. J. Cell Sci. 2013, 126 (14), 3043–3054. 10.1242/jcs.121814. [DOI] [PubMed] [Google Scholar]
- Gentile P.; Chiono V.; Carmagnola I.; Hatton P. V. An Overview of Poly(Lactic-Co-Glycolic) Acid (PLGA)-Based Biomaterials for Bone Tissue Engineering. Int. J. Mol. Sci. 2014, 15 (3), 3640–3659. 10.3390/ijms15033640. [DOI] [PMC free article] [PubMed] [Google Scholar]
- Vicente N. B; Zamboni J. E D.; Adur J. F; Paravani E. V; Casco V. H. Photobleaching Correction in Fluorescence Microscopy Images. J. Phys. Conf. Ser. 2007, 90 ( (1), ), 012068. 10.1088/1742-6596/90/1/012068. [DOI] [Google Scholar]
- Tipping W. J.; Lee M.; Serrels A.; Brunton V. G.; Hulme A. N. Stimulated Raman Scattering Microscopy: An Emerging Tool for Drug Discovery. Chem. Soc. Rev. 2016, 45 (8), 2075–2089. 10.1039/C5CS00693G. [DOI] [PMC free article] [PubMed] [Google Scholar]
- Krafft C.; Schie I. W.; Meyer T.; Schmitt M.; Popp J. Developments in Spontaneous and Coherent Raman Scattering Microscopic Imaging for Biomedical Applications. Chem. Soc. Rev. 2016, 45 (7), 1819–1849. 10.1039/C5CS00564G. [DOI] [PubMed] [Google Scholar]
- Yakovlev V. V.; Petrov G. I.; Zhang H. F.; Noojin G. D.; Denton M. L.; Thomas R. J.; Scully M. O. Stimulated Raman Scattering: Old Physics, New Applications. J. Mod. Opt. 2009, 56 (18–19), 1970–1973. 10.1080/09500340903082671. [DOI] [PMC free article] [PubMed] [Google Scholar]
- Li Y.; Wang Z.; Mu X.; Ma A.; Guo S. Raman Tags: Novel Optical Probes for Intracellular Sensing and Imaging. Biotechnol. Adv. 2017, 35 (2), 168–177. 10.1016/j.biotechadv.2016.12.004. [DOI] [PubMed] [Google Scholar]
- Wei L.; Hu F.; Shen Y.; Chen Z.; Yu Y.; Lin C. C.; Wang M. C.; Min W. Live-Cell Imaging of Alkyne-Tagged Small Biomolecules by Stimulated Raman Scattering. Nat. Methods 2014, 11 (4), 410–412. 10.1038/nmeth.2878. [DOI] [PMC free article] [PubMed] [Google Scholar]
- Hong S.; Chen T.; Zhu Y.; Li A.; Huang Y.; Chen X. Live-Cell Stimulated Raman Scattering Imaging of Alkyne-Tagged Biomolecules. Angew. Chem., Int. Ed. 2014, 53 (23), 5827–5831. 10.1002/anie.201400328. [DOI] [PubMed] [Google Scholar]
- Yamakoshi H.; Dodo K.; Palonpon A.; Ando J.; Fujita K.; Kawata S.; Sodeoka M. Alkyne-Tag Raman Imaging for Visualization of Mobile Small Molecules in Live Cells. J. Am. Chem. Soc. 2012, 134 (51), 20681–20689. 10.1021/ja308529n. [DOI] [PubMed] [Google Scholar]
- Tipping W. J.; Lee M.; Serrels A.; Brunton V. G.; Hulme A. N. Imaging Drug Uptake by Bioorthogonal Stimulated Raman Scattering Microscopy. Chem. Sci. 2017, 8 (8), 5606–5615. 10.1039/C7SC01837A. [DOI] [PMC free article] [PubMed] [Google Scholar]
- Zhao Z.; Shen Y.; Hu F.; Min W. Applications of Vibrational Tags in Biological Imaging by Raman Microscopy. Analyst 2017, 142, 4018–4029. 10.1039/C7AN01001J. [DOI] [PMC free article] [PubMed] [Google Scholar]
- Li S.; Chen T.; Wang Y.; Liu L.; Lv F.; Li Z.; Huang Y.; Schanze K. S.; Wang S. Conjugated Polymer with Intrinsic Alkyne Units for Synergistically Enhanced Raman Imaging in Living Cells. Angew. Chem., Int. Ed. 2017, 56 (43), 13455–13458. 10.1002/anie.201707042. [DOI] [PubMed] [Google Scholar]
- Hu F.; Brucks S. D.; Lambert T. H.; Campos L. M.; Min W. Stimulated Raman Scattering of Polymer Nanoparticles for Multiplexed Live-Cell Imaging. Chem. Commun. 2017, 53 (46), 6187–6190. 10.1039/C7CC01860F. [DOI] [PMC free article] [PubMed] [Google Scholar]
- Min W.; Freudiger C. W.; Lu S.; Xie X. S. Coherent Nonlinear Optical Imaging: Beyond Fluorescence Microscopy. Annu. Rev. Phys. Chem. 2011, 62 (1), 507–530. 10.1146/annurev.physchem.012809.103512. [DOI] [PMC free article] [PubMed] [Google Scholar]
- McCarthy K. D.; de Vellis J. Preparation of Separate Astroglial and Oligodendroglial Cell Cultures from Rat Cerebral Tissue. J. Cell Biol. 1980, 85 (June), 890–902. 10.1083/jcb.85.3.890. [DOI] [PMC free article] [PubMed] [Google Scholar]
- Moon S. Il; Lee C. W.; Miyamoto M.; Kimura Y. Melt Polycondensation of L-Lactic Acid with Sn(II) Catalysts Activated by Various Proton Acids: A Direct Manufacturing Route to High Molecular Weight Poly(L-Lactic Acid). J. Polym. Sci., Part A: Polym. Chem. 2000, 38 (9), 1673–1679. . [DOI] [Google Scholar]
- Gao Q.; Lan P.; Shao H.; Hu X. Direct Synthesis with Melt Polycondensation and Microstructure Analysis of Poly(L-Lactic Acid-Co-Glycolic Acid). Polym. J. 2002, 34 (11), 786–793. 10.1295/polymj.34.786. [DOI] [Google Scholar]
- Ember K. J. I.; Hoeve M. A.; McAughtrie S. L.; Bergholt M. S.; Dwyer B. J.; Stevens M. M.; Faulds K.; Forbes S. J.; Campbell C. J. Raman Spectroscopy and Regenerative Medicine: A Review. npj Regen. Med. 2017, 2 (1), 12. 10.1038/s41536-017-0014-3. [DOI] [PMC free article] [PubMed] [Google Scholar]
- D’Avila Carvalho Erbetta C. Synthesis and Characterization of Poly(D,L-Lactide-Co-Glycolide) Copolymer. J. Biomater. Nanobiotechnol. 2012, 3 (2), 208–225. 10.4236/jbnb.2012.32027. [DOI] [Google Scholar]
- Cairns S. A.; Schultheiss A.; Shaver M. P. A Broad Scope of Aliphatic Polyesters Prepared by Elimination of Small Molecules from Sustainable 1,3-Dioxolan-4-Ones. Polym. Chem. 2017, 8 (19), 2990–2996. 10.1039/C7PY00254H. [DOI] [Google Scholar]
- Xu Y.; Perry M. R.; Cairns S. A.; Shaver M. P.. Understanding the Ring-Opening Polymerisation of Dioxolanones. Polym. Chem. 2019, 10, 3048. 10.1039/C8PY01695J. [DOI] [Google Scholar]
- Feczkó T.; Tóth J.; Dósa G.; Gyenis J. Influence of Process Conditions on the Mean Size of PLGA Nanoparticles. Chem. Eng. Process. 2011, 50 (8), 846–853. 10.1016/j.cep.2011.05.006. [DOI] [Google Scholar]
- Filipe V.; Hawe A.; Jiskoot W. Critical Evaluation of Nanoparticle Tracking Analysis (NTA) by NanoSight for the Measurement of Nanoparticles and Protein Aggregates. Pharm. Res. 2010, 27 (5), 796–810. 10.1007/s11095-010-0073-2. [DOI] [PMC free article] [PubMed] [Google Scholar]
- Gross J.; Sayle S.; Karow A. R.; Bakowsky U.; Garidel P. Nanoparticle Tracking Analysis of Particle Size and Concentration Detection in Suspensions of Polymer and Protein Samples: Influence of Experimental and Data Evaluation Parameters. Eur. J. Pharm. Biopharm. 2016, 104, 30–41. 10.1016/j.ejpb.2016.04.013. [DOI] [PubMed] [Google Scholar]
- Vilhardt F. Microglia: Phagocyte and Glia Cell. Int. J. Biochem. Cell Biol. 2005, 37 (1), 17–21. 10.1016/j.biocel.2004.06.010. [DOI] [PubMed] [Google Scholar]
- Neha B.; Ganesh B.; Preeti K. Drug Delivery to The Brain Using Polymeric Nanoparticles: A Review. Int. J. Pharm. Life Sci. 2013, 2 (3), 107–132. 10.3329/ijpls.v2i3.15457. [DOI] [Google Scholar]
- Masserini M. Nanoparticles for Brain Drug Delivery. ISRN Biochem. 2013, 2013, 1–18. 10.1155/2013/238428. [DOI] [PMC free article] [PubMed] [Google Scholar]
- Zhang H.; Jarjour A. A.; Boyd A.; Williams A. Central Nervous System Remyelination in Culture — A Tool for Multiple Sclerosis Research. Exp. Neurol. 2011, 230 (1), 138–148. 10.1016/j.expneurol.2011.04.009. [DOI] [PMC free article] [PubMed] [Google Scholar]
- Pappalardo D.; Mathisen T.; Finne-Wistrand A. Biocompatibility of Resorbable Polymers: A Historical Perspective and Framework for the Future. Biomacromolecules 2019, 20 (4), 1465–1477. 10.1021/acs.biomac.9b00159. [DOI] [PubMed] [Google Scholar]
Associated Data
This section collects any data citations, data availability statements, or supplementary materials included in this article.


