

Abstract
How does the content of visual working memory influence the way we process the visual environment? We addressed this question using the steady-state visual evoked potential (SSVEP), which provides a discernible measure of visuocortical activation to multiple stimuli simultaneously. Fifty-six adults were asked to remember a set of two oriented gratings. During the retention interval, two frequency-tagged oriented gratings were presented to probe the visuocortical processing of matching versus mismatching orientations relative to the memory set. Matching probes prompted an increased visuocortical response, whereas mismatching stimuli were suppressed. This suggests that the visual cortex prioritizes attentional selection of memory-relevant features at the expense of non-memory-relevant features. When two memory items were probed simultaneously, visuocortical amplification alternated between the two stimuli at a rate of 3 Hz to 4 Hz, consistent with the rate of attentional sampling of sensory events from the external world. These results suggest a serial, single-item attentional sampling of remembered features.
Keywords: memory, attention, visual memory, electrophysiology, perception, open data, open materials
Working memory holds information available for use in goal-directed cognitive processes (Cowan, 2017; Oberauer, 2009). Using this information often requires the selection of a subset of items from a larger set (Olivers, Meijer, & Theeuwes, 2006). This process can be conceptualized as a form of selective attention (Chun & Johnson, 2011). Accordingly, a focus of attention is part of many models of working memory, as a mechanism for selecting specific representations from those maintained in memory (Oberauer & Hein, 2012; Olivers, Peters, Houtkamp, & Roelfsema, 2011).
One situation in which the focus of attention affects behavior is during the visual exploration of the environment. For example, an item maintained in working memory directs attention to external visual stimuli that match the remembered item (Soto, Hodsoll, Rotshtein, & Humphreys, 2008). If one of several items in working memory becomes prioritized (e.g., by a cue presented during the retention interval), only the prioritized item, not the other items in working memory, directs visual attention (van Moorselaar, Battistoni, Theeuwes, & Olivers, 2015). This finding suggests that only working memory items in the focus of attention direct perceptual attention toward matching stimuli. When multiple items are held in working memory with equal priority, the tendency of matching stimuli in the environment to attract attention is reduced (van Moorselaar, Theeuwes, & Olivers, 2014). These observations support the idea that the focus of attention usually holds only a single item at a time (Oberauer & Hein, 2012; Olivers et al., 2011). Other behavioral evidence, however, suggests that attention can be directed to two stimuli simultaneously when each of them matches an item held in working memory (Hollingworth & Beck, 2016).
At the neural level, maintaining a task-relevant feature representation biases early visual neurons to selectively amplify visuocortical activation for perceptual items containing this feature (Maunsell & Treue, 2006). This bias is observed across the visual field (Andersen, Muller, & Hillyard, 2009), including for task-irrelevant distractors (Olivers & Eimer, 2011; Soto et al., 2008). Moreover, the neural representation of these low-level features is amplified at the cost of other, competing stimuli, which are suppressed at the level of the primary visual cortex (Andersen et al., 2009; Mangun & Hillyard, 1995; Müller et al., 2006; Störmer & Alvarez, 2014). The spatially global and competitive nature of selective amplification of feature values should make it difficult to select two different features at the same time. These considerations lend plausibility to the assumption that the focus of attention selects one item in working memory at a time, which in turn directs attention to matching stimuli one at a time.
Here, we investigated what happens to selective cortical amplification when one or two stimuli each match an item in working memory. To capture the visuocortical response to multiple stimuli simultaneously, we used the steady-state visual evoked potential (SSVEP; Norcia, Appelbaum, Ales, Cottereau, & Rossion, 2015). The SSVEP reflects visuocortical activity (i.e., primarily V1) in humans (Di Russo et al., 2007) and is measured by frequency-tagging items on the screen. The SSVEP allows the simultaneous quantification of the visuocortical representation of multiple visual stimuli and thus can be used to investigate any existing bias or prioritized processing of one stimulus at the cost of another (Mangun & Hillyard, 1990). In three experiments, participants memorized the orientation of two gratings that were subsequently probed during a retention interval with two frequency-tagged gratings. We made probe stimuli either task relevant (Experiments 1 and 2) or task irrelevant (Experiment 3) to examine the extent to which prioritization based on working memory content depends on the task relevance of the probe array. Previous research suggests that stimuli matching an item in working memory facilitates selective attention to the features of that item (Mendoza, Schneiderman, Kaul, & Martinez-Trujillo, 2011; Olivers & Eimer, 2011), resulting in increased visuocortical activity (Gayet et al., 2017; Harrison & Tong, 2009; Lorenc, Sreenivasan, Nee, Vandenbroucke, & D’Esposito, 2018; Rademaker, van de Ven, Tong, & Sack, 2017; Serences, Ester, Vogel, & Awh, 2009). Here, the SSVEP power to each probe stimulus was used to infer which stimuli were attended. On the assumption that visual attention is directed to stimuli matching working memory items in the focus of attention, we can infer which items in working memory were being selectively attended.
We addressed three questions. First, does the attentive selection of stimuli matching an item in working memory affect activity in visual cortex as observed in the SSVEP response to probes? Experiment 1 provided a proof-of-principle analysis by testing the hypothesis that the visuocortical response to a probe is selectively amplified if that probe matches an item in working memory. Second, when one of two perceptual stimuli matches an item in working memory, what is the fate of the other, competing stimulus? We tested the hypothesis that visuocortical responses to nonmatching stimuli are suppressed when such stimuli co-occur with a matching item. And finally, does the visual cortex simultaneously amplify the features of two items held in working memory? In Experiments 2 and 3, we compared five models describing different interactions between the representations of multiple stimuli matching multiple items in working memory. Exploiting the high temporal resolution of SSVEP data, we tested whether two stimuli that both match a different working memory representation are attended to simultaneously or sequentially.
Method
Participants
Fifty-six healthy volunteers (38 females; mean age = 19.1 years, SD = 1.4) were recruited from the student population of the University of Florida and given course credit for their participation in Experiment 1 (N = 16), Experiment 2 (N = 20), or Experiment 3 (N = 20). The sample size for Experiment 1 was based on sample sizes used in previous studies, and the sample sizes for Experiments 2 and 3 were based on a power analysis from the data collected in Experiment 1. Six additional participants were excluded because their task performance was at chance or because of excessive electroencephalogram (EEG) artifacts (requiring exclusion of more than 50% of trials). All procedures were conducted in accordance with the Declaration of Helsinki and approved by the institutional review board of the University of Florida. Each participant gave written informed consent prior to participating, reported normal or corrected-to-normal vision, and reported no history of neurological or psychiatric disorders.
Procedure and stimuli
Participants were seated in a small, dimly lit room at a distance of approximately 1.4 m from a 23-in. 3-D LED monitor (Samsung LS23A950) set to a vertical refresh rate of 120 Hz. EEG sensors were applied to their scalp. After receiving verbal and written instructions, each participant completed one of the three experiments. In all experimental designs (Fig. 1), a black fixation circle subtending 0.5° of visual angle was presented in the center of a gray background for the duration of the experiment, and participants were instructed to never move their eyes from fixation. Following a 3-s to 4-s intertrial interval, each trial began with a set of two items (the memory set) presented simultaneously to the left and right of fixation for 2 s. The memory set consisted of two Gabor patches of different orientations: −84°, −36°, −12°, 12°, 36°, or 84°, relative to a vertical axis. Participants were instructed to remember the orientations for later report. All Gabor patches spanned 4.5° of visual angle, and their inner edges were 1° away from fixation. They had a spatial frequency of 1.8 cycles per degree, a Michelson contrast of 50%, and a mean luminance of 42 cd/m2, which was measured with a Mavo-Spot luminance meter (Gossen, Nuremburg, Germany). The memory set was subsequently masked for 2 s by random white-noise squares, which spanned 11° of visual angle and had the same mean luminance as the Gabor stimuli.
Fig. 1.

Experimental design. The six Gabor patch stimuli used for all three experiments (a) had orientations of (top row, from left to right) −84°, −36°, and −12° and of (bottom row, left to right) 12°, 60°, or 84°, relative to a vertical axis. The head model (b) approximates the locations of the 129 sensors used for the electroencephalogram recording. The four occipital sensors extracted for analysis of steady-state visual evoked potentials are highlighted in black. An example trial sequence for Experiments 1 and 2 is shown in (c). Participants first viewed a memory set consisting of two Gabor patches, which were shown to the left and right of fixation, and participants were asked to remember the orientation of both. Following a mask, they saw a probe array, in which two Gabor patches were each phase-reversing at different frequencies, either 10 Hz or 13.3 Hz. Participants indicated whether or not a probe matched either orientation in the memory set. An example trial sequence for Experiment 3 is shown in (d). The trial sequence was the same as in Experiments 1 and 2 until the response. In Experiment 3, participants were asked to recall the orientation of the memory set Gabor that had appeared in the same on-screen location. Participants rotated the Gabor, using a mouse, until it had the remembered orientation, and then clicked to enter their response.
Next, two phase-reversing Gabor patches of different orientations (i.e., the probe array) replaced the mask for 3.6 s. The items in the probe array appeared above and below the fixation circle, and each inner edge was 1° of visual angle away from the fixation circle. The probes were shown in different locations from the memory set to emphasize stimulus orientation (rather than position) as the relevant feature and to avoid carryover effects based on location in the memory set. For half the participants, the upper item in the probe array phase-reversed at 10 Hz, and the lower item phase-reversed at 13.3 Hz; for the other half of the participants, the lower item in the probe array phase-reversed at 10 Hz, and the upper item phase-reversed at 13.3 Hz. The reversals at these frequencies evoked two frequency-discriminable SSVEPs, which allowed for simultaneous measurement of the visuocortical response to the upper and lower probe Gabor patches. In Experiment 1, each trial contained either no matching probe (48 trials) or one matching probe (52 trials). In Experiments 2 and 3, each trial contained 0, 1, or 2 matching probes: There were 26 upper-match trials, 26 lower-match trials, 26 both-match trials, and 62 no-match trials. The no-match condition occurred more frequently than any other condition to avoid a response bias for matching trials.
In Experiments 1 and 2, the mask was followed by a centrally presented question mark, prompting participants to indicate whether any item in the probe array matched the orientation of the item in the memory set. Because responses occurred in response to an imperative stimulus at the end of the trial, response times were considered not informative and are not reported here. Half of the participants pressed the left arrow key to indicate a match and the right arrow key to indicate a nonmatch; this response mapping was reversed for the other half of participants. In Experiment 3, memory was tested in a different way that was designed to render the probe array task irrelevant: A response Gabor appeared either to the left or to the right of fixation. The location indicated which item in the memory set participants should report. Participants then used the mouse to rotate the response Gabor until it matched the orientation of the respective item in the memory set; they clicked the mouse to record their response. The mouse allowed participants to respond in steps of 0.5° of rotation. Thus, in Experiment 3, the probe array was irrelevant for the task, allowing us to investigate whether a stimulus matching a representation in working memory attracts attention even when it is irrelevant for the task.
Electrophysiological data acquisition
EEG data were recorded continuously with a 128-channel Geodesic Sensor Net (Electrical Geodesics, Eugene, OR), as shown in Figure 2c. Electrodes covered wide areas of the head, including the face and neck. Impedance for each electrode was kept below 50 kOhms, and the vertex electrode (Cz) was used as the recording reference. All channels were digitized at a rate of 500 Hz using a Butterworth on-line low-pass filter that had a 3-dB cutoff at 49 Hz and a high-pass filter with a 3-dB cutoff at 0.05 Hz.
Fig. 2.
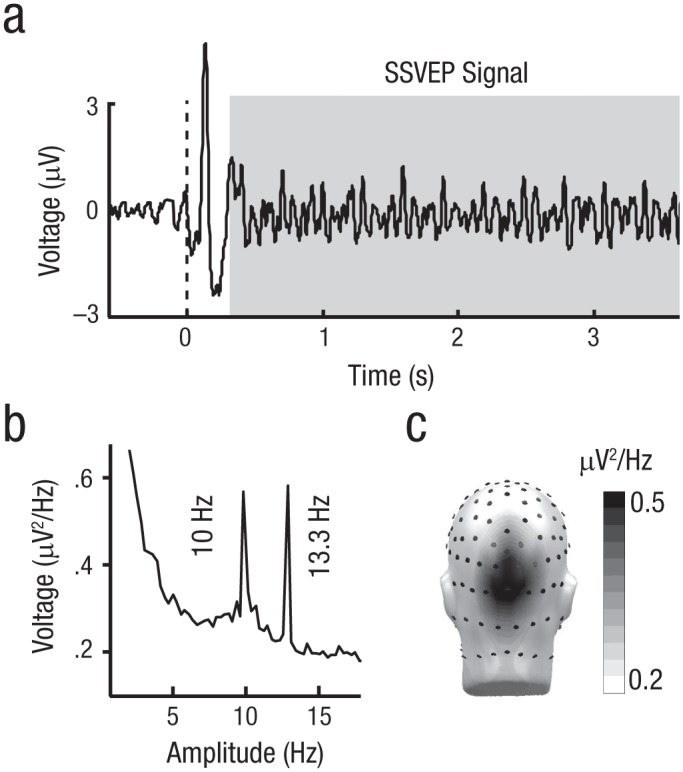
Quantifying visuocortical activity using the steady-state visual evoked potential (SSVEP). The power of the SSVEP time series during the probe presentation (a) is shown averaged across all trials and participants. Values were taken from an Oz cluster. The time of probe presentation is indicated in gray. The power of the SSVEP in the frequency domain is shown in (b). The topography of the SSVEP power during the probe presentation (c) is interpolated across a head model depicting approximate electroencephalogram sensor locations.
Segmenting, rejection of trials, and interpolated channels
Continuous data were digitally filtered off-line using a second-order Butterworth high-pass filter with a 3-dB cutoff at 4 Hz. Epochs were extracted from 600 ms before to 4,000 ms after the onset of the phase-reversed Gabor patches. These segments were submitted to a semiautomated artifact-detection procedure designed for multichannel electrophysiology (Nolan, Whelan, & Reilly, 2010). This method calculates statistical metrics (mean, variance, mean correlation, range, Hurst exponents) to identify channels, epochs, and specific trial-channel combinations that are contaminated with artifacts. It then interpolates outlying (z score > ±3) channels and discards outlying (bad) trials. We did not correct eye artifacts so we could screen the data for eye movements. Trials in which an eye movement was made were discarded to avoid artificial amplification of the SSVEP as a consequence of foveal, rather than parafoveal, processing. Artifact-free trials with correct responses were obtained for Experiment 1 (no-match condition: 76%, single-match condition: 82%), Experiment 2 (no-match condition: 72%, single-match condition: 80%, both-match condition: 86%), and Experiment 3 (no-match condition: 67%, single-match condition: 66%, both-match condition: 64%). For all subsequent analyses, trials were randomly discarded from conditions with more trials to obtain equal trial counts for each condition; this was done for each participant, ensuring similar signal quality across conditions.
Quantifying the SSVEP signal
Across all three experiments, the visuocortical response to each probe grating was quantified by extracting the frequency-specific SSVEP amplitude. This measure was obtained by first averaging artifact-free segments in the time domain, separately for each experimental condition (Fig. 2b). Power was then obtained across a time window from 300 ms to 3,300 ms after probe-array onset by multiplying the data with a cosine square window (40-ms transition from 0 to 1), conducting a Fourier transformation, multiplying the resulting magnitude by two, and normalizing by the number of points used. This time range was chosen to ensure exclusion of the visual onset potential (< 300 ms); to avoid occasional offset events (blinks, anticipatory responses), which sometimes occurred during the late portion of the probe presentation (> 300 ms); and most critically. to obtain a Fourier spectrum that contained bins at the exact tagging frequencies (i.e., 10 Hz and 13.33 Hz; Bach & Meigen, 1999). To estimate the SSVEP power specific to the upper and lower probe stimuli, respectively, the 10-Hz and 13.3-Hz powers were extracted separately from each sensor and then averaged across an Oz cluster (i.e., Oz and its three nearest neighbors). To obtain unbiased estimates of the SSVEP power from the different frequencies, we eliminated level differences in power across participants by z-transforming the power values across all stimulus conditions and frequencies for each participant. Thus, a value representing the relative visuocortical response was obtained separately for the upper and lower probes for each participant and condition.
Statistical analysis
Accuracy
In Experiments 1 and 2, in which participants responded yes or no to whether one of the probe gratings matched the orientation of a grating in the memory set, accuracy was defined as the percentage of correct responses. In Experiment 3, in which participants manually set the orientation of a response grating, accuracy was defined as the circular variance in reported orientation, in degrees, relative to the actual orientation. Accuracy for all experiments is reported in Table 1.
Table 1.
Accuracy in Experiments 1, 2, and 3
| Experiment 1 (%) |
Experiment 2 (%) |
Experiment 3 (°) |
||||
|---|---|---|---|---|---|---|
| Condition | M | SD | M | SD | M | SD |
| No match | 74.0 | 4.9 | 74.4 | 4.2 | 12.6 | 3.9 |
| Single match | 78.7 | 6.4 | 82.7 | 3.6 | 12.3 | 4.3 |
| Both match | 90.0 | 2.7 | 12.7 | 5.6 | ||
Note: For Experiments 1 and 2, the percentage of trials with a correct response is reported. For Experiment 3, we report the (circular) average deviation of the reported remembered orientation from the actual orientation.
Statistical comparison of SSVEP condition means
Experiment 1 served as a proof-of-concept study to examine the hypothesis that holding an item in working memory amplifies the visuocortical representation (SSVEP power) of a stimulus matching that item. To this end, the power representing each probe was compared in Experiment 1. Specifically, the power values associated with each probe were combined to yield conditions indicating the status of each probe relative to the memory set: The average z-transformed power of each probe in the no-match condition represented neural activity of probes that did not match any item of the memory set; the average power of the matching probe (regardless of probe location) was used in the single-match condition; and the average response to the mismatching probe (the nonmatching probe, which co-occurred with a matching probe) was used in the single-mismatch condition. We also assessed the extent to which the location of the probe affected the overall SSVEP power, using the location tag of the respective probes. We analyzed SSVEP power with a repeated measures analysis of variance (ANOVA), crossing factors of condition (no match, single upper match, single lower match) and probe location (upper-location frequency tag, lower-location frequency tag). Because there were no effects of probe location, all subsequent analyses were collapsed across the upper and lower probes.
Planned contrasts tested the alternative hypotheses described in the introduction. In all experiments, deviations from sphericity were addressed by using F and p statistics corrected by the Greenhouse-Geisser method; significant main effects and interactions were followed by post hoc ANOVAs and simple main-effects analyses where appropriate.
Bayesian model comparison on SSVEP power
To explicitly compare the potential models describing the impact of working memory selection on visuocortical processing, we tested five Bayesian linear mixed-effects models using the BayesFactor package (Version 0.9.0; Rouder, Morey, Speckman, & Province, 2012) implemented in the R environment (R Core Team, 2012). The “lmBF” function was used with its default settings, except that we modified the scaling factor of the effect size for fixed effects from 0.5 to . This larger scaling factor provided a more conservative estimate of the effect by shifting the prior for the effect size toward larger values (Rouder, Speckman, Sun, Morey, & Iverson, 2009). We used this function to compute Bayes factors for five specific linear models. Each model had a single predictor incorporating the model’s theoretical assumptions as contrasts over the four conditions: no match, single mismatch, single match, and both match, shown in Figure 3. We computed the likelihood ratio of each model (Mn) compared with a null model (M0) with a random intercept only.
Fig. 3.

Predictor vectors for each of the five models, separately for each of the four conditions. Model 1 has a simultaneous-attention-without-competition design with unlimited capacity; Model 2 had a simultaneous-attention-without-competition design but with limited capacity; Model 3 had a competition design with unlimited capacity; and Model 4 had a capacity-limited design with competition. Model 5 employed a sequential attention-switching model with competition: Each stimulus in the both-match condition received a boost roughly half of the time and the other half was inhibited.
Model 1 assumed that perceptual attention has unlimited capacity and would be directed simultaneously to both matching probes in the both-match condition. Selecting one probe would not suppress the other. Following this assumption, we reasoned that attention would boost the activation of each matching stimulus in the both-match condition as much as it did in the single-match condition. Therefore, the SSVEP power of matching probes should be equally high in the single-match condition and the both-match condition. The SSVEP power of the no-match and single-mismatch probes should be lower, and should not differ from each other, as reflected in the predictor vectors across the four conditions (no match: –1.0, single mismatch: –1.0, single match: 1.0, both match: 1.0).
Model 2 assumed that perceptual attention has limited capacity and would be directed simultaneously to both matching probes in the both-match condition. Selecting one probe would not suppress the other. Sharing capacity-limited attention between two matching probes should lead to each of them being activated less strongly than in the single-match condition, so that the SSVEP power for matching probes should be lower in the both-match condition than in the single-match condition. The single-mismatch power should be lower yet, and equal to the no-match condition, as reflected in the predictor vectors (no match: –0.75, single mismatch: –0.75, single match: 1.0, both match: 0.5).
Model 3 assumed that perceptual attention has unlimited capacity and would be directed simultaneously to both matching probes in the both-match condition. Selecting one probe would suppress the other. The single-match and both-match conditions should be equally high in power. Because of suppression, power for the single-mismatch condition should be lower than that for the no-match condition, as reflected in the predictor vectors (no match: –0.5, single mismatch: –1.5, single match: 1.0, both match: 1.0).
Model 4 assumed that perceptual attention has limited capacity and would be directed simultaneously to both matching probes in the both-match condition. Selecting one probe suppresses the other. The both-match condition should result in lower power than the single-match condition but higher power than the single-mismatch condition, as reflected in the predictor values (no match: –0.5, single mismatch: –1.0, single match: 1.0, both match: 0.5).
Model 5 assumed that perceptual attention is directed to one stimulus at a time and would switch between the probes in the both-match condition. Selecting one probe would suppress the other. The suppression assumption implies that when one of two probes is attended, the power of the other probe is reduced, relative to the level in the no-match condition. Therefore, the power of the single-mismatch condition should be lower than the power of the no-match condition. The single-match power is again predicted to be higher than that of the no-match baseline. For the both-match condition, we needed to average the predictions for the single-mismatch condition and the single-match condition. The former was predicted to be suppressed below baseline, and the latter was predicted to be boosted above baseline. If the boosting of a single match and the suppression of the concurrent single mismatch were of about the same size, we expected the SSVEP power for the both-match condition to be close to the no-match baseline, as reflected in the predictor values (no match: 0.0, single mismatch: –1.0, single match: 1.0, both match: 0.0). Note that the predictions of Model 5 are not the same as those for Model 4, because when attention is shared in time, each matching probe is not merely unattended half of the time but is selected against and therefore suppressed. In contrast, when attention is shared simultaneously, as Model 4 assumes, there is never a stimulus that is not attended. Consequently, no stimulus is ever suppressed in the both-match condition.
Single-trial selection index
To examine the hypothesis that visual working memory operates by shifting the focus of attention to one item at a time, we quantified the frequency with which a given patch was selected at the cost of the concurrent patch. Specifically, the time course of the SSVEP amplitude at each frequency was estimated for each artifact-free trial by means of a Hilbert transformation following narrow-band (±0.5 Hz) band-pass filtering (Butterworth, eighth order) at 10 Hz and 13.33 Hz. The Hilbert transformation yields an analytic version of a band-pass-filtered empirical signal, shifted by 90°, which allows estimation of the envelope of the SSVEP as the modulus of the empirical and analytic time series, calculated for each time point. For each trial, we obtained two SSVEP-amplitude time courses at sensor Oz, one for each tagging frequency, thus reflecting the visuocortical response to each patch of the probe array. The information of the 129-sensor array was pooled into a single time series for each tagging frequency by means of principal component analysis (PCA), with time points used as variables; this was followed by averaging across electrodes, weighted by PCA factor loadings. In each trial, these two time series were then z transformed across time points (to eliminate systematic amplitude differences between the 10-Hz and 13.33-Hz tags) and subtracted from each other (upper tag – lower tag), resulting in a difference envelope. The difference between the visuocortical responses at each point in time represents the extent to which one patch is selected over the other. The difference envelope tracks the time course of this difference and thereby the time course of selection of the upper probe (positive values) or lower probe (negative values). Note that the z transformation eliminated selective amplitude enhancement of one patch that was stable throughout the viewing epoch.
The difference envelope for each trial, spatially averaged across site Oz and its three nearest neighbors (paralleling the analyses described above), was then analyzed using a family of Morlet wavelet functions, with a Morlet parameter of 10, tuned to result in high-frequency specificity in the lower ranges of the spectrum where rhythmic sampling across the two stimuli was expected. Specifically, the convolution of the z-transformed difference envelopes and the data was computed for wavelets ranging between 0.87 Hz and 5.87 Hz in steps of 0.217 Hz. The resulting time-varying spectral power was high when visuocortical selection of one probe periodically alternated with selection of the other probe. Thus, this metric—which we refer to as the selection index—was suited to identify conditions and time periods in which the focus of attention was shifted back and forth between the two probes in a rhythmic fashion.
To evaluate condition-related differences in the selection indices obtained in Experiments 2 and 3, we used a massive univariate testing approach, computing an F contrast for each time point of the viewing epoch, with alpha level controlled by a permutation approach (Groppe, Urbach, & Kutas, 2011). Specifically, we defined F-contrast weights for the hypothesis that more alternating selective cortical processing of one probe would be seen in the both-match condition than in the single-match conditions and the no-match condition: both match > single match = no match (contrast values: 3, −1, −1, −1 for the no-match, single-mismatch, single-match, and both-match conditions, respectively). In addition, we also conducted F contrasts testing the hypotheses that single-match conditions prompt greater alternating processing than the no-match condition (contrast weights: 0, 1, 1, −2 for the no-match, single-mismatch, single-match, and both-match conditions, respectively). Comparing the selection index obtained in the four experimental conditions for each time point of the epoch resulted in a time series of F values for each experiment. Critical F values were determined by calculating a permutation distribution under the null hypothesis that conditions did not differ, using 8,000 random permutations of the data set. In each permutation, the selection-index time-series data were randomly shuffled within participants across the four experimental conditions, and a new time series of F values was calculated. The maximum F value of this time series entered the test distribution, ultimately consisting of 8,000 maximum F values. The 95% tail of this distribution served as the statistical significance threshold.
Results
Behavioral data
Accuracy across the three experiments is reported in Table 1. For Experiments 1 and 2, the accuracies across conditions were not comparable: No-match conditions required a “no” response, whereas the other conditions required a “yes” response, so any bias toward one response would generate differences in accuracies between these conditions. The single-match and both-match conditions in Experiment 2 differed in the chance of detecting at least one match, so better accuracy in the both-match condition was expected by chance alone. Therefore, we did not statistically compare accuracies in these experiments.
In Experiment 3, when participants were required to report the orientation of the remembered grating, the number of matching probes did not affect the difference in the reported orientation from the actual orientation. Specifically, the no-match condition did not significantly differ from the single-match condition, t(19) = 0.50, p = .62; the single-match condition did not significantly differ from the both-match condition, t(19) = −0.4, p = .68; and the no-match condition did not significantly differ from the both-match condition, t(19) = −0.1, p = .92.
Mean SSVEP amplitude
In Experiment 1, the control ANOVA testing for any potential effects of probe location (Fig. 4) resulted in a main effect of condition, F(2, 30) = 5.251, p = .011, ηp2 = .259, and no main effect of location or interaction. A follow-up contrast analysis was conducted to test the hypothesis that the single-mismatch condition was attenuated (suppressed) relative to the no-match condition, and the single-match condition was amplified relative to the no-match condition; thus, the weights for the no-match, single-mismatch, and single-match conditions were 0, −1, and 1, respectively. This resulted in a significant contrast in which the single-mismatch condition was suppressed and the single-match condition was amplified relative to the no-match condition, F(1, 15) = 11.06, p = .005, r2 = .64.
Fig. 4.
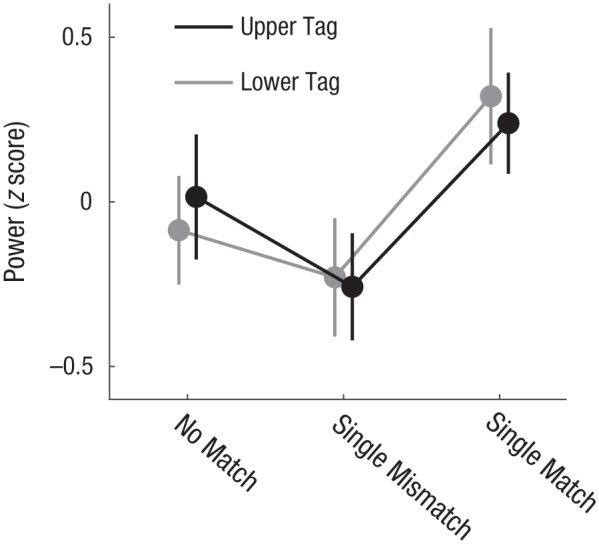
Power of the steady-state visual evoked potential (SSVEP) in Experiment 1 as a function of condition and location of the probe (i.e., the upper tag and lower tag). We compared trials in which neither probe matched an item in the memory set (i.e., the no-match condition) with trials in which a single probe matched an item in the memory set. The single-match condition was subdivided into the tagging frequency of the matching probe (i.e., the single-match condition) and that of the nonmatching probe (i.e., the single-mismatch condition). As a control, we also assessed whether the location of the probe showed any overall differences in SSVEP power. Error bars represent standard errors of the mean.
In Experiment 2, the ANOVA resulted in a main effect of condition, F(2, 38) = 3.276, p = .049, ηp2 = 1.47 (Fig. 5). A follow-up trend analysis across the no-match, single-mismatch, single-match, and both-match conditions with contrast weights 0, −1, 1, and 0, respectively, suggested that the single-mismatch condition was suppressed and the single-match condition was amplified, relative to the no-match and both-match conditions, F(1, 19) = 9.44, p = .006, r2 = .57. In Experiment 3, the ANOVA also resulted in a main effect of condition, F(1, 19) = 6.391, p = .02, ηp2 = .252. A follow-up trend analysis across the no-match, single-mismatch, single-match, and both-match conditions with contrast weights 0, −1, 1, and 0, respectively, suggested that the single-mismatch condition was suppressed and the single-match condition was amplified, relative to the no-match and both-match conditions, F(1, 19) = 19.35, p < .001, r2 = .70.
Fig. 5.
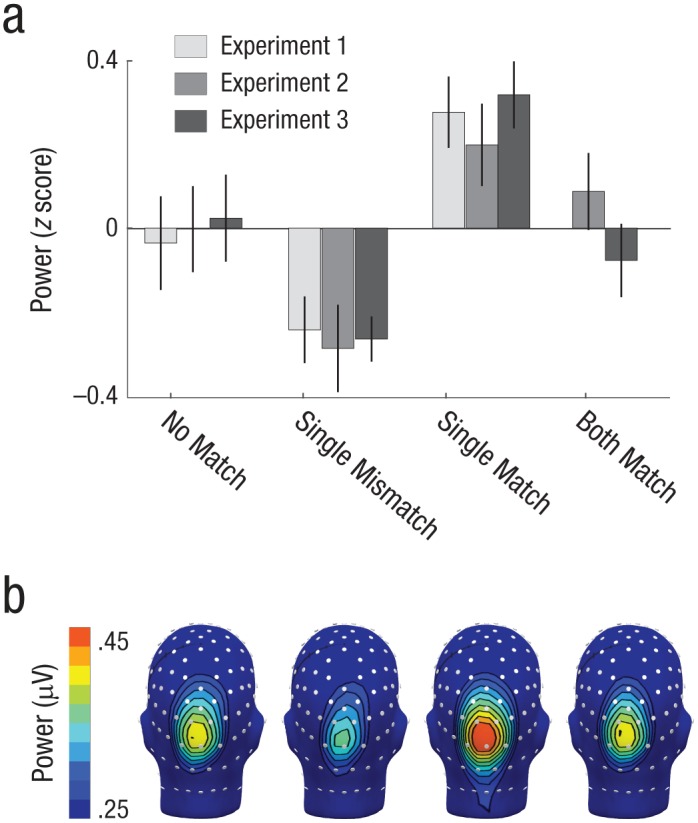
Steady-state visual evoked potential (SSVEP) power differences across experimental conditions. Mean power of the SSVEP values while participants viewed the probe array (a) is shown as a function of condition and experiment. Error bars represent standard errors of the mean. The scalp topographies (b) depict the mean SSVEP power for each condition across Experiments 2 and 3, interpolated across a head model with approximate electroencephalogram sensor locations indicated in white. The conditions follow the same order as in (a).
Bayesian analysis of SSVEP power
The Bayes factors in favor of Models 1 through 5 in comparison with the null model were 152, 1,149, 3,864, 15,549, and 474,838, respectively. Thus, strongest support was obtained for Model 5. This is evidence for a model in which perceptual attention has limited capacity, attention alternates between stimuli when two stimuli are functionally relevant, and the stimulus not currently selected is suppressed. The Bayes factor comparing the likelihood of the data under Model 5 with the likelihood of the data under Model 4 can be calculated as the ratio of these two Bayes factors relative to the null model; this gives a result of 30.5. Thus, if we assume equal priors for all models, then in light of the data, Model 5 should be regarded as 30 times more probable than Model 4 and even more probable compared with any of the other models. Model 5 assumes that in the both-match condition, perceptual attention alternates between the two matching stimuli. Under the assumption that perceptual attention reflects the information in the focus of attention in working memory, this model implies that the focus of attention either is directed at neither stimulus or alternates between the two items in working memory. If the focus alternates, we would expect an oscillatory pattern of SSVEP amplitude fluctuations over time in the both-match condition. Therefore, we next investigated whether we could find evidence for such an oscillation.
Electrophysiological single-trial selection index
The time-varying selection indices of the SSVEP in each condition reflect the degree to which selectivity of neural amplification or suppression fluctuates in an oscillatory pattern over time with a given frequency (Figs. 6a and 6b). Robust oscillatory power reflective of alternating selection of stimuli was observed in the 3-Hz to 4-Hz range throughout experiments and conditions (Fig. 6c). We compared the time-varying power across the four conditions, computing an F contrast for each time point and frequency, which represented our prediction of higher fluctuation in the both-match condition than in the other conditions (see the Method section). We determined this F contrast to be significant if the F value fell above the 97.5th percentile of 8,000 maximum F values generated from randomly permuted data (Fig. 6d). The F values exceeded significance for fluctuation frequencies between 2.84 Hz and 3.70 Hz from 488 ms to 922 ms (Experiment 2) and for fluctuation frequencies between 2.61 Hz and 3.26 Hz from 408 ms to 860 ms (Experiment 3) following onset of the probe stimuli. The significant F values index the time periods during which the rhythmic fluctuation of selectivity over time was higher in the condition in which both items matched working memory representations than in any other condition (Fig. 6e). By contrast, no F value for the contrast of single-match to no-match exceeded the permutation threshold.
Fig. 6.

Analysis of oscillatory selection in working memory. The procedure by which the power envelopes at each tagging frequency were z transformed and by which their difference was used to index selectivity in the visuocortical representation of the item is shown in (a). The power topography of one individual participant’s steady-state visual evoked potential (SSVEP), as identified using a principal component analysis (PCA) is shown in (b). The time course of that selectivity index was submitted to time-frequency analysis (c) to determine the frequency at which selectivity fluctuates regularly over time in each of the four experimental conditions. The power of that fluctuation reflects the strength of evidence for attentional selection alternating between probes in a rhythmic fashion. The increasing strength of oscillatory selection was statistically evaluated using F-contrast maps, shown in (d). The mean oscillatory power at 3 Hz during the first second of probe presentation is shown for the four experimental conditions in (e). Error bars depict standard errors of the mean.
Discussion
We investigated (a) whether attentional selection of stimuli matching an item in working memory affects visuocortical activity, (b) whether that activity can be detected using the SSVEP technique, (c) whether the nonattended stimulus, is suppressed when working memory content facilitates attending to one of two visual stimuli, and (d) how two items held in working memory modulate representations of two matching probes in visual cortex across time. In Experiment 1, we observed increased SSVEP amplitudes to the matching probe (i.e., the orientation held in memory), as expected if visuocortical capacity was selectively directed to it. The sensitivity of probe-evoked SSVEPs to working memory content provides additional evidence for the hypothesis that the contents of working memory affect visual attention to a matching stimulus (van Moorselaar et al., 2014), and this lays the groundwork for addressing the next two questions.
Nonmatching stimuli were suppressed when competing with matching stimuli: The visuocortical response of nonmatching stimuli was diminished by the presence of a matching stimulus, compared with another nonmatching stimulus. This is consistent with theories of selective attention that assume that selecting one stimulus entails suppression of the representations of other, potentially competing stimuli (Bridwell & Srinivasan, 2012; Reynolds & Heeger, 2009).
To address the question of how perceptual items are selectively attended when there are multiple matching items held in visual working memory, we considered five alternative models, crossing three assumptions about the allocation of perceptual attention with two assumptions about the extent to which attention to one probe entails suppression of the unattended probe. The best-fitting model incorporated the assumption that attention is directed to one stimulus at a time while suppressing the other: When two stimuli match an item in working memory, attention alternates between the two stimuli. Because visual attention in the present experiments was controlled by a match to an item in working memory, the best explanation for this alternation is that the focus of attention in working memory selects one item at a time in an alternating fashion, which in turn directs attention to matching stimuli.
In the first two experiments, the nature of the choice response encouraged participants to attend to the probes matching a memory item. In contrast, in Experiment 3, the probe stimuli were used as distractors that were irrelevant to the task, so there was no benefit in attending to them (Fig. 1). In Experiment 3, we removed the task relevance of the probe stimuli and obtained the same pattern of results. This strengthens the argument that attention serially selects stimuli that match the current content of the focus of attention in working memory regardless of whether the stimuli are task relevant, in line with the results of studies on attentional capture (Olivers & Eimer, 2011; Soto et al., 2008), in which the content of working memory is shown to bias perceptual attention toward a task-irrelevant perceptual stimulus.
The observation of no difference in SSVEP power between the both-match and the no-match condition is compatible with a model in which attention alternates between the two stimuli in the both-match condition (Model 5). However, this finding could also indicate that the neural representation of two concurrent matching items no longer involves striate cortex, the main source of the contrast-evoked SSVEP signal. To adjudicate between these competing hypotheses, we investigated the time course of selectivity among the competing stimuli at the level of single trials (Fig. 6).
Our analysis of the time course of selectivity tested the following prediction: If attention switches back and forth between two stimuli, then the SSVEP amplitudes of the two stimuli should be negatively correlated over time: Whenever one representation is amplified, the other should be relatively decreased. No such negative correlation is predicted when attention is constantly allocated to both stimuli at the same time. Here, we introduced a novel method for testing this prediction. For each time point, we computed the difference of the neural response to the two concurrent stimuli as an index of selectivity. A negative correlation between these responses over time implies that the selectivity index fluctuates over time. We found that when two concurrent stimuli each match the content of working memory, they are attended to in an oscillatory fashion, alternating between representations at a rate of 3 Hz to 4 Hz, during the first second of the probe presentation. The rhythmic alternation of perceptual attention between the two stimuli is probably not caused by their matching two items in working memory. There are two reasons for this conclusion.
First, we obtained evidence for rhythmic alternation of SSVEP power between the two stimuli at about 4 Hz even in the no-match condition, in which attention was not influenced by a match to working memory contents. Second, similar oscillatory attentional sampling at similar frequencies has been demonstrated in various paradigms in which multiple stimuli competed for spatial attention (Gray, Frey, Wilson, & Foxe, 2015; Landau, Schreyer, van Pelt, & Fries, 2015; Macdonald, Cavanagh, & VanRullen, 2014; Schroeder, Wilson, Radman, Scharfman, & Lakatos, 2010). That said, taking the two observations together—rhythmic alternation of perceptual attention between the two stimuli and attentional capture by stimuli that match an item in working memory—implies that only one item in working memory contributes to controlling which stimulus is attended at any moment in time; when both items in working memory match a stimulus, then these items alternate controlling perceptual attention at a rate of about 3 Hz to 4 Hz. This rate of alternation is consistent with behavioral findings indicating that it takes between 150 ms and 300 ms to switch the focus of attention from one item in working memory to another (Hedge, Oberauer, & Leonards, 2015; Oberauer, 2003).
Our finding that the contents of working memory modulate the strength of representations of matching stimuli in the visual cortex could be interpreted in two ways. One is that representations of items in working memory in more anterior cortical areas (in particular, in the frontal and parietal cortex) exert a top-down modulatory influence on sensory cortex that amplifies the neural activity elicited by matching stimuli. Another interpretation, more consistent with the sensory-recruitment hypothesis of working memory (Postle, 2006), is that the working memory items themselves are represented in the same neural networks of visual cortex as the probe stimuli. Consequently, when they match, their activity adds up, resulting in amplification of the SSVEP power. One observation from our experiments leads us to favor the first scenario: The SSVEP power reflects strong competition between the two stimuli, with amplification of the attended stimulus entailing equally strong suppression of the unattended stimulus. As a consequence, the SSVEP power of each stimulus was no larger in the both-match condition than in the no-match condition. This mutual neutralization is not consistent with the behavior of neural correlates of working memory contents (such as the contralateral delay activity), which increase with the number of items held in working memory (Vogel & Machizawa, 2014). We tentatively conclude that there is less—if any—neural competition between representations in working memory than there is between perceptual representations. Therefore, attending to one item in working memory does not usually erase the other, nonattended items from working memory. For instance, when attention is directed to one item in working memory by a retrospective cue, memory for the other items is reduced but not entirely lost (for reviews, see Myers, Stokes, & Nobre, 2017; Souza & Oberauer, 2016).
In summary, when two concurrent stimuli in the environment match items held in working memory, both are selectively amplified in the visual cortex, but not at the same time. Rather, one item of the two is selected in an alternating fashion. This finding provides direct evidence for the notion that only one item in working memory—the one currently held in the focus of attention—is capable of capturing visual selective attention at any time (Olivers et al., 2011). This alternation of prioritized information in working memory is consistent with the idea that perceptual attention samples information rhythmically (Fries, 2015; VanRullen, 2016), alternating between stimuli in situations that demand divided attention (Helfrich et al., 2018; Landau et al., 2015; Macdonald et al., 2014).
Supplemental Material
Supplemental material, Thigpen_OpenPracticesDisclosure_rev2 for Selection of Visual Objects in Perception and Working Memory One at a Time by Nina Thigpen, Nathan M. Petro, Jessica Oschwald, Klaus Oberauer and Andreas Keil in Psychological Science
Acknowledgments
We thank Mari Feldhaus for assistance with data collection.
Footnotes
Action Editor: Philippe G. Schyns served as action editor for this article.
Author Contributions: A. Keil and K. Oberauer developed the study concept and designed the experiments. Data were collected and analyzed by J. Oschwald, N. M. Petro, and N. Thigpen. All authors interpreted the data, drafted the manuscript, and approved the final version of the manuscript for submission.
ORCID iD: Klaus Oberauer  https://orcid.org/0000-0003-3902-7318
Declaration of Conflicting Interests: The author(s) declared that there were no conflicts of interest with respect to the authorship or the publication of this article.
Open Practices:


All data and analysis scripts have been made publicly available via the Open Science Framework and can be accessed at https://osf.io/t6gwf/. The materials used in this study are all provided in the text of this article. The design and analysis plans for the experiments were not preregistered. The complete Open Practices Disclosure for this article can be found at http://journals.sagepub.com/doi/suppl/10.1177/0956797619854067. This article has received the badges for Open Data and Open Materials. More information about the Open Practices badges can be found at http://www.psychologicalscience.org/publications/badges.
References
- Andersen S. K., Muller M. M., Hillyard S. A. (2009). Color-selective attention need not be mediated by spatial attention. Journal of Vision, 9(6), Article 2. doi: 10.1167/9.6.2 [DOI] [PubMed] [Google Scholar]
- Bach M., Meigen T. (1999). Do’s and don’ts in Fourier analysis of steady-state potentials. Documenta Ophthalmologica, 99, 69–82. [DOI] [PubMed] [Google Scholar]
- Bridwell D. A., Srinivasan R. (2012). Distinct attention networks for feature enhancement and suppression in vision. Psychological Science, 23, 1151–1158. doi: 10.1177/0956797612440099 [DOI] [PubMed] [Google Scholar]
- Chun M. M., Johnson M. K. (2011). Memory: Enduring traces of perceptual and reflective attention. Neuron, 72, 520–535. doi: 10.1016/j.neuron.2011.10.026 [DOI] [PMC free article] [PubMed] [Google Scholar]
- Cowan N. (2017). Mental objects in working memory. Advances in Child Development and Behavior, 52, 81–104. doi: 10.1016/bs.acdb.2016.12.001 [DOI] [PMC free article] [PubMed] [Google Scholar]
- Di Russo F., Pitzalis S., Aprile T., Spitoni G., Patria F., Stella A., . . . Hillyard S. A. (2007). Spatiotemporal analysis of the cortical sources of the steady-state visual evoked potential. Human Brain Mapping, 28, 323–334. [DOI] [PMC free article] [PubMed] [Google Scholar]
- Fries P. (2015). Rhythms for cognition: Communication through coherence. Neuron, 88, 220–235. [DOI] [PMC free article] [PubMed] [Google Scholar]
- Gayet S., Guggenmos M., Christophel T. B., Haynes J.-D., Paffen C. L. E., der Stigchel S. V., Sterzer P. (2017). Visual working memory enhances the neural response to matching visual input. The Journal of Neuroscience, 37, 6638–6647. doi: 10.1523/JNEUROSCI.3418-16.2017 [DOI] [PMC free article] [PubMed] [Google Scholar]
- Gray M. J., Frey H.-P., Wilson T. J., Foxe J. J. (2015). Oscillatory recruitment of bilateral visual cortex during spatial attention to competing rhythmic inputs. The Journal of Neuroscience, 35, 5489–5503. doi: 10.1523/JNEUROSCI.2891-14.2015 [DOI] [PMC free article] [PubMed] [Google Scholar]
- Groppe D. M., Urbach T. P., Kutas M. (2011). Mass univariate analysis of event-related brain potentials/fields I: A critical tutorial review. Psychophysiology, 48, 1711–1725. [DOI] [PMC free article] [PubMed] [Google Scholar]
- Harrison S. A., Tong F. (2009). Decoding reveals the contents of visual working memory in early visual areas. Nature, 458, 632–635. doi: 10.1038/nature07832 [DOI] [PMC free article] [PubMed] [Google Scholar]
- Hedge C., Oberauer K., Leonards U. (2015). Selection in spatial working memory is independent of perceptual selective attention, but they interact in a shared spatial priority map. Attention, Perception, & Psychophysics, 7, 2653–2668. [DOI] [PMC free article] [PubMed] [Google Scholar]
- Helfrich R. F., Fiebelkorn I. C., Szczepanski S. M., Lin J. J., Parvizi J., Knight R. T., Kastner S. (2018). Neural mechanisms of sustained attention are rhythmic. Neuron, 99, 854–865.e5. doi: 10.1016/j.neuron.2018.07.032 [DOI] [PMC free article] [PubMed] [Google Scholar]
- Hollingworth A., Beck V. M. (2016). Memory-based attention capture when multiple items are maintained in visual working memory. Journal of Experimental Psychology: Human Perception and Performance, 42, 911–917. [DOI] [PMC free article] [PubMed] [Google Scholar]
- Landau A. N., Schreyer H. M., van Pelt S., Fries P. (2015). Distributed attention is implemented through theta-rhythmic gamma modulation. Current Biology, 25, 2332–2337. [DOI] [PubMed] [Google Scholar]
- Lorenc E. S., Sreenivasan K. K., Nee D. E., Vandenbroucke A. R. E., D’Esposito M. (2018). Flexible coding of visual working memory representations during distraction. The Journal of Neuroscience, 38, 5267–5276. doi: 10.1523/JNEUROSCI.3061-17.2018 [DOI] [PMC free article] [PubMed] [Google Scholar]
- Macdonald J. S., Cavanagh P., VanRullen R. (2014). Attentional sampling of multiple wagon wheels. Attention, Perception, & Psychophysics, 76, 64–72. [DOI] [PubMed] [Google Scholar]
- Mangun G. R., Hillyard S. A. (1990). Allocation of visual attention to spatial locations: Tradeoff functions for event-related brain potentials and detection performance. Perception & Psychophysics, 47, 532–550. doi: 10.3758/BF03203106 [DOI] [PubMed] [Google Scholar]
- Mangun G. R., Hillyard S. A. (1995). Mechanisms and models of selective attention. In Rugg M. D., Coles M. G. H. (Eds.), Electrophysiology of mind: Event-related brain potentials and cognition (pp. 40–85). New York, NY: Oxford University Press. [Google Scholar]
- Maunsell J. H. R., Treue S. (2006). Feature-based attention in visual cortex. Trends in Neurosciences, 29, 317–322. doi: 10.1016/j.tins.2006.04.001 [DOI] [PubMed] [Google Scholar]
- Mendoza D., Schneiderman M., Kaul C., Martinez-Trujillo J. (2011). Combined effects of feature-based working memory and feature-based attention on the perception of visual motion direction. Journal of Vision, 11(1), Article 11. doi: 10.1167/11.1.11 [DOI] [PubMed] [Google Scholar]
- Müller M. M., Andersen S., Trujillo N. J., Valdes-Sosa P., Malinowski P., Hillyard S. A. (2006). Feature-selective attention enhances color signals in early visual areas of the human brain. Proceedings of the National Academy of Sciences, 103, 14250–14254. [DOI] [PMC free article] [PubMed] [Google Scholar]
- Myers N. E., Stokes M. G., Nobre A. C. (2017). Prioritizing information during working memory: Beyond sustained internal attention. Trends in Cognitive Sciences, 21, 449–461. [DOI] [PMC free article] [PubMed] [Google Scholar]
- Nolan H., Whelan R., Reilly R. B. (2010). FASTER: Fully Automated Statistical Thresholding for EEG artifact Rejection. Journal of Neuroscience Methods, 192, 152–162. doi: 10.1016/j.jneumeth.2010.07.015 [DOI] [PubMed] [Google Scholar]
- Norcia A. M., Appelbaum L. G., Ales J. M., Cottereau B. R., Rossion B. (2015). The steady-state visual evoked potential in vision research: A review. Journal of Vision, 15(6), Article 4. doi: 10.1167/15.6.4 [DOI] [PMC free article] [PubMed] [Google Scholar]
- Oberauer K. (2003). Selective attention to elements in working memory. Experimental Psychology, 50, 257–269. [DOI] [PubMed] [Google Scholar]
- Oberauer K. (2009). Design for a working memory. In Ross B. H. (Ed.), The psychology of learning and motivation (Vol. 51, pp. 45–100). San Diego, CA: Academic Press. doi: 10.1016/S0079-7421(09)51002-X [DOI] [Google Scholar]
- Oberauer K., Hein L. (2012). Attention to information in working memory. Current Directions in Psychological Science, 21, 164–169. doi: 10.1177/0963721412444727 [DOI] [Google Scholar]
- Olivers C. N. L., Eimer M. (2011). On the difference between working memory and attentional set. Neuropsychologia, 49, 1553–1558. doi: 10.1016/j.neuropsychologia.2010.11.033 [DOI] [PubMed] [Google Scholar]
- Olivers C. N. L., Meijer F., Theeuwes J. (2006). Feature-based memory-driven attentional capture: Visual working memory content affects visual attention. Journal of Experimental Psychology: Human Perception and Performance, 32, 1243–1265. [DOI] [PubMed] [Google Scholar]
- Olivers C. N. L., Peters J., Houtkamp R., Roelfsema P. R. (2011). Different states in visual working memory: When it guides attention and when it does not. Trends in Cognitive Sciences, 15, 327–334. doi: 10.1016/j.tics.2011.05.004 [DOI] [PubMed] [Google Scholar]
- Postle B. R. (2006). Working memory as an emergent property of the mind and brain. Neuroscience, 139, 23–28. [DOI] [PMC free article] [PubMed] [Google Scholar]
- Rademaker R. L., van de Ven V. G., Tong F., Sack A. T. (2017). The impact of early visual cortex transcranial magnetic stimulation on visual working memory precision and guess rate. PLOS ONE, 12(4), Article e0175230. doi: 10.1371/journal.pone.0175230 [DOI] [PMC free article] [PubMed] [Google Scholar]
- R Core Team. (2012). R: A language and environment for statistical computing (Version 2.15.2). Retrieved from http://www.r-project.org
- Reynolds J. H., Heeger D. J. (2009). The normalization model of attention. Neuron, 61, 168–185. doi: 10.1016/J.Neuron.2009.01.002 [DOI] [PMC free article] [PubMed] [Google Scholar]
- Rouder J. N., Morey R. D., Speckman P. L., Province J. M. (2012). Default Bayes factors for ANOVA designs. Journal of Mathematical Psychology, 56, 356–374. [Google Scholar]
- Rouder J. N., Speckman P. L., Sun D., Morey R. D., Iverson G. (2009). Bayesian t tests for accepting and rejecting the null hypothesis. Psychonomic Bulletin & Review, 16, 225–237. [DOI] [PubMed] [Google Scholar]
- Schroeder C. E., Wilson D. A., Radman T., Scharfman H., Lakatos P. (2010). Dynamics of active sensing and perceptual selection. Current Opinion in Neurobiology, 20, 172–176. [DOI] [PMC free article] [PubMed] [Google Scholar]
- Serences J. T., Ester E. F., Vogel E. K., Awh E. (2009). Stimulus-specific delay activity in human primary visual cortex. Psychological Science, 20, 207–214. doi: 10.1111/j.1467-9280.2009.02276.x [DOI] [PMC free article] [PubMed] [Google Scholar]
- Soto D., Hodsoll J., Rotshtein P., Humphreys G. W. (2008). Automatic guidance of attention from working memory. Trends in Cognitive Sciences, 12, 342–348. doi: 10.1016/j.tics.2008.05.007 [DOI] [PubMed] [Google Scholar]
- Souza A. S., Oberauer K. (2016). In search of the focus of attention in working memory: 13 years of the retro-cue effect. Attention, Perception & Psychophysics, 78, 1839–1860. doi: 10.3758/s13414-016-1108-5 [DOI] [PubMed] [Google Scholar]
- Störmer V. S., Alvarez G. A. (2014). Feature-based attention elicits surround suppression in feature space. Current Biology, 24, 1985–1988. [DOI] [PubMed] [Google Scholar]
- van Moorselaar D., Battistoni E., Theeuwes J., Olivers C. N. L. (2015). Rapid influences of cued visual memories on attentional guidance. Annals of the New York Academy of Sciences, 1339, 1–10. [DOI] [PubMed] [Google Scholar]
- van Moorselaar D., Theeuwes J., Olivers C. N. L. (2014). In competition for the attentional template: Can multiple items within visual working memory guide attention? Journal of Experimental Psychology: Human Perception and Performance, 40, 1450–1464. [DOI] [PubMed] [Google Scholar]
- VanRullen R. (2016). Perceptual cycles. Trends in Cognitive Sciences, 20, 723–735. [DOI] [PubMed] [Google Scholar]
Associated Data
This section collects any data citations, data availability statements, or supplementary materials included in this article.
Supplementary Materials
Supplemental material, Thigpen_OpenPracticesDisclosure_rev2 for Selection of Visual Objects in Perception and Working Memory One at a Time by Nina Thigpen, Nathan M. Petro, Jessica Oschwald, Klaus Oberauer and Andreas Keil in Psychological Science