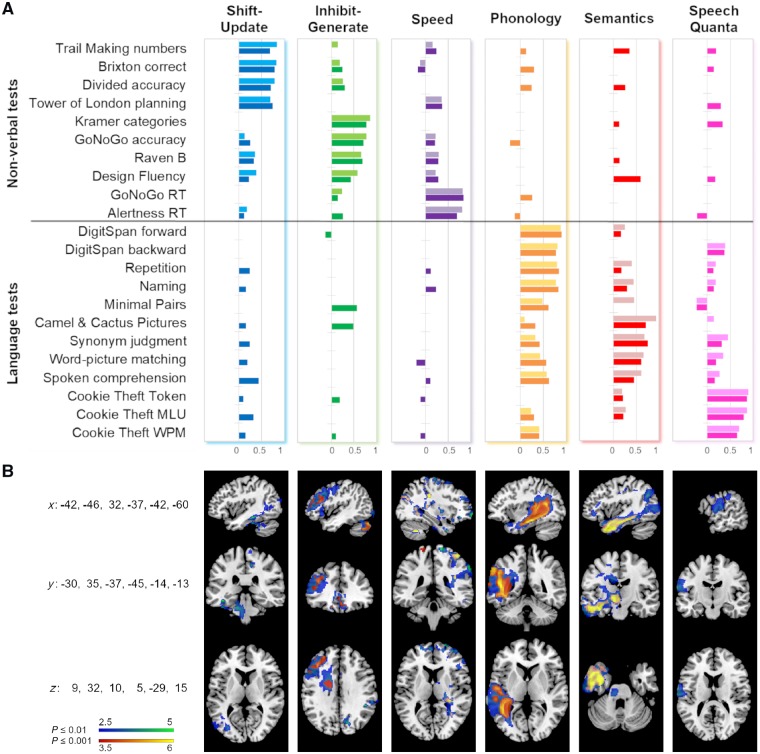
Figure 4.
Component loadings and structural correlates associated with each component. (A) The darker coloured bars (from left to right: blue, green, purple, orange, red, pink) represent the loadings on the six components from the combined PCA. The lighter coloured bars represent the loadings on the three components in the separate non-verbal-only PCA (first three columns) and the language-only PCA (last three columns). Loadings < 0.1 are not depicted. MLU = mean length of utterance; WPM = words per minute. (B) Structural correlates associated with each component from the combined PCA. Clusters shown in blue-green were obtained by applying a voxel-level threshold of P ≤ 0.01, clusters in red-yellow correspond to a voxel-level threshold of P ≤ 0.001. A family-wise error correction of P ≤ 0.05 was applied to all clusters. The respective coordinates in MNI-space are indicated on the left side. Figures are in neurological convention (left is left).

