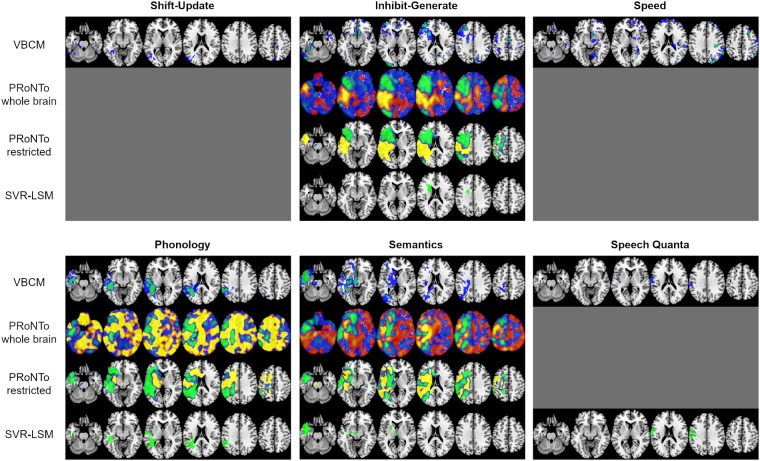
Figure 5.
Comparison of brain-behaviour mapping results based on the four different methodological approaches. The significant VBCM clusters are shown in blue (voxel-level threshold 0.01) and green (voxel-level threshold 0.001), a family-wise error correction of P ≤ 0.05 was applied to all clusters, and images are thresholded at the respective minimum t-value. The PRoNTo results depict the weights for the winning model if significant (see text), either including the whole brain space or restricting it to lesion territory (n > 3). They are thresholded from −0.005 to −0.0001 (green-blue) and 0.0001 to 0.005 (red-yellow). The negative weights are considered as more meaningful in this approach. The SVR-LSM images show voxels with significant beta weights after permutation testing (n = 10 000, voxel-wise P < 0.005 and cluster-wise P < 0.05). MNI coordinates of slices, from left to right, are z = −25, −10, 5, 20, 35, 50 and they are in neurological convention (left is left). A grey surface indicates that no significant results were found for the respective component and methodological approach.

