Abstract
Purpose
Aging of society has increased the need for prolongation of a healthy lifespan through maintenance of physical function. Prediction of future physical function may be possible by screening for stage 1 locomotive syndrome (LS). In this prospective study, we examined the influence of LS stage 1 at baseline (2011) on physical performance after 5 years (2016) in a community-dwelling cohort.
Methods
The participants were elderly adults aged >40 years who attended public health checkups as part of the Yakumo Study. LS screening in 2011 and 2016 was performed using the 25-question geriatric locomotive function scale (GLFS-25), the stand-up test, and the two-step test. LS of stage 1 or 2 was defined if the participant met the criteria in any of the three tests. Participants not meeting LS criteria were defined as the no risk group. Physical performance tests (10 m gait time, back muscle strength, 3 m TUG, and maximum stride) were also performed in 2011 and 2016.
Results
A total of 113 subjects (49 males, 64 females; average age 65.0 years) were followed from 2011 to 2016. At baseline, 73 (65%) had no risk, 29 (25%) had stage 1 LS, and 11 (10%) had stage 2 LS. Five years later, 51 (45%) had no risk, 45 (40%) had stage 1 LS, and 17 (15%) had stage 2 LS. Of the 73 subjects with no risk at baseline, 23 (32%) had stage 1 LS and 1 (1%) had stage 2 LS after 5 years. The baseline stage 1 LS group had significantly worse physical performance after 5 years, compared to the baseline no risk group (p < 0.05).
Conclusions
This longitudinal study showed that stage 1 LS screening is important for prevention of motor dysfunction in middle-aged and elderly people.
1. Introduction
With the current aging of society, health problems of the elderly are important issues in Japan. The aging of the population has led to increased prevalences of various diseases. Therefore, there is a need for prolongation of healthy activities of daily living (ADL) in elderly people, in the interests of the people themselves and of the government. This situation places a focus on physical function, which is strongly associated with ADL and quality of life (QOL) in the elderly population [1–4].
In 2007, the Japanese Orthopaedic Association (JOA) proposed the concept of “locomotive syndrome” (LS), as a condition in people with musculoskeletal disease who are highly likely to require future nursing care [5, 6]. People with LS have significantly lower QOL [7], and prevention of LS has long been advocated for maintaining and improving physical function of middle-aged and elderly people [6, 8–11]. To evaluate the risk of LS, the JOA proposed the following three tests: the two-step test, the stand-up test, and the 25-question geriatric locomotive function scale (GLFS-25) [12]. LS is categorized into stages 1 and 2, and the results of these tests allow mobility and the LS stage to be determined. Stage 1 is a preliminary LS stage that particularly indicates that movement function has begun to decline, and there are likely to be more people in this stage than in stage 2.
Motor performance in LS has been widely studied [13–19], but there have been no prospective studies of future motor performance in stage 1 LS. The “Yakumo study” includes a physical examination in general screening of a residential cohort, which facilitates a cross-sectional examination of physical ability in middle-aged and elderly people. The current prospective study took advantage of this situation to examine the influence of LS stage 1 on physical performance after 5 years in community-dwelling people.
2. Methods
2.1. Subjects
The participants were Japanese elderly adults who attended the annual public health checkup provided by the local government in Yakumo, Japan, in 2011. We have collected epidemiological data at these annual health checkups since 1983, as the basis of the Yakumo Study. Yakumo is located in Hokkaido, in the north of Japan, and has a population of 17,000 people, of which 28% are elderly (over 65 years old). Yakumo is in a relatively rural area, and many people work in the agriculture and fishery industries. The checkup includes an orthopedic assessment and measurements of physical function, in addition to internal medical examinations and psychological testing [1, 2, 8, 9].
For the current study, which started in 2011, we examined LS by investigating physical function, spinal and joint diseases, and osteoporosis and provided guidance on exercise. Since 2011, we have added completion of the GLFS-25 and four physical performance tests: 10 m gait time, back muscle strength, 3 m timed-up-and-go (3 m TUG), and maximum stride. Age, gender, body mass index (BMI), and bone mineral density (BMD) were also recorded. The inclusion criteria were Japanese males and females aged >40 years who underwent these tests (which are described in more detail below) during the health checkup. Individuals were excluded if they had severe walking or standing disabilities or dysfunction of the central or peripheral nervous system. All physical measurements were made by 6 orthopedic surgeons. The study protocol was approved by our University Committee on Ethics in Human Research. All participants provided written informed consent, and the study protocol was approved by the Institutional Review Board of our University Graduate School of Medicine. The study was carried out in accordance with the principles of the Declaration of Helsinki.
2.2. Physical Performance
BMD was measured ultrasonically in the calcaneus using a bone densitometer (A1000 Insight, Lunar Corp., Madison, WI, USA), and the percent of the young adult mean (%YAM) was determined. Diagnosis of osteoporosis was based on criteria of the Japanese Society for Bone and Mineral Research [20] and defined as %YAM < 70% in the calcaneus. The 10 m gait time was measured to evaluate mobility, as the time required to complete a 10 m straight course at the fastest pace possible for each subject. Back muscle strength was examined as the maximal isometric strength of the trunk muscles measured in a standing posture with 30° lumbar flexion using a digital back muscle strength meter (T.K.K.5102, Takei Co., Japan) [1]. The average force from two trials was recorded, and the maximum strength in each trial was measured. The 3 m TUG test was used to measure the time for a subject to rise from a standard chair (46 cm seat height), walk a distance of 3 m, turn around, walk back to the chair, and sit down [21]. Subjects performed the test twice, both at maximum pace, and the mean time was used for analysis. Maximum stride length was measured in a standing position. Subjects placed their right foot forward as far as possible and then brought their left foot up to the right foot without support. The maneuver was then repeated with the left foot stepping forward first. The test was performed twice, and the average step length divided by the height of the subject was used as the maximum stride length for analysis. The % change over 5 years for each physical performance variable was calculated as follows: (value after 5 years—value at baseline)/value at baseline.
2.3. LS Stage Tests
Three tests were performed according to the JOA guidelines [22]. In the stand-up test, the ability to adopt a single- or double-leg stance from stools that were 40, 30, 20, and 10 cm high was measured by physical therapists. The level of difficulty was defined as 40 < 30 < 20 < 10 cm using both legs <40 < 30 < 20 < 10 cm using one leg. The result is reported as the minimum stool height from which the participant could stand up. The score was graded from no impairment (8 points) to severe impairment (0 points). Scores <4 and <2 were defined as stage 1 and stage 2 LS, respectively.
In the two-step test, the length of two strides from the starting line to the position at the tips of the toes was measured by physical therapists. The score was calculated by normalizing the maximal length of two steps by height. Scores of <1.3 and <1.1 were defined as stage 1 and stage 2 of LS, respectively.
The GLFS-25 is a self-reported comprehensive survey referring to the preceding month [23]. The scale includes 4 questions on pain, 16 on ADL, 3 on social functions, and 2 on mental health status. Each item was graded from no impairment (0 points) to severe impairment (4 points). Total scores >7 and >16 were defined as stage 1 and stage 2 LS, respectively.
In overall assessment of LS, the stage was deemed to be 1 or 2 if the participant met one of the three criteria above. Participants not meeting any LS criteria were defined as the no risk group.
2.4. Statistical Analysis
Continuous variables are presented as mean ± standard deviation (SD) and categorical data as numbers (percentage). A Mann-Whitney U test or Student's t-test was used for comparison of continuous variables between groups, and a χ2-test or Fisher's exact test was used for categorical data. A post hoc test was performed using a Bonferroni test to assess which group differed significantly from others. All calculations were performed using SPSS ver. 23 (SPSS Inc., Chicago, IL, USA). Values of p < 0.05 were considered to be significant in all analyses.
3. Results
A total of 534 subjects participated in the medical examination in 2011, of whom 15 met the exclusion criteria, leaving 519 for baseline evaluation. Of these 519 subjects, 300 could not be followed up for 5 years and we excluded 187 subjects in whom all physical performance tests (10 m gait time, back muscle strength, 3 m TUG, and maximum stride) were not performed. The remaining 113 subjects were included in this study. Demographic and physical performance data at baseline (2011) are shown in Table 1. The 113 subjects had an average age of 65.0 years (range 42–88 years), and 49 were males and 64 were females. Figure 1 shows the distribution of risk levels of LS from the three tests and the total assessment for all participants. The trend of LS stage from baseline to 5 years later is shown in Figure 2. At baseline, there were 73 subjects (65%) in the no risk group, 29 (25%) with stage 1 LS, and 11 (10%) with stage 2 LS. Five years later, 51 subjects (45%) had no risk, 45 (40%) had stage 1 LS, and 17 (15%) had stage 2 LS. Of the 73 subjects with no risk at baseline, 23 (32%) had stage 1 LS and 1 (1%) had stage 2 LS after 5 years (Figure 2).
Table 1.
Demographic data at baseline (2011) in patients (n = 113) who were followed for 5 years.
| Variable at baseline | Total (n = 113) | Male (n = 49) | Female (n = 64) |
|---|---|---|---|
| Age (years) | 63.8 ± 8.5 | 65.0 ± 7.7 | 63.0 ± 9.0 |
| ≤49 | 9 (8%) | 3 (6%) | 6 (9%) |
| 50–59 | 26 (23%) | 10 (20%) | 16 (25%) |
| 60–69 | 48 (42%) | 20 (41%) | 28 (44%) |
| ≥70 | 30 (27%) | 16 (33%) | 14 (22%) |
| Height (cm) | 158.5 ± 8.1 | 165.6 ± 9.2 | 152.8 ± 7.2 |
| Body weight (kg) | 59.5 ± 9.1 | 66.1 ± 8.3 | 54.5 ± 7.2 |
| Body fat percentage (%) | 27.4 | 25.1 | 29.3 |
| Body mass index (kg/m2) | 23.6 ± 2.9 | 24.0 ± 2.5 | 23.3 ± 3.1 |
| Bone mineral density (%YAM) | 81.8 ± 16.6 | 85.4 ± 18.8 | 79.7 ± 14.8 |
| Osteoporosis | 21 (19%) | 7 (14%) | 14 (22%) |
| GLFS-25 | 7.4 ± 7.1 | 6.7 ± 7.6 | 7.9 ± 6.3 |
| Stand-up test (%)† | 42.9 ± 12.6 | 47.8 ± 15.2 | 39.1 ± 10.4 |
| Two-step test (cm) | 111.3 ± 18.1 | 120.6 ± 19.4 | 104.3 ± 17.3 |
Values are expressed as mean ± standard error or as a number (percentage). YAM: young adult mean; GLFS-25: 25-question geriatric locomotive function scale. †Number of subjects who could stand up on one leg (right or left) from a height of 40 cm.
Figure 1.
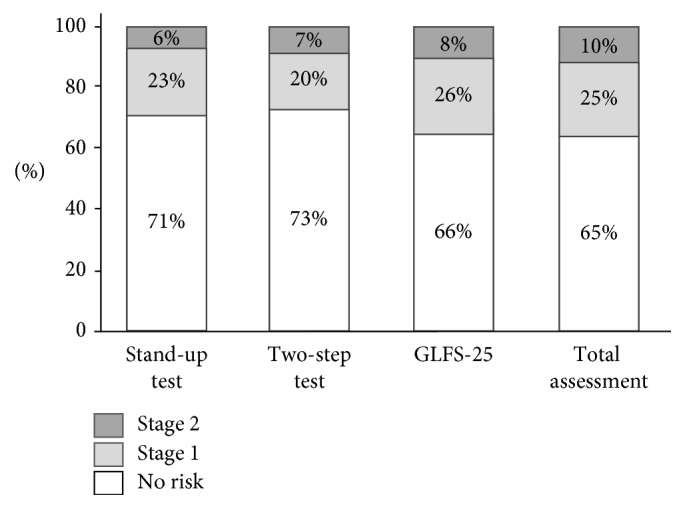
Distribution of risk levels for LS from three criteria (GLFS-25, stand-up test, and two-step test).
Figure 2.
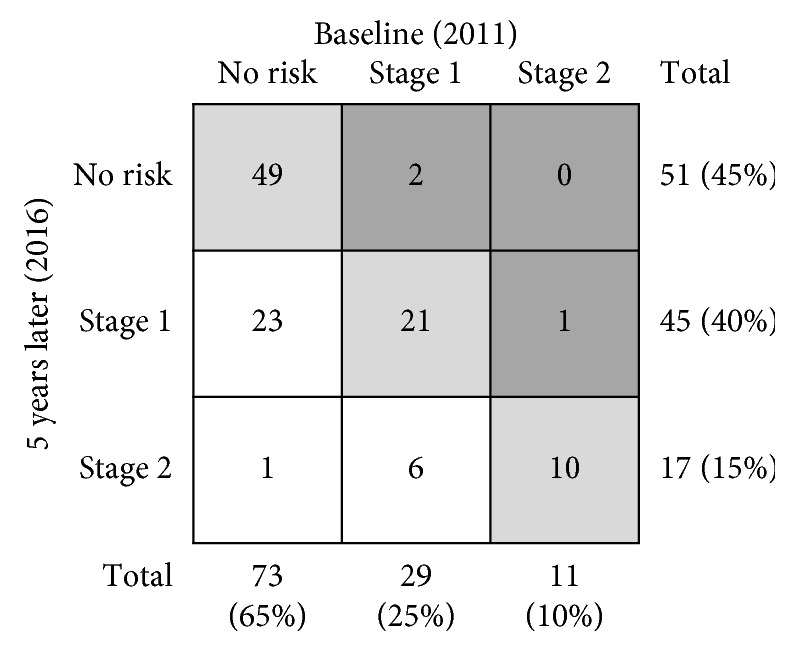
Distribution of risk levels for LS from three tests and the total assessment for all participants at baseline.
Demographic data at baseline (2011) based on LS stage at baseline are shown in Table 2. Age and the rate of females increased as LS risk stage progressed. Further, the stage 1 LS group was significantly older than the no risk group in both genders and had significant differences in all physical performance tests (10 m gait time, back muscle strength, 3 m TUG, and maximum stride) after 5 years (Table 3). The 5-year changes in these tests all showed significant differences between the baseline no risk and stage 1 LS groups (p < 0.05) (Figures 3–6).
Table 2.
Demographic data at baseline (2011) as a function of LS stage at baseline (2011).
| Variable at baseline | Baseline (2011) | Anova p value | Post hoc test1 | ||
|---|---|---|---|---|---|
| No riska (n = 73) | Stage 1b (n = 29) | Stage 2c (n = 11) | |||
| Age (years) | 61.8 ± 7.4 | 66.3 ± 8.1 | 70.9 ± 6.9 | <0.05 | a < b < c |
| Female (n) | 56% (41) | 59% (17) | 73% (8) | <0.05 | a, b < c |
| Body mass index (kg/m2) | 23.3 ± 2.9 | 23.7 ± 2.8 | 25.4 ± 2.5 | <0.05 | a, b < c |
| Bone mineral density (%YAM) | 82.6 ± 16.8 | 80.9 ± 17.2 | 75.2 ± 8.5 | <0.05 | a, b < c |
Values are expressed as mean ± standard error or as a number (percentage). YAM: Young adult mean. 1Post hoc test with Bonferroni correction.
Table 3.
Physical performance 5 years later (2016) based on LS risk stage in males and females.
| Variable | Male | Female | ||||
|---|---|---|---|---|---|---|
| Baseline no risk (n = 32) | Baseline stage 1 (n = 12) | p value | Baseline no risk (n = 41) | Baseline stage 1 (n = 17) | p value | |
| Age | 62.9 ± 6.8 | 67.5 ± 9.4 | <0.05∗ | 60.9 ± 7.6 | 65.6 ± 7.2 | <0.05∗ |
| 5 years later (2016) | ||||||
| 10 m gait time (s) | 5.0 ± 0.6 | 6.0 ± 0.8 | <0.01∗∗ | 5.2 ± 0.7 | 6.0 ± 0.5 | <0.01∗∗ |
| Back muscle strength (kg) | 90.9 ± 26.2 | 72.5 ± 14.8 | <0.01∗∗ | 55.5 ± 14.0 | 44.4 ± 17.5 | <0.05∗ |
| 3 m TUG (s) | 5.9 ± 0.6 | 6.9 ± 0.9 | <0.01∗∗ | 6.0 ± 0.7 | 6.8 ± 0.5 | <0.01∗∗ |
| Maximum stride (%) | 77.0 ± 7.5 | 69.3 ± 5.8 | <0.01∗∗ | 76.8 ± 4.7 | 71.6 ± 6.0 | <0.05∗ |
∗ p < 0.05; ∗∗p < 0.01. 3 m TUG: 3 m timed-up-and-go.
Figure 3.
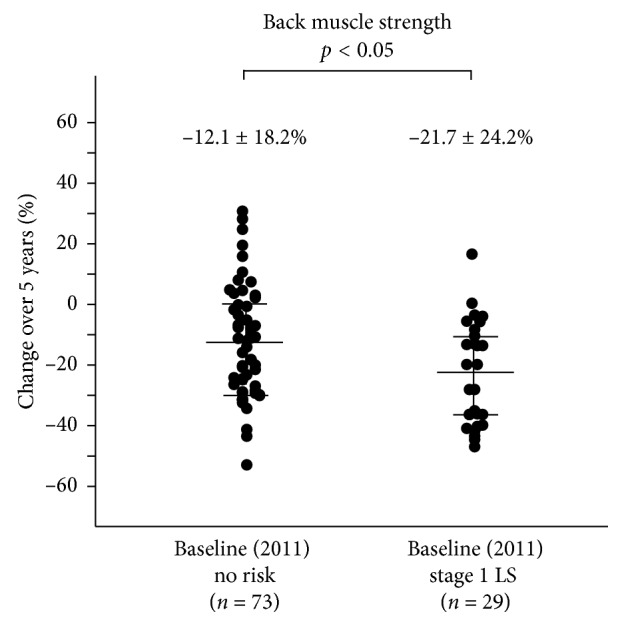
The 5-year reduction in back muscle strength was significantly lower in the baseline no risk group (n = 73) compared to the baseline stage 1 LS group (n = 29) (−12.1 ± 18.2% vs. −21.7 ± 24.2%; p < 0.05).
Figure 4.
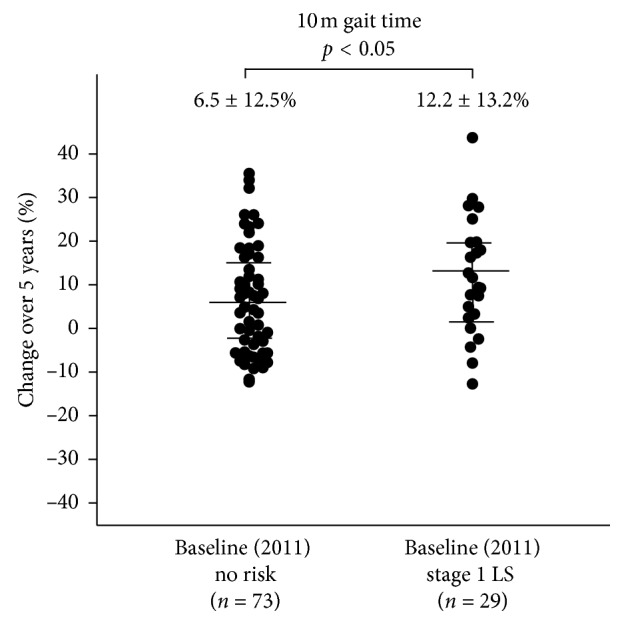
The 5-year increase in 10 m gait time was significantly lower In the baseline no risk group (n = 73) compared to the baseline stage 1 LS group (n = 29) (6.5 ± 12.5% vs. 12.2 ± 13.2%; p < 0.05).
Figure 5.
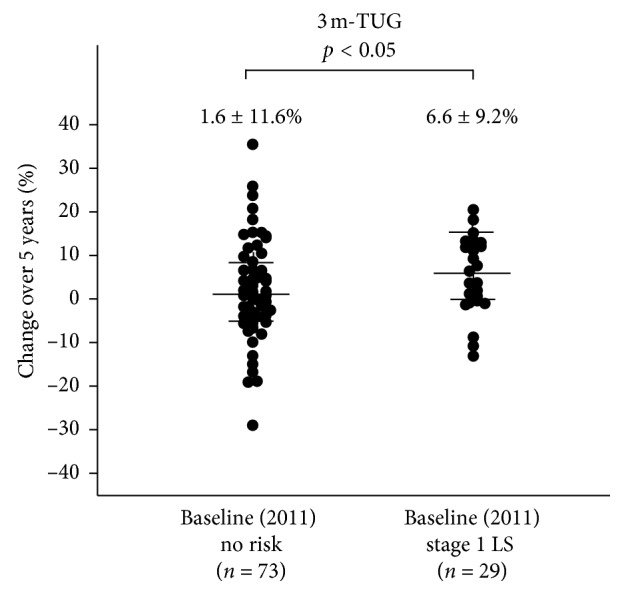
The 5-year increase in 3 m-TUG was significantly lower in the baseline no risk group (n = 73) compared to the baseline stage 1 LS group (n = 29) (1.6 ± 11.6% vs. 6.6 ± 9.2%; p < 0.05).
Figure 6.
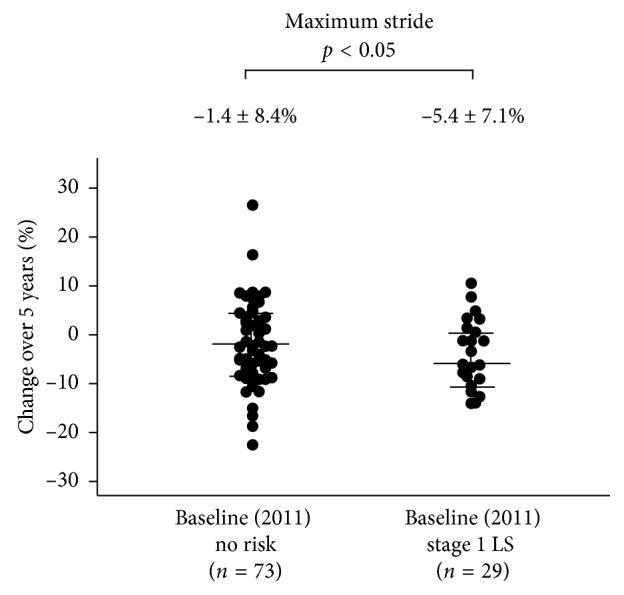
The 5-year reduction in maximum stride was significantly lower in the baseline no risk group (n = 73) compared to the baseline stage 1 LS group (n = 29) (−1.4 ± 8.4% vs. −5.4 ± 7.1%; p < 0.05).
4. Discussion
There have been several reports on reference values for LS in physical function tests [3–6, 16–19]. Progression of LS, especially in stage 2, limits independence in daily life and could affect physical balance and general conditions [4, 15, 24]. Stage 1 LS is a preliminary stage of LS, in which there may be many more people than in stage 2. However, no prospective study has examined future physical performance in elderly community-dwelling people in LS stage 1. Thus, this is the first prospective study to evaluate motor performance over a 5-year period with a focus onstage 1 LS.
The GLFS-25 was developed as a simple assessment tool for detection of LS [23]. However, JOA criteria recommend use of the stand-up test and two-step test for LS stage evaluation, in addition to the GLFS-25 [22]. Previous studies have only used the GLFS-25 for stage evaluation, but LS includes a decrease in mobility such as standing and walking. Thus, a strength of this study is evaluation of the LS grade using all three JOA criteria, including the stand-up test, two-step test, and GLFS-25. However, we could not clearly conclude which of the criteria had the most influence on motor performance evaluation due to the small sample size. The JOA defines a GLFS-25 score ≥7 as stage 1 LS, in which deterioration of movement is beginning to occur [23]. Interestingly, a score ≥7 is consistent with the GLFS-25 scores of 6.4 for males and 6.8 for females suggested by Kobayashi et al. as thresholds for future LS, which may indicate that stage 1 LS is a risk factor for future stage 2 LS [15].
In our cohort, the rates of older age and female gender increased as the LS risk stage progressed. These variables have also previously been identified as risk factors for LS [11, 25]. Despite the significant difference in age between the no risk and stage 1 LS groups, there were no significant differences between these groups in all motor performance tests at baseline. However, there were significant differences in all tests after 5 years, with significantly greater deterioration of motor performance in the stage 1 LS group compared with the no risk group. Regarding prevention of LS, exercise intervention has been suggested to be effective for reducing deterioration of physical function in elderly people [26–28]. Age at the start of exercise intervention also seems to be important. In our cohort, the average ages were 63.9 years in the no risk group and 65.8 years in the stage 1 LS group, and the cohort also included relatively young people in their 40 s; thus, exercise intervention is likely to be effective in this cohort.
Evaluation of LS is the only one method for screening for musculoskeletal disorders but has an advantage that people with LS also have significantly lower QOL [7]. It has long been advocated that prevention of LS can maintain or improve physical function in middle-aged and elderly people [6, 8–11, 13–19]. In view of our results, measures taken for people in stage 1 LS are likely to be important for future LS prevention, and construction of an early exercise program for LS stage 1 subjects may have a preventive effect on LS.
The current study has some limitations. First, the number of participants who we were able to follow for 5 years was relatively small. Second, performance tests such as 10 m gait time, 3 m TUG, and maximum stride reflect motor performance and mobility of the lower limbs, but none are effectively improved by musculoskeletal intervention. Third, the participants were middle-aged and elderly people who lived in a relatively rural area, in which many had jobs in agriculture or fishing; therefore, the subjects differed from people in an urban environment. Also, the participants attended an annual health examination, which suggests that they may be more health conscious compared to other people. Fourth, we did not examine personal exercise habits, details of medication, and medical comorbidities. The decrease in physical function might also reflect the change in age, and a connection of physical function deterioration with aging cannot be clearly excluded. However, this study is the first to evaluate physical performance prospectively over 5 years with a focus on LS stage 1 in community-dwelling people. LS is generally recognized as stage 2, and stage 1 is treated as a preliminary step. Therefore, recognition of LS stage 1 is likely to be effective for future prevention of LS stage 2. A further strength of the study is that we performed an extensive set of physical measurement that is associated with QOL or ADL. However, further examinations of future physical performance are needed from the perspective of LS grade at baseline.
5. Conclusion
In this longitudinal study in a cohort of community-dwelling people, future physical performance and its rate of change over 5 years differed significantly between the no risk and stage 1 LS groups at baseline. These results suggest that people with LS of stage 1 are likely to have significant deterioration in future motor performance. Therefore, for prevention of motor dysfunction in middle-aged and elderly people, LS stage 1 screening is important using the GLFS-25, stand-up test, and two step test, which can be relatively easily performed.
Acknowledgments
The authors are grateful to the staff of the Comprehensive Health Care Program held in Yakumo, Hokkaido, and to Ms. Marie Miyazaki, Ms. Hiroko Ino, and Ms. Aya Hemmi at Nagoya University for their assistance throughout this study. This work was supported by grants from JSPS KAKENHI (Grant no. 18K09102).
Data Availability
All data referred to in the study are included in the manuscript.
Ethical Approval
The study protocol was approved by the Institutional Review Board of Nagoya University Graduate School of Medicine. The protocol was also approved by the Committee on Ethics in Human Research of our university, and the procedures were carried out in accordance with the principles of the Declaration of Helsinki.
Consent
All participants provided written informed consent.
Conflicts of Interest
The authors declare that they have no conflicts of interest.
References
- 1.Imagama S., Hasegawa Y., Wakao N., Hirano K., Hamajima N., Ishiguro N. Influence of lumbar kyphosis and back muscle strength on the symptoms of gastroesophageal reflux disease in middle-aged and elderly people. European Spine Journal. 2012;21(11):2149–2157. doi: 10.1007/s00586-012-2207-1. [DOI] [PMC free article] [PubMed] [Google Scholar]
- 2.Imagama S., Hasegawa Y., Wakao N., Hirano K., Muramoto A., Ishiguro N. Impact of spinal alignment and back muscle strength on shoulder range of motion in middle-aged and elderly people in a prospective cohort study. European Spine Journal. 2014;23(7):1414–1419. doi: 10.1007/s00586-014-3251-9. [DOI] [PubMed] [Google Scholar]
- 3.Imagama S., Hasegawa Y., Matsuyama Y., et al. Influence of sagittal balance and physical ability associated with exercise on quality of life in middle-aged and elderly people. Archives of Osteoporosis. 2011;6(1-2):13–20. doi: 10.1007/s11657-011-0052-1. [DOI] [PMC free article] [PubMed] [Google Scholar]
- 4.Imagama S., Hasegawa Y., Ando K., et al. Staged decrease of physical ability on the locomotive syndrome risk test is related to neuropathic pain, nociceptive pain, shoulder complaints, and quality of life in middle-aged and elderly people—the utility of the locomotive syndrome risk test. Modern Rheumatology. 2017;27(6):1051–1056. doi: 10.1080/14397595.2017.1285856. [DOI] [PubMed] [Google Scholar]
- 5.Nakamura K. A “super-aged” society and the “locomotive syndrome”. Journal of Orthopaedic Science. 2008;13(1):1–2. doi: 10.1007/s00776-007-1202-6. [DOI] [PMC free article] [PubMed] [Google Scholar]
- 6.Nakamura K. The concept and treatment of locomotive syndrome: its acceptance and spread in Japan. Journal of Orthopaedic Science. 2011;16(5):489–491. doi: 10.1007/s00776-011-0108-5. [DOI] [PMC free article] [PubMed] [Google Scholar]
- 7.Hirano K., Imagama S., Hasegawa Y., Ito Z., Muramoto A., Ishiguro N. The influence of locomotive syndrome on health-related quality of life in a community-living population. Modern Rheumatology. 2013;23(5):939–944. doi: 10.1007/s10165-012-0770-2. [DOI] [PubMed] [Google Scholar]
- 8.Muramoto A., Imagama S., Ito Z., Hirano K., Ishiguro N., Hasegawa Y. Spinal sagittal balance substantially influences locomotive syndrome and physical performance in community-living middle-aged and elderly women. Journal of Orthopaedic Science. 2016;21(2):216–221. doi: 10.1016/j.jos.2015.12.016. [DOI] [PubMed] [Google Scholar]
- 9.Muramoto A., Imagama S., Ito Z., et al. Waist circumference is associated with locomotive syndrome in elderly females. Journal of Orthopaedic Science. 2014;19(4):612–619. doi: 10.1007/s00776-014-0559-6. [DOI] [PubMed] [Google Scholar]
- 10.Hirano K., Imagama S., Hasegawa Y., Wakao N., Muramoto A., Ishiguro N. Impact of spinal imbalance and back muscle strength on locomotive syndrome in community-living elderly people. Journal of Orthopaedic Science. 2012;17(5):532–537. doi: 10.1007/s00776-012-0266-0. [DOI] [PubMed] [Google Scholar]
- 11.Muramoto A., Imagama S., Ito Z., Hirano K., Ishiguro N., Hasegawa Y. Physical performance tests are useful for evaluating and monitoring the severity of locomotive syndrome. Journal of Orthopaedic Science. 2012;17(6):782–788. doi: 10.1007/s00776-012-0283-z. [DOI] [PubMed] [Google Scholar]
- 12.Japanese orthopaedic Association. Locomotive Challenge! Council, Locomotive Syndrome Pamphlet 2015. Tokyo, Japan: Japanese Orthopaedic Association; 2015. Locomotive syndrome. [Google Scholar]
- 13.Yoshimura N., Muraki S., Oka H., et al. Erratum to: association between new indices in the locomotive syndrome risk test and decline in mobility: third survey of the ROAD study. Journal of Orthopaedic Science. 2015;20(5):p. 906. doi: 10.1007/s00776-015-0765-x. [DOI] [PMC free article] [PubMed] [Google Scholar]
- 14.Yoshimura N., Akune T., Fujiwara S., et al. Incidence of disability and its associated factors in Japanese men and women: the longitudinal cohorts of motor system organ (LOCOMO) study. Journal of Bone and Mineral Metabolism. 2015;33(2):186–191. doi: 10.1007/s00774-014-0573-y. [DOI] [PubMed] [Google Scholar]
- 15.Kobayashi K., Ando K., Tsushima M., et al. Predictors of pre-sarcopenia in community-dwelling older adults: a 5-year longitudinal study. Modern Rheumatology. 2018;24:1–17. doi: 10.1080/14397595.2018.1551171. [DOI] [PubMed] [Google Scholar]
- 16.Muramoto A., Imagama S., Ito Z., et al. Threshold values of physical performance tests for locomotive syndrome. Journal of Orthopaedic Science. 2013;18(4):618–626. doi: 10.1007/s00776-013-0382-5. [DOI] [PubMed] [Google Scholar]
- 17.Hirano K., Imagama S., Hasegawa Y., Wakao N., Muramoto A., Ishiguro N. Impact of back muscle strength and aging on locomotive syndrome in community living Japanese women. Nagoya Journal of Medical Science. 2013;75:47–55. [PMC free article] [PubMed] [Google Scholar]
- 18.Tanaka S., Ando K., Kobayashi K., et al. Relationship between locomotive syndrome and body composition among community-dwelling middle-age and elderly individuals in Japan: the Yakumo study. Modern Rheumatology. 2019;29(3):491–495. doi: 10.1080/14397595.2018.1465645. [DOI] [PubMed] [Google Scholar]
- 19.Tanaka S., Ando K., Kobayashi K., et al. The decreasing phase angles of the entire body and trunk during bioelectrical impedance analysis are related to locomotive syndrome. Journal of Orthopaedic Science. 2019;24(4):720–724. doi: 10.1016/j.jos.2018.12.016. [DOI] [PubMed] [Google Scholar]
- 20.Orimo H., Hayashi Y., Fukunaga M., et al. Diagnostic criteria for primary osteoporosis: year 2000 revision. Journal of Bone and Mineral Metabolism. 2001;19(6):331–337. doi: 10.1007/s007740170001. [DOI] [PubMed] [Google Scholar]
- 21.Nakamura K. Locomotive syndrome: disability-free life expectancy and locomotive organ health in a “super-aged” society. Journal of Orthopaedic Science. 2009;14(1):1–2. doi: 10.1007/s00776-008-1302-y. [DOI] [PMC free article] [PubMed] [Google Scholar]
- 22.Nakamura K., Ogata T. Locomotive syndrome: definition and management. Clinical Reviews in Bone and Mineral Metabolism. 2016;14(2):56–67. doi: 10.1007/s12018-016-9208-2. [DOI] [PMC free article] [PubMed] [Google Scholar]
- 23.Seichi A., Hoshino Y., Doi T., Akai M., Tobimatsu Y., Iwaya T. Development of a screening tool for risk of locomotive syndrome in the elderly: the 25-question Geriatric locomotive function scale. Journal of Orthopaedic Science. 2012;17(2) doi: 10.1007/s00776-011-0193-5.163e72 [DOI] [PubMed] [Google Scholar]
- 24.Imagama S., Ando K., Kobayashi K., et al. Shoulder pain has most impact on poor quality of life among various types of musculoskeletal pain in middle-aged and elderly people: Yakumo study. Modern Rheumatology. 2019;13:1–5. doi: 10.1080/14397595.2019.1601839. [DOI] [PubMed] [Google Scholar]
- 25.Tanaka S., Ando K., Kobayashi K., et al. A low phase angle measured with bioelectrical impedance analysis is associated with osteoporosis and is a risk factor for osteoporosis in community-dwelling people: the Yakumo study. Arch Osteoporosis. 2018;13:p. 39. doi: 10.1007/s11657-018-0450-8. [DOI] [PubMed] [Google Scholar]
- 26.Akai M., Doi T., Seichi A., Okuma Y., Ogata T., Iwaya T. Locomotive syndrome: operational definition based on a questionnaire, and exercise interventions on mobility dysfunction in elderly people. Clinical Reviews in Bone and Mineral Metabolism. 2016;14(2):119–130. doi: 10.1007/s12018-016-9210-8. [DOI] [PMC free article] [PubMed] [Google Scholar]
- 27.Nishimura A., Ito N., Asanuma K., Akeda K., Ogura T., Sudo A. Do exercise habits during middle age affect locomotive syndrome in old age? Modern Rheumatology. 2018;28(2):334–338. doi: 10.1080/14397595.2017.1333670. [DOI] [PubMed] [Google Scholar]
- 28.Wennie Huang W.-N., Perera S., VanSwearingen J., Studenski S. Performance measures predict onset of activity of daily living difficulty in community-dwelling older adults. Journal of the American Geriatrics Society. 2010;58(5):844–852. doi: 10.1111/j.1532-5415.2010.02820.x. [DOI] [PMC free article] [PubMed] [Google Scholar]
Associated Data
This section collects any data citations, data availability statements, or supplementary materials included in this article.
Data Availability Statement
All data referred to in the study are included in the manuscript.


