The best support for patients with neuroendocrine tumors (NETs) is unclear. This article reports patterns and risk factors for symptom burden in NETs, using patient‐reported outcomes based on Edmonton Symptom Assessment System scores.
Keywords: Carcinoid, Neuroendocrine, Patient‐reported, Outcomes, Symptoms, Quality of life
Abstract
Background.
How to best support patients with neuroendocrine tumors (NETs) remains unclear. Improving quality of care requires an understanding of symptom trajectories. Objective validated assessments of symptoms burden over the course of disease are lacking. This study examined patterns and risk factors of symptom burden in NETs, using patient‐reported outcomes.
Subjects, Materials, and Methods.
A retrospective, population‐based, observational cohort study of patients with NETs diagnosed from 2004 to 2015, who survived at least 1 year, was conducted. Prospectively collected patient‐reported Edmonton Symptom Assessment System scores were linked to provincial administrative health data sets. Moderate‐to‐severe symptom scores were presented graphically for both the 1st year and 5 years following diagnosis. Multivariable Poisson regression identified factors associated with record of moderate‐to‐severe symptom scores during the 1st year after diagnosis.
Results.
Among 2,721 included patients, 7,719 symptom assessments were recorded over 5 years following diagnosis. Moderate‐to‐severe scores were most frequent for tiredness (40%–51%), well‐being (37%–49%), and anxiety (30%–40%). The proportion of moderate‐to‐severe symptoms was stable over time. Proportion of moderate‐to‐severe anxiety decreased by 10% within 6 months of diagnosis, followed by stability thereafter. Changes were below 5% for other symptoms. Similar patterns were observed for the 1st year after diagnosis. Primary tumor site, metastatic disease, younger age, higher comorbidity burden, lower socioeconomic status, and receipt of therapy within 30 days of assessment were independently associated with higher risk of elevated symptom burden.
Conclusion.
Patients with NETs have a high prevalence of moderate‐to‐severe patient‐reported symptoms, with little change over time. Patients remain at risk of prolonged symptom burden following diagnosis, highlighting potential unmet needs. Combined with identified patient and disease factors associated with moderate‐to‐severe symptom scores, this information is important to support symptom management strategies to improve patient‐centered care.
Implications for Practice.
This study used population‐level, prospectively collected, validated, patient‐reported outcome measures to appraise the symptoms burden and trajectory of patients with neuroendocrine tumors (NETs) after diagnosis. It is the largest and most detailed analysis of patient‐reported symptoms for NETs. Patients with NETs present a high burden of symptoms at diagnosis that persists up to 5 years later, highlighting unmet needs. Early and comprehensive symptom screening and management programs are needed. This information should serve to devise pathways and policies to better support patients, evaluate supportive interventions, and assess the effectiveness of symptom management at the provider, institutional, and system levels.
Introduction
A significant increase in the incidence of neuroendocrine tumors (NETs) has been reported worldwide [1], [2], [3]. Because of prolonged survival with active disease, NETs prevalence now surpasses the combined prevalence of pancreatic, esophageal, and gastric cancers [2], [3], [4]. Lack of awareness, nonstandardized therapy, and a paucity of specialized care teams have resulted in patients expressing difficulty finding disease‐specific support [5].
NETs represent a unique burden to the health care system by combining long survival and potentially debilitating systemic symptoms from hormonal secretion [6]. Symptom tracking and ongoing supportive care are a challenge in NETs care. Validated assessments of NETs symptom burden remain very limited even though they are particularly crucial for this chronic cancer [7]. Therefore, a comprehensive analysis of patterns and risk factors for high symptoms burden in NETs is warranted to provide information on how to screen for symptoms and support patients.
The increased use of patient‐reported outcomes (PROs) in clinical practice and research outlines the importance of understanding and addressing quality of life in patients with cancer [8]. In 2007, systematic collection of the Edmonton Symptom Assessment System (ESAS) scores during cancer outpatient visits was initiated in ON, Canada [9]. ESAS is a validated and reliable tool that assesses nine common cancer‐related symptoms [10], [11], [12]. Using these longitudinal prospectively collected PROs at the population level, this study sought to examine symptom trajectories over time and factors associated with reporting a high symptom burden in patients with NETs.
Subjects, Materials, and Methods
Study Design and Cohort
A population‐based, retrospective cohort study was conducted using prospectively collected PRO data in patients newly diagnosed with NET in ON, Canada. Incident cases of NET were identified in the Ontario Cancer Registry (OCR), which captures approximately 95% of patients diagnosed with cancer in ON, using the International Classification of Diseases for Oncology (ICD‐O.3) codes (supplemental online Table 1) [3]. Patients >18 years of age diagnosed between 2004 and 2015 who reported at least one ESAS score from date of diagnosis to the date of last follow‐up (date of death, date of last encounter, or December 31, 2016) and survived at least 12 months after diagnosis were included. Patients were excluded if they were older than 99 years of age, had another cancer diagnosis, or had a date of death recorded prior to the date of diagnosis. Characteristics of patients who did and did not receive ESAS symptoms screening were compared in order to appreciate generalizability of the findings (supplemental online Table 2).
Sunnybrook Health Sciences Centre Research Ethics Board approved the study and provided a waiver for informed consent. The study was conducted and reported following the RECORD statement [13].
Data Sources
PROs were abstracted from the Symptom Management Reporting Database, which includes ESAS scores recorded during outpatient visits to cancer clinics [14], [15]. Monitoring of ESAS scores was initiated in 2007 for patients visiting regional cancer centers. Considering the prolonged survival of NETs, NETs diagnoses were included starting in 2004, to capture patients with earlier diagnoses who were alive with disease when ESAS screening was implemented [3].
Additional data were obtained from the following data sets: the Registered Persons Database for vital status and demographics, the Discharge Abstract Database for diagnostic and discharge information for hospital admissions, the National Ambulatory Care Reporting System for outpatient visits, and the Ontario Health Insurance Plan Database for claims from health care providers. These data sets have been validated for various cohorts [16].
Outcomes
The primary outcome was patient‐reported moderate‐to‐severe symptom intensity defined using ESAS scores. ESAS is a PRO assessing the severity of nine common cancer‐associated symptoms: pain, tiredness, drowsiness, nausea, lack of appetite, shortness of breath, depression, anxiety, and overall well‐being. Its validity and reliability have been demonstrated in cancer populations [10], [11]. ESAS scores are collected at outpatient visits using a numeric scale ranging from 0 (no symptoms) to 10 (worst possible symptoms; supplemental online Fig. 1).
We defined moderate‐to‐severe symptoms as a score ≥4 [14], [17], [18]. All timeframes of interest were measured from the date of NET diagnosis. If more than one symptom score was reported in a given timeframe, the highest score was retained. Data were captured from date of diagnosis to date of last follow‐up, thereby allowing a minimum of 12 months to contribute data for all patients.
Covariates
Baseline characteristics were measured at NET diagnosis. Urban living was determined with postal code of residence in an urban area based on national census definition [19]. Socioeconomic status (SES) was assessed with an ecologic measure of income quintile [20]. Baseline comorbidity burden was measured using the Johns Hopkins Adjusted Clinical Groups system score based on health services use prior to NET diagnosis [21]. The total score was dichotomized with a cutoff of 10 for high comorbidity burden [21].
NETs were subdivided by primary tumor site as bronchopulmonary, gastroenteric, pancreatic, and others. Metastatic disease was defined using ICD‐O.3 codes and divided into synchronous (≤6 months from NET diagnosis) and metachronous metastases (>6 months after NET diagnosis; supplemental online Table 1).
Statistical Analysis
Descriptive analyses were used to define baseline characteristics and outcomes. Variables were reported as absolute number (n) and proportion (%). Comparisons were made between primary tumor sites using chi‐square tests.
ESAS scores were reported as the proportion of moderate‐to‐severe scores for each symptom plotted to describe the symptoms burden pattern over time. A first analysis looked at moderate‐to‐severe symptoms from NET diagnosis to the end of follow‐up, with scores reported by 6‐month intervals. Considering the long time frame for NET diagnosis in the cohort, and the potential for contributing the first ESAS score at different times, a subgroup analysis was conducted on patients with at least one ESAS score within 6 months following diagnosis. This assessed whether the observed trends were affected by patients contributing their first ESAS scores remotely from diagnosis.
A second analysis focused on the time from diagnosis to 12 months following diagnosis, with scores reported monthly. This was a more homogeneous cohort and allowed for a targeted assessment for potential patient support (more patients had the opportunity to contribute data such that higher numbers of scores were available).
Possible predictors of moderate‐to‐severe scores were examined. The examined factors were identified a priori as potentially associated with symptoms. Symptoms from NET diagnosis to 12 months following diagnosis were considered as outcomes. Univariate and multivariate modified Poisson regression models with robust error variance were created. Generalized estimating equations were used to account for clustering within patients. Therapy was treated as a time‐dependent variable, whereby ESAS scores within 30 days following the therapy were examined. The results are reported as relative risk with 95% confidence interval (95% confidence interval) for each ESAS symptom score.
Results
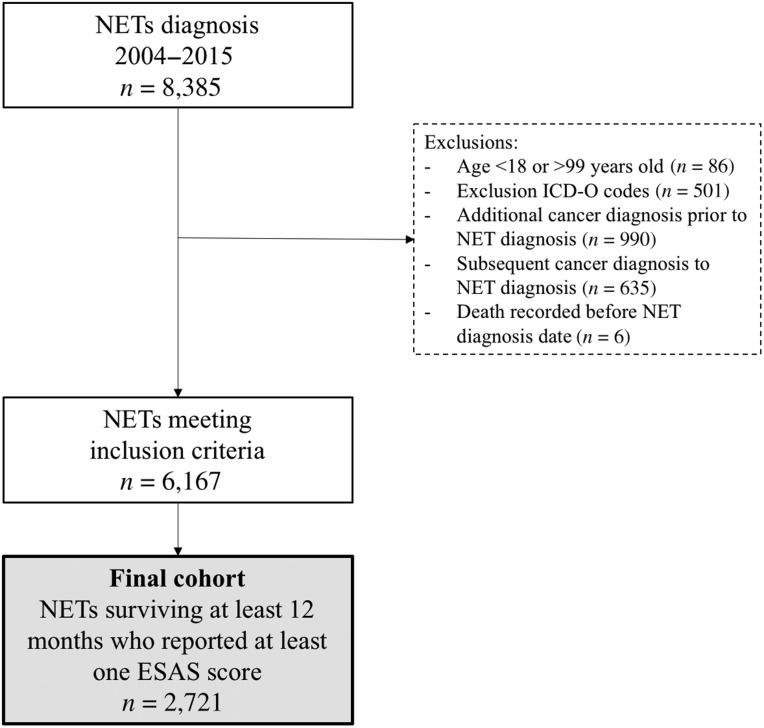
A total of 2,721 patients were included (Fig. 1). Patient characteristics are detailed in Table 1. A total of 7,719 ESAS assessments were included. On average, each patient contributed 7.8 scores (SD: 9.3).
Figure 1.
Flow diagram of cohort creation.
Abbreviations: ESAS, Edmonton Symptom Assessment System; ICD‐O, International Classification of Diseases for Oncology; NET, neuroendocrine tumor.
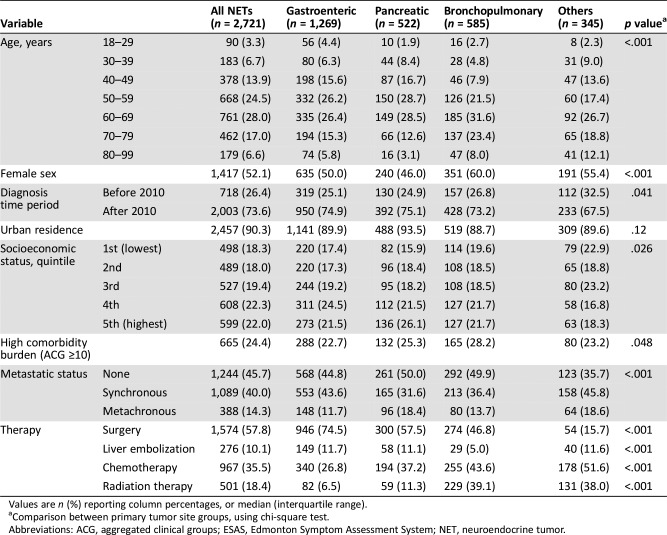
Table 1. Characteristics of patients diagnosed with NET and surviving at least 12 months who reported at least one ESAS score, stratified by primary tumor site.
Values are n (%) reporting column percentages, or median (interquartile range).
Comparison between primary tumor site groups, using chi‐square test.
Abbreviations: ACG, aggregated clinical groups; ESAS, Edmonton Symptom Assessment System; NET, neuroendocrine tumor.
ESAS Screening
Patients who recorded and did not record ESAS scores were compared (supplemental online Table 2). The year of diagnosis was the main factor determining ESAS screening, which corresponds to the gradual phase‐in of the program. Patients diagnosed with pancreatic NETs (69.2%) and with metastasis at presentation (58.0%) or following diagnosis (77.3%) more commonly recorded ESAS scores.
Patterns of Moderate‐to‐Severe Symptoms
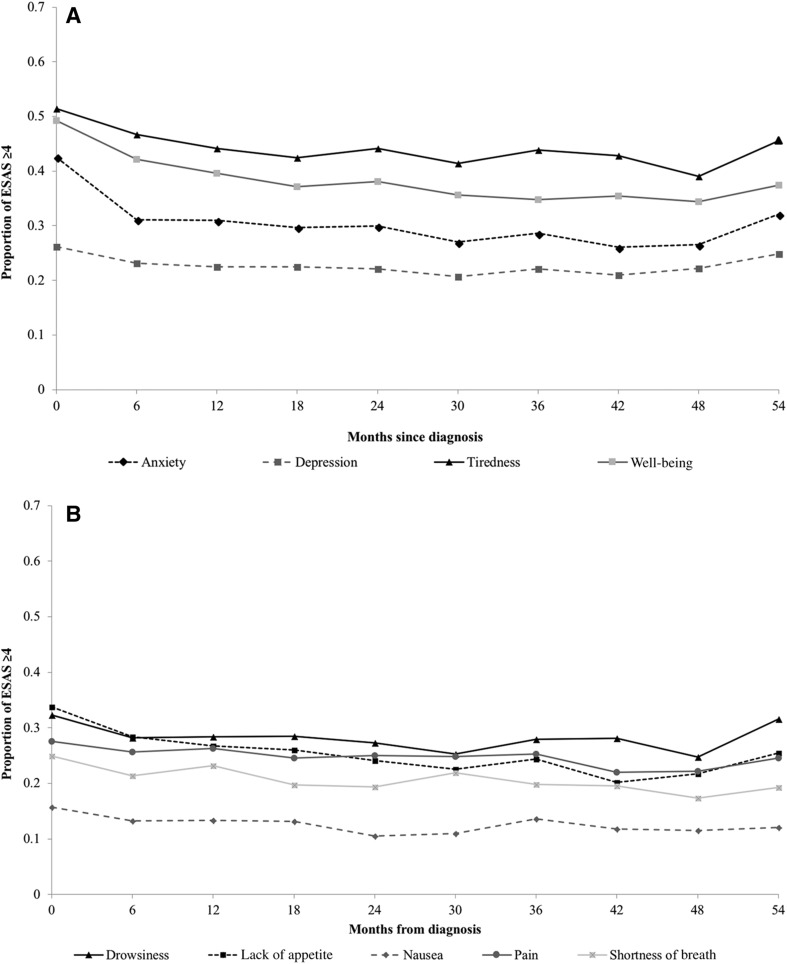
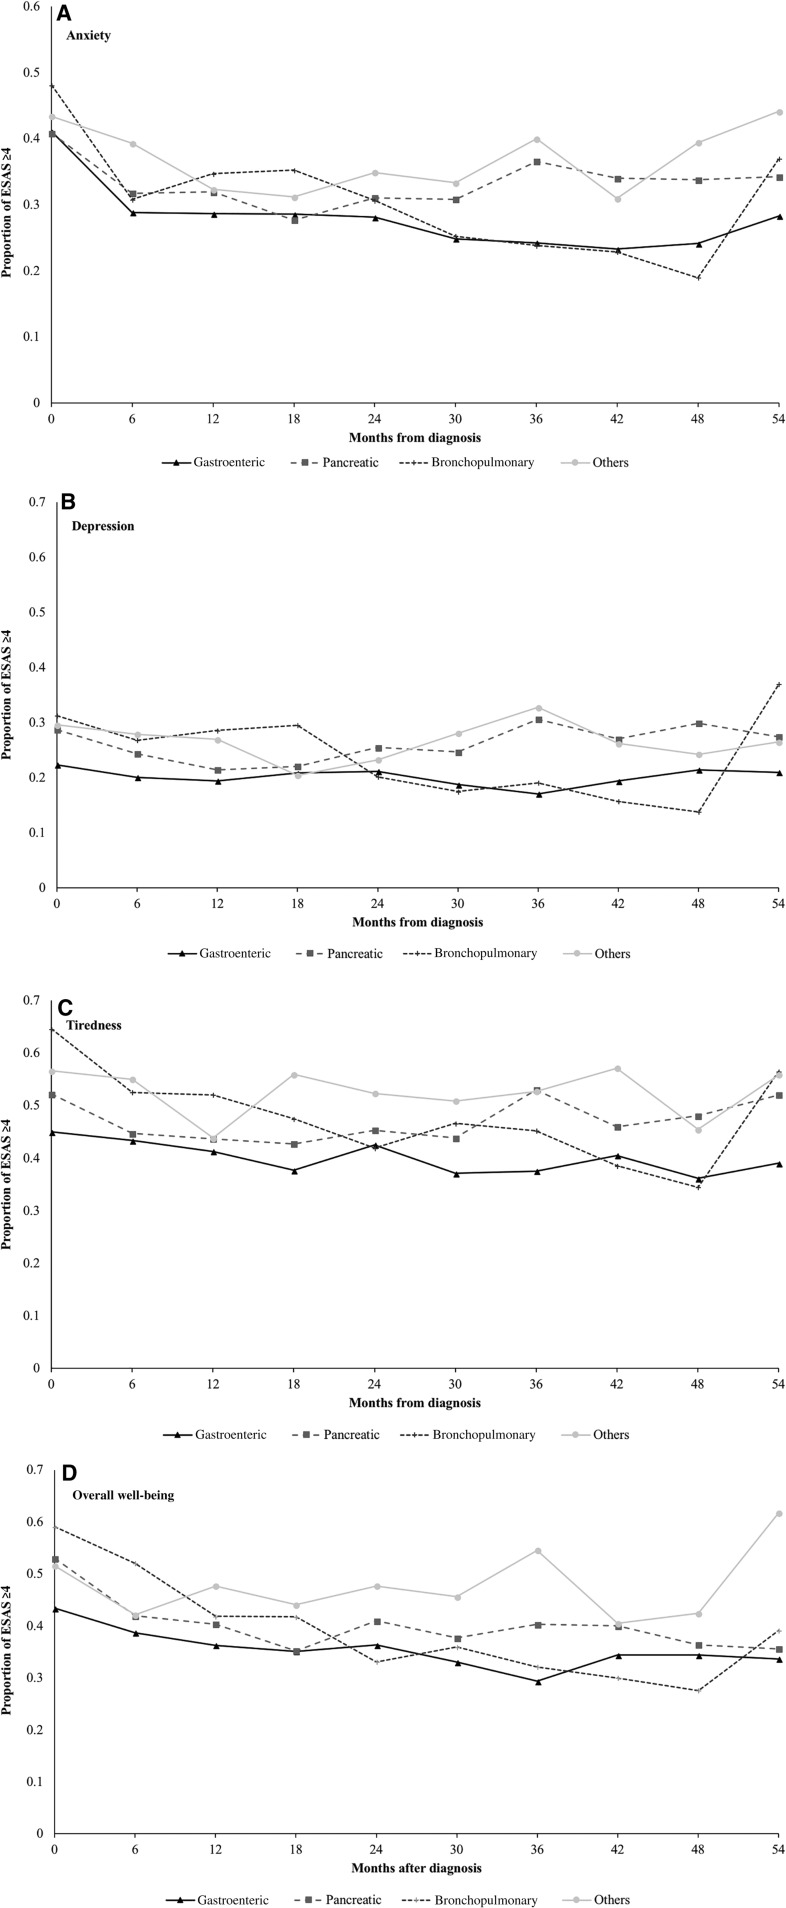
The proportion of patients recording moderate‐to‐severe symptoms over the 5 years following NET diagnosis is depicted in Figure 2. During this period, half the patients reported at least one moderate‐to‐severe score for tiredness and overall well‐being, and two out of five patients recorded at least one moderate‐to‐severe score for anxiety. Nausea and shortness of breath had the lowest incidence of elevated scores. The highest burden of symptoms was observed in patients with bronchopulmonary NETs, followed by pancreatic and gastroenteric NETs (Fig. 3; supplemental online Fig. 2).
Figure 2.
Proportion of patients with neuroendocrine tumors reporting moderate‐to‐severe (≥4) symptoms on the ESAS score from diagnosis to 5 years following diagnosis. (A): Anxiety, depression, tiredness, and well‐being. (B): Drowsiness, lack of appetite, nausea, pain, and shortness of breath. Trendlines do not represent continuous data but are included to facilitate the visualization of trends over time by symptom.
Abbreviation: ESAS, Edmonton Symptom Assessment System.
Figure 3.
Proportion of patients with neuroendocrine tumors reporting moderate‐to‐severe (≥4) symptoms on the ESAS score, stratified by primary tumor site. (A): Anxiety. (B): Depression. (C): Tiredness. (D): Overall well‐being. Trendlines do not represent continuous data but are included to facilitate the visualization of trends over time by symptom.
Abbreviation: ESAS, Edmonton Symptom Assessment System.
There was little change over time in the proportion of patients reporting moderate‐to‐severe symptoms (Fig. 2). The prevalence of moderate‐to‐severe anxiety was higher at the time of diagnosis, dropped by 10% at 6 months, and was stable thereafter. After an initial mild reduction between time of diagnosis to 6 months following diagnosis, the proportion of moderate‐to‐severe tiredness and overall well‐being stabilized at 40% or above. The proportion of elevated scores for other symptoms remained stable over time, with less than 5% change. The subgroup analysis did not alter the observed trends (supplemental online Fig. 3).
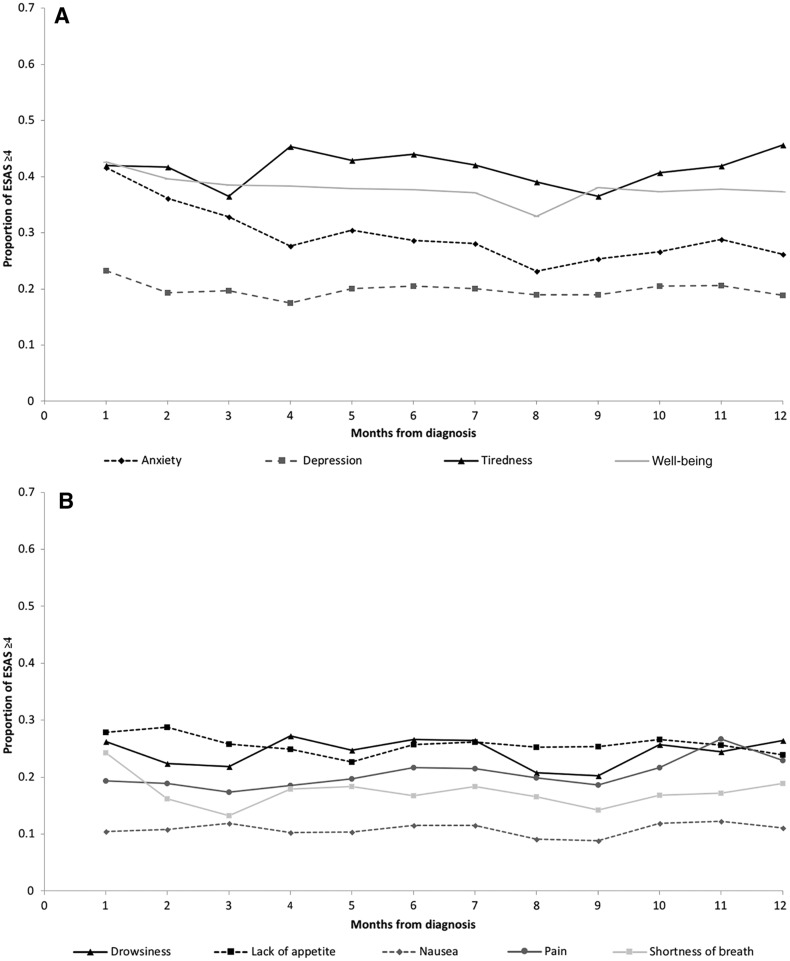
Patterns similar to the 5‐year time frame were observed for symptoms within 12 months of diagnosis (Fig. 4), with a mild reduction in the proportion of high scores noticed at 6 months.
Figure 4.
Proportion of patients with neuroendocrine tumors reporting moderate‐to‐severe (≥4) symptoms on the ESAS score from diagnosis to 12 months following diagnosis. (A): Anxiety, depression, tiredness, and well‐being. (B): Drowsiness, lack of appetite, nausea, pain, and shortness of breath. Trendlines do not represent continuous data but are included to facilitate the visualization of trends over time by symptom.
Abbreviation: ESAS, Edmonton Symptom Assessment System.
Predictors of Moderate‐to‐Severe Symptoms Scores
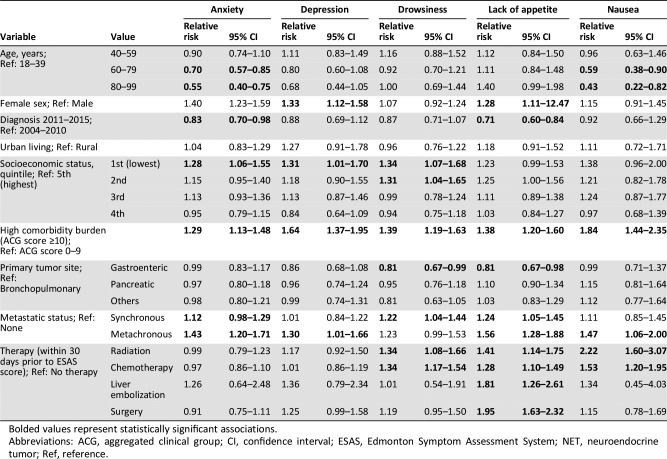
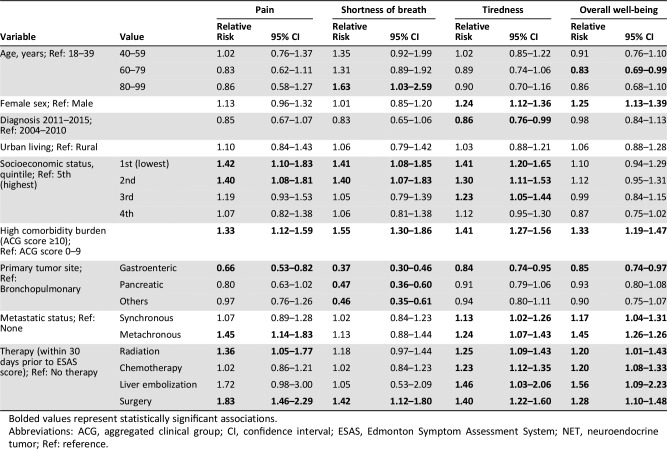
There were significant variations in the risk of reporting moderate‐to‐severe symptoms scores based on patient and tumor characteristics (Table 2A). Patients with gastroenteric NETs had a lower risk of reporting elevated scores compared with patients with bronchopulmonary NETs. Both synchronous and metachronous metastatic disease were independently associated with a higher risk of recording moderate‐to‐severe scores.
Table 2A. Multivariable analysis of the association between patient and tumor characteristics with moderate‐to‐severe (≥4) symptoms on the ESAS score within 12 months of diagnosis for patients with NETs (anxiety, depression, drowsiness, lack of appetite, and nausea).
Bolded values represent statistically significant associations.
Abbreviations: ACG, aggregated clinical group; CI, confidence interval; ESAS, Edmonton Symptom Assessment System; NET, neuroendocrine tumor; Ref, reference.
Table 2B. Multivariable analysis of the association between patient and tumor characteristics with moderate‐to‐severe (≥4) symptoms on the ESAS score within 12 months of diagnosis for patients with NETs (pain, shortness of breath, tiredness, and overall well‐being).
Bolded values represent statistically significant associations.
Abbreviations: ACG, aggregated clinical group; CI, confidence interval; ESAS, Edmonton Symptom Assessment System; NET, neuroendocrine tumor; Ref: reference.
Older patients presented a lower risk of anxiety, nausea, and overall well‐being. Lower SES (1st quintile) was associated with increased risk of anxiety, depression, drowsiness, pain, shortness of breath, and tiredness compared with the highest quintile. Finally, patients with a high comorbidity burden had an increased risk for all symptoms.
Patients who received therapy within 30 days of symptom screening were at higher risk of reporting elevated scores immediately following treatment: nausea, lack of appetite, drowsiness, tiredness, and overall well‐being for chemotherapy; nausea, lack of appetite, drowsiness, tiredness, and overall well‐being for radiation therapy; and lack of appetite, pain, shortness of breath, tiredness, and overall well‐being for surgery.
Discussion
Description of the NET cancer journey is crucial to better understand symptom patterns over time. This population‐based study of patient‐reported symptoms indicated a high burden of symptoms at the time of NET diagnosis that persists up to 5 years later. Predominant symptoms included tiredness, impaired well‐being, and anxiety, impacting 30%‐45% of patients long term.
PROs have previously been used to assess symptom trajectories in common cancers [14], [15], [17]. This is the first study providing insight into symptom burden for NETs using population‐based, validated, prospectively collected tools. It fills a gap in the NETs literature regarding PROs. The symptoms most commonly scored moderate‐to‐severe are similar to other types of cancers [14]. However, the symptom trajectory in NETs differs: whereas the odds of high scores decrease with each successive month from diagnosis time in other cancers, the proportion of elevated scores for NETs remains stable over 5 years following diagnosis. This testifies to the unique nature and chronicity of NETs characterized by indolent biology and outlines the need for supportive care models tailored to the specific needs of NETs [3].
Studies assessing the symptom burden of NETs have been limited to volunteered patient surveys and quality‐of‐life questionnaires [22], [23]. The Global NET survey was led by a patient advocacy group and relied on subjective nonvalidated patient‐reported surveys. Although it provided interesting data regarding the patient experience, it was limited by recall bias and patterns of volunteered survey answers [23]. Other work used quality‐of‐life questionnaires to reveal worse quality‐of‐life scores in patients with NETs compared with the general population [24], [25], [26], [27]. However, they were based on either volunteered participation through patient organizations or the assessment of therapy in the setting of a clinical trial, which limits generalizability. The current analysis adds to the existing literature by providing a detailed analysis of symptoms in a large population of patients with NETs using validated and prospectively administered tools. Beyond appreciating symptom trajectories, this use of PROs offers actionable information.
In order to use this information to design patient support strategies, patient and disease factors associated with the report of moderate‐to‐severe scores were examined. The association of younger age with higher symptom burden has been reported in patients with cancer, albeit inconsistently [14], [15], [28]. The impact of comorbidity burden on symptoms is also common to other diseases [29], [30]. Higher risk of elevated symptom scores in patients with lower SES may reflect documented differences in health‐seeking behaviors in this population or variable access to care [31], [32], [33]. These differences in symptom burden as a result of nondisease factors suggest a need for equity‐based support in NETs. Finally, the increased risk of moderate‐to‐severe symptom scores within 30 days of receiving therapy is consistent with documented side effects and outlines the importance of mitigating toxicity when sequencing therapy for patients with prolonged survival and proactively following them closely [34].
Patients with NETs have previously reported difficulty finding disease‐specific support and lacking guidance in navigating the diagnostic and prolonged care processes [5]. Although not specific to NETs, ESAS scores can be used to screen for need of additional assessments and interventions. Specialized multidisciplinary care models for NETs should look beyond the provision of oncology care and include early involvement of allied health support and palliative care for symptom management early in the course of disease even though survival is prolonged and patients may not be at the end of life. Such interventions could be developed to support patients flagged with high symptom burden [35]. Future work should also focus on examining the relationships between symptoms as well as the identification of symptom clusters that may be related to need for therapy or to prognosis. Such analyses fell beyond the scope of the current work.
The main limitation of this study is the variation in rates of patient‐reported symptom screening in the population, reflecting the implementation of the provincial program whereby screening was initially focused on specialized cancer clinics. It may impact generalizability of the results. The disparities observed in ESAS screening are consistent with more screenings occurring in cancer clinics, which may overestimate the symptom burden by selecting a population with more complex diseases (supplemental online Table 2). Additionally, the use of PROs is associated with enhanced patient engagement in their care and ensuing satisfaction, such that the receipt of PRO screening itself may bias the results [8]. Another issue relates to the smaller number of patients available for analysis with increasing time for diagnosis, especially when looking at subgroups. Therefore, changes in symptoms patterns in the last months of follow‐up may appear larger but are less stable, such as increases observed in symptoms for bronchopulmonary primary NETs. Finally, the heterogeneity of NETs is acknowledged; it was not possible to look at the symptom scores stratified by tumor grade or stage because this information was not available.
Conclusion
This study of longitudinally prospectively collected patient‐reported symptom scores outlines a high prevalence of moderate‐to‐severe symptoms in patients with NETs, with no change over time. It is unique in understanding the NET patient experience and can serve to devise pathways and policies to better support patients, evaluate supportive interventions, and assess the effectiveness of symptom management at the provider, institutional, and system levels. Patients remain at risk of prolonged symptom burden following diagnosis, highlighting potential unmet needs. Patient and disease factors associated with moderate‐to‐severe symptom scores have been described to facilitate the design of patient support strategies. This information can thus inform and support early and ongoing comprehensive symptom assessment and management warranted to improve patient‐centered care for NETs.
See http://www.TheOncologist.com for supplemental material available online.
Acknowledgments
This study was supported by the Institute for Clinical Evaluative Sciences (ICES), which is funded by an annual grant from the Ontario Ministry of Health and Long‐Term Care (MOHLTC). The opinions, results, and conclusions reported in this paper are those of the authors and are independent from the funding sources. No endorsement by ICES or the Ontario MOHLTC is intended or should be inferred. Parts of this material are based on data and information compiled and provided by CIHI. However, the analyses, conclusions, opinions, and statements expressed herein are those of the author and not necessarily those of CIHI. Parts of this material are based on data and information provided by Cancer Care Ontario (CCO). The opinions, results, view, and conclusions reported in this paper are those of the authors and do not necessarily reflect those of CCO. No endorsement by CCO is intended or should be inferred. This work was funded by an unrestricted grant to the Sunnybrook Foundation by Ipsen, the NANETS Clinical Investigator Scholarship, and the Sherif and Mary‐Lou Hanna Chair in Surgical Oncology. Part of this work was presented as a poster presentation at the 2018 NANETS Annual Symposium in Seattle, WA, in October 2018.
Footnotes
For Further Reading: Matthew H. Kulke, Al B. Benson, Arvind Dasari et al. Real‐World Treatment Patterns and Clinical Outcomes in Advanced Gastrointestinal Neuroendocrine Tumors (GI NET): A Multicenter Retrospective Chart Review Study. The Oncologist 2019;24:1056–1065.
Implications for Practice: This study, assessing treatment patterns over a period of up to 30 years, showed that SSAs, LDT, cytotoxic chemotherapy, and interferon are common treatments for advanced GI NETs. SSAs alone or in combination with other treatments were the most frequent therapy in first and subsequent lines. Patients in this study remained on SSAs long‐term, with median treatment duration of 12.8 years in first line. Treatment patterns should be assessed beyond this study's time period, given recent U.S. Food and Drug Administration approvals for additional treatments for GI NET, which will likely be incorporated in the continuum of care of patients.
Author Contributions
Conception/design: Julie Hallet, Calvin H.L. Law, Natalie G. Coburn
Provision of study material or patients: Julie Hallet, Laura E. Davis, Haoyu Zhao, Kaitlyn Beyfuss, Natalie G. Coburn
Collection and/or assembly of data: Julie Hallet, Laura E. Davis, Alyson L. Mahar, Lev D. Bubis, Haoyu Zhao, Kaitlyn Beyfuss, Natalie G. Coburn
Data analysis and interpretation: Julie Hallet, Laura E. Davis, Alyson L. Mahar, Calvin H.L. Law, Elie Isenberg‐Grzeda, Lev D. Bubis, Simron Singh, Sten Myrehaug, Haoyu Zhao, Kaitlyn Beyfuss, Lesley Moody, Natalie G. Coburn
Manuscript writing: Julie Hallet, Laura E. Davis, Alyson L. Mahar, Calvin H.L. Law, Elie Isenberg‐Grzeda, Lev D. Bubis, Simron Singh, Sten Myrehaug, Haoyu Zhao, Kaitlyn Beyfuss, Lesley Moody, Natalie G. Coburn
Final approval of manuscript: Julie Hallet, Laura E. Davis, Alyson L. Mahar, Calvin H.L. Law, Elie Isenberg‐Grzeda, Lev D. Bubis, Simron Singh, Sten Myrehaug, Haoyu Zhao, Kaitlyn Beyfuss, Lesley Moody, Natalie G. Coburn
Disclosures
Julie Hallet: Ipsen Biopharmaceuticals Canada, Novartis Oncology (H); Calvin H.L. Law: Novartis, Gilead, Taiho (H), Amgen, Roche (C/A); Sten Myrehaug: Novartis AG, Ipsen (C/A, H); Natalie G. Coburn: Cancer Care Ontario (C/A).
(C/A) Consulting/advisory relationship; (RF) Research funding; (E) Employment; (ET) Expert testimony; (H) Honoraria received; (OI) Ownership interests; (IP) Intellectual property rights/inventor/patent holder; (SAB) Scientific advisory board
References
- 1.Yao JC, Hassan M, Phan A et al. One hundred years after “carcinoid”: Epidemiology of and prognostic factors for neuroendocrine tumors in 35,825 cases in the United States. J Clin Oncol 2008;26:3063–3072. [DOI] [PubMed] [Google Scholar]
- 2.Dasari A, Shen C, Halperin D et al. Trends in the incidence, prevalence, and survival outcomes in patients with neuroendocrine tumors in the United States. JAMA Oncol 2017;3:1335–1338. [DOI] [PMC free article] [PubMed] [Google Scholar]
- 3.Hallet J, Cukier M, Saskin R et al. Exploring the rising incidence of neuroendocrine tumors: A population‐based analysis of epidemiology, metastatic presentation, and outcomes. Cancer 2015;121:589–597. [DOI] [PubMed] [Google Scholar]
- 4.Kunz PL. Understanding neuroendocrine tumors—A NET gain. JAMA Oncol 2017;3:1343–1344. [DOI] [PubMed] [Google Scholar]
- 5.Feinberg Y, Law C, Singh S et al. Patient experiences of having a neuroendocrine tumour: A qualitative study. Eur J Oncol Nurs 2013;17:541–545. [DOI] [PubMed] [Google Scholar]
- 6.Modlin IM, Oberg K, Chung DC et al. Gastroenteropancreatic neuroendocrine tumours. Lancet Oncol 2008;9:61–72. [DOI] [PubMed] [Google Scholar]
- 7.Martini C, Gamper EM, Wintner L et al. Systematic review reveals lack of quality in reporting health‐related quality of life in patients with gastroenteropancreatic neuroendocrine tumours. Health Qual Life Outcomes 2016;14:1–18. [DOI] [PMC free article] [PubMed] [Google Scholar]
- 8.Basch E. Patient‐reported outcomes—Harnessing patients' voices to improve clinical care. N Engl J Med 2017;376:105–108. [DOI] [PubMed] [Google Scholar]
- 9.Cancer Quality Council of Ontario: Symptom assessment and management . 2016. Available at http://www.cqco.ca/cms/one.aspx?pageId=14987. Accessed February 2019.
- 10.Bruera E, Kuehn N, Miller MJ et al. The Edmonton Symptom Assessment System (ESAS): A simple method for the assessment of palliative care patients. J Palliat Care 1991;7:6–9. [PubMed] [Google Scholar]
- 11.Nekolaichuk C, Watanabe S, Beaumont C. The Edmonton Symptom Assessment System: A 15‐year retrospective review of validation studies (1991‐‐2006). Palliat Med 2008;22:111–122. [DOI] [PubMed] [Google Scholar]
- 12.Watanabe SM, Nekolaichuk C, Beaumont C et al. A multicenter study comparing two numerical versions of the Edmonton Symptom Assessment System in palliative care patients. J Pain Symptom Manage 2011;41:456–468. [DOI] [PubMed] [Google Scholar]
- 13.Benchimol EI, Smeeth L, Guttmann A et al. The REporting of studies Conducted using Observational Routinely‐collected health Data (RECORD) Statement. PLoS Med 2015;12:e1001885. [DOI] [PMC free article] [PubMed] [Google Scholar]
- 14.Bubis LD, Davis L, Mahar A et al. Symptom burden in the first year after cancer diagnosis: An analysis of patient‐reported outcomes. J Clin Oncol 2018;36:1103–1111. [DOI] [PubMed] [Google Scholar]
- 15.Barbera L, Seow H, Howell D et al. Symptom burden and performance status in a population‐based cohort of ambulatory cancer patients. Cancer 2010;116:5767–5776. [DOI] [PubMed] [Google Scholar]
- 16.Iron K, Zagorski BM, Sykora K et al. Living and dying in Ontario: An opportunity for improved health information. ICES Investigative Report. Toronto: ICES; 2008.
- 17.Seow H, Barbera L, Sutradhar R et al. Trajectory of performance status and symptom scores for patients with cancer during the last six months of life. J Clin Oncol 2011;29:1151–1158. [DOI] [PubMed] [Google Scholar]
- 18.Spoozak L, Seow H, Liu Y et al. Performance status and symptom scores of women with gynecologic cancer at the end of life. Int J Gynecol Cancer 2013;23:971–978. [DOI] [PubMed] [Google Scholar]
- 19.Plessis Du V, Beshiri R, Bollman R. Definitions of “rural.” Rural Small Town Can Anal Bull 2013;3:1–43. [Google Scholar]
- 20.Wilkins R. Use of postal codes and addresses in the analysis of health data. Health Rep 1993;5:157–177. [PubMed] [Google Scholar]
- 21.Reid RJ, MacWilliam L, Verhulst L et al. Performance of the ACG case‐mix system in two Canadian provinces. Med Care 2001;39:86–99. [DOI] [PubMed] [Google Scholar]
- 22.Chau I, Casciano R, Willet J et al. Quality of life, resource utilisation and health economics assessment in advanced neuroendocrine tumours: A systematic review. Eur J Cancer Care 2013;22:714–725. [DOI] [PMC free article] [PubMed] [Google Scholar]
- 23.Singh S, Granberg D, Wolin E et al. Patient‐reported burden of a neuroendocrine tumor (NET) diagnosis: Results from the first global survey of patients with NETs. J Glob Oncol 2017;3:43–53. [DOI] [PMC free article] [PubMed] [Google Scholar]
- 24.Beaumont JL, Cella D, Phan AT et al. Comparison of health‐related quality of life in patients with neuroendocrine tumors with quality of life in the general US population. Pancreas 2012;41:461–466. [DOI] [PubMed] [Google Scholar]
- 25.Haugland T, Vatn MH, Veenstra M et al. Health related quality of life in patients with neuroendocrine tumors compared with the general Norwegian population. Qual Life Res 2009;18:719–726. [DOI] [PubMed] [Google Scholar]
- 26.Meng Y, McCarthy G, Berthon A et al. Patient‐reported health state utilities in metastatic gastroenteropancreatic neuroendocrine tumours – An analysis based on the CLARINET study. Health Qual Life Outcomes 2017;15:1–9. [DOI] [PMC free article] [PubMed] [Google Scholar]
- 27.Jiménez‐Fonseca P, Carmona‐Bayonas A, Martín‐Pérez E et al. Health‐related quality of life in well‐differentiated metastatic gastroenteropancreatic neuroendocrine tumors. Cancer Metastasis Rev 2015;34:381–400. [DOI] [PubMed] [Google Scholar]
- 28.Mao JJ, Armstrong K, Bowman MA et al. Symptom burden among cancer survivors: Impact of age and comorbidity. J Am Board Fam Med 2007;20:434–443. [DOI] [PubMed] [Google Scholar]
- 29.Osann K, Hsieh S, Nelson EL et al. Factors associated with poor quality of life among cervical cancer survivors: Implications for clinical care and clinical trials. Gynecol Oncol 2014;135:266–272. [DOI] [PMC free article] [PubMed] [Google Scholar]
- 30.Reeve BB, Chen RC, Moore DT et al. Impact of comorbidity on health‐related quality of life after prostate cancer treatment: Combined analysis of two prospective cohort studies. BJU Int 2014;114:E74–E81. [DOI] [PubMed] [Google Scholar]
- 31.Ciccone G, Prastaro C, Ivaldi C et al. Access to hospital care, clinical stage and survival from colorectal cancer according to socio‐economic status. Ann Oncol 2000;11:1201–1204. [DOI] [PubMed] [Google Scholar]
- 32.McIsaac W, Goel V, Naylor D. Socio‐economic status and visits to physicians by adults in Ontario, Canada. J Health Serv Res Policy 1997;2:94–102. [DOI] [PubMed] [Google Scholar]
- 33.Lathan CS, Cronin A, Tucker‐Seeley R et al. Association of financial strain with symptom burden and quality of life for patients with lung or colorectal cancer. J Clin Oncol 2016;34:1732–1740. [DOI] [PMC free article] [PubMed] [Google Scholar]
- 34.Thawer A, Chan D, Leake J et al. Pharmacist‐led development of an adverse event (AE) management algorithm for the proactive monitoring of patients with neuroendocrine tumors (NETs) on everolimus. Pancreas 2018;47:355. [Google Scholar]
- 35.Rocque GB, Pisu M, Jackson BE et al. Resource use and Medicare costs during lay navigation for geriatric patients with cancer. JAMA Oncol 2017;3:817–825. [DOI] [PMC free article] [PubMed] [Google Scholar]


