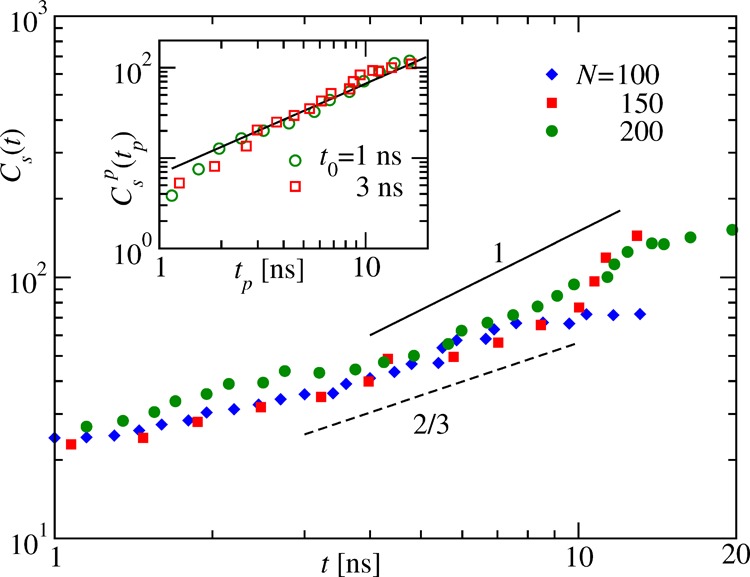
Figure 6.

Cluster growth during the collapse. The main
frame shows the growth
of the mean cluster or pearl size Cs(t) with time for different N. The solid
and the dashed lines represent power-law behavior Cs(t) ∼ tα with α = 1 and 2/3, respectively. The inset shows
the plot of Csp(tp) as a function
of the shifted time tp = t – t0 for N =
200 with two different choices of t0.
The solid line there represents a linear power-law behavior  with αc = 1.
