Abstract
Humans can choose between fundamentally different options, such as watching a movie or going out for dinner. According to the utility concept, put forward by utilitarian philosophers and widely used in economics, this may be accomplished by mapping the value of different options onto a common scale, independent of specific option characteristics (Fehr and Rangel, 2011; Levy and Glimcher, 2012). If this is the case, value-related activity patterns in the brain should allow predictions of individual preferences across fundamentally different reward categories. We analyze fMRI data of the prefrontal cortex while subjects imagine the pleasure they would derive from items belonging to two distinct reward categories: engaging activities (like going out for drinks, daydreaming, or doing sports) and snack foods. Support vector machines trained on brain patterns related to one category reliably predict individual preferences of the other category and vice versa. Further, we predict preferences across participants. These findings demonstrate that prefrontal cortex value signals follow a common scale representation of value that is even comparable across individuals and could, in principle, be used to predict choice.
Keywords: choice prediction, common scale, decision making, subjective value, utility
Introduction
Life can be seen as a series of decisions. Often, comparisons have to be made between qualitatively very different options, such as going on a vacation or buying a car. Following the utility concept put forward by utilitarian philosophers and used by economists, it has been suggested that the brain performs decisions between such dissimilar options by assigning a value to each of them, which is mapped on a common scale of desirability regardless of the specific type of option (Montague and Berns, 2002; Fehr and Rangel, 2011; Levy and Glimcher, 2012). In line with the hypothesis of a common scale of subjective value, human functional magnetic resonance imaging (fMRI) studies have observed an overlap of value-related signals in the medial prefrontal cortex (mPFC) for different types of reward, such as consumer goods, monetary rewards, and also social rewards (Chib et al., 2009; FitzGerald et al., 2009; Lebreton et al., 2009; Smith et al., 2010; Kim et al., 2011; Levy and Glimcher, 2011; Lin et al., 2012). Further, it has been demonstrated that value signals for money and food options do not only spatially overlap, but that equally preferred money and food options elicit comparable BOLD responses in the mPFC both univariately (Levy and Glimcher, 2011) and multivariately (McNamee et al., 2013).
In this study we want to rigorously test the common scale hypothesis on three different grounds. First, if there is a common neural code for value, this should also be the case for goods that are rarely traded, rarely used as substitutes, and whose value cannot be easily expressed in monetary terms. Second, abstract value signals should be detectable in the absence of a monetary evaluation task. Third, if humans employ the same, possibly innate, coding mechanism for value, value signals should be comparable across individual participants.
We therefore use multivariate analysis of fMRI data and test whether it is possible to predict individual preferences across fundamentally different categories in the absence of monetary evaluation. In contrast to univariate analysis, multivariate analysis of fMRI data allows exploring whether value signals are not only spatially overlapping, but also encoded in a similar way, which is a prerequisite for a common scale representation. As reward categories, we chose snack foods and engaging activities because they differ fundamentally with respect to the sensory and motivational systems involved. Snack foods (like donut, cheesecake, chocolate etc.) constitute primary rewards that serve energy intake and are directly linked to gustatory perception, whereas the engaging activities serve the pursuit of secondary goals as diverse as socializing, relaxing, fitness, and culture (like going out for drinks, daydreaming, playing tennis, visiting a museum). In addition, these activities are rarely traded and it is therefore unlikely that subjects associate a monetary value with them.
Materials and Methods
Subjects and task
Eight healthy subjects (5 female, 3 male, age 25–30 years) without prior history of psychiatric or neurological disorders participated in the study. All subjects gave their written informed consent before participation and the study protocol was approved by the Ethics Committee of the Faculty of Psychology and Neuroscience, Maastricht University. Subjects were asked to refrain from eating for 4 h before the experiment.
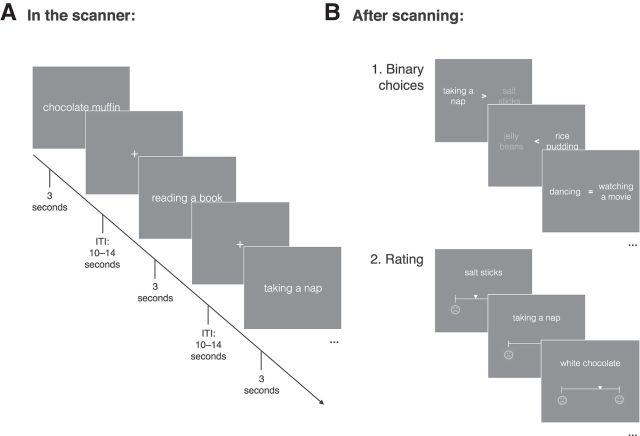
During functional imaging, subjects were asked to imagine the pleasure they would derive from (1) eating different snack food items (e.g., potato chips, a blueberry muffin, or chocolate ice cream) or (2) engaging in different activities (e.g., listening to music, having a nap, or window cleaning). There were 60 items per category (see below). Items were presented in written form and random order to each subject for three seconds separated by a variable intertrial interval of 10–14 s (Fig. 1A). Each item was presented two times over the whole fMRI session.
Figure 1.
Experimental Procedure. A, In the scanner participants were presented with 60 different activities and 60 different snack foods in written form, each presented for three seconds with the instruction to imagine how much pleasure they would derive from it. Each item was presented twice, resulting in 240 trials. B, After scanning, participants made 500 binary choices between the presented items followed by a rating task in which they rated each of the 120 items on a visual analog scale.
Immediately after scanning, outside the scanner, subjects made a series of hypothetical binary choices. In total, 500 item pairs were presented, both within and across categories with the instruction to choose the item that would yield more pleasure to the participant right now. This choice data were used to infer a preference ranking over all 120 items. We refer to these ranks as observed subjective values. After the binary choice task, participants rated their imagined pleasure for each item using a visual analog scale (Fig. 1B). This allowed us to validate the preference ranking obtained from the binary choice task. Consistency across these two preference measures was high (Pearson's correlation ranged between r = 0.75 and r = 0.92).
Stimuli
Sixty items per category were presented to the participants. Both categories were constructed such that they included items that were potentially liked a lot, but also items that may be disliked. As activities we used for example “playing tennis,” “jogging,” “listening to music,” “observing animals,” “daydreaming,” “sitting in a park,” “fixing a bike,” “cleaning windows,” and “taking an exam.” Examples for snack foods are “croissant,” “waffle,” “blueberry muffin,” “chocolate cookie,” “wasabi nuts,” “paprika potato chips,” and “salmiak.” The full list of items is available from the authors upon request.
MRI data acquisition
Measurements were performed on a 3T TIM Trio scanner (Siemens). Functional responses were measured in four independent runs using a whole brain standard gradient echo EPI sequence (GRAPPA = 2, TE = 30 ms, slices = 32, TR = 2000 ms, FOV = 192 × 192 mm2, voxel size = 3 × 3 × 3 mm3). A T1-weighted magnetization prepared rapid acquisition gradient echo (3D-MPRAGE, GRAPPA = 2, TR: 2050 ms, TE: 2.6 ms, FOV: 256 × 256 mm2, flip angle: 9°, 192 sagittal slices, voxel size: 1 × 1 × 1 mm3) anatomical dataset was acquired for coregistration, segmentation and visualization of the functional results.
MRI data analysis
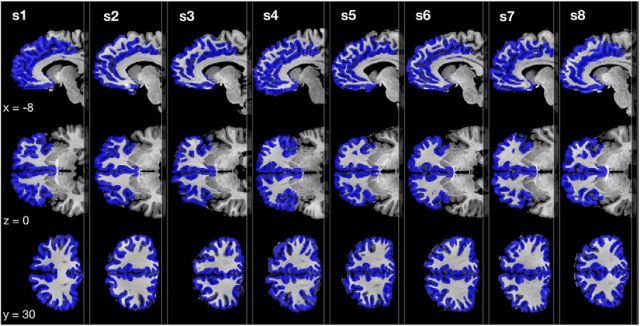
Functional and anatomical images were analyzed using BrainVoyager QX (Brain Innovation) as well as custom code in R (R Development Core Team, 2008). Preprocessing of the functional data included interscan slice-time correction, rigid body motion correction, as well as temporal filtering using a Fourier basis set of five cycles per run. The functional data were then coregistered with the individual anatomical scan and transferred into Talairach space (Talairach and Tournoux, 1988). Anatomical data were segmented to identify gray matter for mask generation. All multivariate fMRI data analysis was performed on a single subject level and was restricted to an anatomically defined gray matter mask (Fig. 2) entailing each subject's entire frontal cortex (corresponding to Brodman areas 9–13, 25, 32, 33, 46, 47). For comparison, univariate analysis was performed using the postscanning observed subjective value as a linear parametric modulation of hemodynamic response.
Figure 2.
Frontal cortex masks. Anatomically defined gray matter mask including Brodman areas 9–13, 25, 32, 33, 46, and 47 used in this study for each subject.
Multivoxel pattern analysis
Feature creation.
Each item was presented twice during scanning to improve data reliability. Functional data for each individual item was averaged across the two trials in which it was presented. Thus, for each item we obtained a single time course from each voxel by averaging across the two trials. This time course for each voxel was then collapsed across functional volumes to obtain the set of predictors (feature sets) for the model. Because participants did not perform any actions during fMRI but were instructed to just imagine subjective pleasure, it can be expected that the individual onset and duration of the BOLD response vary with participants. Therefore, for each subject multiple feature sets were created by computing the mean of the raw fMRI signal for slightly jittered time intervals. These time intervals differed with respect to the start-point after stimulus onset (1–4 volumes in steps of 1) and the length of the time interval (1–3 volumes in steps of 1). Thus 12 different feature sets were created for each participant (Fig. 3A).
Figure 3.
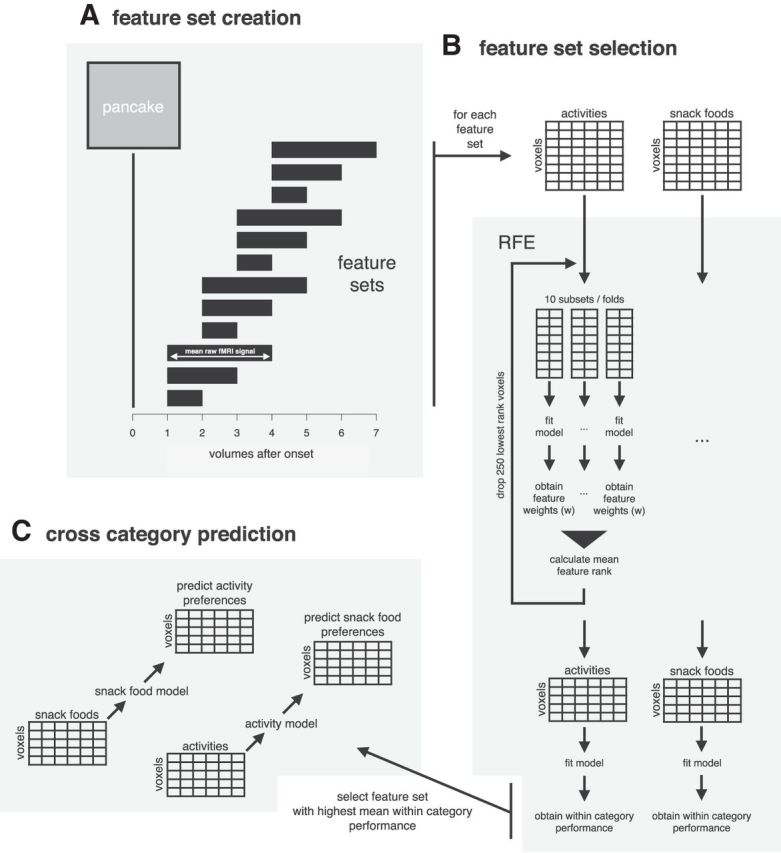
Multivoxel pattern analysis. Figure illustrating the steps of the main multivoxel pattern analysis used in this study. A, Twelve feature sets of different time intervals were created for each participant. B, Recursive feature elimination (RFE) was used within each category for each feature set to obtain the 25% most informative voxels. C, The feature set with the highest within-category performance was used to perform across category predictions by training a model on one item category (e.g., snack foods) and using it to predict preferences over items of the other category (e.g., activities) and vice versa.
Feature set selection.
To select the best time interval for the final analysis, we evaluated model performance within one category for each feature set individually for each participant. For each feature set, recursive feature elimination (RFE) was used to reduce the number of voxels by 75%. Two linear support vector regression models (ε-SVR) were recursively fitted to the data. One model was fitted using all snack food items, the other one using all activity items (Fig. 3B).
RFE was performed following Duan et al. (2005). In each RFE step, the dataset was randomly split into 10 mutually exclusive subsets (10-fold). In each subset, an ε-SVR was fitted to the data. Weight scores of the features were obtained and aggregated across the 10 subsets to stabilize the feature ranking (multiple SVM-RFE; Duan et al., 2005). Based on the aggregated feature ranking the 250 voxels with the lowest ranking scores were eliminated. For each model, this procedure was repeated until the 25% most informative voxels remained. Thus, multiple SVM-RFE was used to optimize the snack food model in predicting the value for other snack foods and the activity model in predicting the value for other activities. For each participant, the time interval underlying the feature set that yielded the highest mean performance of these two models was ultimately used for across-category predictions.
As within-category prediction performance is not the main focus of this paper, we do not report within-category performance measures, but only across-category performance. This approach circumvents any biases resulting from two-stage selection procedures that first pick the best-performing feature set and then fit a final model using the same data (Kriegeskorte et al., 2009; Vul et al., 2009).
Final model.
Across-category performance was calculated at the very end of the analysis and was thus not part of any two-stage selection procedure. The SVR model trained on snack food items was used to predict the preference ranking over activities and vice versa (Fig. 3C). Training and testing set were therefore entirely independent. Correlations between the observed preference ranks and predicted ranks were calculated to assess prediction accuracies between categories for each subject.
Permutation testing.
Permutation testing was used to assess the statistical significance of the correlations between predicted and observed preference ranks. For each permutation, labels (in our case the rank-value) were randomly reassigned to the features. The data with permuted labels was then treated in exactly the same way as the original data. That is, the same multiple SVM-RFE procedure was used to reduce the number of voxels to the 25% most informative (within-category). On these voxels, the final model for across-category predictions was trained. This procedure was repeated 2000 times, yielding 2000 correlations between predicted and observed preference ranks based on randomly assigned rank-value. The p value for the actual correlation was determined based on this distribution.
Across subject models.
For the across subject predictions we fitted one SVR model for each participant using all items ignoring item category (120 examples). Each SVR was then used to predict preferences over all items for the other seven participants, respectively. To not amplify the already existing differences in brain anatomy across participants, data were not further reduced by RFE for across subject predictions. Instead, all voxels in the individual frontal cortex mask were used.
Support vector regression machine.
We used LIBSVM's (Chang and Lin, 2011) ε support vector regression machine as implemented in the ‘e1071’ library in R. Whenever a SVR was fitted to the data it was first tuned with respect to the cost and ε parameter using tenfold cross-validation. For better interpretation of the feature weights a linear kernel was used.
Results
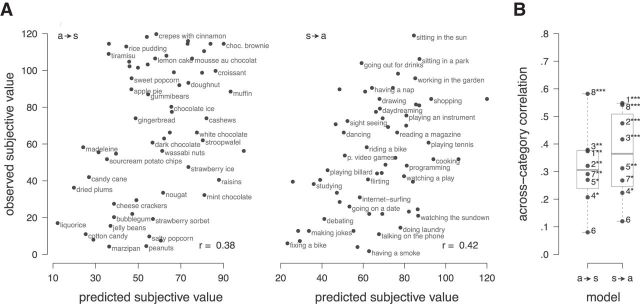
To test whether subjective value of snack foods and activities is represented on a common scale, we assessed whether similarly liked snack foods and activities evoke similar brain patterns. Therefore, after an SVR model was trained on one category of items (e.g., snack food), it was used to estimate the subjective value for items from the other category (e.g., activities). For each subject, we assessed each model's estimation performance in these across-category estimations by correlating the estimated subjective values with the observed subjective values obtained from the binary choices after scanning. Figure 4A illustrates these correlations for an exemplary subject.
Figure 4.
Estimation performance across reward categories. A, Scatterplots of observed against estimated subjective values for one exemplary subject (Subject 3) for snack foods predicted by a model trained on preferences over activities (a → s) and vice versa (s → a), and (B) correlation coefficients between observed and estimated subjective value for all eight subjects. Numbers identify the individual subjects; *p < 0.05, **p < 0.01, ***p < 0.001 based on permutation testing.
Statistical significance was determined individually for each of these correlations based on permutation testing. Fourteen of 16 individual correlations were significantly higher than expected by chance on the 5% significance level. Figure 4B shows the estimation performance of each model for each participant. On average, estimated subjective values of activities, obtained by an SVR model trained on snack food items, correlated with observed subjective values by r = 0.31 (Pearson's correlation, t(7) = 6.1, p < 0.001, one sample t test). Likewise, using the SVR model trained on activities, correlations between estimated and observed subjective values for snack food items reached an average of r = 0.36 (Pearson's correlation, t(7) = 6.6, p < 0.001, one sample t test). These correlations demonstrate that value-related brain patterns are similar across categories.
As mentioned above, each item was presented twice during scanning and BOLD signals were averaged over presentations. We additionally analyzed each presentation set independently to investigate any systematic differences between the first and second presentation. For that we trained a model on BOLD signals recorded during the first presentation of each item from one category (e.g., snack foods) and used it to predict the value based on BOLD signals that were recorded during the first presentations of items from the other category (e.g., activities). We then compared this to the prediction accuracy of models that were trained on the second presentation of each item. Prediction performance was slightly lower when using the second trial (second presentation: mean r = 0.27, first presentation: mean r = 0.33, Pearson's correlation), presumably due to adaptation of the BOLD response or subjects' fatigue. However, in a regression analysis with prediction accuracy (correlations) as the dependent and a dummy variable coding for first versus second presentation and a dummy coding for whether the model was trained on snack foods (predicting activities) or activities (predicting snack foods), the difference between first and second presentation was not significant (coefficient = −0.06, t(29) = −1.01, p = 0.32).
Predicting choices
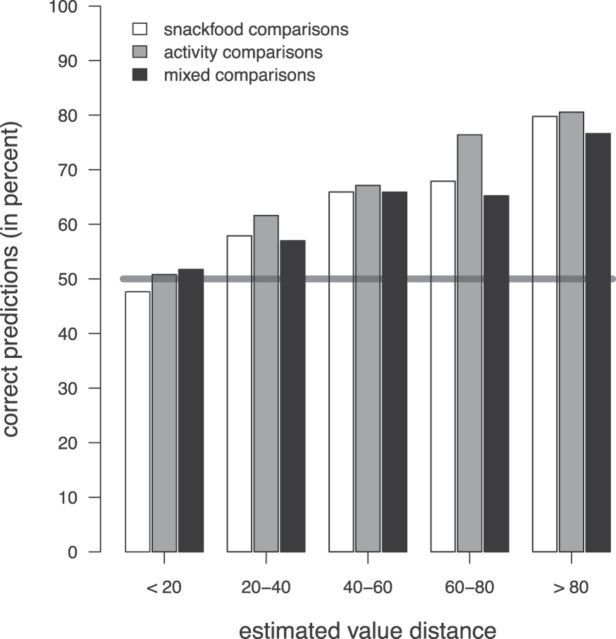
The estimated subjective values should not only carry information about which of two items will be preferred, but also about how strong the preference is. This can be tested by computing how well subjects' actual choices in the binary decision task can be predicted by using the estimated subjective values obtained from the brain data. For this, we simply assume that in a binary choice the item with the higher estimated subjective value will be chosen over the item with the lower value. Because there is noise in the estimations, choices between items with a similar estimated subjective value should be harder to predict correctly than choices between items where the estimated subjective values are very different. As shown in Figure 5, the proportion of correctly predicted binary choices indeed monotonically increased with the distance between the estimated subjective values of these items. The prediction accuracies were as high as 81% when subjects chose between items that were classified as highly disliked and highly liked by the SVR model.
Figure 5.
Correctly predicted binary choices, using the predicted subjective values. Bars show the percentage of correctly predicted binary choices depending on the distance between the estimated subjective values of two items. The horizontal line shows the accuracy expected by chance (50%).
Importantly, to show that the brain indeed encodes value on one common scale, estimated subjective values need not only be correlated with observed subjective values, as this merely indicates that items are ordered correctly. In addition, it is necessary to demonstrate that subjective values are estimated correctly in an absolute sense. To test for this, we assessed the accuracy of predicting binary choices that involved a snack food and an activity item. If estimated subjective values were only ordered correctly, then the prediction performance in these between-category choices would be worse than in choices involving only items from one category. We found that accuracies for binary choices between the two categories were not significantly different from the accuracies within each category (χ2(2) = 0.41, p = 0.82, Pearson χ2 test). Thus, each SVR model did not only order items of a category correctly, as indicated by the significant correlations. Additionally, neither model over- or underestimated the subjective value ranks of the other category systematically, which further supports the hypothesis of a common currency of value.
Pattern and localization of value encoding
The multivariate analysis used in this study identified voxels which carry information about subjective value. In contrast to univariate analysis, it is not restricted to detecting aggregate levels of activity, but can also detect encoding which relies on more complex patterns. To better understand the pattern that encodes abstract subjective value, we analyzed the BOLD signal in the most informative voxels based on our RFE procedure. One possibility is that informative voxels exhibit increased activity with increasing subjective value. We therefore correlated the BOLD signal with observed subjective value. Aggregating across all voxels that survived RFE for each subject, average BOLD response was correlated moderately with subjective value (r = 0.09, Pearson's correlation). On the level of individual voxels, a majority of voxels (60%) showed a positive correlation but activity levels correlated with subjective value only with r = 0.04 (Pearson's correlation) on average. Another coding characteristic could be that an increasing number of voxels is activated as subjective value increases. To test for this possibility, we looked at the number of voxels contributing to coding of higher valued items. We first dichotomized each voxel's activity relative to its median BOLD value, so that each voxel that survived RFE had either value one or zero for each item: 0 if the BOLD signal during presentation of this item was below median signal magnitude of this voxel, and 1 if the BOLD signal was above the median BOLD value. This way, we could count how many voxels showed signals above the median in different observed value ranges. For low valued items (value rank 1–20), an average 48% of voxels showed a BOLD signal above the median. This steadily increased up to 53% for items that were most preferred (value rank 100–120). On average, with each increase of 10 value ranks, nine additional voxels showed BOLD signal above its median (t(48) = 8,7; p < 0.01, random-intercept regression). Thus, with higher subjective value an increasing number of voxels showed above-median BOLD response.
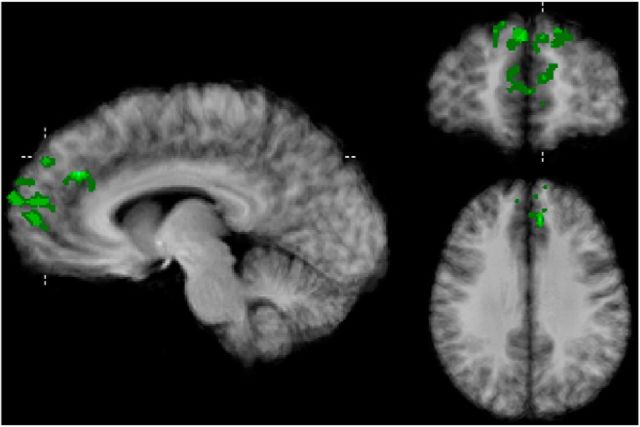
To localize the voxels in the frontal cortex that carry information about subjective value regardless of the reward category, we first identified the most informative voxels in each SVR model. For each participant, voxels were classified as carrying category-independent information if they were informative in both models. In Figure 6 we plot the overlap of these category-independent voxels across participants, revealing clusters in the ACC and the medial prefrontal cortex. The map shows only voxels with minimally 25% overlap (minimally 2 participants) and clusters with at least 162 anatomical (i.e., 6 functional) voxels. The highest overlap was observed in a cluster in the anterior portion of the mPFC with an overlap of 62.5% (5 participants). A list of peak voxel coordinates of all identified clusters can be found in Table 1.
Figure 6.
Voxel-clusters carrying across-category information based on the weights of the support vector regression models (Talairach x, y, z = −7, 51, 39) overlaid onto an anatomical average.
Table 1.
Brain regions carrying value-signals across reward categories
| X | Y | Z | No. participants | No. voxels | |
|---|---|---|---|---|---|
| Right anterior mPFC | 1 | 61 | 0 | 5 | 231 |
| Right dorsal mPFC | 2 | 52 | 36 | 4 | 204 |
| Right mPFC | 5 | 55 | 24 | 3 | 219 |
| ACC 1 | 5 | 29 | 21 | 4 | 162 |
| ACC 2 | −7 | 37 | 31 | 4 | 169 |
| Left dorsal PFC | −7 | 52 | 36 | 3 | 202 |
| Left mPFC 1 | −4 | 55 | 0 | 4 | 214 |
| Left mPFC 2 | −6 | 58 | 18 | 3 | 279 |
| Left anterior PFC | −20 | 61 | 13 | 3 | 195 |
Clusters are listed if they show an overlap for at least two participants and a cluster size of at least 162 anatomical (= 6 functional) voxels. No smoothing was applied to the data. Coordinates correspond to Talairach coordinates of the voxel with the highest overlap across subjects.
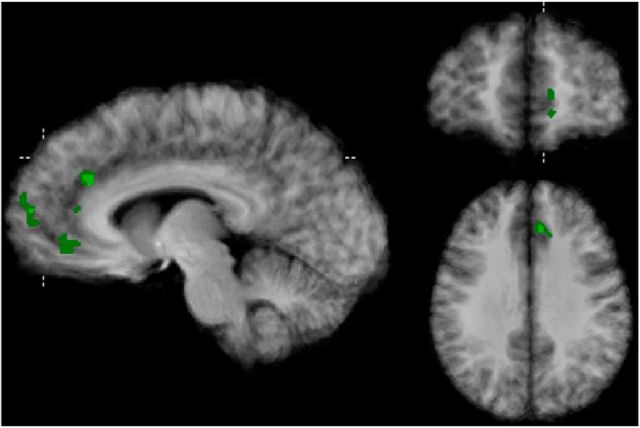
Surprisingly, among the 25% most informative voxels, there was no cluster in the ventral part of the mPFC. This region has been frequently implicated in common value computation in previous fMRI studies that used univariate data analysis (Levy and Glimcher, 2012). We therefore performed an additional univariate analysis by fitting observed subjective value to the hemodynamic response function's estimates in each participant. To maximize comparability with the multivariate results, we used the same probabilistic procedure as described above to aggregate the single subject maps. For each subject, we ranked the absolute model fits (betas) to reduce the number of voxels considered to 25% of subjects' frontal cortex mask, thus obtaining the same number of voxels per subject as resulted from the multivariate recursive feature elimination procedure. Figure 7 shows the overlap of the remaining voxels across subject (minimally 25% overlap; i.e., 2 participants). The obtained pattern is comparable to the multivariate patterns presented in Figure 6, but additionally includes a cluster in the more ventral part of the MPFC. We would like to stress that this result should be interpreted with caution because no significance standards were met by this analysis.
Figure 7.
Voxel-clusters resulting from univariate analysis (Talairach x, y, z = −7, 51, 30) overlaid onto an anatomical average.
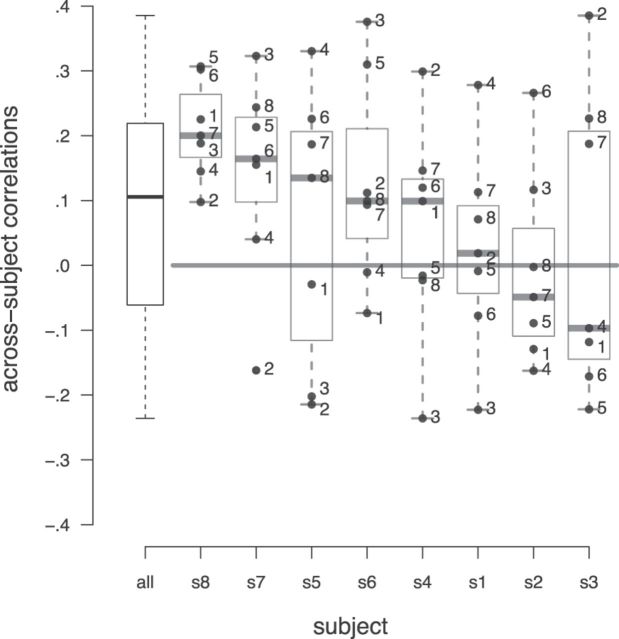
Given the spatial overlap of voxels carrying abstract subjective value across subjects, we hypothesized that value-representation across participants could be sufficiently similar to allow predicting subjective value of one person with a model trained on another person. To test this, we trained one SVR model for each participant, using all 120 items. We then used each participant's model to predict the preferences of the other seven participants, respectively, and correlated these with the observed preferences. Figure 8 summarizes all of the resulting 56 correlation coefficients in a boxplot, and also shows the coefficients by individual subject. Correlations were significantly above zero (t(48) = 3.11, p < 0.01, random-intercept regression), demonstrating that value patterns are to some extent comparable, even across subjects. As can be expected, given the anatomical variability across participants, performance was considerably lower (mean Pearson's correlation r = 0.10) than within individual across-category performance.
Figure 8.
Prediction performance across participants. Each boxplot shows the prediction accuracy for an SVR model trained on one subject, predicting the preferences for all 120 items for the other seven subjects. Boxplot on the far left shows distribution of all 56 correlations obtained in this way. Error bars in boxes show the median prediction performance.
Discussion
We tested whether value signals in the frontal cortex are independent of specific reward characteristics and can therefore be used to infer the subjective value of inherently distinct reward types. A machine learning algorithm, which was trained only in decoding subjective value of snack food items, was capable of predicting the subjective value of engaging activities and vice versa. Hence, knowing the neuronal pattern that is associated with imagining the pleasure of, e.g., eating a donut or potato chips made it possible to reliably infer preferences over, e.g., playing tennis or shopping, and vice versa. This suggests that value signals in mPFC do not only spatially overlap, but also that the distributed pattern is similar across our two categories of reward. This is remarkable, since these categories differ fundamentally with respect to the associated sensory and motivational systems. If subjective value representation was entirely linked to specific properties of a stimulus this should not be possible.
Our activity category comprises items that are normally not traded and hence not priced. Therefore, our finding cannot be explained by cognitive processes that merely reflect learned market prices. Further, in contrast to previous studies on common-scale representation of value (Levy and Glimcher, 2011; McNamee et al., 2013), we refrain from using any type of monetary valuation task. It is thus unlikely that the similarity of value signals we observe across different categories is artificially caused by a task that encourages subjects to evaluate items in a common reference frame, such as monetary value or a Likert scale. Instead our data suggest that a common scale representation of subjective value is an inherent feature of our valuation system, much like the psychological concept of utility, first envisioned by Jeremy Bentham as anticipated pleasure or general satisfaction (Kahneman et al., 1997; Bentham, 2007).
Interestingly, we find that to a certain extent this representation is common even across individual brains, as is evident in the significant across-participant predictions. A machine-learning algorithm trained on brain patterns of one individual, when applied to the brain patterns measured in another participant, predicted subjective preferences above chance level. Although prediction power was considerably lower, knowing the neuronal pattern that is associated with imagining the pleasure of, e.g., eating a donut or playing tennis for Participant A makes it in principle possible to infer subjective preferences over these items for Participant B.
To explore the localization of the abstract value signals that enabled the across-category predictions, we mapped the voxels which were informative in predicting subjective value for both reward categories. Note that we did not restrict this analysis to a small region, but considered voxels from the entire frontal cortex of each individual participant. Given this large mask, it is very encouraging that we observe clusters of informative voxels in the mPFC in line with previous human fMRI studies (Tusche et al., 2010; Levy and Glimcher, 2012; McNamee et al., 2013). Our multivariate analysis, however, did not reveal a cluster of voxels in the most ventral part of the mPFC, where many previous studies reported peak voxels. Instead, our most prominent cluster corresponds well to a region reported to predict consumer choices using a similar multivariate approach as ours (Tusche et al., 2010). This discrepancy could be due to a number of fundamental differences between classical univariate analyses and the analysis presented in this study. Whereas most previous studies used a smoothing kernel, our results were obtained on a single-subject level without any image filtering. The multivariate results depicted in Figure 6 represent the probabilistic overlap instead of a multisubject aggregate. Neighboring voxels that are usually smoothed in common approaches might therefore not survive our set inclusion threshold. Discrepancies between univariate and multivariate analyses could also arise because of distributed patterns in the data that influence the machine learning algorithm when picking the most informative voxels, but leave the univariate procedure unaffected (Haufe et al., 2014).
In addition to the medial prefrontal cortex, we find voxels carrying abstract value signals in the ACC. This is interesting, because value signals in the ACC have been reported in monkey studies using single-cell recordings (Wallis and Kennerley, 2010; Kennerley et al., 2011; Cai and Padoa-Schioppa, 2012), but not typically in human fMRI studies. The fact that we do observe value-signals in the ACC is likely due to the differential sensitivity of multivariate analysis compared with univariate analysis (Wallis, 2011), and suggests that abstract value signals are not limited to the mPFC.
In contrast to previous studies (Levy and Glimcher, 2011; McNamee et al., 2013), our tasks were of entirely hypothetical nature and without any reference to a monetary or another numerical frame. This design allowed us to employ a wide range of fairly abstract stimuli, and minimized the possibility that subjects evaluate items of different categories in terms of an externally imposed reference frame. It might still be argued that the revealed patterns are not generalizable to value computations during real everyday decisions. Previous research has shown, however, that imagined and experienced rewards elicit overlapping patterns (Bray et al., 2010). This suggests that hypothetical evaluation and evaluation during actual choices rely on similar mechanisms.
The possibility remains that subjects used their own reference frame regardless of the instruction to focus on the pleasure they would derive from an item. Such a reference frame could be, for example, the minimum/maximum pleasure they can imagine, and although unlikely for our activities category, it is even conceivable that subjects might spontaneously adopt a monetary evaluation scheme. Our across subjects predictions however provide evidence that even if this is the case, the value signal contributing to our models is abstract enough to generalize over such subject specific strategies. Future research could further clarify this question by refraining from giving any task instructions like imagining pleasure, or even using a distractor task while displaying different items, an approach that has been used for example by Tusche et al. (2010).
To conclude, our results provide strong evidence for the existence of abstract value signals in the mPFC and also the ACC. These value signals are comparable even for fundamentally different and immaterial categories of reward, and in principle, can be used to predict choice.
Footnotes
The authors declare no competing financial interests.
References
- Bentham J. An introduction to the principles of morals and legislation. Mineola, New York: Dover; 2007. [Google Scholar]
- Bray S, Shimojo S, O'Doherty JP. Human medial orbitofrontal cortex is recruited during experience of imagined and real rewards. J Neurophysiol. 2010;103:2506–2512. doi: 10.1152/jn.01030.2009. [DOI] [PubMed] [Google Scholar]
- Cai X, Padoa-Schioppa C. Neuronal encoding of subjective value in dorsal and ventral anterior cingulate cortex. J Neurosci. 2012;32:3791–3808. doi: 10.1523/JNEUROSCI.3864-11.2012. [DOI] [PMC free article] [PubMed] [Google Scholar]
- Chang C, Lin C. LIBSVM: a library for support vector machines. ACM Trans Intell Sys. 2011;2:21–27. [Google Scholar]
- Chib VS, Rangel A, Shimojo S, O'Doherty JP. Evidence for a common representation of decision values for dissimilar goods in human ventromedial prefrontal cortex. J Neurosci. 2009;29:12315–12320. doi: 10.1523/JNEUROSCI.2575-09.2009. [DOI] [PMC free article] [PubMed] [Google Scholar]
- Duan KB, Rajapakse JC, Wang H, Azuaje F. Multiple SVM-RFE for gene selection in cancer classification with expression data. IEEE Trans Nanobiosci. 2005;4:228–234. doi: 10.1109/tnb.2005.853657. [DOI] [PubMed] [Google Scholar]
- Fehr E, Rangel A. Neuroeconomic foundations of economic choice: recent advances. J Econ Perspect. 2011;25:3–30. [Google Scholar]
- FitzGerald TH, Seymour B, Dolan RJ. The role of human orbitofrontal cortex in value comparison for incommensurable objects. J Neurosci. 2009;29:8388–8395. doi: 10.1523/JNEUROSCI.0717-09.2009. [DOI] [PMC free article] [PubMed] [Google Scholar]
- Haufe S, Meinecke F, Görgen K, Dähne S, Haynes JD, Blankertz B, Bießmann F. On the interpretation of weight vectors of linear models in multivariate neuroimaging. Neuroimage. 2014;87:96–110. doi: 10.1016/j.neuroimage.2013.10.067. [DOI] [PubMed] [Google Scholar]
- Kahneman D, Wakker PP, Sarin R. Back to Bentham? Explorations of experienced utility. Q J Econ. 1997;112:375–405. doi: 10.1162/003355397555235. [DOI] [Google Scholar]
- Kennerley SW, Behrens TE, Wallis JD. Double dissociation of value computations in orbitofrontal and anterior cingulate neurons. Nat Neurosci. 2011;14:1581–1589. doi: 10.1038/nn.2961. [DOI] [PMC free article] [PubMed] [Google Scholar]
- Kim H, Shimojo S, O'Doherty JP. Overlapping responses for the expectation of juice and money rewards in human ventromedial prefrontal cortex. Cereb Cortex. 2011;21:769–776. doi: 10.1093/cercor/bhq145. [DOI] [PubMed] [Google Scholar]
- Kriegeskorte N, Simmons WK, Bellgowan PS, Baker CI. Circular analysis in systems neuroscience: the dangers of double dipping. Nat Neurosci. 2009;12:535–540. doi: 10.1038/nn.2303. [DOI] [PMC free article] [PubMed] [Google Scholar]
- Lebreton M, Jorge S, Michel V, Thirion B, Pessiglione M. An automatic valuation system in the human brain: evidence from functional neuroimaging. Neuron. 2009;64:431–439. doi: 10.1016/j.neuron.2009.09.040. [DOI] [PubMed] [Google Scholar]
- Levy DJ, Glimcher PW. Comparing apples and oranges: using reward-specific and reward-general subjective value representation in the brain. J Neurosci. 2011;31:14693–14707. doi: 10.1523/JNEUROSCI.2218-11.2011. [DOI] [PMC free article] [PubMed] [Google Scholar]
- Levy DJ, Glimcher PW. The root of all value: a neural common currency for choice. Curr Opin Neurobiol. 2012;22:1027–1038. doi: 10.1016/j.conb.2012.06.001. [DOI] [PMC free article] [PubMed] [Google Scholar]
- Lin A, Adolphs R, Rangel A. Social and monetary reward learning engage overlapping neural substrates. Soc Cogn Affect Neurosci. 2012;7:274–281. doi: 10.1093/scan/nsr006. [DOI] [PMC free article] [PubMed] [Google Scholar]
- McNamee D, Rangel A, O'Doherty JP. Category-dependent and category-independent goal-value codes in human ventromedial prefrontal cortex. Nat Neurosci. 2013;16:479–485. doi: 10.1038/nn.3337. [DOI] [PMC free article] [PubMed] [Google Scholar]
- Montague PR, Berns GS. Neural economics and the biological substrates of valuation. Neuron. 2002;36:265–284. doi: 10.1016/S0896-6273(02)00974-1. [DOI] [PubMed] [Google Scholar]
- R Development Core Team. R: a language and environment for statistical computing. Vienna: R Foundation for Statistical Computing; 2008. [Google Scholar]
- Smith DV, Hayden BY, Truong TK, Song AW, Platt ML, Huettel SA. Distinct value signals in anterior and posterior ventromedial prefrontal cortex. J Neurosci. 2010;30:2490–2495. doi: 10.1523/JNEUROSCI.3319-09.2010. [DOI] [PMC free article] [PubMed] [Google Scholar]
- Talairach J, Tournoux P. Co-planar stereotaxic atlas of the human brain. New York: Thieme Medical; 1988. [Google Scholar]
- Tusche A, Bode S, Haynes JD. Neural responses to unattended products predict later consumer choices. J Neurosci. 2010;30:8024–8031. doi: 10.1523/JNEUROSCI.0064-10.2010. [DOI] [PMC free article] [PubMed] [Google Scholar]
- Vul E, Harris C, Winkielman P, Pashler H. Puzzlingly high correlations in fMRI studies of emotion, personality, and social cognition. Perspect Psychol Sci. 2009;4:274–290. doi: 10.1111/j.1745-6924.2009.01125.x. [DOI] [PubMed] [Google Scholar]
- Wallis JD. Cross-species studies of orbitofrontal cortex and value-based decision-making. Nat Neurosci. 2011;15:13–19. doi: 10.1038/nn.2956. [DOI] [PMC free article] [PubMed] [Google Scholar]
- Wallis JD, Kennerley SW. Heterogeneous reward signals in prefrontal cortex. Curr Opin Neurobiol. 2010;20:191–198. doi: 10.1016/j.conb.2010.02.009. [DOI] [PMC free article] [PubMed] [Google Scholar]


