Abstract
Optogenetic techniques provide powerful tools for bidirectional control of neuronal activity and investigating alterations occurring in excitability disorders, such as epilepsy. In particular, the possibility to specifically activate by light-determined interneuron populations expressing channelrhodopsin-2 provides an unprecedented opportunity of exploring their contribution to physiological and pathological network activity. There are several subclasses of interneurons in cortical areas with different functional connectivity to the principal neurons (e.g., targeting their perisomatic or dendritic compartments). Therefore, one could optogenetically activate specific or a mixed population of interneurons and dissect their selective or concerted inhibitory action on principal cells. We chose to explore a conceptually novel strategy involving simultaneous activation of mixed populations of interneurons by optogenetics and study their impact on ongoing epileptiform activity in mouse acute hippocampal slices. Here we demonstrate that such approach results in a brief initial action potential discharge in CA3 pyramidal neurons, followed by prolonged suppression of ongoing epileptiform activity during light exposure. Such sequence of events was caused by massive light-induced release of GABA from ChR2-expressing interneurons. The inhibition of epileptiform activity was less pronounced if only parvalbumin- or somatostatin-expressing interneurons were activated by light. Our data suggest that global optogenetic activation of mixed interneuron populations is a more effective approach for development of novel therapeutic strategies for epilepsy, but the initial action potential generation in principal neurons needs to be taken in consideration.
Keywords: optogenetics, channelrhodopsin-2, epileptiform activity, hippocampus, interneurons
Introduction
In recent years, optogenetic techniques have gained considerable attention, as they provide researchers with powerful tools to bidirectionally control neuronal activity (Boyden et al., 2005; Gradinaru et al., 2010). Such techniques are particularly attractive for studying complex network interactions, but also as potential therapeutic alternatives for excitability disorders, such as epilepsy. Epilepsy comprises a family of disorders with different phenotypes, etiologies, and prognoses, but a common underlying pathology is a network reorganization leading to the generation of spontaneous recurrent seizures (Avoli, 1983; Mody et al., 1992). For this reason, optogenetic strategies could prove extremely powerful, as they can selectively modulate excitatory or inhibitory neuronal populations to counterbalance pathogenic reorganizations of circuits in epilepsy.
We have previously used optogenetics to control epileptiform activity and showed, for the first time, that light-induced inhibition of pyramidal neurons expressing halorhodopsin was effective in attenuating stimulation train-induced bursting in hippocampal slice cultures (Tønnesen et al., 2009). Another optogenetic strategy for inhibiting epileptiform activity or seizures is enhancing the release of GABA from inhibitory interneurons by their optogenetic activation with channelrhodopsin-2 (ChR2) (Kokaia et al., 2013). However, in the cortical and hippocampal areas, there are several subclasses of interneurons that differ in their functional connectivity to the principal cells (Freund and Buzsáki, 1996; Klausberger and Somogyi, 2008). Some interneurons, such as somatostatin (SST)-expressing cells, target dendritic domains, whereas others (e.g., parvalbumin [PV]-expressing), target perisomatic compartments (Freund and Buzsáki, 1996), with different functional outcome for action potential generation in principal cells (Miles et al., 1996; Lovett-Barron et al., 2012). Therefore, one possible strategy is to optogenetically target a certain specific interneuron population. Such approach with PV-expressing interneurons has been proven useful for seizure control (Krook-Magnuson et al., 2013). However, it may impose certain limitations because of targeting mostly the perisomatic compartment of principal cells, whereas the dendritic compartment, which has been shown to have a significant, even stronger inhibitory effect on action potential generation (Lovett-Barron et al., 2012), remains unaffected. Moreover, it is not clear to which extent this approach would influence synchronization of rhythmic epileptic activity, which is heavily supported by PV interneurons (fast-spiking basket cells) (Freund and Katona, 2007). Therefore, we explored a novel optogenetic strategy of combined activation of large populations of inhibitory interneurons, affecting both somatic and dendritic compartments of principal cells, and studied their impact on epileptiform activity in the hippocampus. We demonstrate that light illumination of ChR2-expressing Gad2 interneurons, comprising various hippocampal interneuron populations, significantly suppresses epileptiform activity and that the magnitude of the effect depends on the amount of GABA released by the light. Selective optogenetic stimulation of the smaller PV- or SST-expressing interneuron populations was less effective. Together, these data suggest that orchestrated and temporally coordinated action of large interneuron populations readily suppresses hypersynchronized epileptiform activity in the hippocampus by increasing the release of GABA on various compartments of principal cells, thus more effectively inhibiting them and thereby representing a superior strategy, including optogenetic, for controlling seizures.
Materials and Methods
Animals.
Male and female, Gad2-Cre (#010802, The Jackson Laboratory), PV-Cre (#008069), SST-Cre (#013044), and Ai14 (Madisen et al., 2010) (#007914) mice were used, 8–10 weeks old at the beginning of the experiments. Homozygous transgenic mice were bred with wild-type C57BL/6J mice, and the heterozygous offspring was used for viral vector injections. For characterization of interneuron populations present in Gad2-Cre and PV-Cre mice, homozygous Gad2-Cre or PV-Cre males were bred with homozygous Ai14 females, and the resulting Gad2-Cre::Ai14 and PV-Cre::Ai14 offspring, heterozygous for both transgenes, was used for experiments. All experiments were conducted according to international guidelines on the use of experimental animals, as well as the Swedish Animal Welfare Agency guidelines, and were approved by the local Ethical Committee for Experimental Animals.
Virus injections.
The viral vector rAAV-EF1a-DIO-ChR2(H134R)-mCherry was either produced as previously described (Ledri et al., 2012) or purchased from the University of North Carolina Vector Core facility. pAAV-EF1a-DIO-ChR2(H134R)-mCherry plasmid was a gift from Karl Deisseroth (Addgene plasmid #20297). Virus titer was determined via quantitative PCR and was 1.4 × 10¹³ genomic particles/ml for produced virus and 4 × 10¹² for purchased virus.
For virus injections, 6- to 8-week-old animals were anesthetized by inhalation of isoflurane (Baxter Chemicals, 4% for induction, 1–1.5% for maintenance) and fixed on a stereotaxic frame. An incision was performed on the skin to expose the skull, and burr holes were drilled at the following stereotaxic coordinates: anteroposterior −3.2 and mediolateral ±3.1 from bregma. Undiluted viral vector suspension was injected bilaterally through a glass capillary fitted on a 5 μl Hamilton syringe (Hamilton) at two sites in the ventral and medial hippocampus, at dorsoventral −3.6 and −3.0 from dura; 0.5 μl of viral vector suspension was injected at each site during 5 min, at a speed of 0.1 μl per minute. The capillary was left in place for 10 additional minutes after the second injection to avoid backflow of viral particles through the injection tract.
Slice preparation and maintenance.
Three to 5 weeks after virus injection, animals were briefly anesthetized with isoflurane and decapitated. The head was quickly immersed in ice-cold sucrose-based cutting solution, constantly oxygenated with carbogen (95% O2 and 5% CO2), and containing the following (in mm): sucrose 75, NaCl 67, NaHCO3 26, glucose 25, KCl 2.5, NaH2PO4 1.25, CaCl2 0.5, and MgCl2 7 (pH 7.4, osmolarity 305–310 mOsm). The brain was rapidly removed, the cerebellum discarded, and the hemispheres divided with a scalpel. Horizontal slices (400 μm thickness) containing the hippocampus and entorhinal cortex were cut on a vibratome (VT1200S, Leica Microsystems) in cutting solution maintained at 3°C-4°C. Individual slices were transferred to a first incubation chamber containing cutting solution, constantly oxygenated with carbogen, and maintained at 34°C in a water bath for 15–20 min. After the first incubation, slices were transferred to an interface-like incubation chamber, consisting of a nylon mesh placed on top of a beaker filled with artificial cerebrospinal fluid (aCSF), containing the following (in mm): NaCl 119, NaHCO3 26, glucose 11, KCl 2.5, NaH2PO4 1.25, CaCl2 2, and MgSO4 1.3 (pH 7.4, osmolarity 295–305 mOsm). The beaker was placed inside a Plexiglas container, half-filled with aCSF, and constantly oxygenated with carbogen. The second incubation was performed at room temperature for at least1 h.
Electrophysiology.
Individual slices resting on lens paper were transferred with the help of forceps to a dual-superfusion recording chamber (Supertech). Slices were perfused with oxygenated normal aCSF or Mg2+-deprived aCSF containing 50 μm 4-aminopyridine (4-AP, for induction of epileptiform activity), by two independent channels directing the solution flow separately above and below the slice surface, at a speed of 2.5 ml/min/channel (Hájos et al., 2009). The temperature in the recording chamber was maintained at 31°C-33°C by heating the incoming solution through a dual-channel inline solution heater (Supertech).
Recording pipettes were pulled from borosilicate glass with a Flaming-Brown horizontal puller (P-97, Sutter Instruments). For field recordings, pipettes were filled with aCSF and placed in the pyramidal layer of area CA3, and typically had tip resistance values of 1–3 mΩ. For whole-cell patch-clamp recordings, pipettes were filled with intracellular solution containing the following (in mm): K-gluconate 122.5, KCl 12.5, KOH-HEPES 10, KOH-EGTA 0.2, MgATP 2, Na3GTP 0.3, NaCl 8 (pH 7.2–7.4, 300–310 mOsm), for recordings of light-induced action potentials (APs) from interneurons (3–5 mΩ tip resistance). For recordings of light-induced synaptic currents in CA3 pyramidal cells, pipettes were filled with KCl 110, K-gluconate 35, KOH-HEPES 10, KOH-EGTA 0.2, MgATP 4, Na3GTP 0.3, QX-314 5 (pH 7.2–7.4, 300–310 mOsm) (2–5 mΩ tip resistance). Biocytin (2–5 mg/ml) was routinely added to the intracellular solution on the day of the recording. Cell-attached recordings were performed with pipettes filled with aCSF (3–5 mΩ tip resistance) in tight-seal voltage-clamp configuration at 0 pA holding current. At the end of the recording, the pipette was carefully removed and the same cell was repatched with a second pipette containing K-gluconate-based intracellular solution and biocytin. Target cells were visualized under fluorescent light where necessary, and infrared differential interference contrast microscopy was used for visual approach of the recording pipettes. Uncompensated series resistance (typically 8–30 mΩ) was constantly monitored via 5 mV voltage steps, and recordings were discontinued after changes of >20% or whether the resting membrane potential decreased below −50 mV. In whole-cell experiments, cells were held at −70 mV in voltage-clamp and at 0 pA in current-clamp recordings. Firing pattern of interneurons was investigated by applying a single 1 s, 500 pA depolarizing current step through the patch pipette.
Blue light was generated by an LED (UHP-Microscope-LED 460 nm, Prizmatix) and applied through the microscope objective lenses. The light source was controlled by TTL pulses from a stimulator (Master-8, A.M.P.I.).
Data were sampled at 10 kHz with an EPC-10 amplifier (HEKA Elektronik) and stored on a G4 Macintosh computer using PatchMaster software (HEKA) for offline analysis.
At the end of the recordings, slices were fixed in 4% PFA in phosphate buffer (PB, pH 7.2–7.4) overnight, and then stored in antifreeze solution (ethyleneglycol and glycerol in PB) at −20°C until processed.
Immunohistochemistry and cell counting.
The Gad2-Cre::Ai14 and PV-Cre::Ai14 mice received an overdose of pentobarbital (250 mg/kg intraperitoneal) and were perfused transcardially with 50 ml of ice-cold saline (0.9% NaCl) and 50 ml of ice-cold 4% PFA in PB (pH 7.2–7.4). Brains were removed and postfixed in 4% PFA in PB overnight, dehydrated/cryoprotected with 20% sucrose in PB for 1 d, and then sectioned in 30 μm slices with a freezing microtome. A subset of animals that received viral vector injections 4 weeks earlier (4 PV-Cre and 3 Gad2-Cre mice) was treated similarly.
For immunostainings, slices were first incubated in blocking solution consisting of potassium PBS (K-PBS) containing 5% sera and 0.25% Triton X-100 (T-K-PBS), for 1 h at room temperature, and then incubated overnight in a mixture of rabbit to PV (1:5000, Swant), rabbit to neuropeptide Y (NPY, 1:5000, Sigma-Aldrich), rat to SST (clone YC7, 1:100, Millipore), and rabbit to DsRed (1:1000, Clontech) or rat to Red Fluorescent Protein (RFP, 5F8, 1:1000, ChromoTek) antibodies. After incubation in primary antibody, slices were rinsed and incubated in the appropriate mixture of FITC-conjugated goat to rabbit or FITC-conjugated donkey to rat, and Cy3-conjugated donkey to rabbit or Cy3-conjugated donkey to rat secondary antibodies (all 1:400, Jackson ImmunoResearch Laboratories) for 2 h at room temperature.
For staining against cholecystokinin (CCK), slices were incubated for 20 min in sodium citrate buffer, pH 6.0, at 90°C. The primary antibodies used were rabbit to CCK (1:2000, Sigma-Aldrich) and rat to RFP. Secondary antibodies were Cy3-conjugated donkey to rat (1:400) and biotinylated goat to rabbit (1:400, Vector Laboratories), followed by Alexa-488-conjugated streptavidin (1:200, Invitrogen).
After incubation in the secondary antibodies, slices were thoroughly rinsed in K-PBS and mounted on glass slides. PVA-DABCO was used as mounting medium.
Slices from electrophysiological recordings were processed similarly as described above. After thorough rinsing in K-PBS, slices were first incubated in 5% donkey serum in T-K-PBS for1 h, followed by incubation in rat to RFP primary antibody overnight, and then in Cy3-conjugated donkey to rat and Alexa-488-conjugated streptavidin to visualize biocytin-filled cells.
Cell counting was performed on a conventional epifluorescence microscope equipped with a 40× objective (Olympus BX61). The number of FITC- or Alexa-488-, as well as Cy3- and double-positive cells was counted in all layers of the CA3 area of the hippocampus, including stata oriens, pyramidale, lucidum, radiatum, and lacunosum moleculare. Data come from cell counting of at least 6 nonadjacent slices per animal, from at least two animals.
Images were obtained on an Eclipse Ti confocal laser-scanning microscope (Nikon). For morphological reconstruction of biocytin-filled cells, confocal z-stacks were obtained along the entire dentritic and axonal tree of the cell.
Data analysis and statistics.
Only cells showing colocalization of mCherry and biocytin (in recordings from ChR2-positive interneurons), or resembling CA3 pyramidal cell morphology were included in the analysis. AP properties (threshold, amplitude, and half-width) from Gad2 and PV interneurons were analyzed from the first AP of the 20 Hz train induced by light illumination. Traces were analyzed using FitMaster software (HEKA). AP threshold was defined as the point where the fastest rising phase of the AP started, AP amplitude was defined as the difference between threshold and peak in mV, and half-width was defined as the width of the AP at half amplitude, in milliseconds.
For evaluating the effect of blue light illumination on epileptiform activity, the frequency of epileptiform bursts was analyzed in 5 or 10 s periods, immediately before (baseline), during, and immediately after light application, as well as 20–25 or 40–50 s after light cessation. Frequency values were normalized to baseline measurements. The latency of epileptiform bursts (interburst interval) was analyzed between the last and second to last events right before light application, between the start of light application and the first spontaneous event, between the first two events appearing within 5 or 10 s after light termination and the last two events appearing during the period of 20–25 or 40–50 s after the end of illumination.
The decay time of light-induced currents in CA3 pyramidal neurons was analyzed by fitting a single exponential curve to the decay of the currents using Igor Pro 6 software (Wavemetrics).
Statistical analysis was performed using Kruskal–Wallis test or Friedman test followed by Dunn's multiple-comparison test, one-way ANOVA or repeated-measures ANOVA followed by Bonferroni's multiple-comparison test, Wilcoxon matched-pairs signed-ranks test, Mann–Whitney U test, paired t test, unpaired t test, and unpaired t test with Welch's correction in Prism 5 software (GraphPad), where appropriate. Normal distribution for applying parametric tests was tested with Kolmogorov–Smirnov and D'Agostino and Pearson omnibus normality test. Significance level was set to p < 0.05. Data are presented as mean ± SEM.
Results
Targeting different populations of GABAergic interneurons
To activate large populations of inhibitory interneurons by optogenetics, we used a transgenic mouse line expressing Cre in several subpopulations of interneurons (Gad2-Cre). Cross-breeding with Ai14 reporter mice (Madisen et al., 2010) (labeling with tdTomato) enabled identification of Cre-positive cells in Gad2-Cre mice. The number of cells that were positive for PV, CCK, NPY, and SST (Fig. 1N) and tdTomato showed high fidelity of interneuron labeling: 87.73 ± 1.30% of PV cells, 95.24 ± 1.27% of CCK cells, 94.64 ± 1.67% of NPY cells, and 94.53 ± 1.17% of SST cells were also positive for tdTomato. Double immunohistochemical stainings allowed also for estimation of the percentage of various interneuron populations (respective marker and tdTomato) relative to the total number of tdTomato (i.e., Gad2)-positive cells (Fig. 1M). PV cells (Fig. 1A–C) comprised 15.94 ± 0.91% of the total tdTomato-positive cells, CCK cells (Fig. 1D–F) were 6.13 ± 0.35%, NPY cells (Fig. 1G–I) 11.35 ± 0.87%, and SST cells (Fig. 1J–L) 16.24 ± 0.56%. The quantification only accounted for ∼50% of all tdTomato cells, indicating that most likely there are other subpopulations of interneurons that express Cre, and thereby would express ChR2 (e.g., interneurons expressing vasointestinal peptide, calretinin, calbindin). Together, these data show that Cre expression in Gad2-Cre mice encompasses mixed subpopulations of inhibitory interneurons in the CA3 area of the hippocampus, including those that innervate perisomatic and/or dendritic compartments of the principal cells (Fig. 1O). Therefore, blue light exposure would trigger AP generation in all these several subpopulations of interneurons at the same time.
Figure 1.
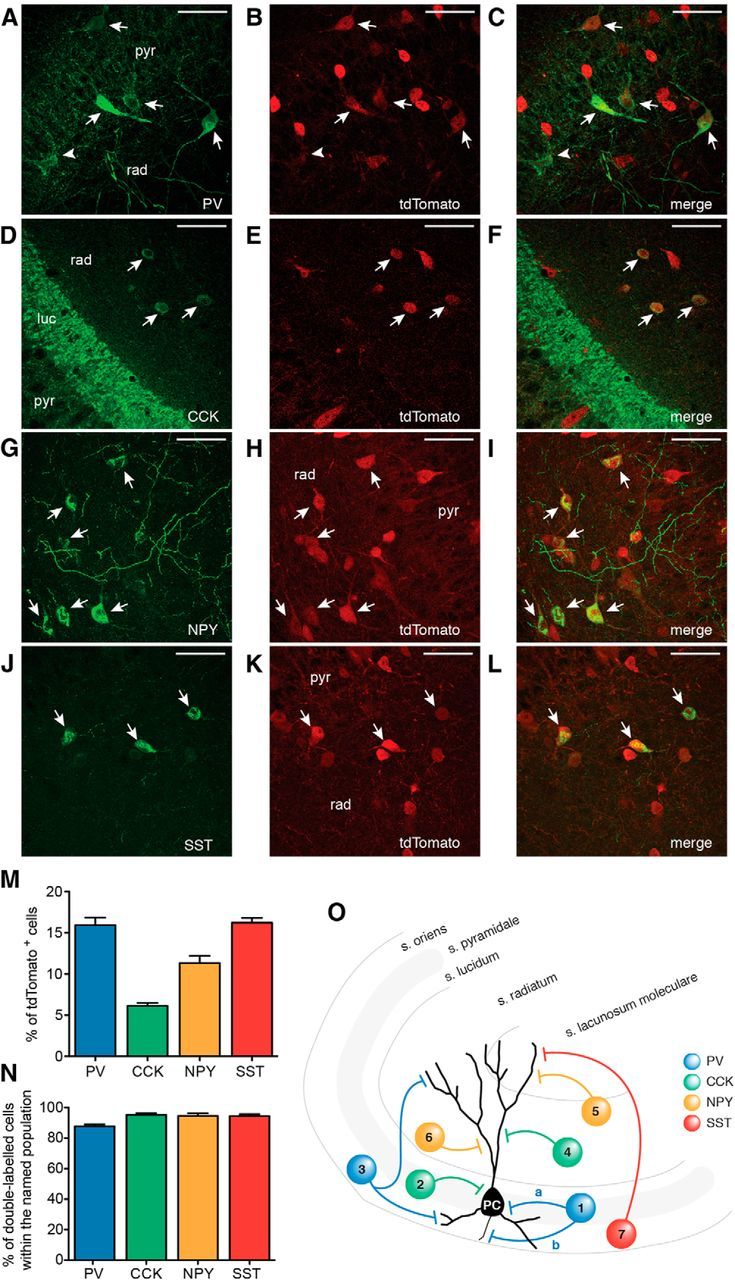
Gad2 interneurons encompass several subpopulations of inhibitory cells. A–L, Confocal stacks of slices from Gad-Cre::Ai14 mice immunostained against tdTomato (A, D, G, J) and PV (B), CCK (E), NPY (H), and SST (K). Merged images are shown in C, F, I, and L, respectively. Arrows indicate cells double-labeled for respective markers and tdTomato. A, B, Arrowhead indicates a cell positive for PV but negative for tdTomato. Scale bars, 50 μm. pyr, Stratum pyramidale; rad, stratum radiatum; luc, stratum lucidum. M, Bar graph showing the percentage of cells positive for the respective marker out of the total number of tdTomato cells in the CA3 area of the hippocampus. N, Bar graph showing the percentage of double-labeled cells (respective marker and tdTomato) within the total number of PV, CCK, NPY, and SST cells. M, N, Data were obtained from total of 15 slices from 2 animals for each marker (total number of tdTomato-positive cells, n = 10,473). O, Schematic illustration indicating the locations and subcellular targets of inhibitory interneurons expressing the markers used. 1a and 2, basket cells; 1b, axo-axonic or chandelier cell; 3, bistratified cell; 4, Schaffer-collateral associated cell; 5, neurogliaform cell; 6, ivy cell; 7, oriens-lacunosum moleculare cell. Blue represents PV; green, CCK; yellow, NPY; red, SST. Values represent mean ± SEM.
Blue light activates ChR2-expressing Gad2 interneurons
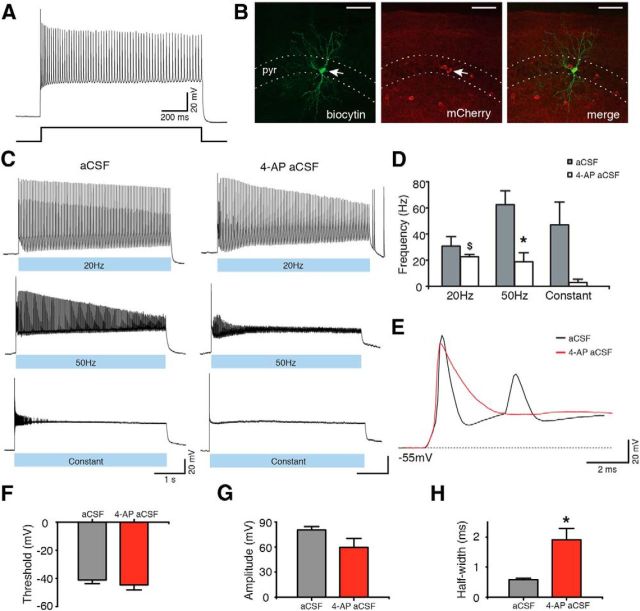
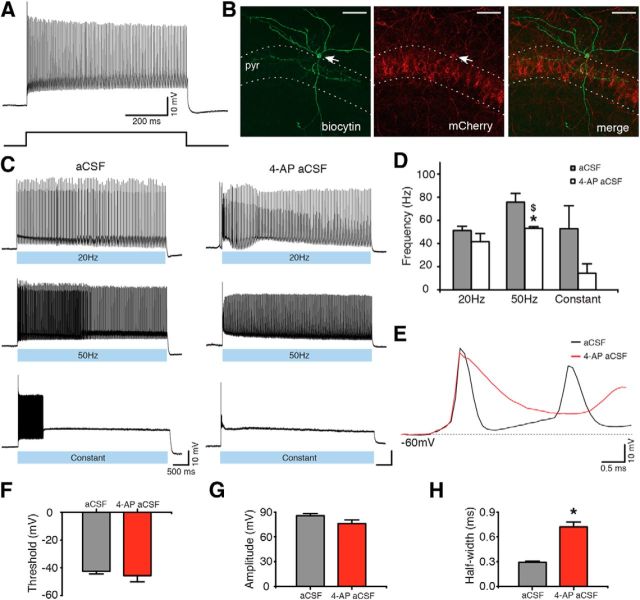
To specifically activate the populations of inhibitory interneurons in Gad2-Cre mice described above, we took advantage of an optogenetic strategy. The Cre-dependent AAV-EF1a-DIO-ChR2(H134R)-mCherry vector was injected into the hippocampus of Gad2-Cre mice, leading to selective expression of ChR2 in hippocampal Gad2 interneurons. ChR2 is a blue light-activated cation-selective channel, able to depolarize neurons and induce APs upon exposure to blue light (Boyden et al., 2005). Such an approach has been successfully used previously for targeting other interneuron populations (Cardin et al., 2009; Sohal et al., 2009). We then confirmed, using whole-cell patch-clamp recordings, that blue light illumination of brain slices depolarized ChR2-expressing interneurons and generated APs (Fig. 2C). To maximize interneuron activation, three blue light illumination paradigms were tested, consisting of 1–2 ms blue light pulses at 20 or 50 Hz for 5 s, or constant blue light illumination for 5 s. All paradigms induced APs (Fig. 2C). We also tested that these paradigms were effective in aCSF with zero-Mg2+ and 4-AP because this perfusion solution was used to induce epileptiform activity in the slices (Avoli et al., 2002; Kilb et al., 2006) (Fig. 2C; 4-AP aCSF). Although light induced similar activation of interneurons, the frequency of APs induced by 50 Hz light pulses was significantly higher in aCSF compared with 4-AP aCSF (62.52 ± 10.71 Hz in aCSF, and 18.89 ± 6.87 Hz in 4-AP aCSF, p = 0.031; Fig. 2D). This was most likely the result of longer AP duration caused by a partial blockade of potassium channels with 4-AP (Storm, 1987). Indeed, AP half-width was significantly longer in aCSF-containing 4-AP compared with normal aCSF (Fig. 2E,H; p = 0.012), but other AP parameters were unchanged (Fig. 2F,G; p > 0.05). We also found that Gad2 interneurons generated APs at higher frequency during 20 Hz light illumination than during constant light, in 4-AP-containing aCSF (p = 0.012; Fig. 2D).
Figure 2.
ChR2-expressing Gad2 interneurons generate APs upon blue light illumination. A, Whole-cell current-clamp recording (top) of a Gad2 interneuron generating a train of APs upon sustained 500 pA current injection (bottom). B, Confocal stack image showing biocytin (left) and mCherry (middle) staining of the Gad2 interneuron shown in A. Merged image is shown on the right. Scale bars, 50 μm. pyr, Stratum pyramidale. C, Same cell as in A generating APs during 20 Hz, 50 Hz, or constant blue light illumination for 5 s, in aCSF (left) and in 4-AP aCSF (right). D, Bar chart of average data from experiments shown in C (n = 5 cells for aCSF and n = 6 cells for 4-AP aCSF). *Statistical significance between the firing frequency in aCSF and 4-AP aCSF: Wilcoxon matched-pairs signed-ranks test (p = 0.031). $Significant difference between the firing frequency during 20 Hz and constant light illumination in 4-AP aCSF: Kruskal–Wallis test (p = 0.012), Dunn's multiple-comparison test (p < 0.05). E, First APs induced by 20 Hz blue light illumination in aCSF (black) and in 4-AP aCSF (red). F–H, Average parameters of the first APs induced by 20 Hz blue light illumination in the presence of aCSF (gray bar, n = 6 cells) or 4-AP aCSF (red bar, n = 6 cells). *Statistical significance between the two experimental conditions: paired t test. F, AP threshold (p = 0.216). G, AP amplitude (p = 0.110). H, AP half-width (p = 0.012). Values represent mean ± SEM.
These results clearly demonstrate that all three blue light illumination paradigms depolarize ChR2-transduced Gad2 interneurons and lead to generation of APs.
Activation of Gad2 interneurons inhibits epileptiform activity
Once we established that blue light illumination was able to induce APs in various ChR2 expressing inhibitory interneurons, we tested whether synchronous activation of these interneurons and the consecutive release of GABA could inhibit epileptiform activity.
To induce epileptiform activity, we used a modified version of a well-established in vitro model of zero-Mg2+ aCSF containing 50 μm 4-AP. Epileptiform activity in the CA3 region of hippocampal slices started within 15 min after perfusion with 4-AP containing aCSF. It consisted of regular epileptiform bursts with a frequency of 0.2–1.6 Hz and typically remained stable for >1 h.
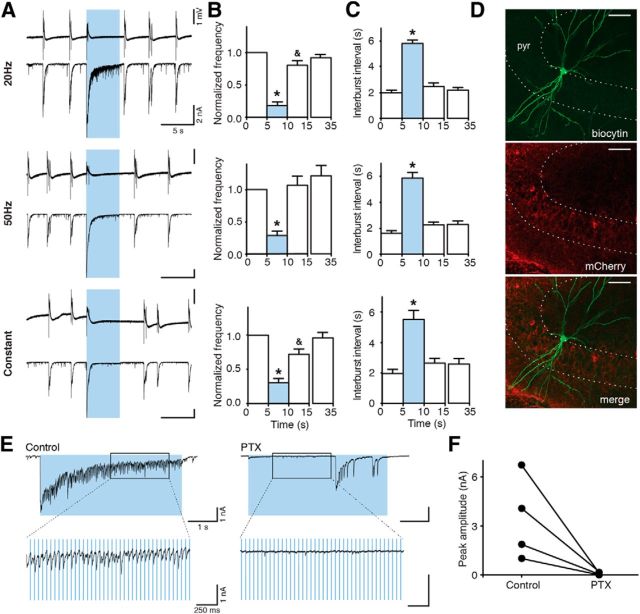
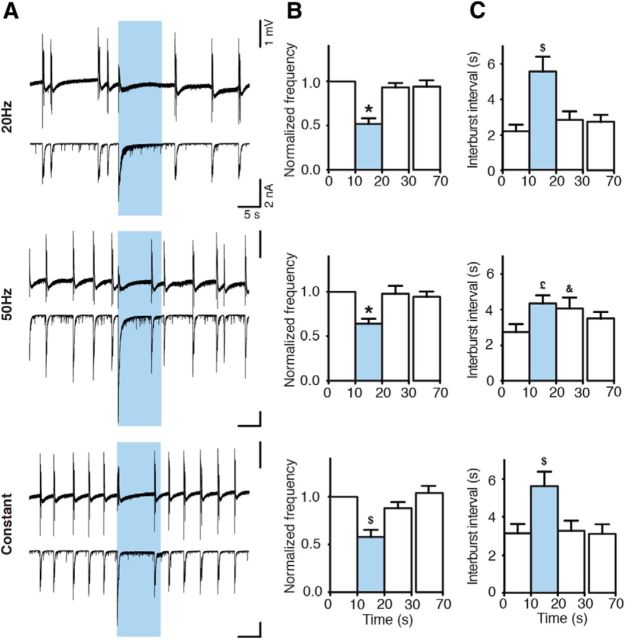
Illumination of slices with blue light pulses at 20 or 50 Hz lasting 5 s, or with constant light for 5 s, substantially reduced the frequency of epileptiform bursts (to 18.17 ± 5.36% for 20 Hz, to 28.82 ± 6.88% for 50 Hz, and to 30.51 ± 6.13% for constant light, of the prelight baseline period, designated as 100%, p < 0.05; Fig. 3B), and increased the time between bursts (5.81 ± 0.28 s for 20 Hz, 5.87 ± 0.42 s for 50 Hz, and 5.51 ± 0.60 s for constant light, p < 0.01; Fig. 3C). Inhibition of bursting seen in field recordings was a reflection of inhibited bursting activity in CA3 pyramidal neurons as revealed by whole-cell patch-clamp recordings (Fig. 3A, bottom). Similar effects were observed at stimulation frequencies of 10, 40, and 100 Hz for 5 s (bursting inhibition to 14.25 ± 6.82% for 10 Hz, to 21.25 ± 9.20% for 40 Hz, and to 21.33 ± 6.13% for 100 Hz; interburst interval: 5.74 ± 0.36 s for 10 Hz, 5.62 ± 0.33 s for 40 Hz, and 4.42 ± 0.34 s for 100 Hz; data not shown). Thus, the effect of light illumination was not dependent on the stimulation paradigm used (p = 0.113 for normalized frequency, p = 0.089 for interburst interval, Kruskal–Wallis test). Increased duration of light illumination up to 10 s also significantly reduced the frequency of epileptiform bursts (to 51.76 ± 6.47% for 20 Hz, to 63.97 ± 5.67% for 50 Hz, and to 57.80 ± 7.44 for constant light, p < 0.01; Fig. 4B). However, this reduction was less pronounced compared with 5 s light periods (20 Hz and 50 Hz, Kruskal–Wallis test, p < 0.0001, followed by Dunn's multiple-comparison test, p < 0.05). This was most likely because epileptiform bursts reappeared approximately at the same time after switching on the light for both 5 and 10 s. Therefore, the interburst interval between 5 and 10 s duration of light was not different (10 s illumination: 5.56 ± 0.85 s for 20 Hz, 4.34 ± 0.46 s for 50 Hz, and 5.62 ± 0.77 s for constant, p = 0.151, Kruskal–Wallis test). This indicates that >5 s activation of Gad2 interneurons is not able to further delay the generation of epileptiform bursts in this model.
Figure 3.
Activation of Gad2 interneurons by blue light illumination inhibits epileptiform activity. A, Representative traces of field recordings from the CA3 region (top) and simultaneous whole-cell recordings from CA3 pyramidal neurons (bottom) showing the effect of different blue light illumination paradigms on epileptiform activity induced by 4-AP aCSF. Blue shading represents the period of light illumination. B, C, Bar chart of average data from respective experiments (n = 51 illuminations in 20 slices for 20 Hz; n = 50 illuminations in 21 slices for 50 Hz; n = 37 illuminations in 19 slices for constant light), indicating the effect of light illumination on frequency and interburst interval. Blue bars represent the 5 s period of blue light illumination. *Statistical significance between the effect of a single pulse (1 ms) of blue light and all other illumination paradigms. &Statistical significance between the periods before (0–5 s) and immediately after (10–15 s) light. Friedman test (p < 0.0001), Dunn's multiple-comparison test (p < 0.05). Values represent mean ± SEM. D, Confocal image showing biocytin (top) and mCherry (middle) staining of a CA3 pyramidal neuron. Merged image is shown on the bottom. Scale bars, 50 μm. pyr, Stratum pyramidale. E, Synaptic currents evoked by light illumination in CA3 pyramidal cells before (control) and after PTX application. Boxes represent regions of traces that are stretched on bottom. F, Chart summarizing total of 4 experiments as shown in E. Lines represent individual experiments (n = 4).
Figure 4.
Activation of Gad2 interneurons for 10 s suppresses epileptiform activity. A, Field recordings from the CA3 region (top traces) and simultaneous whole-cell patch-clamp recordings from CA3 pyramidal neurons (bottom traces) showing the effect of different 10 s blue light illumination paradigms on epileptiform activity. Blue shading represents the period of blue light illumination. B, C, Bar chart of average data from experiments presented in A. Blue bars represent the period of blue light illumination (20 Hz, n = 20 illuminations from 10 experiments; 50 Hz, n = 18 illuminations from 9 experiments; constant, n = 20 illuminations from 10 experiments). *Statistically significant difference between the light period and all nonlight periods. $Statistically significant difference between the light period and periods before (0–10 s) and 60 s after (60–70 s) light. £Statistically significant difference between light and before light (0–10 s) periods. &Statistically significant difference between periods before (0–10 s) and immediately after (20–30 s) light. B, Friedman test (p < 0.0001), Dunn's multiple-comparison test (p < 0.01). C, Friedman test (p = 0.019 and p = 0.020, for 20 Hz and constant light, respectively), followed by Dunn's multiple-comparison test (p < 0.05). Repeated-measures ANOVA (p = 0.004), Bonferroni's multiple-comparison test (p < 0.05 for 50 Hz). Values represent mean ± SEM.
One noteworthy observation was that switching on the blue light generated a burst-like discharge (Figs. 3A and 4A). Whole-cell recordings revealed a large inward current in CA3 pyramidal neurons (Figs. 3A,E and 4A). We hypothesized that this current was generated by GABAA receptors activated by synchronous release of GABA from interneurons; and indeed, application of the GABAA receptor antagonist PTX (50 μm) completely blocked the light (switch-on)-induced currents in all 4 cells tested (Fig. 3F). PTX also blocked the small currents caused by light pulses during the course of the stimulation. These were apparently also generated by chloride currents through GABAA receptors (Fig. 3E), although some contribution of glutamatergic synapses from firing CA3 pyramidal cells in the initial phase of light stimulation cannot be excluded (Fig. 5).
Figure 5.
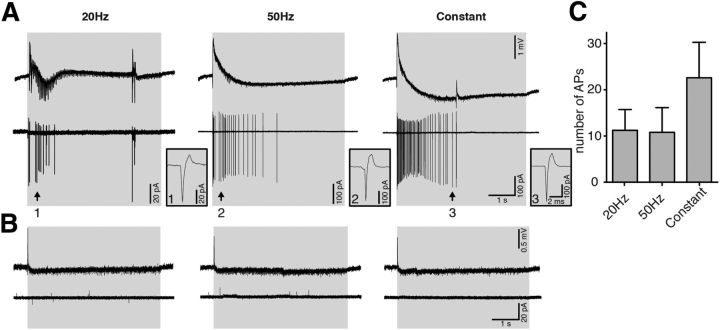
Activation of Gad2 interneurons induces APs in CA3 pyramidal neurons. A, B, Simultaneous field (top trace) and cell-attached recordings from CA3 pyramidal neurons (bottom trace) during 20 Hz, 50 Hz, or constant blue light illumination. APs on cell-attached recordings from CA3 pyramidal neurons upon blue light illumination in 4-AP aCSF (A) but not in normal aCSF (B). Single APs indicated as 1, 2, and 3 are presented as stretched recordings in the respective boxes on the right. C, Bar chart of average data from experiments performed in 4-AP aCSF. The average number of spikes induced by 20 Hz (n = 4 cells), 50 Hz (n = 5), and constant (n = 5) blue light illumination are not significantly different between the groups (one-way ANOVA, p = 0.340). Error bars indicate SEM.
Furthermore, light stimulation in PTX-containing aCSF failed to block epileptiform activity (data not shown), indicating that GABA release and GABAA receptor activation are necessary for the inhibitory effect of light observed here. Thus, our results suggest that synchronous activation of large numbers of GABAergic interneurons by switching on the light induces depolarizing currents that are mediated by GABAA receptors in the pyramidal neurons. This would imply that these GABAA-mediated currents could depolarize CA3 pyramidal neurons, leading to generation of APs. To exclude interference with reversal potential for chloride caused by the patch-clamp pipette solution, we performed cell-attached recordings from CA3 pyramidal cells. These experiments demonstrated that activation of Gad2 interneurons with light induced APs in CA3 pyramidal neurons (Fig. 5A), confirming the hypothesis. The number of APs was not dependent on the illumination protocol used (11.25 ± 4.50 for 20 Hz, 10.80 ± 5.36 for 50 Hz, and 22.60 ± 7.68 for constant, p = 0.340; Fig. 5C). Together, these data suggest that indeed GABA released upon blue light switch-on depolarizes CA3 pyramidal neurons by activation of GABAA receptors and generates APs. These APs seem to be responsible for the burst-like discharge observed in the field recordings at the moment of light switch-on. In normal aCSF, light stimulation was not inducing APs in CA3 neurons (Fig. 5B). These data suggest that zero-Mg2+ and 4-AP could facilitate GABAA receptor-activated depolarizing currents either via depolarizing neurons or (and) increasing GABA release by broadening APs (by 4-AP). Depolarization of neurons would bring them closer to AP generation, whereas larger GABA release would increase intracellular chloride accumulation at the beginning of light stimulation, when ChR2-positive interneurons are firing, thereby readily triggering APs in pyramidal neurons. Such a shift in outcome of GABAA receptor activation has been reported for other models of epilepsy (Traub et al., 1995; Barmashenko et al., 2011) and in tissue from human epilepsy patients (Palma et al., 2006; Huberfeld et al., 2007).
Network desynchronization does not explain inhibition of epileptiform bursting
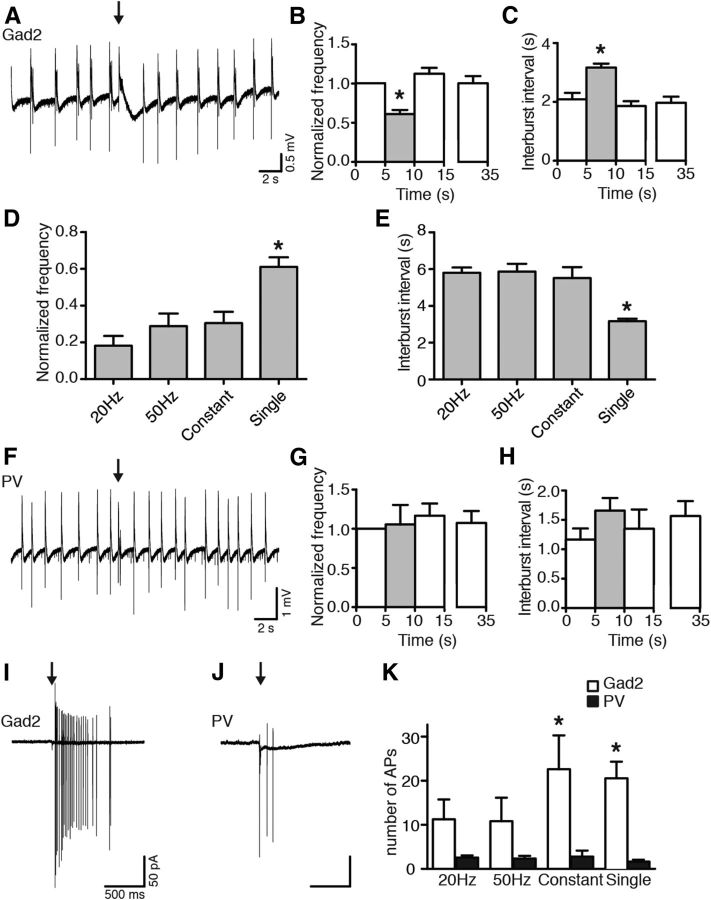
We have observed that light switch-on induces APs and synchronous GABA release from Gad2-positive interneurons, thus depolarizing CA3 pyramidal cells to the point of generating APs. In concert or separately, these events could effectively interfere with the ongoing network synchrony in zero-Mg2+ and 4-AP containing aCSF and thereby temporarily abolish/delay the generation of ongoing epileptiform bursting by inducing a refractory period after the light-evoked burst-like event. If this is the case, it would be expected that activation of interneurons by a single pulse of blue light, also leading to generation of same number of APs in CA3 pyramidal cells (Fig. 6K), would desynchronize the network in a similar manner and thereby inhibit ongoing epileptiform activity to the same extent as seen for repetitive or constant light illumination paradigms (Fig. 3A–C). Indeed, a single 1 ms blue light pulse was still able to inhibit ongoing epileptiform activity, as demonstrated by decreased frequency and increased interburst interval (normalized frequency: 61.11 ± 5.17%, p < 0.001, Fig. 6B; interburst interval: 3.17 ± 0.14, p < 0.001, Fig. 6C). However, the effect of a single light pulse was less pronounced compared with that of 5 s 20 Hz, 50 Hz, and constant light illumination (p < 0.01; Fig. 6D,E), indicating that sustained GABA release from synaptic terminals of interneurons depolarized by the direct effect of light plays a role in the inhibition of epileptiform activity. Although such effect of GABA is depolarizing, the AP threshold is not reached; therefore, CA3 pyramidal neurons are inhibited because of shunting EPSCs through open GABAA receptor channels.
Figure 6.
Brief (1 ms) light pulse-induced activation of Gad2 interneurons, but not PV interneurons, inhibits epileptiform activity. A, Field recording from the CA3 region, showing the effect of Gad2 interneuron activation with a single 1 ms blue light pulse (black arrow) on epileptiform activity. B, C, Bar charts of average data from experiments in A. Gray bars indicate the 5 s period after the blue light pulse. Data were collected from 18 postlight periods in 9 slices. *Statistical significance between the light period and all nonlight periods: one-way ANOVA (p < 0.0001), Bonferroni's multiple-comparison test (p < 0.001). D, E, Bar charts showing the average effect of different blue light illumination paradigms on epileptiform activity in Gad2-Cre mice. *Statistically different from all other illumination paradigms: Kruskal–Wallis test (p < 0.0001), Dunn's multiple-comparison test (p < 0.01). F, Field recording from the CA3 region. Activation of PV interneurons with a single 1 ms blue light pulse (black arrow) does not inhibit epileptiform activity. G, H, Average data from experiments in F (Kruskal–Wallis test, p = 0.246, in G; one-way ANOVA, p = 0.506, in H; n = 9 light periods in 5 slices). I, J, Cell-attached recordings from CA3 pyramidal neurons during 1 ms blue light pulse stimulation (black arrow) of Gad2 (I) and PV (J) interneurons. K, Average number of APs (Gad2: n = 4 for 20 Hz, n = 5 for 50 Hz, n = 5 for constant and n = 13 for single; PV: n = 16, n = 11, n = 5, and n = 6, respectively). *One-way ANOVA, p < 0.0001, Bonferroni's multiple-comparison test (p < 0.05). Values represent mean ± SEM.
If this assumption were true, the effect should depend on the amount of GABA released from the interneuron terminals. Therefore, one would anticipate that activation of a smaller subset of interneurons would release less GABA and result in a less pronounced inhibition of epileptiform activity. To test this hypothesis, we injected AAV-EF1a-DIO-ChR2(H134R)-mCherry into the hippocampus of PV-Cre mice and expressed ChR2 in a smaller interneuron subpopulation, such as PV-positive interneurons. This was confirmed by optogenetic stimulation with blue light, which depolarized and induced APs in PV interneurons (Fig. 7C). Immunohistochemical stainings in PV-Cre::Ai14 mice revealed that 84.87 ± 3.09% of PV-positive cells were also expressing tdTomato and that 73.87 ± 1.80% of tdTomato-positive cells also expressed PV (Fig. 8), indicating that this strategy is targeting primarily PV interneurons, which include basket cells, axo-axonic cells, and bistratified cells (Freund and Buzsáki, 1996; Klausberger and Somogyi, 2008), a much smaller populations of interneurons compared with Gad2-Cre mice.
Figure 7.
ChR2-expressing PV interneurons generate APs upon blue light illumination. A, Whole-cell recording (top) of a PV interneuron generating typical high-frequency nonaccommodating APs upon sustained 500 pA current injection (bottom). B, Confocal image showing biocytin (left) and mCherry (middle) staining of the PV interneuron shown in A. Merged image is shown on the right. Scale bars, 50 μm. pyr, Stratum pyramidale. C, Whole-cell recordings from the cell shown in A and B illustrating APs during 20 Hz, 50 Hz, or constant blue light illumination for 5 s, in aCSF (left) and in 4-AP aCSF (right). D, Bar chart of averaged data from experiments shown in C (n = 5 in normal aCSF and n = 6 in 4-AP aCSF). *Statistically significant difference between the AP frequency in aCSF and 4-AP aCSF: paired t test (p = 0.030). $Significant difference between the firing frequency during 50 Hz versus constant light illumination paradigms in 4-AP aCSF: Kruskal–Wallis test (p = 0.003), Dunn's multiple-comparison test (p < 0.05). E, The first AP induced by 20 Hz blue light illumination in aCSF (black) and in 4-AP aCSF (red). F–H, Average characteristics of the first APs induced by 20 Hz blue light illumination in the presence of aCSF (gray bar, n = 5) or 4-AP aCSF (red bar, n = 5). *Statistically significant difference between the two experimental conditions: paired t test. F, Average AP threshold (p = 0.105). G, Average AP amplitude (p = 0.444). H, Average AP half-width (p = 0.001). Values represent mean ± SEM.
Figure 8.
Cre is selectively expressed in PV interneurons in PV-Cre mice. A, Confocal image showing immunostaining for PV (left) and tdTomato (middle) in PV-Cre::Ai14 mice. Right, Merge image. Arrows indicate cells double-labeled for PV and tdTomato. Arrowhead indicates a cell positive for PV but negative for tdTomato. Scale bars, 50 μm. pyr, Stratum pyramidale. B, Bar chart indicating the average percentage of double-labeled cells in PV-Cre::Ai14 mice within the whole PV (green) or tdTomato (red) populations. Counting was performed in 15 slices from 2 animals; n = 443 total tdTomato+ cells. Error bars indicate SEM.
Illumination with a single pulse in PV-Cre mice was not able to inhibit epileptiform bursts (p = 0.246) or increase the interburst interval (p = 0.506) (Fig. 6F–H), although it induced APs in cell-attached recordings from CA3 pyramidal neurons (Fig. 6J). Thus, optogenetic activation of PV-expressing interneuron subpopulation does release GABA onto the CA3 neurons, but the amount of GABA is not sufficient to stop/delay bursting activity. The 1 ms activation of PV-expressing interneurons induced fewer APs in the CA3 pyramidal neurons compared with that of Gad2 interneurons (1.67 ± 0.42 APs for PV and 20.54 ± 3.78 APs for Gad2 interneurons, p < 0.01; Fig. 6I–K), supporting the idea of less GABA released by optogenetic stimulation.
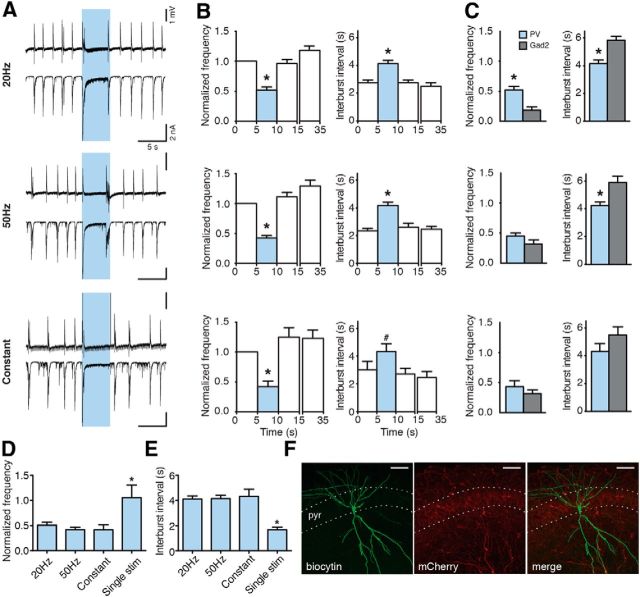
Next, we prolonged the light illumination to enhance the amount of GABA released from PV interneuron terminals. Activation of PV interneurons with 20 Hz, 50 Hz, and constant blue light illumination for 5 s (Fig. 9A) significantly reduced the frequency of ongoing epileptiform activity and prolonged the interburst interval compared with control (Fig. 9B) and single pulse stimulations (normalized frequency: to 50.83 ± 5.69% for 20 Hz, to 41.80 ± 4.58% for 50 Hz, and 41.57 ± 9.90% for constant, yet unchanged for a single pulse 105.56 ± 24.85%, p = 0.015, Fig. 6D; interburst interval: 4.11 ± 0.26 s for 20 Hz, 4.16 ± 0.25 s for 50 Hz, 4.33 ± 0.57 s for constant, and 1.67 ± 0.21 s for a single pulse, p = 0.002, Fig. 9E), confirming that the amount of GABA released by optogenetic stimulation is important for reducing epileptiform activity. Moreover, the effect of activating PV interneurons compared with Gad2 interneurons was significantly smaller (p < 0.0001; Fig. 9C), again indicating that larger amounts of GABA released by broad number of interneuron populations has stronger inhibitory effect on ongoing epileptiform bursting. This was paralleled by the less number of APs induced in CA3 pyramidal neurons in PV-Cre mice compared with Gad2-Cre mice when prolonged illumination paradigms lasting 5 s were used (Fig. 6K). Thus, these data support the notion that optogenetic inhibition of bursting activity is dependent on the amount of GABA released by interneurons.
Figure 9.
Prolonged activation of PV interneurons suppresses epileptiform activity. A, Field recordings from the CA3 region (top) and simultaneous whole-cell recordings from CA3 pyramidal neurons (bottom) showing the effect of different illumination paradigms on epileptiform activity. Blue shading represents illumination. B, Bar charts of average data (n = 61 illuminations in 25 slices for 20 Hz; n = 66 illuminations in 27 slices for 50 Hz; n = 17 illuminations in 9 slices for constant). Blue bars represent the light period. *Statistically significant difference between the light and all nonlight periods. #Statistically significant difference between the light period and periods after (10–15 and 30–35 s) light. Friedman test (p < 0.0001), Dunn's multiple-comparison test (p < 0.01) for all illuminations, except for constant interburst interval where repeated-measures ANOVA (p = 0.0064), Bonferroni's multiple-comparison test (p < 0.05) was used. C, Comparison between effects of illumination on bursting in Gad2-Cre versus PV-Cre mice. *Unpaired t test (p < 0.0001) for 20 Hz. Unpaired t test with Welch's correction (p = 0.0008) for 50 Hz. D, E, Bar charts comparing the effect of different illumination paradigms activating PV interneurons on epileptiform activity. *Statistical significance between the effect of a single light pulse and all other illumination paradigms. Kruskal–Wallis test (p = 0.015) and Dunn's multiple-comparison test (p < 0.05) for normalized frequency. Kruskal–Wallis test (p = 0.002) and Dunn's multiple-comparison test (p < 0.01) for interburst interval. Values represent mean ± SEM. F, Confocal image showing biocytin (left) and mCherry (middle) immunostaining of a CA3 pyramidal neuron. Merged image is on the right. Scale bars, 50 μm. pyr, Stratum pyramidale.
Because the number of APs induced in CA3 pyramidal neurons either by activation of PV or Gad2 interneurons was not different between the illumination paradigms (PV: 1.67 ± 0.42, 2.56 ± 0.50, 2.36 ± 0.58, and 2.80 ± 1.36 APs for single pulse, 20 Hz, 50 Hz, and constant illumination, respectively, p = 0.778, one-way ANOVA; Gad2: 20.54 ± 3.78, 11.25 ± 4.50, 10.80 ± 5.36, and 22.60 ± 7.68 APs for single pulse, 20 Hz, 50 Hz, and constant illumination, respectively, p = 0.353, one-way ANOVA; Fig. 6K), whereas repetitive and constant light illumination was still more effective in inhibiting bursting in Gad2-Cre mice, one could conclude that the duration and amount of released GABA, and consequent inhibition of CA3 pyramidal neurons, are more important for this action rather than the desynchronizing effect of APs per se.
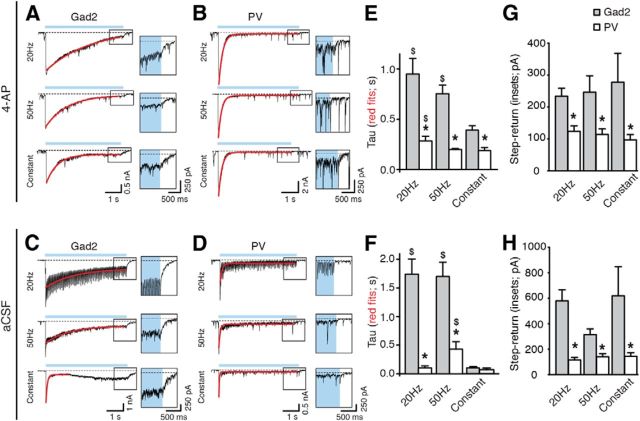
Finally, more direct evidence was obtained by using the decay time of GABAA receptor-mediated currents in CA3 pyramidal neurons as a read-out of GABA levels. A longer decay time of the postsynaptic currents in CA3 pyramidal neurons would be expected when stimulating Gad2 interneurons (more GABA) compared with PV interneurons (less GABA). To validate this assumption, we estimated the decay time of the PTX-sensitive whole-cell current in CA3 pyramidal cells by measuring the time constant τ of a single exponential curve fit during the 5 s illumination paradigm. In Gad2-Cre mice, τ was significantly slower at 20 and 50 Hz compared with constant light illumination (p = 0.001; Fig. 10E), reflecting the higher number of APs, and thereby higher GABA release, from interneurons induced by light in zero-Mg2+ aCSF containing 4-AP (Fig. 2). Similarly, also when stimulating PV interneurons, the time constant τ during 20 Hz pulse illumination was slower than during constant light (p = 0.014; Fig. 10E). Intergroup analysis revealed that the decay time was significantly slower when stimulating Gad2 interneurons (0.95 ± 0.15 s, 0.75 ± 0.09 s, and 0.39 ± 0.05 s for 20 Hz, 50 Hz, and constant, respectively, p < 0.01; Fig. 10E) compared with stimulation of PV interneurons (0.28 ± 0.05 s, 0.20 ± 0.01 s, and 0.19 ± 0.03 s for 20 Hz, 50 Hz, and constant, respectively; Fig. 10E). These results once again suggest that activating Gad2 interneurons evoke larger release of GABA onto CA3 pyramidal neurons compared with activation of PV interneurons alone, and this correlates to stronger inhibition of bursting activity in Gad2-Cre mice compared with PV-Cre mice.
Figure 10.
Longer decay time of light-induced currents in CA3 pyramidal cells in Gad2 compared with PV mice. A–D, Whole-cell recordings of CA3 pyramidal neurons in 4-AP ACSF (A, B) or normal aCSF (C,D), showing the inward current induced by light activation of Gad2 (A, C) or PV (B,D) interneurons. Blue line indicates the period of light illumination. Dashed line indicates the baseline. Single exponential fit to the current decay is shown in red. Note the current step at blue light termination in the expanded boxes on the right. E, F, Comparison between the time constant τ of the decay for the inward current recorded in CA3 pyramidal neurons upon activation of Gad2 or PV interneurons in 4-AP aCSF (E; Gad2, n = 24 illuminations from 12 experiments; PV, n = 23 and 24 illuminations from 12 experiments for 20 and 50 Hz, n = 14 from 7 experiments for constant) or normal aCSF (F; Gad2, n = 5 illuminations from 5 experiments; PV, n = 12 illuminations from 12 experiments). *Statistically significant difference between the τ for Gad2 and PV mice. Kruskal–Wallis test (p < 0.0001), Dunn's multiple-comparison test (p < 0.01) for 4-AP aCSF. One-way ANOVA (p < 0.01), Bonferroni's multiple-comparison test (p < 0.001) for normal aCSF. $Statistically significant difference between the τ in Gad2 or PV mice during constant light versus 20 Hz or 50 Hz illumination paradigms. Kruskal–Wallis test (p < 0.05), Dunn's multiple-comparison test (p < 0.05) for 4-AP aCSF and PV-mice in aCSF. One-way ANOVA (p = 0.0002), Bonferroni's multiple-comparison test (p < 0.001) for Gad-mice in aCSF. G, H, Comparison between the step-return to baseline current recorded in CA3 pyramidal cells at the end of light stimulation, in 4-AP aCSF (G; Gad2, n = 20 illuminations from 10 experiments for 20 and 50 Hz, n = 18 illuminations from 9 experiments for constant; PV, n = 18 illuminations from 9 experiments for 20 Hz, n = 20 illuminations from 9 experiments for 50 Hz and n = 15 illuminations from 8 experiments for constant) and normal aCSF (H; Gad2, n = 5 illuminations from 5 experiments; PV, n = 12 illuminations from 12 experiments.*Statistically significant difference between the measured current after Gad2 versus PV interneuron stimulation. Mann–Whitney U test and unpaired t test for experiments performed in 4-AP and normal aCSF, respectively (p < 0.05), in all cases. Values represent mean ± SEM.
To assure that this difference was not dependent on our experimental conditions (i.e., the presence of 4-AP in the perfusion solution), a subset of recordings were performed in normal aCSF (Fig. 10C,D). In these conditions, τ was still longer when activating Gad2 interneurons compared with PV interneurons using light pulses at 20 and 50 Hz for 5 s (20 Hz: 1.74 ± 0.27 s for Gad2 and 0.10 ± 0.04 s for PV, p < 0.0001; 50 Hz: 1.70 ± 0.25 s for Gad2 and 0.43 ± 0.13 s for PV, p < 0.0001; Fig. 10F), but not using constant illumination (0.10 ± 0.02 s for Gad2 and 0.07 ± 0.03 s for PV, p > 0.05; Fig. 10F). Together, the data illustrate that activation of Gad2 interneurons results in a larger release of GABA compared with activation of PV interneurons alone, under normal physiological conditions.
To further demonstrate that the amount of GABA released during light stimulation of Gad2 interneurons was larger than that released by PV interneuron stimulation, we quantified the step-return to baseline current at the end of light stimulation for the different frequency paradigms (Fig. 10A–F, insets). We found that this sustained current was always larger when stimulating Gad2 compared with PV interneurons, both in 4-AP aCSF (Gad2: 234.15 ± 24.79 pA for 20 Hz, 246.80 ± 51.71 pA for 50 Hz, and 278.17 ± 89.92 pA for constant light; PV: 123.70 ± 17.91 pA for 20 Hz, 114.40 ± 17.05 pA for 50 Hz, and 97.53 ± 16.52 pA for constant light; Fig. 10D, p < 0.05 in all cases) and in normal aCSF (Gad2: 580.00 ± 86.70 pA for 20 Hz, 313.80 ± 45.68 pA for 50 Hz, and 619.80 ± 228.00 pA for constant light; PV: 116.30 ± 20.76 pA for 20 Hz, 140.90 ± 25.77 pA for 50 Hz, and 145.10 ± 26.87 pA for constant light; Fig. 10H, p < 0.05 in all cases). This indicates that a larger amount of GABA was still being released by Gad2-axon terminals (jointly by perisomatic and dendritic synapses on CA3 neurons, compared with by predominantly perisomatic synapses in PV mice), despite a depolarization block of APs observed in Gad2- and PV interneurons during light stimulations (Figs. 2C and 7C). This could account for the observed higher efficiency in suppressing epileptiform activity in Gad2-Cre mice.
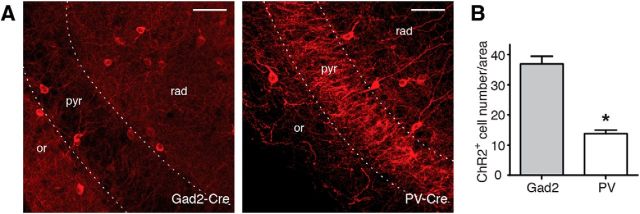
PV interneurons represent only a small population of the total number of hippocampal interneurons; therefore, the smaller amount of GABA released from PV compared with Gad2 interneurons could also be explained by activation of fewer ChR2-expressing interneurons in PV-Cre compared with Gad2-Cre mice. To test this hypothesis, we counted the number of ChR2-positive cells in slices from virus-injected PV-Cre and Gad2-Cre mice and estimated the number of cells that would be activated by blue light. We found that there were more than twice as many ChR2-positive cells in Gad2-Cre compared with PV-Cre mice (36.92 ± 2.53 ChR2+ cells/area in Gad2-Cre and 13.82 ± 1.12 ChR2+ cells/area in PV-Cre mice, p < 0.0001; Fig. 11B). These data support the idea that blue light illumination of slices from Gad2-Cre mice would activate more ChR2-expressing interneurons than illumination of slices from PV-Cre mice, and thereby evoke larger release of GABA onto CA3 pyramidal neurons. The higher effectiveness of optogenetic activation of in Gad2-Cre mice in suppressing epileptiform activity is therefore likely to result from higher amounts of released GABA.
Figure 11.
A higher number of interneurons express ChR2 in Gad2-Cre compared with PV-Cre mice. A, Confocal images showing immunostaining for mCherry in Gad2-Cre (left) and PV-Cre (right) mice. Scale bars, 50 μm. or, Stratum oriens; pyr, stratum pyramidale; rad, stratum radiatum. B, Bar chart showing the average number of ChR2-positive cells in the CA3 region of Gad2-Cre and PV-Cre mice. Counting was performed in 24 slices from 4 Gad2-Cre mice (n = 923 ChR2-positive cells) and 18 slices from 3 PV-Cre mice (n = 235 ChR2-positive cells). *p < 0.0001 (unpaired t test with Welch's correction). Error bars indicate SEM.
Effects of dendrite-targeting interneuron activation on epileptiform activity
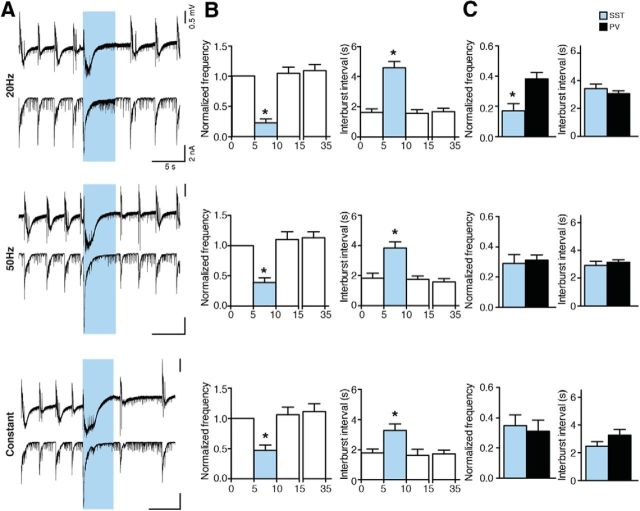
A recent study suggested that somatostatin-positive dendrite-targeting interneurons are more efficient than perisomatic-targeting PV interneurons in suppressing action potentials in CA1 pyramidal cells (Lovett-Barron et al., 2012). To examine whether the increased efficiency of Gad2 interneuron activation in suppressing epileptiform activity was not only due to the presence of dendrite-targeting populations in Gad2-Cre mice, but indeed to larger amounts of released GABA both at perisomatic and dendritic compartments of CA3 neurons, we injected AAV-EF1a-DIO-ChR2(H134R)-mCherry into the hippocampus of SST-Cre mice and expressed ChR2 in dendrite-targeting interneurons expressing somatostatin. Light stimulation in acute slices from SST-Cre mice was able to significantly reduce the frequency and increase the interburst interval in all stimulation paradigms tested (normalized frequency: to 22.31 ± 6.42 for 20 Hz, to 39.07 ± 7.83 for 50 Hz, and to 46.69 ± 9.38 for constant; interburst interval: 4.58 ± 0.43 s for 20 Hz, 3.84 ± 0.41 s for 50 Hz, and 3.29 ± 0.42 s for constant, p < 0.01; Fig. 12B). To evaluate whether the effect was larger than that observed during stimulation of PV interneurons, we compared the normalized frequency and interburst interval values between SST-Cre and PV-Cre mice and observed that the effects were very similar, with only a minor increased efficiency during 20 Hz stimulation (Fig. 12C). These experiments indicate that selective activation of SST interneurons is not superior to activation of PV interneurons in suppressing epileptiform activity. The higher efficiency of Gad2 interneuron stimulation is therefore to be attributed to larger overall amounts of GABA released (jointly by perisomatic and dendritic synapses onto the CA3 neurons), and not to the activation of the dendritic inhibitory synapses.
Figure 12.
Activation of SST interneurons suppresses epileptiform activity. A, Field recordings from the CA3 region (top) and simultaneous whole-cell recordings from CA3 pyramidal neurons (bottom) showing the effect of different illumination paradigms on epileptiform activity. Blue shading represents illumination. B, Bar charts of averaged data (n = 18 illuminations in 9 slices for 20 Hz and 50 Hz, and n = 16 illuminations in 8 slices for constant). Blue bars represent light period. *Statistical difference between the light and all nonlight periods. Friedman test (p < 0.0001) and Dunn's multiple-comparison test (p < 0.01) for all illuminations, except for 20 Hz interburst interval where repeated-measures ANOVA (p < 0.0001) followed by Bonferroni's multiple-comparisons test (p < 0.0001 were used). C, Comparison of effects of illumination on bursting between SST- and PV-Cre mice. *p < 0.05, significant difference (unpaired t test).
Discussion
In this study, we show, for the first time, that global optogenetic activation of mixed interneuron populations effectively suppresses epileptiform activity in the hippocampus because of inhibition of principal cells by GABA released from these interneurons. In support, simultaneous optogenetic activation of several subpopulations of interneurons is more efficient in suppressing epileptiform activity than stimulation of PV or SST interneurons alone. Therefore, we propose that targeting large numbers of inhibitory interneurons with optogenetics, as opposed to specific subpopulations, could represent a better alternative strategy to control seizures.
Certain subclasses of inhibitory interneurons (including PV interneurons) are responsible for generating synchrony and maintaining network oscillations (Freund and Katona, 2007). Therefore, it is possible that perturbation of their rhythmic firing by optogenetics could be accountable for stopping seizure activity. Alternatively, this effect could have been explained by an inhibitory effect on pyramidal neurons exerted by GABA released from the ChR2-positive terminals. In support, 4-AP-induced epileptiform activity could be blocked by bath application of the GABAA agonist muscimol (Chesnut and Swann, 1990). In our experimental conditions, simultaneous activation of GABAergic interneurons by light evoked a burst-like discharge at the onset of light illumination. Cell-attached recordings revealed that this discharge was dependent on GABAA receptor activation and was mediated by APs generated by CA3 pyramidal cells. Because the reappearance of consecutive epileptiform bursts was delayed during prolonged light application, we first speculated that the light-induced generation of APs in CA3 pyramidal cells could perturb the network synchronization by increasing the refractory period of periodically recurring ongoing bursts (Hablitz, 1984; Lian et al., 2003). However, when the stimulation of Gad2 interneurons was limited to only one single light pulse, which still generated the same number of APs in CA3 pyramidal cells, the suppression of epileptiform activity was significantly less pronounced, suggesting that the suppression was not entirely caused by the refractory period after the light-induced burst-like event. This indicates that mechanisms other than network desynchronization are also involved and that the inhibitory effects of synaptically released GABA might play an important role. Indeed, the light had a biphasic effect: the synchronous GABA release from interneurons caused by the initial light switch-on depolarized CA3 pyramidal neurons and induced APs, whereas the later phase of illuminations evoked sustained GABA release from interneurons that most likely also depolarized CA3 pyramidal neurons without inducing APs, and became inhibitory because of shunting effect of GABAA receptors (Avoli and de Curtis, 2011). Such a phasic effect of GABA has been previously proposed in the 4-AP model of epileptiform activity (Kantrowitz et al., 2005). Our data also indicate that increased GABA release from interneurons may promote synchronization by altering Cl− homeostasis and generating APs in pyramidal neurons, as well as inhibit established synchronized activity by subthreshold depolarization and GABAA receptor ”shunting” inhibition of pyramidal neurons. It has to be noted that the two mechanisms, induction of refractory period after the light-evoked initial depolarization and the following sustained GABA-mediated shunting inhibition, do not necessarily exclude each other. Most likely, they are both contributing at the same time to the overall suppression of epileptiform bursts observed here. To study their different contribution in more details, one possibility would be to use a ramp increase of light intensity, to modulate the initial depolarization at light switch-on. Further studies are needed to carefully evaluate this alternative, to better tailor possible future optogenetic therapies against epilepsy.
In our experiments, stimulation of an isolated population of inhibitory interneurons alone (i.e., PV interneurons) by single light pulses failed to suppress ongoing epileptiform bursts, and the effect of long light illumination paradigms in PV-Cre animals was significantly smaller than what was observed in Gad2-Cre animals. One possible interpretation of these results would be more temporal and spatial release of GABA on both perisomatic and dendritic compartments and thereby more effective inhibition of the pyramidal neurons by light in Gad2-Cre animals. Indeed, the decay time of the large postsynaptic current evoked by light illumination in CA3 pyramidal cells was always longer in Gad2-Cre compared with PV-Cre animals. Moreover, the step-return to baseline of the GABAA receptor-mediated current at the end of light illumination (Fig. 10G,H) was also larger when stimulating Gad2 interneurons compared with PV interneurons, supporting the idea that overall higher amounts of GABA are synaptically released when more interneurons are activated. As an additional support, we show that the number of ChR2-expressing interneurons in the CA3 area of virus-injected Gad2-Cre animals was twice as high as the number of cells in PV-Cre animals, indicating that light stimulation would activate at least twice as many cells and synapses. However, one cannot exclude that the increased efficiency of Gad2 interneuron stimulation also depends on the difference in inhibitory cell subclasses that are activated by light. The location of inhibitory synapses (perisomatic plus dendritic) could also contribute to the stronger inhibitory effect of the light stimulation in Gad2-Cre mice.
In Gad2-Cre mice, several populations of interneurons are present, including PV-, SST-, NPY-, and CCK-expressing cells (Fig. 1). Because of the strategic location of their perisomatic synapses onto principal cells, PV interneurons are thought to be more efficient than other cell types in inhibiting APs (Freund, 2003; Freund and Katona, 2007). Selective optogenetic stimulation of PV interneurons is indeed able to shorten electrographic seizures in an animal model of epilepsy (Krook-Magnuson et al., 2013). A recent study suggested that dendritic inhibition, in particular by SST-expressing cells, is more effective than perisomatic inhibition in suppressing APs in pyramidal cells of the hippocampus (Lovett-Barron et al., 2012). However, when we stimulated SST interneurons selectively, we observed similar effects on epileptiform activity as during PV interneuron stimulation, indicating that higher amounts of synaptically released GABA jointly from various interneuron populations onto the pyramidal neurons is responsible for the stronger inhibition of epileptiform activity in Gad2-Cre mice, rather than dendrite-targeting inhibitory synapses.
In conclusion, our data suggest that optogenetic activation of large numbers of various types of inhibitory interneurons represents a powerful strategy for controlling hypersynchronous network activity and that optogenetic targeting of wider interneuron populations could be a favorable therapeutic alternative for suppressing epileptiform activity. However, the initial synchronization of CA3 discharges observed at the beginning of light application needs to be taken in account.
Footnotes
This work was supported by the Swedish Research Council and the Kock Foundation. M.L. was supported by the Swedish Brain Foundation. We thank Nora Pernaa and Björn Anzelius for technical assistance, and Olle Lindvall for critically reading the manuscript.
The authors declare no competing financial interests.
References
- Avoli M. Is epilepsy a disorder of inhibition or excitation? Prog Clin Biol Res. 1983;124:23–37. [PubMed] [Google Scholar]
- Avoli M, de Curtis M. GABAergic synchronization in the limbic system and its role in the generation of epileptiform activity. Prog Neurobiol. 2011;95:104–132. doi: 10.1016/j.pneurobio.2011.07.003. [DOI] [PMC free article] [PubMed] [Google Scholar]
- Avoli M, D'Antuono M, Louvel J, Köhling R, Biagini G, Pumain R, D'Arcangelo G, Tancredi V. Network and pharmacological mechanisms leading to epileptiform synchronization in the limbic system in vitro. Prog Neurobiol. 2002;68:167–207. doi: 10.1016/S0301-0082(02)00077-1. [DOI] [PubMed] [Google Scholar]
- Barmashenko G, Hefft S, Aertsen A, Kirschstein T, Köhling R. Positive shifts of the GABAA receptor reversal potential due to altered chloride homeostasis is widespread after status epilepticus. Epilepsia. 2011;52:1570–1578. doi: 10.1111/j.1528-1167.2011.03247.x. [DOI] [PubMed] [Google Scholar]
- Boyden ES, Zhang F, Bamberg E, Nagel G, Deisseroth K. Millisecond-timescale, genetically targeted optical control of neural activity. Nat Neurosci. 2005;8:1263–1268. doi: 10.1038/nn1525. [DOI] [PubMed] [Google Scholar]
- Cardin JA, Carlén M, Meletis K, Knoblich U, Zhang F, Deisseroth K, Tsai LH, Moore CI. Driving fast-spiking cells induces gamma rhythm and controls sensory responses. Nature. 2009;459:663–667. doi: 10.1038/nature08002. [DOI] [PMC free article] [PubMed] [Google Scholar]
- Chesnut TJ, Swann JW. Suppression of 4-aminopyridine-induced epileptogenesis by the GABAA agonist muscimol. Epilepsy Res. 1990;5:8–17. doi: 10.1016/0920-1211(90)90061-Y. [DOI] [PubMed] [Google Scholar]
- Freund TF. Interneuron diversity series: rhythm and mood in perisomatic inhibition. Trends Neurosci. 2003;26:489–495. doi: 10.1016/S0166-2236(03)00227-3. [DOI] [PubMed] [Google Scholar]
- Freund TF, Buzsáki G. Interneurons of the hippocampus. Hippocampus. 1996;6:347–470. doi: 10.1002/(SICI)1098-1063(1996)6:4<347::AID-HIPO1>3.0.CO;2-I. [DOI] [PubMed] [Google Scholar]
- Freund TF, Katona I. Perisomatic inhibition. Neuron. 2007;56:33–42. doi: 10.1016/j.neuron.2007.09.012. [DOI] [PubMed] [Google Scholar]
- Gradinaru V, Zhang F, Ramakrishnan C, Mattis J, Prakash R, Diester I, Goshen I, Thompson KR, Deisseroth K. Molecular and cellular approaches for diversifying and extending optogenetics. Cell. 2010;141:154–165. doi: 10.1016/j.cell.2010.02.037. [DOI] [PMC free article] [PubMed] [Google Scholar]
- Hablitz JJ. Picrotoxin-induced epileptiform activity in hippocampus: role of endogenous versus synaptic factors. J Neurophysiol. 1984;51:1011–1027. doi: 10.1152/jn.1984.51.5.1011. [DOI] [PubMed] [Google Scholar]
- Hájos N, Ellender TJ, Zemankovics R, Mann EO, Exley R, Cragg SJ, Freund TF, Paulsen O. Maintaining network activity in submerged hippocampal slices: importance of oxygen supply. Eur J Neurosci. 2009;29:319–327. doi: 10.1111/j.1460-9568.2008.06577.x. [DOI] [PMC free article] [PubMed] [Google Scholar]
- Huberfeld G, Wittner L, Clemenceau S, Baulac M, Kaila K, Miles R, Rivera C. Perturbed chloride homeostasis and GABAergic signaling in human temporal lobe epilepsy. J Neurosci. 2007;27:9866–9873. doi: 10.1523/JNEUROSCI.2761-07.2007. [DOI] [PMC free article] [PubMed] [Google Scholar]
- Kantrowitz JT, Francis NN, Salah A, Perkins KL. Synaptic depolarizing GABA response in adults is excitatory and proconvulsive when GABAB receptors are blocked. J Neurophysiol. 2005;93:2656–2667. doi: 10.1152/jn.01026.2004. [DOI] [PubMed] [Google Scholar]
- Kilb W, Dierkes PW, Syková E, Vargová L, Luhmann HJ. Hypoosmolar conditions reduce extracellular volume fraction and enhance epileptiform activity in the CA3 region of the immature rat hippocampus. J Neurosci Res. 2006;84:119–129. doi: 10.1002/jnr.20871. [DOI] [PubMed] [Google Scholar]
- Klausberger T, Somogyi P. Neuronal diversity and temporal dynamics: the unity of hippocampal circuit operations. Science. 2008;321:53–57. doi: 10.1126/science.1149381. [DOI] [PMC free article] [PubMed] [Google Scholar]
- Kokaia M, Andersson M, Ledri M. An optogenetic approach in epilepsy. Neuropharmacology. 2013;69:89–95. doi: 10.1016/j.neuropharm.2012.05.049. [DOI] [PubMed] [Google Scholar]
- Krook-Magnuson E, Armstrong C, Oijala M, Soltesz I. On-demand optogenetic control of spontaneous seizures in temporal lobe epilepsy. Nat Commun. 2013;4:1376. doi: 10.1038/ncomms2376. [DOI] [PMC free article] [PubMed] [Google Scholar]
- Ledri M, Nikitidou L, Erdelyi F, Szabo G, Kirik D, Deisseroth K, Kokaia M. Altered profile of basket cell afferent synapses in hyper-excitable dentate gyrus revealed by optogenetic and two-pathway stimulations. Eur J Neurosci. 2012;36:1971–1983. doi: 10.1111/j.1460-9568.2012.08080.x. [DOI] [PubMed] [Google Scholar]
- Lian J, Bikson M, Sciortino C, Stacey WC, Durand DM. Local suppression of epileptiform activity by electrical stimulation in rat hippocampus in vitro. J Physiol. 2003;547:427–434. doi: 10.1113/jphysiol.2002.033209. [DOI] [PMC free article] [PubMed] [Google Scholar]
- Lovett-Barron M, Turi GF, Kaifosh P, Lee PH, Bolze F, Sun XH, Nicoud JF, Zemelman BV, Sternson SM, Losonczy A. Regulation of neuronal input transformations by tunable dendritic inhibition. Nat Neurosci. 2012;15:423–430. S1–S3. doi: 10.1038/nn.3024. [DOI] [PubMed] [Google Scholar]
- Madisen L, Zwingman TA, Sunkin SM, Oh SW, Zariwala HA, Gu H, Ng LL, Palmiter RD, Hawrylycz MJ, Jones AR, Lein ES, Zeng H. A robust and high-throughput Cre reporting and characterization system for the whole mouse brain. Nat Neurosci. 2010;13:133–140. doi: 10.1038/nn.2467. [DOI] [PMC free article] [PubMed] [Google Scholar]
- Miles R, Tóth K, Gulyás AI, Hájos N, Freund TF. Differences between somatic and dendritic inhibition in the hippocampus. Neuron. 1996;16:815–823. doi: 10.1016/S0896-6273(00)80101-4. [DOI] [PubMed] [Google Scholar]
- Mody I, Otis TS, Staley KJ, Köhr G. The balance between excitation and inhibition in dentate granule cells and its role in epilepsy. Epilepsy Res Suppl. 1992;9:331–339. [PubMed] [Google Scholar]
- Palma E, Amici M, Sobrero F, Spinelli G, Di Angelantonio S, Ragozzino D, Mascia A, Scoppetta C, Esposito V, Miledi R, Eusebi F. Anomalous levels of Cl- transporters in the hippocampal subiculum from temporal lobe epilepsy patients make GABA excitatory. Proc Natl Acad Sci U S A. 2006;103:8465–8468. doi: 10.1073/pnas.0602979103. [DOI] [PMC free article] [PubMed] [Google Scholar]
- Sohal VS, Zhang F, Yizhar O, Deisseroth K. Parvalbumin neurons and gamma rhythms enhance cortical circuit performance. Nature. 2009;459:698–702. doi: 10.1038/nature07991. [DOI] [PMC free article] [PubMed] [Google Scholar]
- Storm JF. Action potential repolarization and a fast after-hyperpolarization in rat hippocampal pyramidal cells. J Physiol. 1987;385:733–759. doi: 10.1113/jphysiol.1987.sp016517. [DOI] [PMC free article] [PubMed] [Google Scholar]
- Tønnesen J, Sørensen AT, Deisseroth K, Lundberg C, Kokaia M. Optogenetic control of epileptiform activity. Proc Natl Acad Sci U S A. 2009;106:12162–12167. doi: 10.1073/pnas.0901915106. [DOI] [PMC free article] [PubMed] [Google Scholar]
- Traub RD, Colling SB, Jefferys JG. Cellular mechanisms of 4-aminopyridine-induced synchronized after-discharges in the rat hippocampal slice. J Physiol. 1995;489:127–140. doi: 10.1113/jphysiol.1995.sp021036. [DOI] [PMC free article] [PubMed] [Google Scholar]


