Abstract
Segmental organization along the neuraxis is a prominent feature of the CNS in vertebrates. In a wide range of fishes, hindbrain segments contain orderly arranged reticulospinal neurons (RSNs). Individual RSNs in goldfish and zebrafish hindbrain are morphologically identified. RSNs sharing similar morphological features are called segmental homologs and repeated in adjacent segments. However, little is known about functional relationships among segmental homologs. Here we investigated the electrophysiological connectivity between the Mauthner cell (M-cell), a pair of giant RSNs in segment 4 (r4) that are known to trigger fast escape behavior, and different series of homologous RSNs in r4–r6. Paired intracellular recordings in adult goldfish revealed unidirectional connections from the M-cell to RSNs. The connectivity was similar in morphological homologs. A single M-cell spike produced IPSPs in dorsally located RSNs (MiD cells) on the ipsilateral side and excitatory postsynaptic depolarization on the contralateral side, except for MiD2cm cells. The inhibitory or excitatory potentials effectively suppressed or enhanced target RSNs spiking, respectively. In contrast to the lateralized effects on MiD cells, single M-cell spiking elicited equally strong depolarizations on bilateral RSNs located ventrally (MiV cells), and the depolarization was high enough for MiV cells to burst. Therefore, the morphological homology of repeated RSNs in r4–r6 and their functional M-cell connectivity were closely correlated, suggesting that each functional connection works as a functional motif during the M-cell-initiated escape.
Keywords: escape, hindbrain segments, homologous neurons, Mauthner cell, reticulospinal neurons, vertebrate
Introduction
During early development, the vertebrate brain is comprised of the prosencephalon, mesencephalon, and rhombencephalon, which are then segmentalized along the rostrocaudal axis (Lumsden and Keynes, 1989; Rubenstein et al., 1994). The rhombencephalon comprises seven or eight segments. In a wide range of fishes (Metcalfe et al., 1986; Lee et al., 1993; Murakami et al., 2004; Bass et al., 2008; Greenwood et al., 2009), hindbrain reticulospinal neurons (RSNs) are arranged orderly in each segment. RSNs are morphologically identified in goldfish and zebrafish, and those that share common morphology and the time of appearance are repeated in adjacent segments (Mendelson, 1986; Metcalfe et al., 1986; Lee et al., 1993), and are called segmental homologs. In terms of cell position within the segment, axon pathway, and dendritic feature, most RSNs are assigned to one of the major seven classes. Segments are hypothesized to arise from duplication of ancestral segment and therefore each segment or homologous neuron may sustain basic functions (Metcalfe et al., 1986). An understanding of the RSNs functional organization may reveal functional networks controlling the behavior of fishes.
The Mauthner cells (M-cells), a pair of giant RSNs in the fourth segment (r4), trigger fast escape (C-start; Zottoli, 1977; Eaton et al., 1981) during the initial phase of which the body is bent into a C-shape. The M-cells integrate various sensory inputs (Faber et al., 1989), elicit a single spike (Nakayama and Oda, 2004; Watanabe et al., 2014), and output onto spinal motor neurons and related interneurons (Fetcho and Faber, 1988; Satou et al., 2009) to initiate C-start by contracting the contralateral trunk muscle (Hackett and Faber, 1983a; Nissanov et al., 1990). However, single M-cell spike is insufficient for entire escape, consisting of C-bend at Stage 1 and subsequent propulsion at Stage 2 (Eaton et al., 1988; Foreman and Eaton, 1993). Extracellular recordings in goldfish (Weiss et al., 2006) and Ca2+ imaging in zebrafish larvae (Gahtan et al., 2002) have suggested that other RSNs participate in C-starts, particularly segmental homologs of the M-cell, including paired MiD2cm in r5 and MiD3cm in r6 (the M-series; O'Malley et al., 1996; Liu and Fetcho, 1999). M-series Ca2+ imaging revealed MiD2cm and MiD3cm are less activated during the M-cell-triggered escape (Kohashi and Oda, 2008), indicating functional relationships between the M-cell and its homologs. Two other RSNs series in r4–r6 are also candidates: dorsally located, ipsilaterally projecting paired MiDi cells (MiM1 in r4, MiD2i in r5, and MiD3i in r6) and ventrally located, ipsilaterally projecting MiV cells (MiV1 in r4, MiV2 in r5, and MiV3 in r6), which are generated later than dorsal RSNs (Mendelson, 1986) and form 8–18 neuronal clusters in hemisegments. Investigating the M-cell and homologous RSNs connectivity may reveal functional relationships in the M-cell-initiated escape.
In this study, paired intracellular recordings of the M-cell and homologous RSNs in r4–r6 of adult goldfish revealed that there were unidirectional connections from the M-cells to RSNs and the connectivities were closely correlated with morphological homologies of the target neurons.
Materials and Methods
Animals.
Experiments were performed on adult goldfish of either sex (10–15 cm in length) at 20°C. All procedures complied with the guidelines stipulated by the Committees on Animal Research of Nagoya University and Osaka University.
Intracellular recordings.
Most procedures were similar to those previously described (Nakayama and Oda, 2004). Fish were anesthetized with 0.015% 3-aminobenzoic acid ethyl ester (MS222; Sigma-Aldrich) and immobilized with d-tubocurarine chloride (2 μg/mg body weight; Sigma-Aldrich). Additional procedures that were used in the present study are described here.
In brief, paired intracellular recordings were obtained from the M-cells and other RSNs located in r4–r6 with an Axoprobe-1A dual-channel preamplifier (Molecular Devices). Two microelectrodes were attached to manipulators (ME-70, Narishige) placed on each side of the fish. In all trials, recording microelectrodes were filled with 4 m potassium acetate (5–10 MΩ at 60 Hz) containing 1.5–5% neurobiotin (Vector Laboratories) to label recorded neurons. For locating RSNs, the axon cap of the M-cell, a neuropile surrounding the axon hillock and initial segment, was first located as a landmark with the help of an antidromically evoked large negative field potential (Fig. 1A; Furshpan and Furukawa, 1962), as previously shown (Fig. 2; Nakayama and Oda, 2004). This electrode was moved fixed distances three-dimensionally from the landmark (Fig. 2), and RSNs were located with the help of field potentials of antidromic spikes evoked by spinal cord stimulation. Next, an M-cell axon was impaled with the other electrode at the level of the facial lobe.
Figure 1.
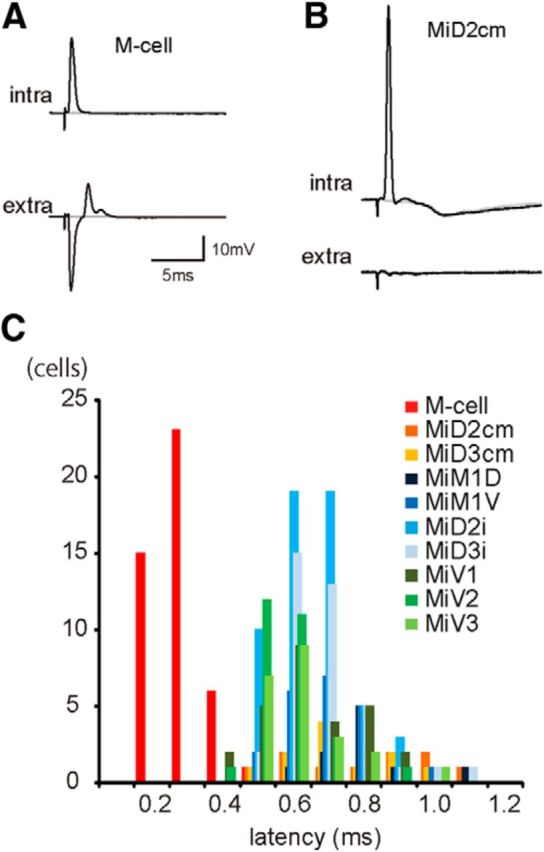
Electrophysiological identification of reticulospinal neurons in r4–r6. A, B, Antidromically evoked AP in the M-cell (A) and a MiD2cm cell (B). Top traces are intracellularly recorded APs (intra) that occurred in response to spinal cord stimulation at threshold intensities, and APs were observed in an all-or-nothing manner. Corresponding extracellular (extra) field potentials are shown below. Failures are represented by gray traces. Resting membrane potential (Erest) was −80 mV in both the M-cell and MiD2cm cell. The calibration in A is also applicable to B. C, Frequency distribution of the onset latencies of antidromic spikes from spinal stimulation. The latencies of the M-cells (red) were distinctively shorter than those of other RSNs (p < 0.001, Mann–Whitney U test): 0.29 ± 0.01 ms (mean ± SEM; range, 0.16–0.48; n = 45) in the M-cell, 0.68 ± 0.03 ms (n = 22) in MiD2cm, 0.58 ± 0.02 ms (n = 28) in MiD3cm, 0.82 ± 0.06 ms (n = 10) in MiM1D, 0.73 ± 0.04 ms (n = 11) in MiM1V, 0.64 ± 0.01 ms (n = 56) in MiD2i, 0.62 ± 0.03 ms (n = 22) in MiD3i, 0.81 ± 0.04 ms (n = 10) in MiV1, 0.63 ± 0.03 ms (n = 27) in MiV2, and 0.75 ± 0.02 ms (n = 20) in MiV3.
Figure 2.
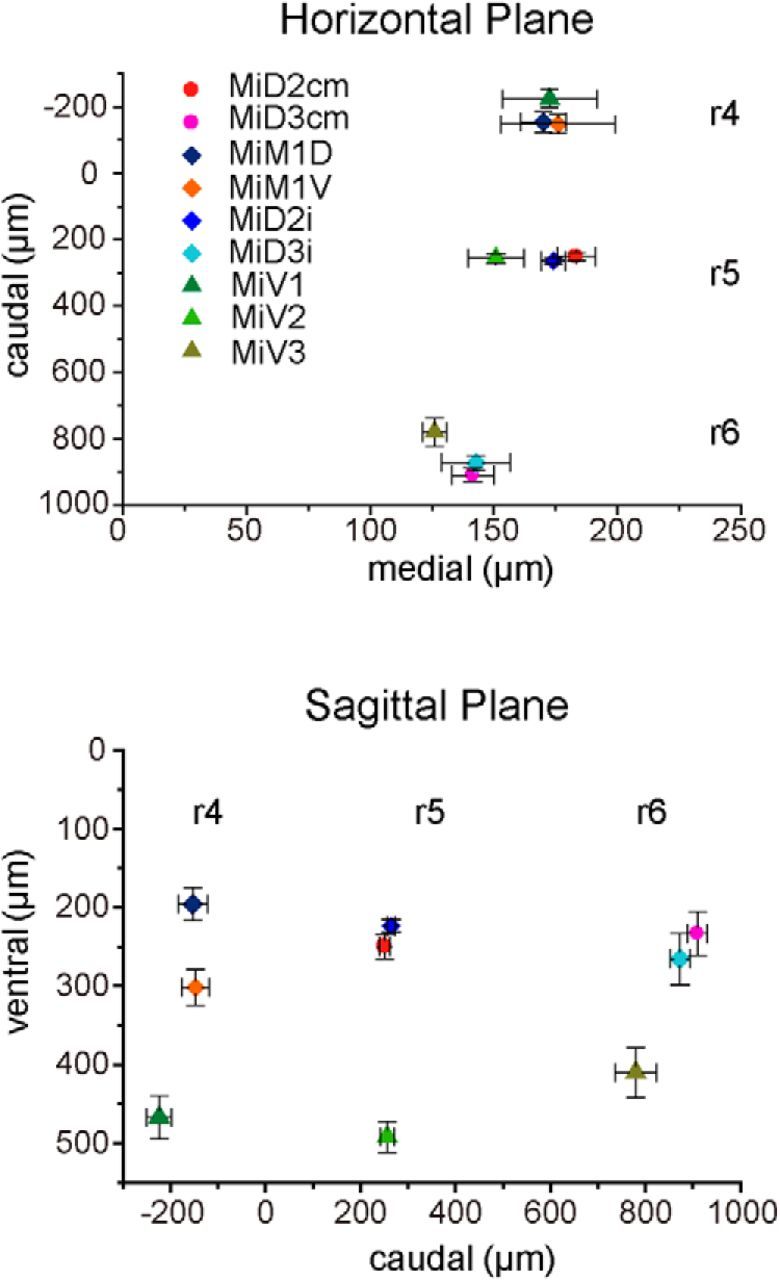
Positions of reticulospinal neurons in r4–r6 as represented by three-dimensional distances from the axon cap of the Mauthner cell. Caudomedial (top) and ventrocaudal (bottom) distances from the axon cap of the M-cell to the somata of intracellularly recorded RSNs. There were distinct spaces between RSNs in three segments (r4–r6) along the rostrocaudal and dorsoventral axes. MiD2cm cells (n = 15), MiD3cm cells (20), MiD2i cells (32), MiD3i cells (11), MiM1D cells (7), MiM1V cells (5), MiV1 cells (10), MiV2 cells (24), and MiV3 cells (10).
The M-cells and other RSNs were electrophysiologically identified by antidromic spikes, evoked because of stimulation of the caudal spinal cord (25–40 mm caudal to the recording sites), with short latencies of ∼0.3 ms and 0.4–1.0 ms, respectively (Fig. 1). To assess the synaptic connectivity between the M-cells and RSNs, one of the paired cells was activated by injecting stepwise depolarizing currents to elicit a single action potential (AP) and voltage responses were recorded from the other. The latencies of the postsynaptic potentials (PSPs) were measured as the time between the peak of presynaptic AP and the onset of PSPs. In some experiments, strychnine (Sigma-Aldrich) was injected into the body musculature (5 μg/g body weight) to block glycinergic transmission. Electrophysiological data from RSNs with resting membrane potential (Erest) ranging from −70 to −91 mV were analyzed. Traces shown in the figures were the averages of 10–30 traces in PSPs without spiking, whereas the single traces in PSPs were with spiking. PSPs were represented as subtraction of the extracellular field potentials, which were obtained from the close vicinity of the cell just after intracellular recordings, from the intracellular membrane potentials.
Intracellular labeling of RSNs.
To morphologically identify recorded neurons, neurobiotin was injected from the recording micropipette. The neurons were stained with an avidin–biotin complex (ABC) kit (Vector Laboratories) and visualized with 3′, 3′-diaminobenzidine, as described in a previous report (Nakayama and Oda, 2004). Labeled neurons were photographed with a digital CCD camera (Axiocam HRc; Zeiss) mounted on a light microscope (Axioskop; Zeiss) and reconstructed with camera lucida.
Statistical analysis.
Results were presented as mean ± SEM, unless otherwise specified. Statistical significance was assessed with nonparametric methods using the statistical software package R, version 2.15.2 (R Core Development Team). Mann–Whitney U tests or Kruskal–Wallis tests were used. p values were adjusted with the Holm's method.
Results
Electrophysiological identification of RSNs
To examine the connectivity between the M-cell and other RSNs in r4–r6, paired intracellular recordings were performed in adult goldfish. RSNs were electrophysiologically identified with antidromic AP elicited by electrical stimulation at the spinal cord (Fig. 1A,B) and morphologically by their axonal pathway, location of somata, and morphology of dendritic arbors labeled with neurobiotin (Figs. 3, 4; Lee et al., 1993). All RSNs recorded in this study were silent at rest. Electrical stimulation elicited an antidromic AP in the M-cell and RSNs in an all-or-nothing manner at the threshold intensity.
Figure 3.
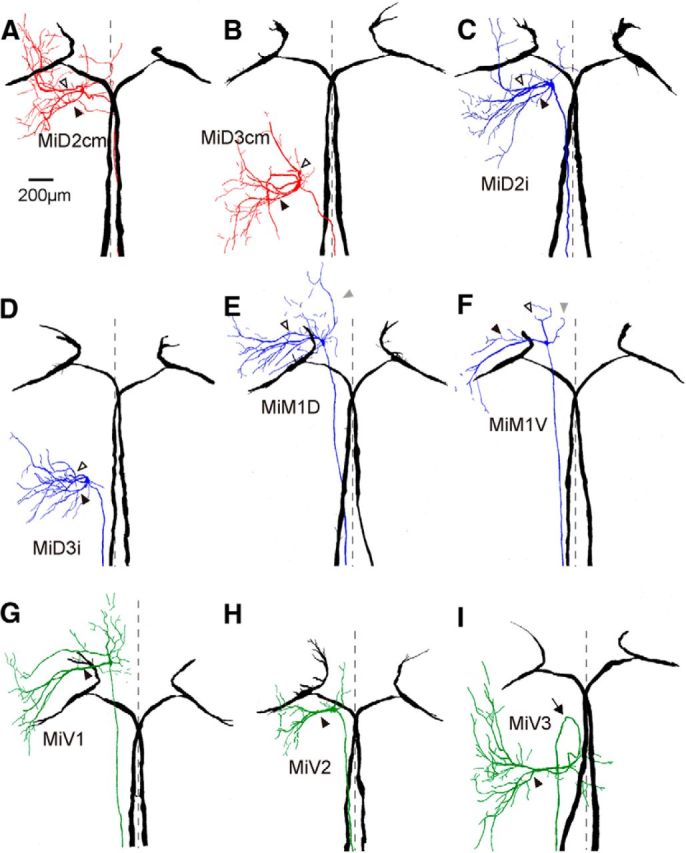
Horizontally stacked images of the Mauthner cell and reticulospinal neurons in r4–r6. Camera lucida reconstructions from serial horizontal sections of paired, recorded, and intracellularly labeled the M-cells in r4 (black) and RSNs in r4–r6. The somata of all of types of RSNs fell into tidy segments, but their dendrites protruded away from their own segments and projected to the adjacent segments. A, B, Left MiD2cm cell in r5 (A) and MiD3cm cell in r6 (B) with bilateral M-cells. Both were located dorsally and had a stem axon that projected to the contralateral spinal cord as the M-cell. Broken lines indicate the midline (same in following traces of Figs. 3, 4). Filled arrowheads indicate the lateral dendrites, and open arrowheads indicate the ventral dendrites, which is the same in the following traces in Figures 3 and 4. C, D, MiD2i cell in r5 (C) and MiD3i cell in r6 (D), which had an axon that projected to the ipsilateral spinal cord. E, F, MiM1 cells in r4, of which an axon projected to the ipsilateral spinal cord were subdivided into dorsally located MiM1D (E) and more ventrally located MiM1V cells (F): MiM1D cell possesses two main ventral dendrites that project ventrolaterally, and MiM1V cell possesses a large lateral dendrite. Both possess a rostral dendrite that projects rostroventrally (gray arrowheads). G–I, Ventrally located MiV1 cell in r4 (G), MiV2 cell in r5 (H), and MiV3 cell in r6 (I), which had an axon that projected to the ipsilateral spinal cord. These cells had a major thick lateral dendrite. Four of 10 MiV3 cells had an axon that projected rostrally and then caudally turned back (arrow). Up is rostral. The calibration in A is also applicable to B–I.
Figure 4.
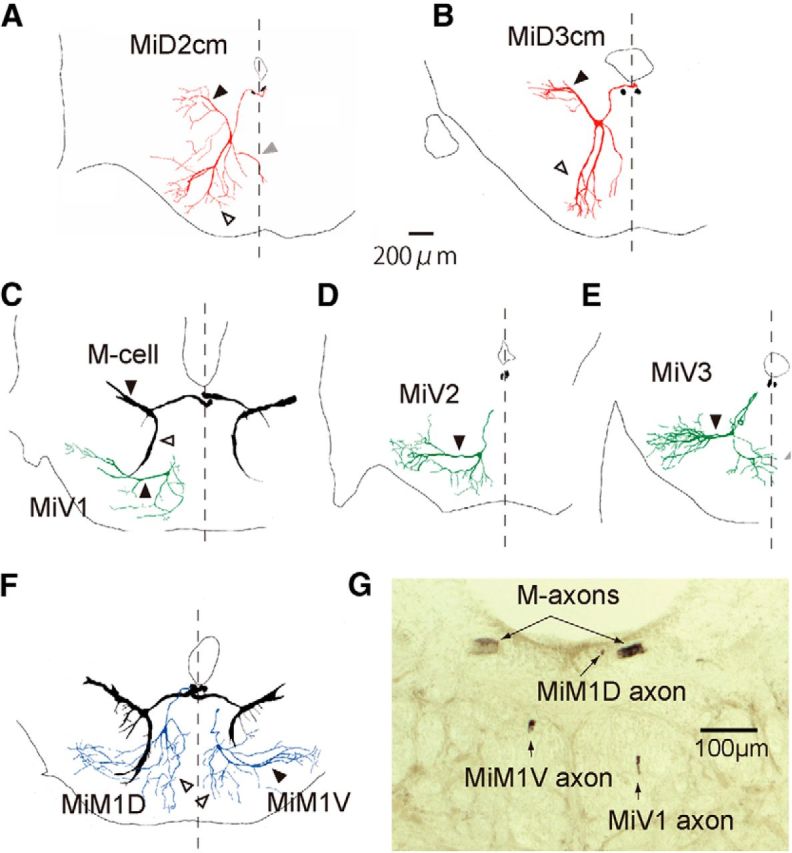
Frontally stacked images of reticulospinal neurons in r4–r6 with the Mauthner cell. Camera lucida reconstructions of rostral view from serial frontal sections of intracellularly labeled the M-cells (black) and other RSNs in r4–r6. A, B, The right MiD2cm cell in r5 (A) and MiD3cm cell in r6 (B) had an axon that dorsally projected to the dorsal bundle of the medial longitudinal fasciculus (mlfd), where the M-axon extended. Sections of bilateral M-axons are shown in black. MiD2cm cells in r5 had a medial dendrite (gray arrowheads) that extended to the midline (broken lines). C–E, Ventrally located MiV1 cell in r4 (C), MiV2 cell in r5 (D), and MiV3 cell in r6 (E) had an axon projecting to the ventral bundle of the medial longitudinal fasciculus (mlfv), which was located ventral to the M-axon. F, Simultaneous labeling of MiM1D (left) and MiM1V (right) cells with bilateral M-cells revealed the morphological differences of dendrites: the MiM1D cell possesses ventrally projecting bifurcated dendrites (open arrowhead), whereas the MiM1V cell possesses a thick lateral dendrite (filled arrowhead). Dorsal is up. The calibration in A is also applicable to B–F. G, A micrograph of the frontal section at the level of the caudal hindbrain. The MiM1D axon extended along with M-axons in the mlfd, whereas MiM1V and MiV1 axons were located in dorsal and ventral mlfv, respectively.
The onset latency of antidromic AP elicited in the M-cell by the spinal stimulation applied at 25–40 mm caudal to the hindbrain was 0.29 ± 0.01 ms (range, 0.16–0.48; Fig. 1C; p < 0.001, Mann–Whitney U test). The shortest latency of the M-cells among recorded RSNs demonstrated markedly fast conduction velocity in the M-cell axon (Table 1) and corresponded to the exceptionally large diameter of the myelinated M-axon.
Table 1.
Conduction velocities (m/s) of axons of reticulospinal neurons
| M-cell | MiD2 cm | MiD3 cm | MiM1D | MiM1V | MiD2i | MiD3i | MiV1 | MiV2 | MiV3 | |
|---|---|---|---|---|---|---|---|---|---|---|
| Mean | 117.3 | 48.3 | 52.4 | 44.7 | 47.6 | 50.7 | 47.5 | 44.8 | 51.2 | 39.1 |
| SEM | 3.2 | 1.4 | 1.5 | 3.8 | 2.9 | 0.9 | 1.5 | 2.6 | 1.2 | 1.0 |
| n | 45 | 22 | 28 | 10 | 11 | 56 | 22 | 10 | 27 | 20 |
Values were calculated from the onset latency of the antidromic AP and the distance between the spinal stimulus site and the recording site in the hindbrain.
Morphology of RSNs in r4–r6
In the present study, single intracellular labeling of recorded RSNs revealed morphological similarities and differences among the homologous neurons in more detail than that in a previous study that used retrograde labeling of the cells (Lee et al., 1993). RSNs were clearly identified as individuals, and the morphological features were highly reproducible among all animals we observed, as demonstrated in the previous studies (Kimmel et al., 1982; Metcalfe et al., 1986; Lee and Eaton, 1991; Lee et al., 1993; Gahtan et al., 2002; Gahtan and O'Malley, 2003). Locations of RSNs somata (Fig. 2), determined by calculating the distance between the axon cap of M-cell and each RSN soma in reconstructed images, showed that RSNs were segmentally arranged along the rostrocaudal axis and that dorsally located MiD cells were separated from ventrally located MiV cells. The RSNs identified previously as homologous neurons shared stereotypical similar morphology such as dorsoventral positions within the segment, the shapes of principal lateral and ventral dendrites, and axon paths into the spinal cord.
Pairs of dorsally located MiDcm and MiDi cells were repeated in r5 and r6, and had an axon that extended contralaterally and ipsilaterally, respectively. All MiD axons descended in the dorsal bundle of the medial longitudinal fasciculus (mlfd) along the medial side of the M-axon as far as observed in the hindbrain. MiD cells showed one or sometimes two primary lateral dendrites and a few ventral dendrites extending dorsolaterally and rostroventrally, respectively. Furthermore, ventral dendrites extended rostrally beyond the boundary of the segment of their soma (Fig. 3A–D) and approached the ventrolateral edge of the hindbrain (Fig. 4A,B), suggesting the possibility that they connected to the tectobulbar tract (Bartelmez, 1915; Sharma et al., 1985; Zottoli et al., 1987; Sato et al., 2007), the torobulbar tract, and/or the medial lemniscus (Yamamoto et al., 2010). MiD cells often exhibited another dendrite reaching the midline or further on the contralateral side (Figs. 3A,C, 4A), which was not described in the previous study (Lee et al., 1993).
Ventrally located clusters, identified as MiV1, MiV2, and MiV3 cells in r4, r5, and r6, respectively, consisted of ∼8–18 neurons. All MiV cells had an axon that descended ipsilaterally in the ventral medial longitudinal fasciculus (mlfv) to the spinal cord, a thick lateral dendrite, and a few short ventral dendrites (Figs. 3G,H,I, 4C,D,E), as observed in a previous report (Lee et al., 1993). In addition to the previously reported features, medial dendrites of MiV3 cells often crossed over the midline. Of interest, in some MiV3 cells (4 of 10 cells), a loop-shaped axon was observed: the axon first extended to the rostral border of r6 and then turned back to caudally descend to the spinal cord (Fig. 3I). Furthermore, one MiV3 cell of 10 had a contralaterally descending axon in the mlfv that branched from the ipsilateral main axon in the hindbrain.
In the present study, we found that MiM1 cells medioventrally located to the M-cell soma in r4 were subdivided into two intermediate types: a pair of dorsally located MiM1 cells (denoted here as MiM1D cells) and probably a pair of ventrally located MiM1 cells (denoted here as MiM1V cells; Figs. 3E,F, 4F). MiM1D cells were dorsally located (Figs. 2, 4F) and have an ipsilateral descending axon, which projected to mlfd (Fig. 4G), similar to MiDi cells; however, MiM1D cells lacked lateral dendrite that directly dorsolaterally extended from the soma as MiD2i and MiD3i cells, and they instead possessed a thick bifurcated ventral dendrite that extend ventrally and then turned laterally (Fig. 4F). MiM1V cells had an axon that descended in the ipsilateral mlfv (Fig. 4G) and lateral dendrites that were similar to those of more ventrally located MiV neurons in r4–r6 (Fig. 4F). In addition, both MiM1D and MiM1V cells had a rostral dendrite that extended mediorostrally (Fig. 3E,F). Therefore, MiM1D cells were morphologically similar to MiDi cells with some modifications, whereas MiM1V cells seemed to be rather similar to MiV cells. These two types of MiM cells seemed to be the embodiment of the dorsoventral differentiation into MiDi and MiV cells.
Together, RSNs in r4–r6 were morphologically repeated, with some divergence such as the large soma of the M-cell among the M-series, the lack of a lateral dendrite in the MiM1D cells among the MiDi series, and the loop-shaped axon of the MiV3 cells among the MiV series.
The M-cell outputs to ipsilateral MiD and MiM1D cells in r4–r6
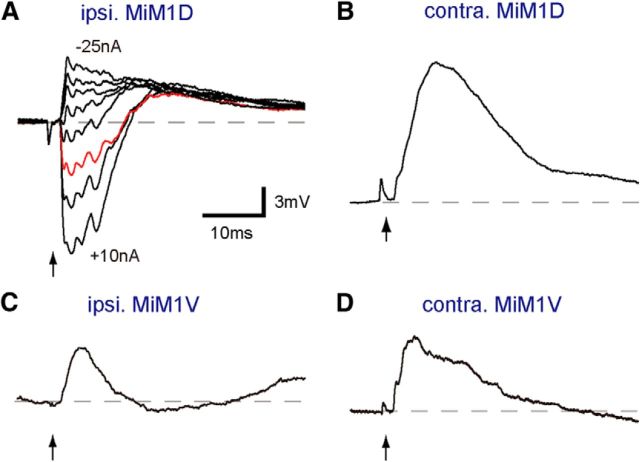
Paired recordings of the M-cell and other RSNs revealed functional connectivity between them, which was closely related to morphological similarity. The M-cell AP elicited by an intra-axonal depolarizing current pulse produced a biphasic postsynaptic response in the ipsilateral MiD cells, with an initial hyperpolarization followed by a slow prolonged depolarization (Fig. 5). Homologous neurons showed similar amplitudes of hyperpolarizations at Erest, and the amplitudes in MiDi were significantly smaller than those in MiDcm cells (Fig. 5E). Furthermore, the peak times, measured from the IPSP onset, were similar among these RSNs except for MiD2cm (Fig. 5F). The hyperpolarizing responses were enlarged in amplitude when the MiD cells were depolarized by injecting anodal currents. The amplitude of responses was reduced by injecting hyperpolarizing current and was reversed in polarity by injecting stronger hyperpolarizing currents (Fig. 5A–D), revealing that these hyperpolarizing responses were IPSPs, with the reversal potential occurring near the Erest. IPSPs were blocked by applying strychnine, indicating that they were mediated, at least in part, by glycinergic neurotransmission (Fig. 5B, bottom trace). Depolarizations persisted in strychnine. The onset latencies of IPSPs ranged from 1.0 to 1.2 ms (Table 2), suggesting chemically disynaptic inhibitory connections from the M-cell to these MiD cells. Because the M-cells are excitatory neurons and there was no morphological contact between the M-cell and ipsilateral RSNs, inhibitory interneurons were probably located in the pathways. IPSPs were followed by small depolarizations that lasted >200 ms (Fig. 5G). In addition, in some recorded MiDi cells at r5 and r6, a sharp depolarizing potential with a short latency and small amplitude preceded IPSPs (Fig. 5C,D, bottom traces). The short latencies (0.6 ± 0.03 ms, n = 7 in MiD2i; 0.7 ± 0.12 ms, n = 3 in MiD3i) with a fast time course of their potential and insensitivity to membrane polarization changes indicated that these components were mediated by gap junctions between MiDi cells and presynaptic interneurons that were innervated by the M-axon. With regard to MiM1D cells in r4, which are probably homologous to MiDi cells in r5 and r6, the M-cell delivered IPSPs to the ipsilateral MiM1D cell with a latency of 1.0 ms (n = 3), similar to ipsilateral MiD cells in r5 and r6 (see Fig. 7A).
Figure 5.
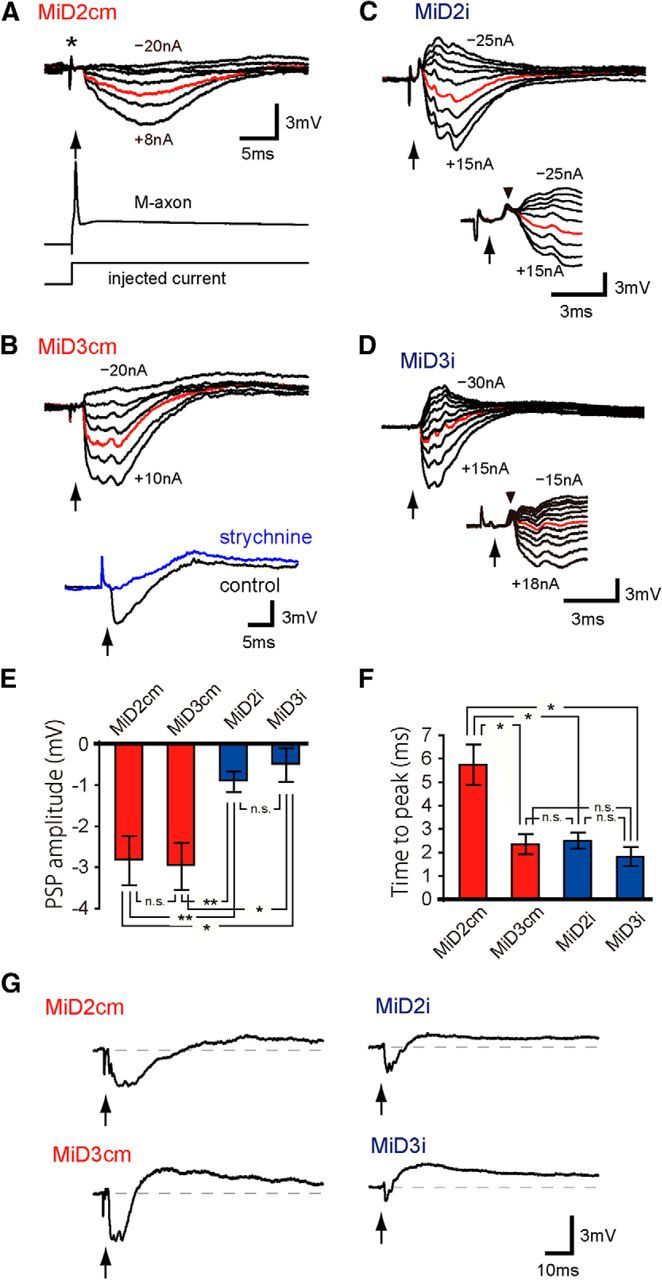
Ipsilateral connections from the Mauthner cell to MiD cells in r5 and r6. Synaptic responses evoked in MiD cells by the ipsilateral M-cell firing. A–D, Intra-axonal activation of AP in the ipsilateral M-cell axon, as exemplified in the lower trace of A, and the timing of AP peak, represented by arrows (same in the following Figs. 5–8), produced a small hyperpolarization (red) in MiD2cm with Erest of −81 mV (A), in MiD3cm at −87 mV (B), in MiD2i at −77 mV (C), and in MiD3i at −74 mV (D). The intensities of the injected currents were increased by 5 nA, except for A wherein the currents were +8, +5, 0, −5, −10, −15, and −20 nA, and the range was denoted in nanoamperes for each cell. Note that artifact potentials caused by injecting currents into the M-axon for activation, appeared in the response traces (e.g., asterisk in A) before the spike of the M-axon (arrow) in most of the traces in Figures 5–8. IPSPs were blocked by applying strychnine on the remaining slow depolarizations in the MiD3cm cell (B, bottom trace). In some MiD2i and MiD3i cells, sharp depolarizations were observed before IPSPs, as exemplified in the lower traces of C and D at Erest of −77 mV and −91 mV, respectively (upper and bottom traces were obtained in different cells in D). Amplitudes of these potentials were insensitive to the polarization of the recorded cells. E, F, Bar graphs quantifying PSP amplitudes and peak times from the onset at Erest; **p < 0.01, *p < 0.05; n.s., Not significant. G, All MiD cells showed a small long-lasting depolarization (>200 ms) after initial hyperpolarization. The calibration in A is also applicable to top traces in B–D.
Table 2.
Synaptic latencies from the Mauthner cells spike to each reticulospinal neuron
| Latencies (ms) |
||||
|---|---|---|---|---|
| Ipsilateral | n | Contralateral | n | |
| MiD2cm | 1.1 ± 0.04 | 6 | 2.0 ± 0.05 | 6 |
| MiD3cm | 1.1 ± 0.08 | 6 | 2.4 ± 0.10 | 10 |
| MiM1D | 1.0 ± 0.03 | 4 | 1.4 ± 0.15 | 3 |
| MiM1V | 1.3 ± 0.08 | 3 | 1.1 ± 0.07 | 5 |
| MiD2i | 1.1 ± 0.03 | 23 | 1.3 ± 0.14 | 9 |
| MiD3i | 1.1 ± 0.06 | 6 | 1.5 ± 0.07 | 8 |
| MiV1 | 1.3 ± 0.06 | 4 | 1.2 ± 0.10 | 4 |
| MiV2 | 1.4 ± 0.05 | 9 | 1.5 ± 0.12 | 7 |
| MiV3 | 1.0 ± 0.03 | 5 | 0.9 ± 0.05 | 8 |
Values were measured from the peak of the M-cell spike to the onset of the synaptic potential for each RSN (mean ± SEM; n = number of cells).
Figure 7.
Subtypes of MiM1 cells receiving different inputs from the Mauthner cell. Postsynaptic responses were elicited in bilateral MiM1D and MiM1V cells by the M-cell firing. An AP of the M-cell (arrows) produced hyperpolarization, followed by depolarization with Erest of −80 mV (red) in an ipsilateral MiM1D (A), whereas only depolarization was produced in a contralateral MiM1D cell at Erest of −79 mV (B). The initial hyperpolarizing response observed in MiM1D cells was sensitive to the currents passing through the micropipette (−25, −20, −15, −10, −5, +5, +10 nA). C, D, Initial depolarizations at Erest of −74 mV were bilaterally recorded in MiM1V cells. The calibration in A is also applicable to B–D.
These results demonstrated that disynaptic inhibitory connections from the M-cell to ipsilateral dorsally located RSNs were repeated in the adjacent segments (r4–r6) with a preceding small excitation in some MiDi cells.
The M-cell outputs to contralateral MiD and MiM1D cells in r4–r6
In contrast to ipsilateral MiD and MiM1D cells, long-lasting (>200 ms) depolarizations were elicited in the contralateral MiD (Fig. 6B–D) and MiM1D (Fig. 7B) cells in r4–r6. The onset latencies of the responses (Table 2) suggested that they were mediated by disynaptic or polysynaptic pathways from the M-cell. A short hyperpolarization with latency of 2.0 ± 0.05 ms (n = 6) was evoked in MiD2cm only, and it was followed by a slow depolarization (Fig. 6A), similar to ipsilateral MiD2cm. The depolarizations in MiDi cells were similar in shape, and peak time from the onset was significantly shorter than that in MiD3cm cells (Fig. 6E,F).
Figure 6.
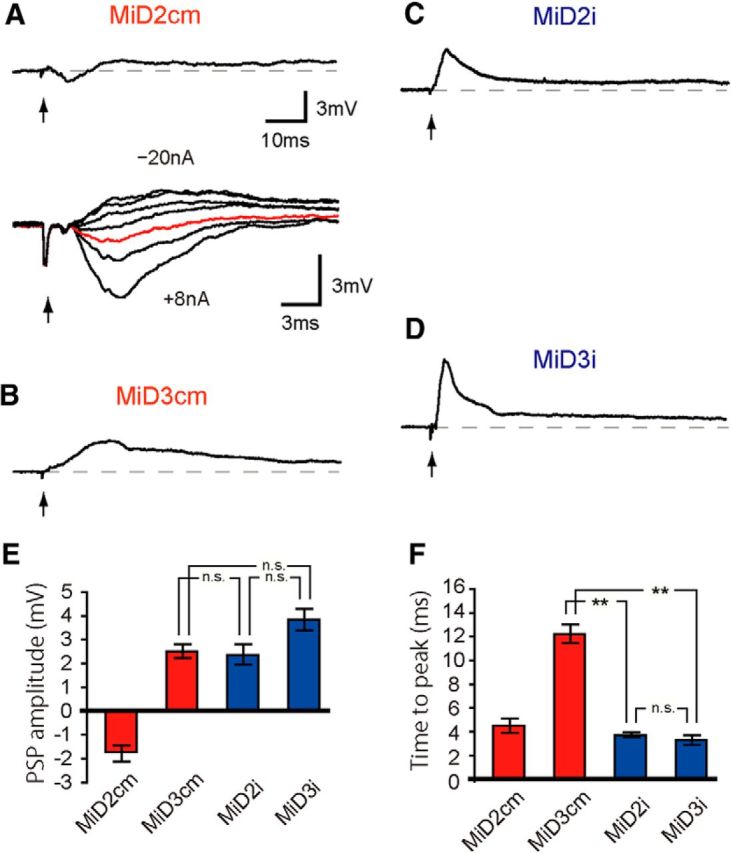
Contralateral connections from the Mauthner cell to MiD cells in r5 and r6. An AP of the M-cell produced long-lasting depolarization in MiD cells on the contralateral side, whereas short hyperpolarization preceded the depolarization only in MiD2cm, with Erest of −80 mV for MiD2cm (A), −78 mV for MiD3cm (B), −83 mV for MiD2i (C), and −75 mV for MiD3i (D), respectively. Depolarizations evoked in MiD2i and MiD3i were similar in shape. The initial hyperpolarizing response observed in MiD2cm cell was changed in amplitude and reversed in polarity when the cell was polarized (−20, −15, −10, −5, +5, +8 nA; A, bottom). Red trace is the response at Erest. The calibration for top trace of A is applicable to B–D. E, F, Bar graphs quantifying PSP amplitudes and peak times from the onset at Erest; **p < 0.01, *p < 0.05; n.s., Not significant.
Thus, the connectivity from the M-cell to contralateral MiD and MiM1D cells was excitatory and contrasted to that of the ipsilateral MiD cells, and these excitatory connections were similar (duplicated) in r4–r6, with the exception of MiD2cm.
The M-cell outputs to MiV cells in r4–r6 and MiM1V cells in r4
In stark contrast to dorsally located MiD cells, strong excitation was elicited in ventrally located MiV cells in r4–r6 on both sides by M-cell firing. A single AP of the M-cell produced bursts of bilateral MiV1, MiV2, and MiV3 cells (Fig. 8). The underlying PSPs, which were observed by hyperpolarizing the recorded cells (Fig. 8C,D, bottom traces), showed onset latencies that ranged from 0.9 to 1.5 ms (Table 2), indicating disynaptic excitatory connections from the M-cell to MiV cells in r4–r6. The symmetrical strong excitatory connectivity from the M-cell to MiV cells was repeated through r4–r6. However, there was a modification in the connectivity to MiV2 cells. Long-lasting depolarizations were observed in MiV2 cells in r5 (Fig. 8C,D), whereas hyperpolarization followed after initial depolarization in MiV1 cells in r4 and MiV3 cells in r6 (Fig. 8A,B,E,F).
Figure 8.
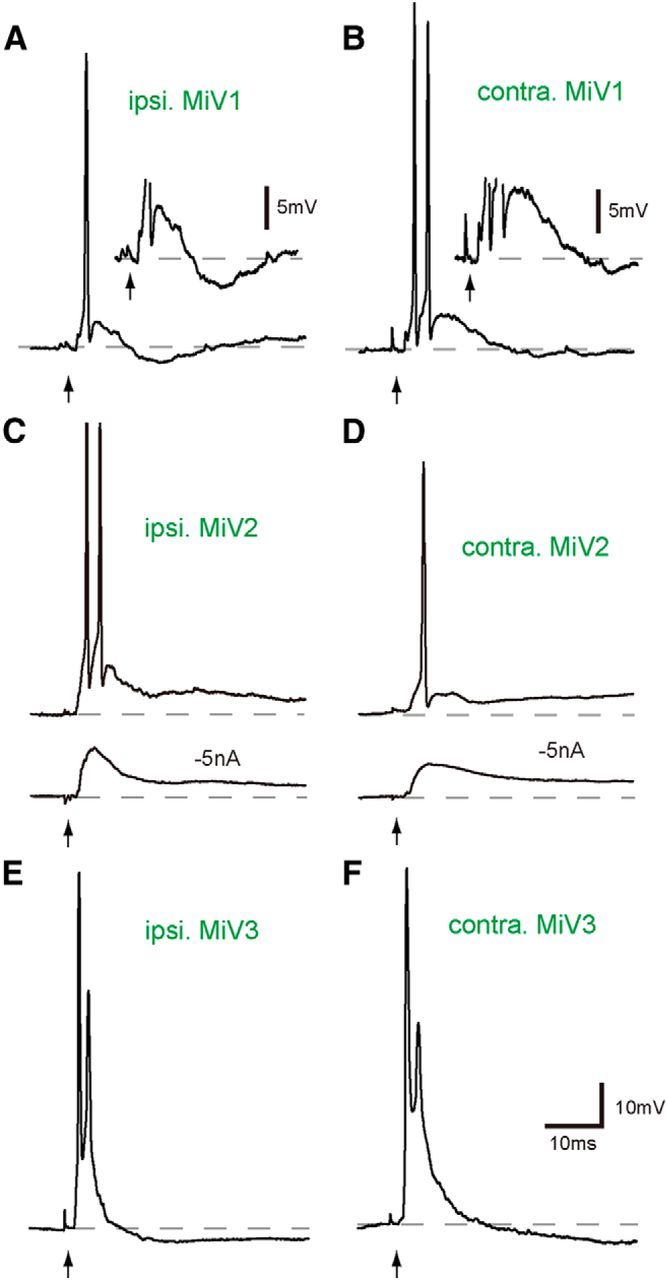
Strong excitatory outputs from the Mauthner cell to bilateral MiV cells in r4–r6. A–F, Activation of the M-cell (arrows) produced strong depolarizing responses with spiking in bilateral MiV1, MiV2, and MiV3 cells (A, C, E, ipsilateral; B, D, F, contralateral). Action potentials were followed by hyperpolarization in bilateral MiV1 (A, B, insets; calibration of 5 mV) and MiV3 cells, whereas long-lasting depolarizations were observed in bilateral MiV2 cells. Erest were as follows: A, −71 mV; B, −82 mV; C, −73 mV; D, −76 mV; E, −74 mV; F, −81 mV. Underlying depolarizing potentials were shown by hyperpolarizing the cell (−5 nA) in bottom traces of C and D. The calibration in F is also applicable to A–E.
In addition, the M-cell also provided symmetrical excitation to bilateral MiM1V cells, but it was not enough to elicit spiking (Fig. 7C,D), supporting the idea that MiM1 cells were also functionally segregated into MiDi-type MiM1D cells and MiV-type MiM1V cells with respect to the connectivity with the M-cell.
Single spiking of the M-cell was strong enough to suppress or increase the firing activity of MiD and MiV cells
RSNs are thought to be involved in various motor activities, including escape (O'Malley et al., 1996; Gahtan et al., 2002; Weiss et al., 2006; Kohashi and Oda, 2008), optomotor response (Orger et al., 2008; Huang et al., 2013), swimming (Ahrens et al., 2013; Kimura et al., 2013), and hatching (Eaton et al., 1977). Next, we determined where and how spiking of these RSNs was effectively modified when the M-cell was fired to initiate fast escape. To examine this, we assessed the effects of the M-cell firing on spiking in RSNs elicited by intracellular injections of depolarizing current (Fig. 9). Repetitive firing of MiD cells (Nakayama and Oda, 2004) was suppressed for ∼10–50 ms, and this was followed by brief rebound excitation after a single AP of the ipsilateral M-cell (Fig. 9A–D). The duration of spike suppression depended on the firing frequency of RSNs before the M-cell spike (Fig. 9C), but spiking was definitely blocked for at least 8 ms after the M-cell firing. In contrast, spiking of MiD3cm, MiD2i, and MiD3i cells on the contralateral side was intensively enhanced for ∼10 ms after a single AP of the M-cell (Fig. 9D, right) and slightly for the following long period. Thus, the M-cell sends bilateral asymmetrical outputs to dorsally located MiD cells, except for MiD2cm, to which there are symmetrical inhibitory outputs, as expected from PSPs elicited by the M-cell. In contrast, the activation of the M-cell exerted a strong impact on bilateral MiV cells, inducing an initial burst at an extremely high-frequency (up to 300–500 Hz) in r4–r6 MiV cells with subsequent moderate, long-lasting enhancements of spiking in MiV2 cells (Fig. 9E,F) or strong suppression in MiV1 and MiV3 cells (Fig. 9G,H).
Figure 9.
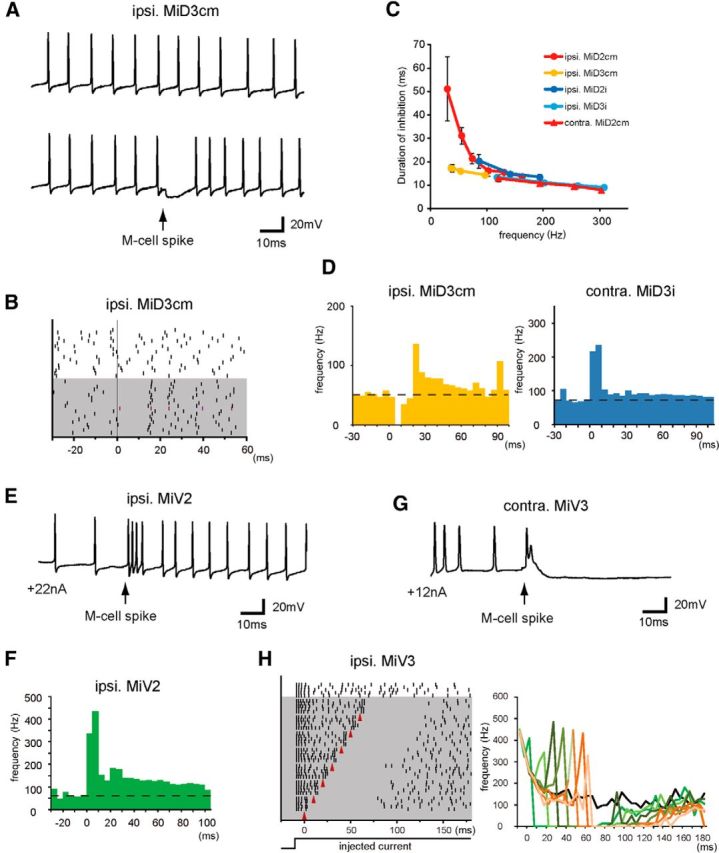
Effects of the Mauthner cell spiking on the bursting of bilateral MiD and MiV cells. A, Repetitive firings of an MiD3cm induced by injecting depolarizing current (top trace, +22 nA) were temporally suppressed (bottom trace) after spiking of the ipsilateral M-cell (arrow). B, Raster plots showing the timing of the spikes in the MiD3cm cell shown in A without (white) and with (gray) the M-cell spike elicited at 0 ms. C, Durations of inhibition (ms) plotted against the base line firing rate (Hz; mean ± SD). The numbers of responses were 18–43 in ipsilateral MiD2cm, 17–40 in ipsilateral MiD3cm, 17–28 in ipsilateral MiD2i, 16–19 in ipsilateral MiD3i, and 12–22 in contralateral MiD2cm. D, Peristimulus time histograms (PSTHs) showing the averaged frequency of each spike of an MiD3cm cell on the ipsilateral side and an MiD3i cell on the contralateral side in response to the M-cell spike elicited at 0 ms (bin size was 5 ms). Firings of the ipsilateral MiD3cm cell was temporally stopped and enhanced later by a single spike of the M-cell (40 responses), whereas transient activation was elicited in the contralateral MiD3i cell (27 responses). E, Firing of an MiV2 cell was strongly enhanced after a single spike of the ipsilateral M-cell (arrow). F, PSTH represents the average frequency of AP of an ipsilateral MiV2 cell (bin size was 5 ms, 14 responses) in response to the M-cell spike at 0 ms. G, Firings of an MiV3 cell was instantaneously enhanced when the contralateral M-cell was fired (arrow), followed by a long-lasting suppression of activity. H, Raster plots (left) showing the effects of the M-cell firing (red arrowheads in gray area) on an ipsilateral MiV3. Transient enhancements and the following suppression of spiking were observed after the M-cell firing was applied at any phase of the MiV3 firing elicited by injected step depolarizing currents (bottom). Instantaneous change in the firing frequency of the MiV3 cell for each response (right) is shown in a different color.
Together with these effects on RSNs in r4–r6, these findings suggested that when one of the paired M-cell was fired to initiate escape, spiking activation was transiently suppressed in ipsilateral MiD cells and moderately facilitated in contralateral MiD cells, with the exception of MiD2cm cells. In contrast, MiV cells located on both sides in r4–r6 received symmetrical and long-lasting effects.
No inputs from RSNs to the M-cell
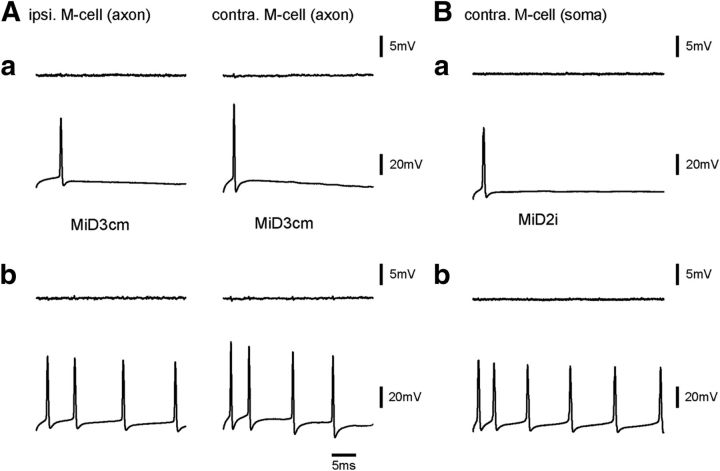
All of these data showed that there were functionally effective connections from the M-cell to RSNs in r4–r6. We next asked whether there are functional connections in the reciprocal direction, by recording from the M-cell while evoking spikes in RSNs. Neither single nor multiple spikes of any RSNs in r4–r6 elicited postsynaptic responses in the M-cell axon (Fig. 10A). The lack of synaptic potentials in the M-cell axon may have been due to the electrotonic reduction of synaptic potentials during propagation from peripheral synaptic sites to the soma. However, this seemed unlikely because excitatory PSPs elicited by the stimulation of pVIIIn (n = 40, data not shown) or the posterior lateral line nerve (n = 34, data not shown) in a distal lateral dendrite of the M-cell could be detected in the axon and the soma of the M-cell. This was confirmed by the recordings in the M-cell soma, which showed no voltage changes elicited by firing of MiD2i (Fig. 10B) or MiV2 cells. Therefore, we concluded that there were no apparent connections from RSNs in r4–r6 to the M-cell and that functional connections between them were unidirectional from the M-cell to RSNs in r4–r6.
Figure 10.
No inputs from reticulospinal neurons to the Mauthner cell. A, Single (Aa) or multiple (Ab) spikes of MiD3cm cells (bottom) induced by injecting step depolarizing currents did not elicit any apparent bilateral potential responses in the M-cell axons (top: left, ipsilateral; right, contralateral). B, No synaptic response was observed in the soma of the M-cell after single (Ba) or multiple (Bb) spiking of a contralateral MiD2i cell.
Discussion
The present study revealed unidirectional connections from the M-cell in r4 to RSNs in r4–r6 in goldfish hindbrain (Fig. 11A). Because the M-cell is thought to be cholinergic (Day et al., 1983; Hanneman et al., 1988; Hanneman and Westerfield, 1989), the M-cell neurotransmission is susceptible to bath-applied tubocurarine in zebrafish (Koyama et al., 2011). However, in goldfish, the M-cell synaptic transmission remains functional after intramuscular anesthetization with tubocurarine (Furukawa and Furshpan, 1963; Fetcho and Faber, 1988; Waldeck et al., 2000), which probably does not cross the blood–brain barrier (Cohen, 1963). Nevertheless, goldfish hindbrain RSNs are quite similarly identified as those in zebrafish. We have determined the functional connectivity from the M-cell to RSNs in the goldfish hindbrain. Together with zebrafish findings, we can better understand cellular mechanisms underlying M-cell-triggered behaviors.
Figure 11.
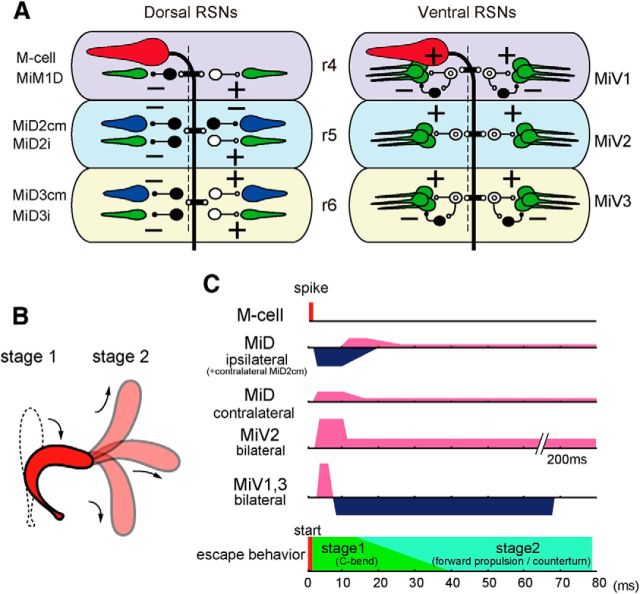
Escape circuitry from the Mauthner cell to reticulospinal neurons constructed in r4–r6. A, Schematic representation of the circuits from the left M-cell to dorsally (left) and ventrally located (right) RSNs. The output of the M-cell was excitatory (possibly cholinergic, red), presumably, MiD2cm and MiD3cm cells were glycinergic (blue), and MiM1D, MiDi, and MiV cells were glutamatergic (green). Presumable interneurons between the M-cell and RSNs are represented as open (excitatory) and filled (inhibitory) symbols. + and −: excitatory and inhibitory synapse, respectively. B, Goldfish escape behavior. Silhouettes of C-bend at Stage 1 and subsequent propelling to various directions at Stage 2. C, Time course of effects of an M-cell firing on the RSNs represented on phases of C-start. The C-bend initiates ∼8 ms after the M-cell activation but here, the timing of both M-cell spike and the C-bend initiation are set at 0 ms. Excitations are denoted in pink and inhibitions in blue. The duration of asymmetrical outputs from MiD cells corresponded to the Stage 1 of escape, whereas that of symmetrical outputs from MiV cells lasted until Stage 2.
Of note, connectivity clearly depended on the morphological homology of the targets and was almost duplicated in r4–r6. The M-cell delivered bilaterally opposing inputs to dorsally located MiD and MiM1D cells, except for MiD2cm, and delivered bilateral symmetrical inputs to ventrally located MiV and MiM1V cells. These results suggested that morphologically homologous RSNs share homologous connectivity with a higher neuron (M-cell) and that RSNs comprise functional modules in the hierarchically organized motor control network. Similar shapes of PSPs elicited in each group of RSNs by the M-cell spiking suggest that similar interneurons specific for each group are interposed between them. Because IPSPs from the M-cell to ipsilateral MiD cells were blocked by strychnine (Fig. 5B), interneurons were possibly glycinergic neurons involved in stripes that extending rostrocaudally throughout the hindbrain as in larval zebrafish (Kinkhabwala et al., 2011). The interneurons between the M-cell and RSNs, presumably including glycinergic McCoLA (Moly and Hatta, 2011) and cranial relay neurons (T interneurons in zebrafish; Hackett and Faber, 1983a,b; Hackett and Buchheim, 1984; Kimmel et al., 1985; Waldeck et al., 2000; Koyama et al., 2011), remain to be identified to elucidate complete circuits for the M-cell-triggered behaviors.
Different roles in the control of escape behaviors between dorsal and ventral hindbrain RSNs
Goldfish C-start escape consists of a fast C-shaped body bend (C-bend) during the initial 15–40 ms at Stage 1 and a subsequent forward propulsion, which is accompanied by a direction change in Stage 2, producing a wide range of escape trajectories (Fig. 11B; Eaton et al., 1988; Foreman and Eaton, 1993). For sound-evoked C-start, a single M-cell spike is associated with initiation of C-bend to the contralateral side (Zottoli, 1977; Eaton et al., 1981; Kohashi and Oda, 2008). Activities of MiD cells, which also receive excitatory inputs from auditory nerve (Nakayama and Oda, 2004), and MiV cells, which do not receive strong auditory inputs as MiD cells (unpublished observation), are strongly modified by M-cell firing. Considering the time lag between firing of RSNs and escape behavior (8 ms in the case of M-cell; Weiss et al., 2006), the time course of PSPs and resulting firing of RSNs evoked by M-cell suggest functional roles of RSNs in control of the different motions of M-cell-initiated escape, such as C-bend, forward propulsion, and direction change. The multiunit recordings in hindbrain from the descending axons of the brainstem escape network, which includes the homologs, predict whether or not there is a direction change (Weiss et al., 2006). The M-cell connectivity with dorsally located RSNs, as shown in the present study, suggests that a single M-cell spiking suppresses activity in ipsilateral MiD cells for 10–50 ms and enhances activity in contralateral MiD cells for ∼10 ms during Stage 1. Asymmetric M-cell output onto bilateral MiM1D in r4 and MiD cells in r5 and r6, except for MiD2cm, may contribute to the lateralized spinal cord neuron activation to trigger fast trunk C-bend during Stage 1 (Fig. 11C). In zebrafish, backfilling and transgenic labeling studies has suggested that contralaterally projecting MiD2cm and MiD3cm are glycinergic (Barreiro-Iglesias et al., 2013; Moly et al., 2014) and ipsilaterally projecting MiDi cells are glutamatergic (Kinkhabwala et al., 2011; Kimura et al., 2013). If this is the case in goldfish, inhibitory M-cell effects on ipsilateral MiDi and MiD3cm cells may disfacilitate ipsilateral spinal neurons but disinhibit contralateral neurons, respectively. In contrast, excitatory effects on contralateral MiDi and MiD3cm cells may excite contralateral spinal neurons and inhibit ipsilateral neurons, respectively, enhancing the lateralized activity of spinal cord neurons. Rebound activity of ipsilateral MiD cells followed by IPSPs may contribute to body stretching (or counterturn in zebrafish) after initial C-bend. In contrast, MiD2cm cells that receive inhibitory inputs from the bilateral M-cells during Stage 1, have axonal arbors that project bilaterally to the spinal cord (Gahtan and O'Malley, 2003), suggesting their involvement in bilateral motor control through disinhibition.
All MiV cells received strong bilateral excitation from the M-cell during the initial phase of Stage 1. Then strong inhibition occurred from the middle of Stage 1 to Stage 2 in MiV1 and MiV3 cells, whereas long-lasting excitation lasted over Stage 2 in MiV2 cells (Figs. 9E–H, 11C). It has been shown in zebrafish that activity of MiV cells correlated to swimming rhythm (Ahrens et al., 2012; Kimura et al., 2013), and MiV cells' ablation eliminates visually induced turns toward the ablated side (Orger et al., 2008; Huang et al., 2013). MiV cells are a part of alx-positive neurons, which belong to the medial stripe in several glutamatergic stripes rostrocaudally distributing from the hindbrain to the spinal cord (Kinkhabwala et al., 2011). Spinal alx neurons provide direct excitatory signals to motor neurons in zebrafish (Kimura et al., 2006). Therefore, we assume that MiV cells may also be associated in controlling swimming in goldfish. If so, initial strong excitation may reset the bilateral swimming rhythm at Stage 1 (Jayne and Lauder, 1993; Svoboda and Fetcho, 1996), and the subsequent long-lasting activity may be involved in the Stage 2 propulsion force in goldfish or burst swimming in zebrafish after the M-cell-triggered C-bend. In lamprey, similar depolarizing plateau potentials in RSNs, induced by activation of nonselective cation channels, are associated with swimming (Viana Di Prisco et al., 2000). Thus, long-lasting depolarization elicited in MiV cells may contribute to forward propulsion with or without counterturn and swimming after C-bend by sending sustained excitation to the spinal cord.
Various interneurons and motor neurons that express specific transcription factors have been identified along the dorsoventral axis in the spinal cord (Arber, 2012), and they are activated differently at different locomotor speed (McLean et al., 2007, 2008; Liao and Fetcho, 2008; McLean and Fetcho, 2009; Talpalar et al., 2013). To elucidate individual RSNs practical function in C-start, fast swimming or slow swimming of zebrafish or goldfish, RSNs connectivity onto spinal neurons needs to be determined.
Segmental homology and diversity
Segmentation is a CNS feature of invertebrates and vertebrates, and both are controlled by segmentation genes (Schneider-Maunoury et al., 1998; Cobourne, 2000; Philippidou and Dasen, 2013). Of note, homologous neurons are observed repeatedly in adjacent segments of vertebrate hindbrain (Metcalfe et al., 1986; Clarke and Lumsden, 1993; Lee et al., 1993) and invertebrate ganglions (Simmons, 1977; Mittenthal and Wine, 1978; Wilson, 1979; Shafer and Calabrese, 1981; Davis, 1983; Pearson et al., 1985), suggesting common pattern formation and functional relevance. Variations between segmental homologs may reflect in part segment-specific extrinsic and intrinsic information. Previously, morphological and developmental duplication of RSNs in hindbrain has suggested that segments evolved from one another by duplication and divergence (Metcalfe et al., 1986). In addition to repeated appearance of similar neurons in adjacent segments, intersegmental interactions may be essential for controlling coordinated movements. For instance, sectioning the hindbrain segments disrupts coordinated rhythmic activity that influences brainstem respiratory control in chick (Fortin et al., 1995; Coutinho et al., 2004), and trigeminal motor neurons in r2 and r3 innervate jaw-closers and -openers, respectively, in zebrafish and chick (Higashijima et al., 2000; Prin et al., 2005). The present study is the first report to show neuronal organization of intersegmental interaction in vertebrates for M-cell-triggered behaviors, as suggested in invertebrate crayfish ganglion for coordinated swimming with intersegmental homologous neurons (Smarandache et al., 2009).
Our study revealed that similar connectivity from the M-cell to RSNs in r4–r6 reflects the segmental homology of target RSNs. The connectivity is, however, not a perfect copy of one segment because there are some homologous modifications such as bilateral inhibition onto only MiD2cm in MiDcm cells and no inhibition after firing only in MiV2 in MiV cells. Morphological divergences are also found, such as extraordinarily large M-cells, two types of MiM1 cells, and the loop-shaped axon of MiV3 cells. Similarly, functional specialization among segmentally homologous neurons occurs in locust auditory interneurons (Pearson et al., 1985) or motor neurons (Wilson and Hoyle, 1978). Repetition and divergence among segmental homologous neurons may be important for preadaptation to gain new functional components or acclimatize to new environments.
The next challenges are determining how these connections function during the actual M-cell-triggered escape with multiphoton imaging or optogenetic techniques in zebrafish and determining how the connectivity is modified by environment or learning and memory.
Footnotes
This work was supported by Grants-in-Aid for Scientific Research (KAKENHI, 11168216, 17023029, 18300134, 23115508, 25115713) from the Ministry of Education, Cultures, Sports, Science, and Technology of Japan. We thank Drs S. Takagi, Y. Takeuchi, M. Tanimoto, and T. Watanabe for helpful comments.
The authors declare no competing financial interests.
References
- Ahrens MB, Li JM, Orger MB, Robson DN, Schier AF, Engert F, Portugues R. Brain-wide neuronal dynamics during motor adaptation in zebrafish. Nature. 2012;485:471–477. doi: 10.1038/nature11057. [DOI] [PMC free article] [PubMed] [Google Scholar]
- Ahrens MB, Orger MB, Robson DN, Li JM, Keller PJ. Whole-brain functional imaging at cellular resolution using light-sheet microscopy. Nat Methods. 2013;10:413–420. doi: 10.1038/nmeth.2434. [DOI] [PubMed] [Google Scholar]
- Arber S. Motor circuits in action: specification, connectivity, and function. Neuron. 2012;74:975–989. doi: 10.1016/j.neuron.2012.05.011. [DOI] [PubMed] [Google Scholar]
- Barreiro-Iglesias A, Mysiak KS, Adrio F, Rodicio MC, Becker CG, Becker T, Anadón R. Distribution of glycinergic neurons in the brain of glycine transporter-2 Tg (glyt2:gfp) transgenic adult zebrafish: relation with brain-spinal descending systems. J Comp Neurol. 2013;521:389–425. doi: 10.1002/cne.23179. [DOI] [PubMed] [Google Scholar]
- Bartelmez GW. Mauthner's cell and the nucleus motorius tegmenti. J Comp Neurol. 1915;25:87–128. doi: 10.1002/cne.900250105. [DOI] [Google Scholar]
- Bass AH, Gilland EH, Baker R. Evolutionary origins for social vocalization in a vertebrate hindbrain-spinal compartment. Science. 2008;321:417–421. doi: 10.1126/science.1157632. [DOI] [PMC free article] [PubMed] [Google Scholar]
- Clarke JD, Lumsden A. Segmental repetition of neuronal phenotype sets in the chick embryo hindbrain. Development. 1993;118:151–162. doi: 10.1242/dev.118.1.151. [DOI] [PubMed] [Google Scholar]
- Cobourne MT. Construction for the modern head: current concepts in craniofacial development. J Orthod. 2000;27:307–314. doi: 10.1093/ortho/27.4.307. [DOI] [PubMed] [Google Scholar]
- Cohen EN. blood–brain barrier to d-tubocurarine. J Pharmacol Exp Ther. 1963;141:356–362. [PubMed] [Google Scholar]
- Coutinho AP, Borday C, Gilthorpe J, Jungbluth S, Champagnat J, Lumsden A, Fortin G. Induction of a parafacial rhythm generator by rhombomeres 3 in the chick embryo. J Neurosci. 2004;24:9383–9390. doi: 10.1523/JNEUROSCI.2408-04.2004. [DOI] [PMC free article] [PubMed] [Google Scholar]
- Davis NT. Serial homologies of the motor neurons of the dorsal intersegmental muscles of the cockroach, Periplaneta americana (L.) J Morphol. 1983;176:197–210. doi: 10.1002/jmor.1051760208. [DOI] [PubMed] [Google Scholar]
- Day JW, Hall DH, Hall LM, Bennett MV. α-Bungarotoxin labeling and acetylcholinesterase localization at the Mauthner fiber giant synapse in the hatchetfish. J Neurosci. 1983;3:272–279. doi: 10.1523/JNEUROSCI.03-02-00272.1983. [DOI] [PMC free article] [PubMed] [Google Scholar]
- Eaton RC, Farley RD, Kimmel CB, Schabtach E. Functional development in the Mauthner cell system of embryos of the zebra fish. J Neurobiol. 1977;8:151–172. doi: 10.1002/neu.480080207. [DOI] [PubMed] [Google Scholar]
- Eaton RC, Lavender WA, Wieland CM. Identification of Mauthner-initiated response patterns in goldfish: evidence from simultaneous cinematography and electrophysiology. J Comp Physiol. 1981;144:521–531. doi: 10.1007/BF01326837. [DOI] [Google Scholar]
- Eaton RC, DiDomenico R, Nissanov J. Flexible body dynamics of the goldfish C-start: implications for reticulospinal command mechanisms. J Neurosci. 1988;8:2758–2768. doi: 10.1523/JNEUROSCI.08-08-02758.1988. [DOI] [PMC free article] [PubMed] [Google Scholar]
- Faber DS, Fetcho JR, Korn H. Neuronal networks underlying the escape response in goldfish: general implications for motor control. Ann N Y Acad Sci. 1989;563:11–33. doi: 10.1111/j.1749-6632.1989.tb42187.x. [DOI] [PubMed] [Google Scholar]
- Fetcho JR, Faber DS. Identification of motoneurons and interneurons in the spinal network for escapes inhibited by the Mauthner cell in goldfish. J Neurosci. 1988;8:4192–4213. doi: 10.1523/JNEUROSCI.08-11-04192.1988. [DOI] [PMC free article] [PubMed] [Google Scholar]
- Foreman MB, Eaton RC. The direction change concept for reticulospinal control of goldfish escape. J Neurosci. 1993;13:4101–4113. doi: 10.1523/JNEUROSCI.13-10-04101.1993. [DOI] [PMC free article] [PubMed] [Google Scholar]
- Fortin G, Kato F, Lumsden A, Champagnat J. Rhythm generation in the segmented hindbrain of chick embryos. J Physiol. 1995;486:735–744. doi: 10.1113/jphysiol.1995.sp020849. [DOI] [PMC free article] [PubMed] [Google Scholar]
- Furshpan EJ, Furukawa T. Intracellular and extracellular responses of the several regions of the Mauthner cell of the goldfish. J Neurophysiol. 1962;25:732–771. doi: 10.1152/jn.1962.25.6.732. [DOI] [PubMed] [Google Scholar]
- Furukawa T, Furshpan EJ. Two inhibitory mechanisms in the Mauthner neurons of goldfish. J Neurophysiol. 1963;26:140–176. doi: 10.1152/jn.1963.26.1.140. [DOI] [PubMed] [Google Scholar]
- Gahtan E, O'Malley DM. Visually guided injection of identified reticulospinal neurons in zebrafish: a survey of spinal arborization patterns. J Comp Neurol. 2003;459:186–200. doi: 10.1002/cne.10621. [DOI] [PubMed] [Google Scholar]
- Gahtan E, Sankrithi N, Campos JB, O'Malley DM. Evidence for a widespread brain stem escape network in larval zebrafish. J Neurophysiol. 2002;87:608–614. doi: 10.1152/jn.00596.2001. [DOI] [PubMed] [Google Scholar]
- Greenwood AK, Peichel CL, Zottoli SJ. Distinct startle responses are associated with neuroanatomical differences in pufferfishes. J Exp Biol. 2010;213:613–620. doi: 10.1242/jeb.037085. [DOI] [PubMed] [Google Scholar]
- Hackett JT, Buchheim A. Ultrastructural correlates of electrical-chemical synaptic transmission in goldfish cranial motor nuclei. J Comp Neurol. 1984;224:425–436. doi: 10.1002/cne.902240310. [DOI] [PubMed] [Google Scholar]
- Hackett JT, Faber DS. Mauthner axon networks mediating supraspinal components of the startle response in the goldfish. Neuroscience. 1983a;8:317–331. doi: 10.1016/0306-4522(83)90069-6. [DOI] [PubMed] [Google Scholar]
- Hackett JT, Faber DS. Relay neurons mediate collateral inhibition of the goldfish Mauthner cell. Brain Res. 1983b;264:302–306. doi: 10.1016/0006-8993(83)90829-6. [DOI] [PubMed] [Google Scholar]
- Hanneman E, Westerfield M. Early expression of acetylcholinesterase activity in functionally distinct neurons of the zebrafish. J Comp Neurol. 1989;284:350–361. doi: 10.1002/cne.902840303. [DOI] [PubMed] [Google Scholar]
- Hanneman E, Trevarrow B, Metcalfe WK, Kimmel CB, Westerfield M. Segmental pattern of development of the hindbrain and spinal cord of the zebrafish embryo. Development. 1988;103:49–58. doi: 10.1242/dev.103.1.49. [DOI] [PubMed] [Google Scholar]
- Higashijima S, Hotta Y, Okamoto H. Visualization of cranial motor neurons in live transgenic zebrafish expressing green fluorescent protein under the control of the islet-1 promoter/enhancer. J Neurosci. 2000;20:206–218. doi: 10.1523/JNEUROSCI.20-01-00206.2000. [DOI] [PMC free article] [PubMed] [Google Scholar]
- Huang KH, Ahrens MB, Dunn TW, Engert F. Spinal projection neurons control turning behaviors in zebrafish. Curr Biol. 2013;23:1566–1573. doi: 10.1016/j.cub.2013.06.044. [DOI] [PMC free article] [PubMed] [Google Scholar]
- Jayne BC, Lauder GV. Red and white muscle activity and kinematics of the escape response of the bluegill sunfish during swimming. J Comp Physiol A. 1993;173:495–508. [Google Scholar]
- Kimmel CB, Powell SL, Metcalfe WK. Brain neurons which project to the spinal cord in young larvae of the zebrafish. J Comp Neurol. 1982;205:112–127. doi: 10.1002/cne.902050203. [DOI] [PubMed] [Google Scholar]
- Kimmel CB, Metcalfe WK, Schabtach E. T reticular interneurons: a class of serially repeating cells in the zebrafish hindbrain. J Comp Neurol. 1985;233:365–376. doi: 10.1002/cne.902330306. [DOI] [PubMed] [Google Scholar]
- Kimura Y, Okamura Y, Higashijima S. alx, a zebrafish homolog of Chx10, marks ipsilateral descending excitatory interneurons that participate in the regulation of spinal locomotor circuits. J Neurosci. 2006;26:5684–5697. doi: 10.1523/JNEUROSCI.4993-05.2006. [DOI] [PMC free article] [PubMed] [Google Scholar]
- Kimura Y, Satou C, Fujioka S, Shoji W, Umeda K, Ishizuka T, Yawo H, Higashijima S. Hindbrain V2a neurons in the excitation of spinal locomotor circuits during zebrafish swimming. Curr Biol. 2013;23:843–849. doi: 10.1016/j.cub.2013.03.066. [DOI] [PubMed] [Google Scholar]
- Kinkhabwala A, Riley M, Koyama M, Monen J, Satou C, Kimura Y, Higashijima S, Fetcho J. A structural and functional ground plan for neurons in the hindbrain of zebrafish. Proc Natl Acad Sci U S A. 2011;108:1164–1169. doi: 10.1073/pnas.1012185108. [DOI] [PMC free article] [PubMed] [Google Scholar]
- Kohashi T, Oda Y. Initiation of Mauthner- or nonMauthner-mediated fast escape evoked by different modes of sensory input. J Neurosci. 2008;28:10641–10653. doi: 10.1523/JNEUROSCI.1435-08.2008. [DOI] [PMC free article] [PubMed] [Google Scholar]
- Koyama M, Kinkhabwala A, Satou C, Higashijima S, Fetcho J. Mapping a sensory-motor network onto a structural and functional ground plan in the hindbrain. Proc Natl Acad Sci U S A. 2011;108:1170–1175. doi: 10.1073/pnas.1012189108. [DOI] [PMC free article] [PubMed] [Google Scholar]
- Lee RK, Eaton RC. Identifiable reticulospinal neurons of the adult zebrafish, Brachydanio rerio. J Comp Neurol. 1991;304:34–52. doi: 10.1002/cne.903040104. [DOI] [PubMed] [Google Scholar]
- Lee RK, Eaton RC, Zottoli SJ. Segmental arrangement of reticulospinal neurons in the goldfish hindbrain. J Comp Neurol. 1993;329:539–556. doi: 10.1002/cne.903290409. [DOI] [PubMed] [Google Scholar]
- Liao JC, Fetcho JR. Shared versus specialized glycinergic spinal interneurons in axial motor circuits of larval zebrafish. J Neurosci. 2008;28:12982–12992. doi: 10.1523/JNEUROSCI.3330-08.2008. [DOI] [PMC free article] [PubMed] [Google Scholar]
- Liu KS, Fetcho JR. Laser ablations reveal functional relationships of segmental hindbrain neurons in zebrafish. Neuron. 1999;23:325–335. doi: 10.1016/S0896-6273(00)80783-7. [DOI] [PubMed] [Google Scholar]
- Lumsden A, Keynes R. Segmental patterns of neuronal development in the chick hindbrain. Nature. 1989;337:424–428. doi: 10.1038/337424a0. [DOI] [PubMed] [Google Scholar]
- McLean DL, Fetcho JR. Spinal interneurons differentiate sequentially from those driving the fastest swimming movements in larval zebrafish to those driving the slowest ones. J Neurosci. 2009;29:13566–13577. doi: 10.1523/JNEUROSCI.3277-09.2009. [DOI] [PMC free article] [PubMed] [Google Scholar]
- McLean DL, Fan J, Higashijima S, Hale ME, Fetcho JR. A topographic map of recruitment in spinal cord. Nature. 2007;446:71–75. doi: 10.1038/nature05588. [DOI] [PubMed] [Google Scholar]
- McLean DL, Masino MA, Koh IY, Lindquist WB, Fetcho JR. Continuous shifts in the active set of spinal interneurons during changes in locomotor speed. Nat Neurosci. 2008;11:1419–1429. doi: 10.1038/nn.2225. [DOI] [PMC free article] [PubMed] [Google Scholar]
- Mendelson B. Development of reticulospinal neurons of the zebrafish: II. Early axonal outgrowth and cell body position. J Comp Neurol. 1986;251:172–184. doi: 10.1002/cne.902510204. [DOI] [PubMed] [Google Scholar]
- Metcalfe WK, Mendelson B, Kimmel CB. Segmental homologies among reticulospinal neurons in the hindbrain of the zebrafish larva. J Comp Neurol. 1986;251:147–159. doi: 10.1002/cne.902510202. [DOI] [PubMed] [Google Scholar]
- Mittenthal JE, Wine JJ. Segmental homology and variation in flexor motoneurons of the crayfish abdomen. J Comp Neurol. 1978;177:311–334. doi: 10.1002/cne.901770209. [DOI] [PubMed] [Google Scholar]
- Moly PK, Hatta K. Early glycinergic axon contact with the Mauthner neuron during zebrafish development. Neurosci Res. 2011;70:251–259. doi: 10.1016/j.neures.2011.03.003. [DOI] [PubMed] [Google Scholar]
- Moly PK, Ikenaga T, Kamihagi C, Islam AF, Hatta K. Identification of initially appearing glycine-immunoreactive neurons in the embryonic zebrafish brain. Dev Neurobiol. 2014 doi: 10.1002/dneu.22158. in press. [DOI] [PubMed] [Google Scholar]
- Murakami Y, Pasqualetti M, Takio Y, Hirano S, Rijli FM, Kuratani S. Segmental development of reticulospinal and branchiomotor neurons in lamprey: insights into the evolution of the vertebrate hindbrain. Development. 2004;131:983–995. doi: 10.1242/dev.00986. [DOI] [PubMed] [Google Scholar]
- Nakayama H, Oda Y. Common sensory inputs and differential excitability of segmentally homologous reticulospinal neurons in the hindbrain. J Neurosci. 2004;24:3199–3209. doi: 10.1523/JNEUROSCI.4419-03.2004. [DOI] [PMC free article] [PubMed] [Google Scholar]
- Nissanov J, Eaton RC, DiDomenico R. The motor output of the Mauthner cell, a reticulospinal command neuron. Brain Res. 1990;517:88–98. doi: 10.1016/0006-8993(90)91012-6. [DOI] [PubMed] [Google Scholar]
- O'Malley DM, Kao YH, Fetcho JR. Imaging the functional organization of zebrafish hindbrain segments during escape behaviors. Neuron. 1996;17:1145–1155. doi: 10.1016/S0896-6273(00)80246-9. [DOI] [PubMed] [Google Scholar]
- Orger MB, Kampff AR, Severi KE, Bollmann JH, Engert F. Control of visually guided behavior by distinct populations of spinal projection neurons. Nat Neurosci. 2008;11:327–333. doi: 10.1038/nn2048. [DOI] [PMC free article] [PubMed] [Google Scholar]
- Pearson KG, Boyan GS, Bastiani M, Goodman CS. Heterogeneous properties of segmentally homologous interneurons in the ventral nerve cord of locusts. J Comp Neurol. 1985;233:133–145. doi: 10.1002/cne.902330108. [DOI] [PubMed] [Google Scholar]
- Philippidou P, Dasen JS. Hox genes: choreographers in neural development, architects of circuit organization. Neuron. 2013;80:12–34. doi: 10.1016/j.neuron.2013.09.020. [DOI] [PMC free article] [PubMed] [Google Scholar]
- Prin F, Ng KE, Thaker U, Drescher U, Guthrie S. Ephrin-As play a rhombomeres-specific role in trigeminal motor axon projections in the chick embryo. Dev Biol. 2005;279:402–419. doi: 10.1016/j.ydbio.2004.12.030. [DOI] [PubMed] [Google Scholar]
- Rubenstein JL, Martinez S, Shimamura K, Puelles L. The embryonic vertebrate forebrain: the prosomeric model. Science. 1994;266:578–580. doi: 10.1126/science.7939711. [DOI] [PubMed] [Google Scholar]
- Sato T, Hamaoka T, Aizawa H, Hosoya T, Okamoto H. Genetic single-cell mosaic analysis implicates ephrinB2 reverse signaling in projections from the posterior tectum to the hindbrain in zebrafish. J Neurosci. 2007;27:5271–5279. doi: 10.1523/JNEUROSCI.0883-07.2007. [DOI] [PMC free article] [PubMed] [Google Scholar]
- Satou C, Kimura Y, Kohashi T, Horikawa K, Takeda H, Oda Y, Higashijima S. Functional role of a specialized class of spinal commissural inhibitory neurons during fast escapes in zebrafish. J Neurosci. 2009;29:6780–6793. doi: 10.1523/JNEUROSCI.0801-09.2009. [DOI] [PMC free article] [PubMed] [Google Scholar]
- Schneider-Maunoury S, Gilardi-Hebenstreit P, Charnay P. How to build a vertebrate hindbrain: lessons from genetics. C R Acad Sci III. 1998;321:819–834. doi: 10.1016/S0764-4469(99)80022-5. [DOI] [PubMed] [Google Scholar]
- Shafer MR, Calabrese RL. Similarities and differences in the structure of segmentally homologous neurons that control the hearts in the leech, Hirudo medicinalis. Cell Tissue Res. 1981;214:137–153. doi: 10.1007/BF00235152. [DOI] [PubMed] [Google Scholar]
- Sharma SC, Dunn-Meynell AA, Kobylack MA. A note on a tectal neuron projecting via the tectobulbar tract in telesots. Neurosci Lett. 1985;59:265–270. doi: 10.1016/0304-3940(85)90142-9. [DOI] [PubMed] [Google Scholar]
- Simmons P. The neuronal control of dragonfly flight: I. Anatomy. J Exp Biol. 1977;71:123–140. doi: 10.1242/jeb.71.1.123. [DOI] [PubMed] [Google Scholar]
- Smarandache C, Hall WM, Mulloney B. Coordination of rhythmic motor activity by gradients of synaptic strength in a neural circuit that couples modular neural oscillators. J Neurosci. 2009;29:9351–9360. doi: 10.1523/JNEUROSCI.1744-09.2009. [DOI] [PMC free article] [PubMed] [Google Scholar]
- Svoboda KR, Fetcho JR. Interactions between the neural network for escape and swimming in goldfish. J Neurosci. 1996;16:843–852. doi: 10.1523/JNEUROSCI.16-02-00843.1996. [DOI] [PMC free article] [PubMed] [Google Scholar]
- Talpalar AE, Bouvier J, Borgius L, Fortin G, Pierani A, Kiehn O. Dual-mode operation of neuronal networks involved in left-right alternation. Nature. 2013;500:85–88. doi: 10.1038/nature12286. [DOI] [PubMed] [Google Scholar]
- Viana Di Prisco G, Pearlstein E, Le Ray D, Robitaille R, Dubuc R. A cellular mechanism for the transformation of a sensory input into a motor command. J Neurosci. 2000;20:8169–8176. doi: 10.1523/JNEUROSCI.20-21-08169.2000. [DOI] [PMC free article] [PubMed] [Google Scholar]
- Waldeck RF, Pereda A, Faber DS. Properties and plasticity of paired-pulse depression at a central synapse. J Neurosci. 2000;20:5312–5320. doi: 10.1523/JNEUROSCI.20-14-05312.2000. [DOI] [PMC free article] [PubMed] [Google Scholar]
- Watanabe T, Shimazaki T, Mishiro A, Suzuki T, Hirata H, Tanimoto M, Oda Y. Coexpression of auxiliary Kvβ2 subunits with Kv1.1 channels is required for developmental acquisition of unique firing properties of zebrafish Mauthner cells. J Neurophysiol. 2014 doi: 10.1152/jn.00596.2013. in press. [DOI] [PubMed] [Google Scholar]
- Weiss SA, Zottoli SJ, Do SC, Faber DS, Preuss T. Correlation of C-start behaviors with neural activity recorded from the hindbrain in free-swimming goldfish (Carassius auratus) J Exp Biol. 2006;209:4788–4801. doi: 10.1242/jeb.02582. [DOI] [PubMed] [Google Scholar]
- Wilson JA. The structure and function of serially homologous leg motor neurons in the locust: I. Anatomy. J Neurobiol. 1979;10:41–65. doi: 10.1002/neu.480100105. [DOI] [PubMed] [Google Scholar]
- Wilson JA, Hoyle G. Serially homologous neurons as concomitants of functional specialization. Nature. 1978;274:377–379. doi: 10.1038/274377a0. [DOI] [PubMed] [Google Scholar]
- Yamamoto N, Kato T, Okada Y, Somiya H. Somatosensory nucleus in the torus semicircularis of cyprinid teleosts. J Comp Neurol. 2010;518:2475–2502. doi: 10.1002/cne.22348. [DOI] [PubMed] [Google Scholar]
- Zottoli SJ. Correlation of the startle reflex and Mauthner cell auditory responses in unrestrained goldfish. J Exp Biol. 1977;66:243–254. doi: 10.1242/jeb.66.1.243. [DOI] [PubMed] [Google Scholar]
- Zottoli SJ, Hordes AR, Faber DS. Localization of optic tectal input to the ventral dendrite of the goldfish Mauthner cell. Brain Res. 1987;401:113–121. doi: 10.1016/0006-8993(87)91170-X. [DOI] [PubMed] [Google Scholar]


