

Abstract
The axon initial segment (AIS) is the site of spike initiation in neurons. Previous studies revealed that spatial distribution of the AIS varies greatly among neurons to meet their specific needs. However, when and how this differentiation arises is unknown. Neurons in the avian nucleus laminaris (NL) are binaural coincidence detectors for sound localization and show differentiation in the distribution of the AIS, with shorter length and a more distal position from the soma with an increase in tuning frequency. We studied these characteristics of the AIS in NL neurons of the chicken during development and found that the AIS differentiates in its distribution after initial formation, and this is driven by activity-dependent and activity-independent mechanisms that differentially regulate distal and proximal boundaries of the AIS. Before hearing onset, the ankyrinG-positive AIS existed at a wide stretch of proximal axon regardless of tuning frequency, but Na+ channels were only partially distributed within the AIS. Shortly after hearing onset, Na+ channels accumulated along the entire AIS, which started shortening and relocating distally to a larger extent in neurons with higher tuning frequencies. Ablation of inner ears abolished the shortening of the AIS without affecting the position of its proximal boundary, indicating that both distal and proximal AIS boundaries are disassembled during development, and the former is dependent on afferent activity. Thus, interaction of these activity-dependent and activity-independent mechanisms determines the cell-specific distribution of the AIS in NL neurons and plays a critical role in establishing the function of sound localization circuit.
Keywords: action potential, ankyrinG, auditory, axon initial segment, nucleus laminaris, sodium channel
Introduction
Efficient conversion of synaptic potentials into action potentials is critical for the precise and reliable signal processing of nervous systems. Action potentials are generated at the axon initial segment (AIS), which is a specialized axonal compartment clustered with a high density of voltage-gated Na+ (Nav) channels (Bender and Trussell, 2012; Kole and Stuart, 2012). Vast knowledge has been accumulated on the formation of the AIS (Rasband, 2010). During development, a membrane scaffold protein, ankyrinG, is initially recruited to the AIS and triggers the clustering of Nav channels in concert with cytoskeletal and cell adhesion molecules (Zhou et al., 1998; Jenkins and Bennett, 2001; Garrido et al., 2003; Hedstrom et al., 2007; Yang et al., 2007). Previously, it became evident that the AIS is differentiated in individual neurons, in terms of its spatial distribution (Hossain et al., 2005; Kuba et al., 2006; Fried et al., 2009; Kuba and Ohmori, 2009) as well as expression of membrane proteins (Van Wart et al., 2007; Lorincz and Nusser, 2008; Clark et al., 2009; Sánchez-Ponce et al., 2012), which play a crucial role in the signal processing of the neurons. However, when and how the differentiation of the AIS is established remains elusive.
Neurons in the avian nucleus laminaris (NL) detect the coincidence of synaptic inputs from both ears and encode interaural time differences for sound localization (Konishi, 2003). NL neurons are tuned to a specific frequency of sounds [characteristic frequency (CF)] and arranged tonotopically within the nucleus, such that the CF of neurons decreases from a rostromedial to caudolateral direction (Rubel and Parks, 1975). NL neurons show several differentiations in their morphology and function along the tonotopic axis (Smith and Rubel, 1979; Kuba et al., 2005). One remarkable example is the spatial distribution of the AIS; its length becomes shorter and its position relative to the soma more distal in neurons with higher CF (Kuba et al., 2006). This differentiation of the AIS enables NL neurons of each CF to respond appropriately to their synaptic inputs, thereby ensuring the precise calculation of interaural time differences against a wide range of sound frequencies.
In this study, we examined the AIS of NL neurons along the tonotopic axis during development and explored mechanisms underlying the differentiation of AIS distribution. Because the AIS of mature neurons has a capacity for plasticity in its distribution (Grubb and Burrone, 2010; Kuba et al., 2010) and development of the sensory system depends on peripheral activity (Katz and Shatz, 1996), we focused on the effects of cochlea activity on the differentiation. We found that the AIS was initially formed in a uniform pattern regardless of tonotopic regions and was then refined into the mature pattern with further development, and this refinement was driven by both activity-dependent and activity-independent mechanisms.
Materials and Methods
Animals.
Chickens (Gallus domesticus) of either sex between embryonic day 9 (E9) and posthatch day 7 (P7) were used for immunohistochemistry and electrophysiology. The experimental animals' care was in accordance with the guidelines of Nagoya University. The developmental stage of embryos was determined according to the Hamburger and Hamilton (1951) series. Chicks were deeply anesthetized with ether (Nacalai), and embryos were anesthetized by cooling eggs in ice-cold water. Some data of posthatch chicks were adopted from Kuba et al. (2006).
Classification of tonotopic regions.
We divided the NL into three CF regions, according to the position within the nucleus; the rostromedial one-third of the NL is defined as the high-CF region, the middle one-third as the middle-CF region, and the caudolateral one-third as the low-CF region (Fig. 1B; Kuba et al., 2005). Although a clear relationship between CF and position is found in the NL of late embryos and posthatch chicks (Rubel and Parks, 1975; Lippe and Rubel 1985), the relationship in early embryos is unknown. Moreover, the CF of neurons may change with development (Lippe, 1995; but see Jones et al., 2006). Therefore, the CF used here is a relative measure in each age and has no relation to the absolute sound frequency.
Figure 1.

Development of Nav pan immunoreactivity in NL. A, The course of development of the chicken auditory system. B, Tonotopic regions are based on position within the nucleus; the rostromedial one-third is defined as the high-CF region, the middle one-third as the middle-CF region, and the caudolateral one-third as the low-CF region (Rubel and Parks, 1975; see Materials and Methods). C, Immunosignals of Nav pan at three tonotopic regions of NL. Fibrous clusters were observed as early as E9 and became longer and distinct by E15. After E15, the clusters became shorter, particularly in the high-CF regions. Dot-like immunosignals that correspond to nodes of Ranvier appeared at late embryonic periods. D, Cumulative probability of length of clusters in C. Measurements were made for >30 clusters at each CF region in each animal, and three to four animals were used for each age (see Materials and Methods). The curves shifted positively between E9 and E15 at all the CF regions, whereas the curves shifted negatively afterward to a greater extent in the higher-CF regions.
Immunohistochemistry.
Guinea pig anti-chick polyclonal Nav1.6 antibody (0.49 μg/ml; Kuba et al., 2006), Nav1.2 antibody (0.68 μg/ml; Kuba et al., 2010), mouse monoclonal Nav pan antibody (5 μg/ml, Sigma), myelin-associated glycoprotein (MAG) antibody (2.5 μg/ml, Sigma), NeuN antibody (2 μg/ml, Millipore), and rabbit polyclonal ankyrinG antibody (5 μg/ml; Bouzidi et al., 2002) were used for immunohistochemistry. Detailed immunohistochemical procedures were described previously (Kuba et al., 2010). Briefly, chicks and chick embryos were perfused transcardially with a periodate–lysine–paraformaldehyde fixative (milliliter per gram body weight): 2% (w/v) paraformaldehyde, 2.7% (w/v) lysine HCl, 0.21% (w/v) NaIO4, and 0.1% (w/v) Na2HPO4. The brainstem was postfixed for 4 h at 4°C. After cryoprotection with 30% (w/w) sucrose in PBS, coronal sections (20–30 μm) were obtained. The sections were incubated overnight with the primary antibodies, then with Alexa-conjugated secondary antibodies (10 μg/ml, Invitrogen) for 2 h, and were observed under a confocal laser-scanning microscope (FV1000, Olympus). Visualization of NL neurons was made either with electroporation of dye (Alexa 488 hydrazide, 4 mm) into a cell with a patch electrode in brain slices, or with injecting tetramethylrhodamine-conjugated dextran (molecular weight, 3000; Invitrogen; 10% in PBS) into the superior olivary nucleus for embryos (Wirth et al., 2008) and Alexa 488-conjugated dextran (molecular weight, 10,000; Invitrogen; 10% in PBS) into the inferior colliculus for chicks (Kuba et al., 2006). With these procedures, a possibility that GABAergic neurons known to exist around the NL were labeled should be small, because they are local interneurons, very few in number, and located apart from the somatic layer of NL neurons (von Bartheld et al., 1989; Yamada et al., 2013). For each image, six to nine confocal planes were Z-stacked with a step of 1 μm. Immunosignals were measured as described previously (Kuba et al., 2010).
Electrophysiology.
Coronal brain slices (200–250 μm) were obtained from E15–P7 chickens. During experiments, slices were perfused with artificial CSF [ACSF; containing (in mm) 125 NaCl, 2.5 KCl, 26 NaHCO3, 1.25 NaHPO4, 2 CaCl2, 1 MgCl2, and 17 glucose, pH 7.4]. Recordings were made using a patch-clamp amplifier (Axopatch 200B, Axon). Recording temperature was 40°C, the body temperature of birds. Pipettes had a resistance of 3–4 MΩ (3 μm tip diameter) when filled with a KCl-based internal solution (160 mm KCl, 0.2 mm EGTA, 10 mm HEPES-KOH, pH 7.4). The liquid junction potential (3.1 mV) was corrected after the experiments. Data were sampled at 100 kHz and were low-pass filtered at 10 kHz.
Operations.
NL neurons receive inputs from both sides of the ears via the nucleus magnocellularis, the avian cochlear nucleus innervated by the auditory nerve. Thus, we deprived cochlea-driven activity of NL neurons by removing bilateral otocysts as described previously (Parks, 1981). In brief, the shell and membranes covering the embryo were opened, and the bilateral otocysts were dissected with a sharp glass needle at E2, corresponding to stage 12 or 13. The egg was then incubated until E21 after closing the opening with Scotch tape. Success of otocyst removal was confirmed by the absence of the cochlea organ and auditory bundle in the brainstem (see Fig. 6A, right, arrowheads). Accordingly, no afferent activity generated in the ears can reach the NL at any stage of development. In this condition, however, intrinsic activity of magnocellularis neurons may remain and cause excitatory inputs in NL neurons (Parks et al., 1987; see Discussion).
Figure 6.

Refinement of the AIS was partially blocked by bilateral otocysts deprivation. A, Immunostainings of myelin marker (MAG, top) and dorsal surface of brainstems (bottom) from normal (left) and deprived (right) animals at E21. Note that the auditory nerve is identified as MAG-immunopositive fibers (top, red arrowheads) and white bundles (bottom, green arrowheads) only in normal animals. M, Medial; V, ventral; VIII, auditory nerve; NM, nucleus magnocellularis. B, Immunostainings of Nav channels (red, arrowheads) after labeling of NL neurons (green) in deprived animals. C, Immunostainings of ankyrinG (red, middle) and either Nav1.6 (top) or Nav1.2 (bottom, green, left) were made in deprived animals of E21 and overlaid (right). Note that the AIS was immunopositive to Nav1.6 (arrowheads), but not to Nav1.2. D–F, Length (D-P, D) and proximal (P-S, E) and distal (D-S, F) positions of the AIS. G, Correlation between length (D-P) and proximal position (P-S) of the AIS. Light blue columns and circles are from control animals of the same age (Fig. 3B–D; E21). Blue and red fitted lines are for control and deprived animals, respectively. Note that length was apparently longer and negative correlation was reduced in deprived animals. H, Action potentials in response to depolarizing current steps of 3 nA (red or blue) and the threshold current (gray) in deprived animals. Spikes at the high CF (left) and the low CF (middle) were overlaid after alignment at the threshold (right, arrowheads). I, Correlation between the rise time and amplitude of action potentials still remained after otocyst deprivation. *p < 0.05; **p < 0.01.
Computational model.
Neuronal modeling and simulation were made as described previously (Kuba et al. 2006), on the basis of the morphological and electrophysiological data of the posthatch chick NL neurons in the high-CF region (Kuba et al., 2005). Briefly, the model consisted of multiple sections: a soma; 20 dendrites; and an axon with an axon hill-lock, an AIS, 10 myelinated internodes, and 10 nodes of Ranvier. Hodgkin–Huxley type Na+ current (Rothman and Manis, 2003), low-voltage activated K+ current (IKLVA), and high-voltage activated K+ current (IKHVA; Rathouz and Trussell, 1998) were incorporated in the soma, the AIS, and the nodes. gKLVA (0.006 S/cm2) and gKHVA (0.003 S/cm2) in the soma were determined according to the experimental observations (Kuba et al., 2005). gNa (16 S/cm2), gKLVA (0.13 S/cm2), and gKHVA (1.3 S/cm2) in the axon were determined to simulate the spike shape of actual neurons. The temperature was 40°C and the Q10 was 3.0. The time step of calculation was 12.5 μs.
Statistics.
Statistical significance was determined with paired or unpaired Student's t test. Values are presented as the mean ± SE (n indicates the number of cells).
Results
Development of Nav expression along the tonotopic axis
We first examined the distribution of Nav channels in the NL of chickens between E9 and P3–P7 with an antibody that recognizes all known neuronal Nav channels (Nav pan) (Fig. 1). In the NL, Nav channels were observed as fibrous clusters, and the distribution changed dramatically with development. At E9, a period much after the generation of NL neurons (Rubel et al., 1976) and just before the appearance of functional synapses (Gao and Lu, 2008; Fig. 1A), the Nav channel clusters were already present and showed similar distributions throughout the tonotopic axis (Fig. 1B,C), indicating that the initial targeting of Nav channels to the AIS occurs independently of afferent inputs and tonotopic regions. The clusters became more distinct at E12, corresponding to the onset of hearing (Saunders et al., 1973), and increased in length until E15. This elongation was similar among CF regions, and the cumulative probability of clusters longer than 20 μm was below 20% and 40–50% for E12 and E15, respectively (Fig. 1D).
Around E15, the clusters of Nav channels started to decrease in length (Fig. 1C,D). Importantly, this shortening occurred in a region-specific manner and to a greater extent in higher-CF regions. The length of Nav clusters at 50% probability was 17.4, 18.0, and 19.6 μm for high-, middle-, and low-CF regions, respectively, at E15, and decreased to 14.7, 15.5, and 18.9 μm, respectively, at E18. These values further decreased to 12.3, 14.6, and 17.9 μm, respectively, by E21. Accordingly, the tonotopic gradient in the length of Nav clusters (Kuba et al., 2006) became obvious by E21, and this differentiation continued until early posthatch periods (P3–P7).
Importantly, the density of Nav clusters, defined as the number within 100 μm along the mediolateral axis of NL, was the highest at E9 (46.2 ± 0.2 clusters/100 μm), which declined to 30% until E12 (14.1 ± 0.3 clusters/100 μm) and further to 14% until around the hatch (6.2 ± 0.4 clusters/100 μm; three animals for each age). This should be attributable to the neuronal cell death that occurs in NL after E9 (Rubel et al., 1976). Indeed, when we measured the density of NL neurons after staining them with a neuronal marker (NeuN; see Materials and Methods), the density declined in parallel with that of Nav clusters, and there were no differences between them at each age (p > 0.1). The apoptotic process is almost completed by the time when the differentiation starts in NL (E15; Rubel et al., 1976), and therefore the effects of apoptosis on the CF-region specificity of Nav clusters would be limited.
Development of ankyrinG expression
AnkyrinG is a scaffold protein that anchors Nav channels and defines the structure of the AIS (Rasband, 2010). We therefore examined the expression of ankyrinG in relation to that of Nav channels. Fig. 2A shows such data obtained from the high-CF region. In the NL, clusters of ankyrinG (Fig. 2A, middle) were noted as early as E9, and overlapped with those of Nav channels (Fig. 2A, left, right). Notably, however, the length of ankyrinG clusters was far greater than that of Nav clusters at E9 and E12 (Fig. 2A, green arrowheads, B,C). Moreover, the length remained almost constant before E15 (Fig. 2D), indicating that the structural basis of the AIS is already established, but that Nav channels are heterogeneously expressed within the AIS at these ages. The discrepancy might reflect a variation in activity or expression of molecules that regulate targeting of Nav channels within the AIS (Bréchet et al., 2008). Delay in the expression of potassium channels as well as Nav channels compared with that of ankyrinG was also reported in developing hippocampal neurons in culture (Sánchez-Ponce et al., 2008, 2012). Importantly, distribution of neither ankyrinG nor Nav channels differed among the CF regions before E15, suggesting that their initial targeting to the AIS proceeds independently of tonotopic region.
Figure 2.
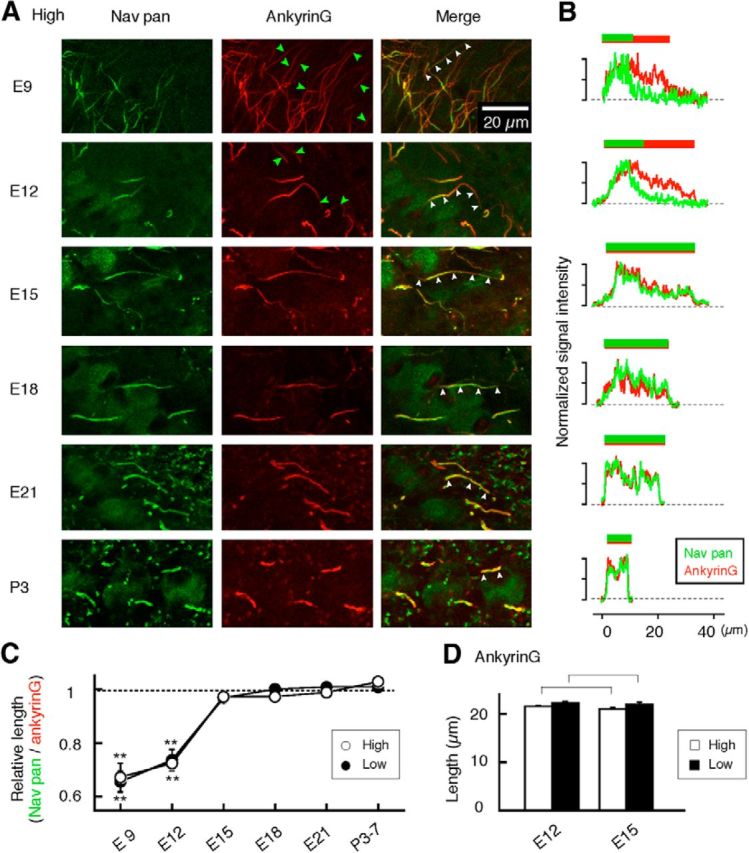
Development of Nav channel distribution within the AIS. A, Immunostainings of Nav pan (left) and ankyrinG (middle) were made at the high-CF region and overlaid (right). B, Intensities of Nav and ankyrinG signals along the clusters in A (white arrowheads) were normalized and plotted. C, Relative length of Nav and ankyrinG clusters at each age of animals. Note that signals of Nav channels were apparently shorter than those of ankyrinG at E9 and E12 (B, C; see also A, green arrowheads), and this discrepancy disappeared by E15, indicating that the distribution of Nav channels represents that of the AIS structure after E15 (see Results). D, Length of ankyrinG clusters did not change between E12 and E15 at both high- and low-CF regions, suggesting that the AIS structure reached its maximum length by E12 regardless of CF regions. Measurements were made for >10 clusters at each CF region in each animal, and three to four animals were used for each age (see Materials and Methods). **p < 0.01.
By E15, the length of Nav clusters elongated (Fig. 1), and the distribution of ankyrinG nicely matched that of Nav channels, indicating the establishment of the AIS structure with Nav channels along its entire length. This further indicates that the increase in the length of Nav clusters can be attributed to the accumulation of Nav channels to the AIS rather than elongation of the AIS structure. This accumulation of Nav channels occurred similarly regardless of CF region (Fig. 2C). Thus, the distribution of Nav channels should reflect the AIS structure after E15, and therefore we relate any changes in the Nav channel cluster to those of AIS structure in later sections.
CF-dependent development of AIS
The results indicate that the CF region-specific refinement of the AIS progresses after E15. However, the analyses did not provide information on the location of the AIS relative to the soma (Kuba et al., 2006). Furthermore, the analyses included AIS that had been cut during preparation of slices. This would have resulted in an underestimation of their lengths. To examine more thoroughly the spatial distribution of the AIS during the refinement, immunostainings of Nav channels were made between E15 and P3–P7 after retrograde or electrophoretic labeling of NL neurons (Fig. 3; see Materials and Methods).
Figure 3.
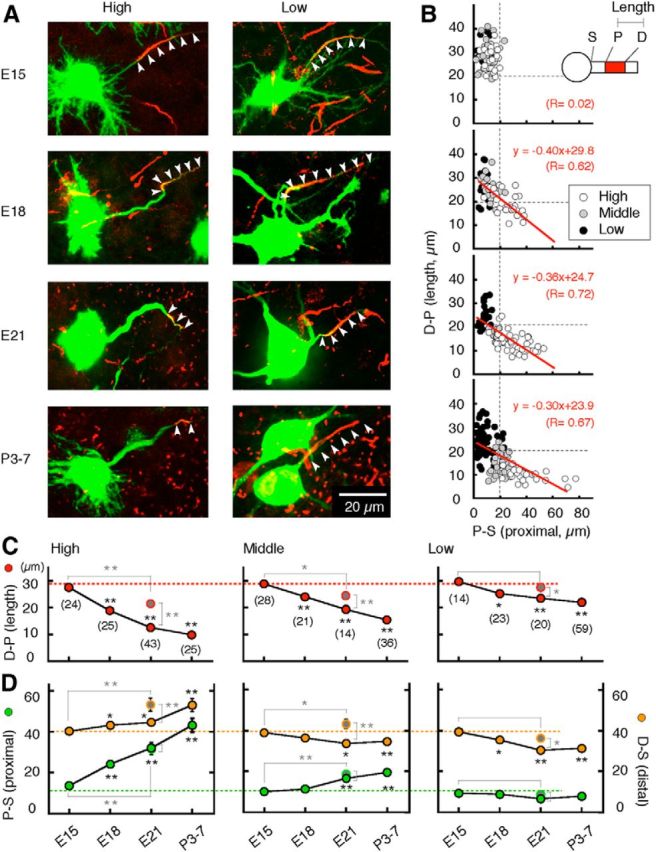
Developmental refinement of spatial distribution of the AIS. A, Immunostainings of Nav channels (red, arrowheads) after labeling of NL neurons (green). B, Correlation between length (D-P) and proximal position (P-S) of the AIS. S, P, and D denote soma, proximal, and distal ends of AIS, respectively. Each plot represents individual cells. C, Length of AIS (D-P, red). D, Proximal (P-S, green) and distal (D-S, orange) positions of the AIS relative to the soma. Gray symbols encircled by red (C) or green or orange (D) are values in animals deprived of bilateral otocysts from Figure 6. After E15, the AIS decreased in length and increased in distance of proximal position to a greater extent in the higher-CF regions. Accordingly, a negative correlation became apparent at E18, and pronounced until P3–P7. The refinement would be saturated by P3–P7, as the AIS parameters in P3–P7 were not different from those in older animals (P10, 3 animals) at each CF region (p > 0.1). In this and subsequent figures, numbers in parenthesis are the number of cells. *p < 0.05; **p < 0.01. Statistical significance was tested against E15 (black asterisks) and against otocyst-deprived animals at E21 (gray asterisks; Figs. 6, 7).
As in the results of Fig. 1, the length of the AIS [the length between the distal and proximal ends of the AIS (D-P)] was maximum and did not vary among the CF regions at E15 (∼30 μm; Fig. 3A,B,C, red). After E15, the length of the AIS was greatly reduced in the high-CF region (Fig. 3C, left), moderately in the middle-CF region (Fig. 3C, middle), and slightly in the low-CF region (Fig. 3C, right), forming the tonotopic gradient in the length of the AIS in mature animals. The extent of shortening between E15 and P3–P7 was 63, 50, and 21% of the values at E15 for high-, middle-, and low-CF regions, respectively, and the lengths at P3–P7 were 9.8 ± 0.5, 14.4 ± 0.9, and 23.9 ± 1.1 μm, respectively (p < 0.01).
In parallel with the changes in length, the location of the AIS, measured as a distance between its proximal end and the soma (P-S), started to change after E15 (Fig. 3A,B,D, green). The proximal end of the AIS shifted away from the soma greatly in the high-CF region (Fig. 3D, left) and moderately in the middle-CF region (D, middle), but the change was negligible in the low-CF region (D, right), causing the tonotopic gradient in the location of the AIS (P-S). The extent of P-S displacement between E15 and P3–P7 was 234, 99, and below 15% of the values at E15 for high-, middle-, and low-CF regions, respectively, and the P-S distances at P3–P7 were 45.2 ± 3.3, 21.1 ± 1.3, and 7.9 ± 1.0 μm, respectively (p < 0.01).
The position of distal end of the AIS, measured as its distance from the soma (D-S), changed differently along the tonotopic axis as well (Fig. 3D, orange); the distal end continuously moved away from the soma after E15 in the high-CF region (Fig. 3D, left), but approached the soma in the middle- and low-CF regions (Fig. 3D, middle, right). These differential movements of both the distal and proximal ends of the AIS created the tonotopic gradients in the length (D-P) and the location (P-S) of the AIS (see Discussion). Accordingly, a negative correlation appeared between these parameters around E18, and its slope continued to decrease until around the hatch (Fig. 3B, red lines).
Subtypes of Nav channels
It is known that the AIS initially expresses Nav1.2, and Nav1.6 appears later during development (Boiko et al., 2003; Osorio et al., 2005). We then examined how the expression of these channels is regulated in NL (Fig. 4). Until E15, the ankyrinG-positive AIS was immunopositive to Nav1.2, but not to Nav1.6 (Fig. 4A,B, top). At E18, the AIS became immunopositive to both Nav1.6 and Nav1.2 (Fig. 4A,B, middle). The immunosignals at E18, however, were weak in intensity and shorter in distribution than those of ankyrinG. In this context, immunosignals of Nav pan at E18 were matched notably with those of ankyrinG (Fig. 2), suggesting that the expressions of Nav1.2 and Nav1.6 would be complementary at this age. At E21, immunosignals of Nav1.6 colocalized perfectly with those of ankyrinG, and Nav1.2 was no longer detectable (Fig. 4A,B, bottom). Thus, it is envisaged that Nav1.2 is initially targeted to the AIS, and replaced with Nav1.6 between E15 and E21 in the NL. The time course of switching did not differ among the CF regions (data not shown).
Figure 4.
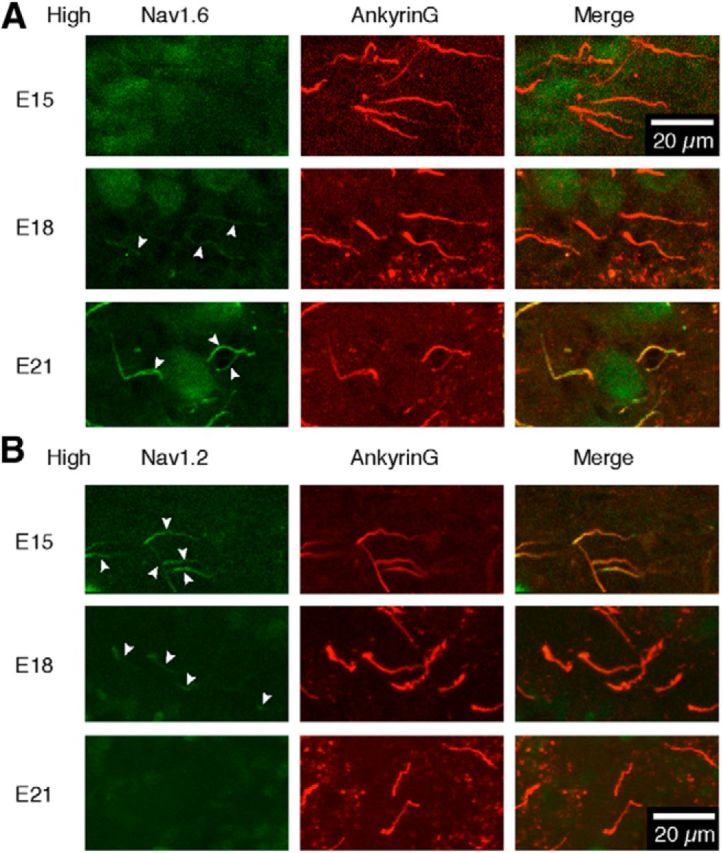
Developmental switching of Nav channel subtypes. A, B, Immunostainings of ankyrinG (red, middle) and either Nav1.2 (A) or Nav1.6 (B) (green, left) were made at the high-CF region and overlaid (right). Note that the AIS was immunopositive for both Nav1.2 and Nav1.6 at E18 (arrowheads).
Development of action potentials
The refinements of the AIS were reflected in the properties of spikes recorded at the cell soma of NL neurons. Until E15, spikes showed a high threshold potential and broad time course, which did not differ between the high- and low-CF regions (Fig. 5A). In both CF regions, the threshold potential of spikes was reduced after E15 (Fig. 5E), suggesting an increase in the Na+ conductance. This would be due to an increase in the number of Nav1.6 (Figs. 1, 4), which has a lower threshold for activation than Nav1.2 (Rush et al., 2005). Consistent with this, the amplitude and maximum dV/dt of spikes increased after E15 in the low-CF region (Fig. 5C,F). In the high-CF region, on the other hand, these parameters did not change until E18 and decreased thereafter. Furthermore, the rise time of spikes was shortened after E18 at the low CF, but remained constant at the high CF, making the rise time far slower in the high-CF region (Fig. 5A,D). Accordingly, spikes were separated into two distinct groups in terms of amplitude and rise time, and showed a clear negative correlation between the parameters (Fig. 5B). The negative correlation progressed in parallel with an increase in the distance of the AIS (Fig. 3C), indicating that the small and slow spikes in the high-CF region would be attributable to filtering effects of the axon (Figs. 1–3). Indeed, when spikes were simulated in a computer model of an NL neuron (Kuba et al., 2006; see Materials and Methods), an increase in the distance of the AIS from the soma decelerated the rising phase and reduced the amplitude (Fig. 5G), whereas a decrease in the AIS length had smaller effects on these parameters (Fig. 5H).
Figure 5.

Refinement of the AIS was reflected in action potentials. A, Action potentials in response to depolarizing current steps of 3 nA (red or blue) and the threshold current (gray), defined as the minimum current to induce a spike. Spikes at the high CF (left) and the low CF (middle) were overlaid after alignment at the threshold (right, arrowheads). Spikes became faster with development, but to a lesser extent and with smaller amplitude in the high-CF region. Note that spike peak is delayed and lower for the high-CF (red) compared with the low-CF region (blue, arrow) at E21 and P3–P7 (right). B, Correlation between the rise time and amplitude of action potentials. Rise time was defined as the 10–90% time interval between threshold and peak. C–F, Amplitude (C), rise time (D), threshold (E), and maximum dV/dt (F) of action potentials. Note that the amplitude and maximum dV/dt decreased after E18 in the high-CF region. G, H, Effects of P-S (distance, G) and D-P (length, H) of AIS on action potentials in a model neuron (see Materials and Methods). Left, Spikes induced by two different AIS geometries were overlaid after alignment at the threshold (arrowheads). Right, Amplitude (circles) and rise time (squares) of spikes plotted against P-S (G) and D-P (H) of AIS. The parameters of the AIS were varied according to observations in the high-CF region (Fig. 3C). *p < 0.05; **p < 0.01.
Passive membrane properties of NL neurons changed during development (Table 1); the input resistance was reduced, and the membrane time constant was shortened by 6–10 times, regardless of CF region, between E15 and P3–P7, causing an increase in the threshold current by 2–3 times in both CF regions (Fig. 5A, gray). These were primarily due to the increases of K+ conductance and hyperpolarization-activated cation conductance during the period (Kuba et al., 2002; Gao and Lu, 2008). Among them, the increase of K+ conductance is greater at the high- and middle-CF regions than at the low-CF region (Kuba et al., 2005), which may underlie the tonotopic variations in the spike parameters (Fig. 5B). However, this possibility should be small because the maximum dV/dt and amplitude of spikes were still smaller and the rise time slower in the higher-CF regions after this K+ conductance was blocked with dendrotoxin (data not shown).
Table 1.
Passive membrane properties of NL neurons during development
| Control |
Deprived E21 | ||||
|---|---|---|---|---|---|
| E15 | E18 | E21 | P3–P7 | ||
| τm (ms) | |||||
| High | 8.2 ± 0.9 (8)** | 4.0 ± 0.4 (6)* | 1.6 ± 0.2 (6)** | 0.9 ± 0.1 (24)** | 1.5 ± 0.3 (5) |
| Low | 13.3 ± 1.9 (6) | 5.4 ± 0.6 (5) | 2.5 ± 0.1 (7) | 1.3 ± 0.1 (20) | 2.5 ± 0.6 (5) |
| Rm (MΩ) | |||||
| High | 106.7 ± 14.5* | 60.5 ± 4.1* | 26.0 ± 2.4** | 16.5 ± 2.2 | 31.0 ± 1.3 |
| Low | 160.5 ± 20.4 | 74.4 ± 4.5 | 35.7 ± 1.4 | 18.5 ± 1.6 | 43.2 ± 8.1 |
| Cm (pF) | |||||
| High | 77.9 ± 4.4 | 65.9 ± 5.3 | 60.0 ± 3.1* | 55.4 ± 3.0* | 46.5 ± 4.6# |
| Low | 82.3 ± 2.6 | 72.3 ± 3.7 | 71.3 ± 1.7 | 70.7 ± 6.3 | 55.2 ± 2.8## |
Parameters were obtained from voltage responses to a current of 50 pA amplitude and 40 ms duration. Otocyst deprivation was done as described in Materials and Methods. Numbers of cells are indicated in parenthesis. Reduction of Cm may reflect shortening of dendrites in deprived animals (Parks et al., 1987).
*p < 0.05;
**p < 0.01 (between high- and low-CF regions, respectively).
#p < 0.05;
##p < 0.01 (between control and deprived animals at E21).
Effects of otocyst removal on development of AIS
The tonotopic differentiation of the AIS occurs after hearing onset (E12). This differentiation may be initiated in part, if not completely, by afferent inputs, because the deprivation of afferent inputs is known to increase the length of the AIS in mature auditory magnocellularis neurons (Kuba et al., 2010). To test this idea, we removed bilateral otocysts at the prehearing period (E2; see Materials and Methods) and examined the effects at E21. This procedure completely abolished the formation of inner ears and auditory nerve bundles (Fig. 6A, right, arrowheads; see legend), implying that no cochlea-driven activity reached NL neurons during development (Parks et al., 1987). Bilateral otocyst deprivation had a significant impact on the distribution of AIS (Fig. 6), whereas it did not affect the density of NL neurons (Parks et al., 1987). In the high-CF region, the AIS was still located distally from the soma, but it was apparently elongated in the deprived animals (Fig. 6B, left, D); the lengths (D-P) were 12.5 ± 0.6 and 21.5 ± 0.8 μm without and with deprivation, respectively (p < 0.01). In the low-CF region, on the other hand, the extent of elongation was much smaller, and the lengths were 24.3 ± 1.1 and 27.6 ± 1.0 μm without and with deprivation, respectively (p < 0.05; Fig. 6B, right, D). Thus, the otocyst deprivation caused an increase in the length of the AIS to a greater extent in the higher-CF regions, reducing the tonotopic gradient in the length of the AIS. This elongation occurred because the distal end of the AIS shifted away from the soma (Fig. 6F, D-S) without changes in the position of the proximal end (Fig. 6E, P-S) in the deprived animals. Accordingly, the negative correlation between the length and the P-S distance of the AIS became less prominent in the deprived animals (Fig. 6G, red line). Nav1.6, but not Nav1.2, was expressed at the AIS in the E21 deprived animals, suggesting that the switching of Nav subtypes occurs independently of afferent inputs (Fig. 6C). These data indicate that both activity-dependent and activity-independent mechanisms are involved in the developmental refinement of AIS distribution in NL neurons.
Otocyst deprivation affected properties of action potentials as well (Fig. 6H). In the deprived animals, spikes increased in the amplitude, but did not change in the rise time, and the negative correlation between these parameters remained (Fig. 6I; see also Fig. 5B); the amplitude was 42.6 ± 2.9 mV for the high-CF region (n = 7) and 56.2 ± 1.6 mV for low-CF region (n = 9; p < 0.01), whereas the 10–90% rise times were 0.18 ± 0.01 and 0.13 ± 0.01 ms, respectively (p < 0.01). This was consistent with the results of the simulation, showing that the spike shapes are strongly dependent on the distance of the AIS (Fig. 5G,H). The increase of spike amplitude in the high-CF region could be due to an increase of Nav conductance associated with the elongation of the AIS; the otocyst deprivation increased the maximum dV/dt of spikes by 62% (251.6 ± 27.1 V/s, n = 7, p < 0.01) and reduced the threshold current by 26% (1.1 ± 0.1 nA, n = 7, p < 0.01), whereas it had rather small effects on passive membrane properties of the neurons (Table 1).
Discussion
The present study characterized developmental changes in the distributions of the AIS and Nav channel subtypes in NL neurons. Before E12, the ankyrinG-positive AIS already existed with a similar distribution throughout tonotopic regions, although it was still “immature” until E15 in terms of Nav channel distribution (Figs. 1, 2). Subtypes of Nav channels were similar among the CF regions as well, and switched from Nav1.2 to Nav1.6 at ∼E18 (Fig. 4). On the other hand, the refinement of spatial distribution of the AIS depended on tonotopic regions and started at ∼E15; the length becomes shorter, with the location becoming more distant in NL neurons with higher CF, causing the CF-region-specific differentiation of the AIS in mature neurons (Fig. 3). Thus, the development of the AIS could be separated into two processes, that is, CF-region-independent initial formation, including targeting and switching of Nav channels, and CF-region-dependent refinement of spatial distribution. The ablation of otocysts diminished the tonotopic gradient in the length of AIS, suggesting a substantial contribution of afferent inputs to the refinement of the AIS (Fig. 6).
CF-region-dependent refinement of spatial distribution of the AIS
The spatial distribution of the AIS is refined in a CF-region-specific manner after E15 (Fig. 3). Then what is the mechanism of this refinement of the AIS? The refinement occurred at both proximal and distal ends of the AIS, suggesting that assembly and/or disassembly of the AIS structure at these sites is involved in the process (Fig. 7, see legend). Thus, we first estimated the net shifts of proximal and distal ends of the AIS between E15 and E21 at each CF region by subtraction of P-S and the distance between distal end and the D-S at E15 (Fig. 3D, green, orange, respectively) from P-S and D-S at E21, respectively (Fig. 7A,B). The proximal end of the AIS shifted distally in the high-CF region, with smaller degrees in the middle-CF region, whereas the change was negligible in the low-CF region, indicating that the proximal end of the AIS is disassembled to a larger extent in the higher-CF regions (Fig. 7A,E, green). This disassembly was independent from afferent activity (Figs. 6E, 7F).
Figure 7.

Possible mechanisms for the developmental refinement of AIS distribution. A, B, Net displacement of proximal (P-S, green, A) and distal (D-S, orange, B) positions of the AIS between E15 and E21 calculated from Fig. 3D. P-S and D-S at E15 were subtracted from those at E21 for A and B, respectively. See Discussion for details. Note that distal displacement occurs with disassembly of the AIS structure at proximal end, and with assembly at distal end. C, D, Activity-dependent (blue; C) and activity-independent (purple; D) components of the net displacement of the distal AIS (B) calculated from Fig. 3D. D-S in deprived animals at E21 was subtracted from that in control animals of the same age for C, whereas D-S in control animals at E15 was subtracted from that in deprived animals at E21 for D. E, F, Schematic drawings of the displacement of the proximal and distal positions of the AIS at each CF region with (E) and without (F) afferent activity. Green and orange arrows indicate the net displacement of the proximal (A) and distal (B) ends, respectively. Blue and purple arrows indicate the activity-dependent (C) and activity-independent (D) components of the net displacement of the distal end, respectively. In the low-CF region, displacement of the proximal end (A) and activity-independent displacement of the distal end (D) were statistically insignificant (gray columns; Fig. 3D) and were not described in E and F. Another mechanism for the distal shift of the AIS could be an elongation of axon hillock, which moves the AIS as a structure (see Discussion).
Movements of the distal end of the AIS were rather complex; it was displaced distally in the high-CF, and proximally in the middle- and low-CF regions, implying that the distal end is assembled in the former and disassembled in the latter (Fig. 7B,E, orange). This complexity appears to result from the interaction between activity-dependent and activity-independent processes. The activity-dependent component of the net shift of the distal end was estimated by subtraction of D-S in otocyst-deprived animals at E21 (Fig. 3D, gray symbols encircled by orange) from that in nondeprived animals at E21 (Figs. 3D, orange; 7C, see legend). This activity-dependent process is likely to promote the disassembly of the AIS structure at the distal end of the AIS to a greater extent in the higher-CF regions (Fig. 7C,E,F, blue). On the other hand, the activity-independent component was estimated by the subtraction of D-S in nondeprived animals at E15 (Fig. 3D, orange) from that at E21 in otocyst-deprived animals (Figs. 3D, gray symbols encircled by orange; 7D, see legend). This activity-independent process appears to cause strong and moderate assembly in the high- and middle-CF regions, respectively, whereas the effect is negligible in the low-CF region (Fig. 7D,E,F, purple; see also Fig. 3D). Thus, the following three processes are likely to be involved in the refinement of the AIS during development in NL neurons: (1) activity-independent disassembly at the proximal end of the AIS (green), (2) activity-dependent disassembly at the distal end (blue), and (3) activity-independent assembly at the distal end (purple). Balancing these processes is critical, and they must be more active in the higher-CF regions.
Another possible mechanism may be that developmental stretch occurs in the axon between the soma and the AIS, which moves the entire AIS away from the soma. Such a stretch elongation may be caused by mechanical forces imposed on the axon during development (Pfister et al., 2004). In this case, the length of the AIS might be shortened solely by disassembly of the distal AIS structure.
Refinements of the AIS structure during development or by neuronal activities were observed in other neurons. The shortening of the AIS during development was reported in pyramidal neurons of the monkey prefrontal cortex, although the site of shortening, the distal or proximal end of the AIS, is unknown (Cruz et al., 2009). In mature auditory magnocellularis neurons, the distal end of the AIS was displaced distally with deprivation of afferent activity (Kuba et al., 2010). For hippocampal neurons in culture, the distal and proximal ends of the AIS were displaced distally during prolonged depolarization (Grubb and Burrone, 2010).
As to molecular mechanisms for the refinement of the AIS, the interaction of cytoskeletal proteins, ankyrinB and ankyrinG, has been proposed (Galiano et al., 2012). The distal end of the AIS is defined by a cytoskeletal boundary of ankyrinB, whose localization is determined by the interaction with ankyrinG. Indeed, upregulation of ankyrinB shifted the boundary proximally and decreased the length of the AIS, whereas upregulation of ankyrinG caused the opposite effect. These mechanisms may also operate in the refinement of the AIS during development in avian NL neurons. Other possible molecular mechanisms would be those involving the activation of voltage-gated Ca2+ channels (Grubb and Burrone, 2010) and subsequent calcineurin activity (Evans et al., 2013), as suggested by studies in hippocampal neurons.
Roles of activity in refinement of the AIS during development
There are two types of cochlea-driven activity in the auditory system. One is sound-evoked activity, and the other is spontaneous activity, which originates from intrinsic activity of cochlea (Lippe, 1994; Tritsch et al., 2007). In NL, synaptic contacts appear at ∼E9 and become functional by E10, and synapses almost fully mature before hatching (E21; Kuba et al., 2002; Rubel and Fritzsch, 2002; Gao and Lu, 2008). Sound-evoked activity can be first recorded at E12 (hearing onset; Saunders et al., 1973). The threshold, however, is still high, and natural airborne sounds cannot induce substantial auditory nerve activity until E19 (Jones et al., 2006), indicating that the refinement of the AIS would be mostly independent of auditory experiences.
In contrast, spontaneous activity appears and continues after E14 (Lippe, 1994). The spontaneous activity changes in its pattern by E19, from immature rhythmic bursting pattern to an adult-like stochastic pattern. More importantly, the frequency of bursting differs systematically along the tonotopic axis, and increases toward the higher-CF regions (Lippe, 1995), raising a possibility that the spontaneous activity may provide some instructive signals for the refinement of the AIS (Rubel and Fritzsch, 2002; Kandler et al., 2009). Indeed, AIS refinement occurs after the appearance of spontaneous activity (Fig. 3) and deprivation of this activity diminished AIS shortening to a greater extent in the higher-CF regions (Fig. 6). Nevertheless, to understand the roles of activity in the refinement of the AIS more comprehensively, further experiments to block intrinsic activity of magnocellularis neurons might be necessary (see Materials and Methods). Because NL neurons receive depolarizing GABAergic inputs from superior olivery nucleus after E15 (Code et al., 1989; Hyson et al., 1995), their contributions should be also tested in future experiments.
Functional implication of AIS refinement in NL neurons
The negative correlation between the length and distance of the AIS is optimal for neurons to secure high excitability (Kuba et al., 2006; Kuba, 2012). For example, a large distance reduces the effects of large capacitive and conductive loads of the soma, suitable for a short AIS to elicit spikes with small Na+ conductance, whereas a small distance is optimal for a long AIS to overcome its large conductive load. It is interesting to note that the length and distance of the AIS change in parallel during development. This implies that the tonotopic refinement of the AIS progresses in such a way as to preserve the negative correlation, which may contribute to enhancing the spike generation in response to synaptic inputs during immature as well as mature periods in NL neurons. In particular, spontaneous activity drives releases of trophic factors and transmitters from synaptic terminals and is critical for the development and survival of central neurons (Rubel and Fritzsch, 2002; Kandler et al., 2009). Indeed, ablation of otocysts causes reductions of cell volume and number at the nucleus magnocellularis just after the time synapses from auditory nerve would normally become functional (Parks, 1979). Thus, the coordinated change in the length and distance of the AIS may play a role in the development and maintenance of higher auditory neurons through maintaining spontaneous activity before maturation.
In conclusion, the present study characterized the developmental refinement of the AIS and its dependence on peripheral activity at the NL. The findings strengthen our understanding of how the AIS structures in NL neurons are formed and how their specific functions are achieved. Importantly, the refinement of the AIS occurs within a nucleus, implying that the genetic background of neurons would be rather homogeneous. Therefore, the results should provide a solid base for further exploration of molecules involved in determining the spatial distribution of the AIS.
Footnotes
This work was supported by grants-in-aid from MEXT (22680032 to H.K., 20220008 to H.O.) and the JST, PRESTO program (H.K.). We thank Dr. R. Yamada for critical reading of this manuscript. The ankyrinG antibody was a kind gift from Prof. G. Alcaraz.
The authors declare no competing financial interests.
References
- Bender KJ, Trussell LO. The physiology of the axon initial segment. Annu Rev Neurosci. 2012;35:249–265. doi: 10.1146/annurev-neuro-062111-150339. [DOI] [PubMed] [Google Scholar]
- Boiko T, Van Wart A, Caldwell JH, Levinson SR, Trimmer JS, Matthews G. Functional specialization of the axon initial segment by isoform-specific sodium channel targeting. J Neurosci. 2003;23:2306–2313. doi: 10.1523/JNEUROSCI.23-06-02306.2003. [DOI] [PMC free article] [PubMed] [Google Scholar]
- Bouzidi M, Tricaud N, Giraud P, Kordeli E, Caillol G, Deleuze C, Couraud F, Alcaraz G. Interaction of the Nav1.2a subunit of the voltage-dependent sodium channel with nodal ankyrinG. In vitro mapping of the interacting domains and association in synaptosomes. J Biol Chem. 2002;277:28996–29004. doi: 10.1074/jbc.M201760200. [DOI] [PubMed] [Google Scholar]
- Bréchet A, Fache MP, Brachet A, Ferracci G, Baude A, Irondelle M, Pereira S, Leterrier C, Dargent B. Protein kinase CK2 contributes to the organization of sodium channels in axonal membranes by regulating their interactions with ankyrin G. J Cell Biol. 2008;183:1101–1114. doi: 10.1083/jcb.200805169. [DOI] [PMC free article] [PubMed] [Google Scholar]
- Clark BD, Goldberg EM, Rudy B. Electrogenic tuning of the axon initial segment. Neuroscientist. 2009;15:651–668. doi: 10.1177/1073858409341973. [DOI] [PMC free article] [PubMed] [Google Scholar]
- Code RA, Burd GD, Rubel EW. Development of GABA immunoreactivity in brainstem auditory nuclei of the chick: ontogeny of gradients in terminal staining. J Comp Neurol. 1989;284:504–518. doi: 10.1002/cne.902840403. [DOI] [PubMed] [Google Scholar]
- Cruz DA, Lovallo EM, Stockton S, Rasband M, Lewis DA. Postnatal development of synaptic structure proteins in pyramidal neuron axon initial segments in monkey prefrontal cortex. J Comp Neurol. 2009;514:353–367. doi: 10.1002/cne.22006. [DOI] [PMC free article] [PubMed] [Google Scholar]
- Evans MD, Sammons RP, Lebron S, Dumitrescu AS, Watkins TB, Uebele VN, Renger JJ, Grubb MS. Calcineurin signaling mediates activity-dependent relocation of the axon initial segment. J Neurosci. 2013;33:6950–6963. doi: 10.1523/JNEUROSCI.0277-13.2013. [DOI] [PMC free article] [PubMed] [Google Scholar]
- Fried SI, Lasker AC, Desai NJ, Eddington DK, Rizzo JF., 3rd Axonal sodium-channel bands shape the response to electric stimulation in retinal ganglion cells. J Neurophysiol. 2009;101:1972–1987. doi: 10.1152/jn.91081.2008. [DOI] [PMC free article] [PubMed] [Google Scholar]
- Galiano MR, Jha S, Ho TS, Zhang C, Ogawa Y, Chang KJ, Stankewich MC, Mohler PJ, Rasband MN. A distal axonal cytoskeleton forms an intra-axonal boundary that controls axon initial segment assembly. Cell. 2012;149:1125–1139. doi: 10.1016/j.cell.2012.03.039. [DOI] [PMC free article] [PubMed] [Google Scholar]
- Gao H, Lu Y. Early development of intrinsic and synaptic properties of chicken nucleus laminaris neurons. Neuroscience. 2008;153:131–143. doi: 10.1016/j.neuroscience.2008.01.059. [DOI] [PubMed] [Google Scholar]
- Garrido JJ, Giraud P, Carlier E, Fernandes F, Moussif A, Fache MP, Debanne D, Dargent B. A targeting motif involved in sodium channel clustering at the axonal initial segment. Science. 2003;300:2091–2094. doi: 10.1126/science.1085167. [DOI] [PubMed] [Google Scholar]
- Grubb MS, Burrone J. Activity-dependent relocation of the axon initial segment fine-tunes neuronal excitability. Nature. 2010;465:1070–1074. doi: 10.1038/nature09160. [DOI] [PMC free article] [PubMed] [Google Scholar]
- Hamburger V, Hamilton HL. A series of normal stages in the development of the chick embryo. J Morphol. 1951;88:49–92. doi: 10.1002/jmor.1050880104. [DOI] [PubMed] [Google Scholar]
- Hedstrom KL, Xu X, Ogawa Y, Frischknecht R, Seidenbecher CI, Shrager P, Rasband MN. Neurofascin assembles a specialized extracellular matrix at the axon initial segment. J Cell Biol. 2007;178:875–886. doi: 10.1083/jcb.200705119. [DOI] [PMC free article] [PubMed] [Google Scholar]
- Hossain WA, Antic SD, Yang Y, Rasband MN, Morest DK. Where is the spike generator of the cochlear nerve? Voltage-gated sodium channels in the mouse cochlea. J Neurosci. 2005;25:6857–6868. doi: 10.1523/JNEUROSCI.0123-05.2005. [DOI] [PMC free article] [PubMed] [Google Scholar]
- Hyson RL, Reyes AD, Rubel EW. A depolarizing inhibitory response to GABA in brainstem auditory neurons of the chick. Brain Res. 1995;677:117–126. doi: 10.1016/0006-8993(95)00130-I. [DOI] [PubMed] [Google Scholar]
- Jenkins SM, Bennett V. Ankyrin-G coordinates assembly of the spectrin-based membrane skeleton, voltage-gated sodium channels, and L1 CAMs at Purkinje neuron initial segments. J Cell Biol. 2001;155:739–746. doi: 10.1083/jcb.200109026. [DOI] [PMC free article] [PubMed] [Google Scholar]
- Jones TA, Jones SM, Paggett KC. Emergence of hearing in the chicken embryo. J Neurophysiol. 2006;96:128–141. doi: 10.1152/jn.00599.2005. [DOI] [PubMed] [Google Scholar]
- Kandler K, Clause A, Noh J. Tonototpic reorganization of developing auditory brainstem circuits. Nat Neurosci. 2009;12:711–717. doi: 10.1038/nn.2332. [DOI] [PMC free article] [PubMed] [Google Scholar]
- Katz LC, Shatz CJ. Synaptic activity and the construction of cortical circuits. Science. 1996;274:1133–1138. doi: 10.1126/science.274.5290.1133. [DOI] [PubMed] [Google Scholar]
- Kole MH, Stuart GJ. Signal processing in the axon initial segment. Neuron. 2012;73:235–247. doi: 10.1016/j.neuron.2012.01.007. [DOI] [PubMed] [Google Scholar]
- Konishi M. Coding of auditory space. Annu Rev Neurosci. 2003;26:31–55. doi: 10.1146/annurev.neuro.26.041002.131123. [DOI] [PubMed] [Google Scholar]
- Kuba H. Structural tuning and plasticity of the axon initial segment in auditory neurons. J Physiol. 2012;590:5571–5579. doi: 10.1113/jphysiol.2012.237305. [DOI] [PMC free article] [PubMed] [Google Scholar]
- Kuba H, Ohmori H. Roles of axonal sodium channels in precise auditory time coding at nucleus magnocellularis of the chick. J Physiol. 2009;587:87–100. doi: 10.1113/jphysiol.2008.162651. [DOI] [PMC free article] [PubMed] [Google Scholar]
- Kuba H, Koyano K, Ohmori H. Development of membrane conductance improves coincidence detection in the nucleus laminaris of the chicken. J Physiol. 2002;540:529–542. doi: 10.1113/jphysiol.2001.013365. [DOI] [PMC free article] [PubMed] [Google Scholar]
- Kuba H, Yamada R, Fukui I, Ohmori H. Tonotopic specialization of auditory coincidence detection in nucleus laminaris of the chick. J Neurosci. 2005;25:1924–1934. doi: 10.1523/JNEUROSCI.4428-04.2005. [DOI] [PMC free article] [PubMed] [Google Scholar]
- Kuba H, Ishii TM, Ohmori H. Axonal site of spike initiation enhances auditory coincidence detection. Nature. 2006;444:1069–1072. doi: 10.1038/nature05347. [DOI] [PubMed] [Google Scholar]
- Kuba H, Oichi Y, Ohmori H. Presynaptic activity regulates Na+ channel distribution at the axon initial segment. Nature. 2010;465:1075–1078. doi: 10.1038/nature09087. [DOI] [PubMed] [Google Scholar]
- Lippe WR. Rhythmic spontaneous activity in the developing avian auditory system. J Neurosci. 1994;14:1486–1495. doi: 10.1523/JNEUROSCI.14-03-01486.1994. [DOI] [PMC free article] [PubMed] [Google Scholar]
- Lippe WR. Relationship between frequency of spontaneous bursting and tonotopic position in the developing avian auditory system. Brain Res. 1995;703:205–213. doi: 10.1016/0006-8993(95)01096-3. [DOI] [PubMed] [Google Scholar]
- Lippe W, Rubel EW. Ontogeny of tonotopic organization of brain stem auditory nuclei in the chicken: implications for development of the place principle. J Comp Neurol. 1985;237:273–289. doi: 10.1002/cne.902370211. [DOI] [PubMed] [Google Scholar]
- Lorincz A, Nusser Z. Cell-type-dependent molecular composition of the axon initial segment. J Neurosci. 2008;28:14329–14340. doi: 10.1523/JNEUROSCI.4833-08.2008. [DOI] [PMC free article] [PubMed] [Google Scholar]
- Osorio N, Alcaraz G, Padilla F, Couraud F, Delmas P, Crest M. Differential targeting and functional specialization of sodium channels in cultured cerebellar granule cells. J Physiol. 2005;569:801–816. doi: 10.1113/jphysiol.2005.097022. [DOI] [PMC free article] [PubMed] [Google Scholar]
- Parks TN. Afferent influences on the development of the brain stem auditory nuclei of the chicken: otocyst ablation. J Comp Neurol. 1979;183:665–677. doi: 10.1002/cne.901830313. [DOI] [PubMed] [Google Scholar]
- Parks TN. Changes in the length and organization of nucleus laminaris dendrites after unilateral otocyst ablation in chick embryos. J Comp Neurol. 1981;202:47–57. doi: 10.1002/cne.902020105. [DOI] [PubMed] [Google Scholar]
- Parks TN, Gill SS, Jackson H. Experience-independent development of dendritic organization in the avian nucleus laminaris. J Comp Neurol. 1987;260:312–319. doi: 10.1002/cne.902600211. [DOI] [PubMed] [Google Scholar]
- Pfister BJ, Iwata A, Meaney DF, Smith DH. Extreme stretch growth of integrated axons. J Neurosci. 2004;24:7978–7983. doi: 10.1523/JNEUROSCI.1974-04.2004. [DOI] [PMC free article] [PubMed] [Google Scholar]
- Rasband MN. The axon initial segment and the maintenance of neuronal polarity. Nat Rev Neurosci. 2010;11:552–562. doi: 10.1038/nrn2852. [DOI] [PubMed] [Google Scholar]
- Rathouz M, Trussell L. Characterization of outward currents in neurons of the avian nucleus magnocellularis. J Neurophysiol. 1998;80:2824–2835. doi: 10.1152/jn.1998.80.6.2824. [DOI] [PubMed] [Google Scholar]
- Rothman JS, Manis PB. The roles potassium currents play in regulating the electrical activity of ventral cochlear nucleus neurons. J Neurophysiol. 2003;89:3097–3113. doi: 10.1152/jn.00127.2002. [DOI] [PubMed] [Google Scholar]
- Rubel EW, Fritzsch B. Auditory system development: primary auditory neurons and their targets. Annu Rev Neurosci. 2002;25:51–101. doi: 10.1146/annurev.neuro.25.112701.142849. [DOI] [PubMed] [Google Scholar]
- Rubel EW, Parks TN. Organization and development of brain stem auditory nuclei of the chicken: tonotopic organization of n. magnocellularis and n. laminaris. J Comp Neurol. 1975;164:411–433. doi: 10.1002/cne.901640403. [DOI] [PubMed] [Google Scholar]
- Rubel EW, Smith DJ, Miller LC. Organization and development of brain stem auditory nuclei of the chicken: ontogeny of n. magnocellularis and n. laminaris. J Comp Neurol. 1976;166:469–489. doi: 10.1002/cne.901660408. [DOI] [PubMed] [Google Scholar]
- Rush AM, Dib-Hajj SD, Waxman SG. Electrophysiological properties of two axonal sodium channels, Nav1.2 and Nav1.6, expressed in mouse spinal sensory neurones. J Physiol. 2005;564:803–815. doi: 10.1113/jphysiol.2005.083089. [DOI] [PMC free article] [PubMed] [Google Scholar]
- Sánchez-Ponce D, Tapia M, Muñoz A, Garrido JJ. New role of IKKα/β phosphorylated IκBα in axon outgrowth and axon initial segment development. Mol Cell Neurosci. 2008;37:832–844. doi: 10.1016/j.mcn.2008.01.010. [DOI] [PubMed] [Google Scholar]
- Sánchez-Ponce D, DeFelipe J, Garrido JJ, Muñoz A. Developmental expression of Kv potassium channels at the axon initial segment of cultured hippocampal neurons. PLoS One. 2012;7:e48557. doi: 10.1371/journal.pone.0048557. [DOI] [PMC free article] [PubMed] [Google Scholar]
- Saunders JC, Coles RB, Gates RR. The development of auditory evoked responses in the cochlea and cochlear nuclei of the chick. Brain Res. 1973;63:59–74. doi: 10.1016/0006-8993(73)90076-0. [DOI] [PubMed] [Google Scholar]
- Smith DJ, Rubel EW. Organization and development of brain stem auditory nuclei of the chicken: dendritic gradients in nucleus laminaris. J Comp Neurol. 1979;186:213–239. doi: 10.1002/cne.901860207. [DOI] [PubMed] [Google Scholar]
- Tritsch NX, Yi E, Gale JE, Glowatzki E, Bergles DE. The origin of spontaneous activity in the developing auditory system. Nature. 2007;450:50–55. doi: 10.1038/nature06233. [DOI] [PubMed] [Google Scholar]
- Van Wart A, Trimmer JS, Matthews G. Polarized distribution of Ion channels within microdomains of the axon initial segment. J Comp Neurol. 2007;500:339–352. doi: 10.1002/cne.21173. [DOI] [PubMed] [Google Scholar]
- von Bartheld CS, Code RA, Rubel EW. GABAergic neurons in brainstem auditory nuclei of the chick: distribution, morphology, and connectivity. J Comp Neurol. 1989;287:470–483. doi: 10.1002/cne.902870406. [DOI] [PubMed] [Google Scholar]
- Wirth MJ, Kuenzel T, Luksch H, Wagner H. Identification of auditory neurons by retrograde labelling for patch-clamp recordings in a mixed culture of chick brainstem. J Neurosci Methods. 2008;169:55–64. doi: 10.1016/j.jneumeth.2007.11.015. [DOI] [PubMed] [Google Scholar]
- Yamada R, Okuda H, Kuba H, Nishino E, Ishii TM, Ohmori H. The cooperation of sustained and phasic inhibitions increases the contrast of ITD-tuning in low-frequency neurons of the chick nucleus laminaris. J Neurosci. 2013;33:3927–3938. doi: 10.1523/JNEUROSCI.2377-12.2013. [DOI] [PMC free article] [PubMed] [Google Scholar]
- Yang Y, Ogawa Y, Hedstrom KL, Rasband MN. βIV spectrin is recruited to axon initial segments and nodes of Ranvier by ankyrinG. J Cell Biol. 2007;176:509–519. doi: 10.1083/jcb.200610128. [DOI] [PMC free article] [PubMed] [Google Scholar]
- Zhou D, Lambert S, Malen PL, Carpenter S, Boland LM, Bennett V. AnkyrinG is required for clustering of voltage-gated Na channels at axon initial segments and for normal action potential firing. J Cell Biol. 1998;143:1295–1304. doi: 10.1083/jcb.143.5.1295. [DOI] [PMC free article] [PubMed] [Google Scholar]