Abstract
In 2015, a nation-wide effort was launched to track the careers of over 10,000 MD-PhD program graduates. Data were obtained by surveys sent to alumni, inquiries sent to program directors, and searches in American Association of Medical Colleges (AAMC) databases. Here, we present an analysis of the data, focusing on the impact of sex, race, and ethnicity on career outcomes. The results show that diversity among trainees has increased since the earliest MD-PhD programs, although it still lags considerably behind the US population. Training duration, which includes time to graduation as well as time to first independent position, was similar for men and women and for minority and nonminority alumni, as were most choices of medical specialties. Regardless of minority status and sex, most survey responders reported that they are working in academia, research institutes, federal agencies, or industry. These similarities were, however, accompanied by several noteworthy differences: (a) Based on AAMC Faculty Roster data rather than survey responses, women were less likely than men to have had a full-time faculty appointment, (b) minorities who graduated after 1985 had a longer average time to degree than nonminorities, (c) fewer women and minorities have NIH grants, (d) fewer women reported success in moving from a mentored to an independent NIH award, and (e) women in the most recent graduation cohort reported spending less time on research than men. Collectively, these results suggest that additional efforts need to be made to recruit women and minorities into MD-PhD programs and, once recruited, to understand the drivers behind the differences that have emerged in their career paths.
Introduction
In 2014, the NIH Physician-Scientist Workforce Advisory Group examined the health of the physician-scientist workforce in America and found that only 1.4% of US physicians listed research as their major activity, and only 8,200 physicians were principal investigators on NIH research grants (1). Although the latter number had been stable for a decade at the time of the report, this apparent stability masked a demographic that was increasingly composed of older investigators, most of whom were white men. The advisory group’s report noted this lack of diversity and emphasized that failure to involve a more diverse cross-section of the US population in NIH-funded research reduced the likelihood of solving problems caused by acute and chronic disease.
Physician-scientist training programs in medical school and beyond play an important role in the selection and training of physician scientists. Although MD-PhD programs are not the only means to train physician-scientists, they have become one of the largest and best known. Collectively, these programs attract a high proportion of the limited number of college students and graduates considering careers as physician-scientists. MD-PhD programs also consume a substantial fraction of the scholarship aid given by medical schools (2). In 2015, an effort to track all alumni of MD-PhD programs since the programs were launched 60 years ago was established as a joint project of the MD-PhD section of the American Association of Medical Colleges (AAMC), the leadership of the individual MD-PhD programs, and the research staff of the AAMC. Eighty programs participated, representing 92% of then-current trainees and 44 of the 45 programs that were receiving NIH Medical Scientist Training Program (MSTP) T32 training grant support at the time. A total of 10,591 graduates were identified. Surveys were completed by 64% of alumni (76% of whom had valid email addresses) and combined with data on all alumni from the AAMC Student Records System (SRS), Faculty Roster (FR), and Graduate Medical Education-Track (GME-Track) databases. This produced a data set substantially larger than anything available previously, much of which was included in a 2018 AAMC report (3).
In the accompanying manuscript, we returned to the MD-PhD outcomes data set and performed additional analyses focusing on the relationship between student choices of clinical specialties and career outcomes, the variability in research effort between and within medical specialties, and how the growth in total training duration varies by clinical field (4). Here, we examine the association of sex, race, and ethnicity with key metrics, including time to degree, residency field choice, workplace, time to first independent position in academia, research effort, and research support. Overall, the results show that the career paths of men, women, minorities, and nonminorities are remarkably similar. However, the proportion of women and minorities in MD-PhD programs continues to lag behind the US population as a whole, and after taking survey nonresponders into account, women were less likely than men to have had a full-time appointment at an academic medical center, a smaller proportion of women and minorities reported having NIH grants, and in the most recent graduation cohort, women reported spending somewhat less time on research than men, which is a change from earlier cohorts when there were fewer women.
Methods
This and the accompanying paper (4) analyze a dataset that merged person-level responses from the 2015 MD-PhD Program Outcomes Survey and AAMC data on the 6,786 individuals who completed the survey (3). Briefly, 80 MD-PhD programs, including all but 1 of the 45 programs that were receiving National Institute of General Medical Sciences (NIGMS) MSTP grants at the time, participated in the outcomes survey. The programs identified 10,591 alumni and provided valid email addresses for 8,944 (84%) to the AAMC data unit. Each individual received an email from the current director of the program from which they graduated, informing them that the program was participating in a national MD-PhD program outcomes study and that they would receive an email on a specified date from AAMC with an individualized active URL link to the online survey. Survey responses were collected on an AAMC server using Verint software. The AAMC IRB approved the survey and the data collection and analysis processes. In the first question, participants were asked to grant permission to share their deidentified data with the authors. Individuals with valid email addresses who did not respond to the initial email received subsequent emails from the director of their former program and then from AAMC on 3 subsequent occasions, approximately 1, 2, and 3 months after the initial distribution of the survey. Survey data collection ended in June 2015. The authors have signed a data-sharing agreement with AAMC.
Data for sex, race, ethnicity, and years of matriculation and graduation were obtained from AAMC databases for each survey responder, as described previously (3). Sex was a dichotomous variable, either male or female. The AAMC databases lacked information on sex for 9 individuals in the dataset. A second dichotomous variable was created, underrepresented in medicine (UIM), to identify all individuals who included in their self-reported race/ethnicity designation in AAMC databases that they belonged to 1 or more of the following groups, American Indian or Alaska Native, Black or African American, Hispanic or Latino of Spanish origin, and Native Hawaiian or Other Pacific Islander. Members of these groups are designated by the NIH as underrepresented in the biomedical science workforce, regardless of whether they also identify as belonging to other race/ethnicity groups. The non-UIM group included everyone else (6,298 individuals) who did not report belonging to one of these groups. This included 187 individuals who were listed as “non-US citizen” and for whom race/ethnicity information was not provided, as well as 110 individuals for whom the race/ethnicity information was designated as “unknown” (59 responders) or “other”, with no additional specification (51 responders). It should be noted that the AAMC changed the methods used to collect information on race and ethnicity in 2003 and again in 2014. Prior to 2003, individuals could only select 1 race/ethnicity response option, even if they self-identified with multiple races/ethnicities, and a separate question asked about an individual’s Hispanic origin. After 2003, individuals could select multiple response options, but the race and Hispanic origin questions remained separate. In 2014, the Hispanic origin and race response options became a single question, allowing multiple response options. As a result, the data after 2003 includes some duplicated counts of race/ethnicity responses, and the category totals may be higher than the total number of unique individuals. The AAMC updates race and ethnicity information based on the most recent entry in the American Medical College Application Service (AMCAS), Electronic Residency Application Service (ERAS), SRS, GME-Track, and FR databases, which means that, for some individuals, the information may have been updated. Because of these changes in methodology, comparisons of data before and after 2003 and 2014 must be done with caution. In this paper, we have chosen to present data on race and ethnicity based on the specific designations by each individual. The survey response rates were essentially the same for men (64%) and women (66%), and for each of the racial and ethnic groups (3).
Data analysis.
Deidentified information released to us by the AAMC was provided in the form of Microsoft Excel spreadsheets that included birth year, years of matriculation and graduation, sex, race, ethnicity, employment status, residency field, initial and current workplace type, academic rank, distribution of professional effort, and research awards. When indicated, comparisons were made using an unpaired 2-tailed t test, or a 1-way ANOVA using either Dunnett’s multiple comparison test to compare multiple groups to a single group or Tukey’s multiple comparisons test to compare all data points to each other (GraphPad Prism 7).
Results
Men and women.
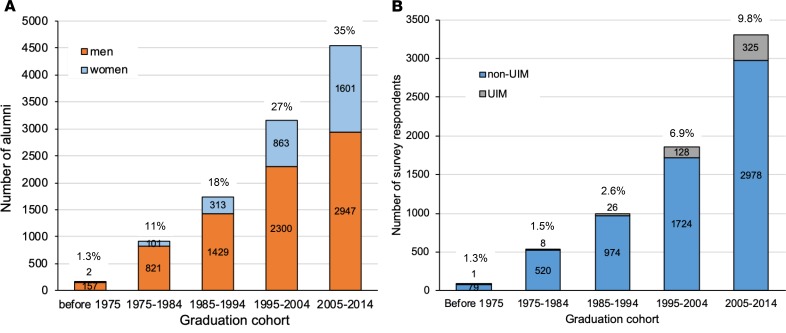
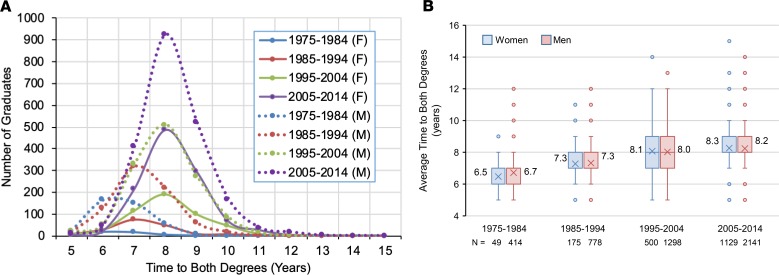
The first MD-PhD programs were organized in the 1950s, when most medical schools enrolled few women and minorities (5). The national MD-PhD program outcomes study identified only 2 women among the 159 graduates prior to 1975 (3). Since then, the number of individuals graduating from MD-PhD programs has increased substantially, as has the percentage of graduates who are women (Figure 1A). However, in contrast to medical school in general, parity has not been achieved in MD-PhD programs for either the percentage of female applicants and matriculants (respectively, 45% and 46% in the 2018 academic year; AY2018) (6) or the percentage of graduates. In AY2018, women represented only 40% of 5,563 current MD-PhD program trainees (7). As noted elsewhere, there has been an upward trend in the average time to degree in MD-PhD programs, increasing from approximately 6.4 years for the earliest graduates to approximately 8.3 years for recent graduates (3, 4, 8). Figure 2 breaks these numbers down by sex, showing that the average time to degree has been similar for men and women (Supplemental Figure 1; supplemental material available online with this article; https://doi.org/10.1172/jci.insight.133010DS1).
Figure 1. Distribution of MD-PhD program graduates by sex and race/ethnicity who graduated during the indicated decadal intervals.
(A) Numbers of men (orange) and women (blue) who graduated in the indicated cohorts. Percentage of women graduates is indicated above each bar. Note that the numbers represent all graduates identified by the participating programs, including survey responders and nonresponders. (B) Number of survey responders who identified as belonging to a group defined by the NIH as underrepresented in medicine (UIM) (gray) and all other survey responders (non-UIM) (blue) who graduated in the indicated cohorts. Percentage of UIM graduates is indicated above each bar.
Figure 2. Time to graduation with both degrees as a function of sex and decade of graduation for survey responders.
(A) Time to degree distribution. Women, solid lines; men, dotted lines. (B) Box and whisker plot of time to both degrees for women (blue bars) and men (red bars) as a function of decade of graduation. Boxes indicate the second and third quartiles. Whiskers are drawn using Tukey’s criteria of 1.5× the interquartile range. Outliers beyond the whiskers are shown. X indicates the average, which is indicated to the left or right of the box. Horizontal bar in the box indicates the median. In Supplemental Figure 1, the data are displayed in bar graph format showing the mean ± SEM.
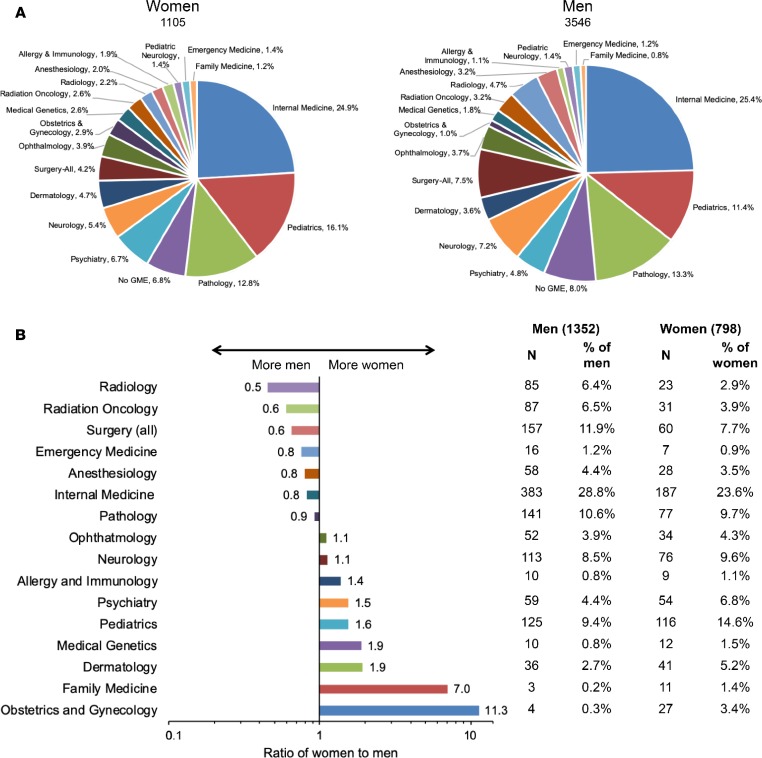
Residency field selection by MD-PhD program graduates who completed the survey and who had completed postgraduate training by 2015 is shown in Figure 3A. The data show an unequal distribution among clinical specialties, which has been noted previously (8, 9) and is generally similar for men and women. The proportion of graduates who choose not to do a residency is also similar for men and women. However, Figure 3B highlights differences among alumni who were still in residency/fellowship training at the time that the data were collected. Men were more likely to choose internal medicine, surgery, radiation oncology, and radiology, while women were more likely to choose psychiatry, pediatrics, medical genetics, dermatology, family medicine, and obstetrics/gynecology. The latter 2 specialties stand out, as both attract a much higher proportion of female graduates than male, but overall, neither family medicine nor obstetrics/gynecology has attracted many graduates of MD-PhD programs.
Figure 3. Choice of graduate medical education (GME) specialty for all survey respondents who had completed postgraduate training subdivided by sex.
(A) GME choice by sex. (B) Differences in GME choice for alumni currently in training by sex. Numbers next to each bar gives the ratio of the percentage of women divided by the percentage of men training in the indicated specialty. Note that the x axis is a log scale. Table shows the numbers of men and women and the percentage training in each specialty.
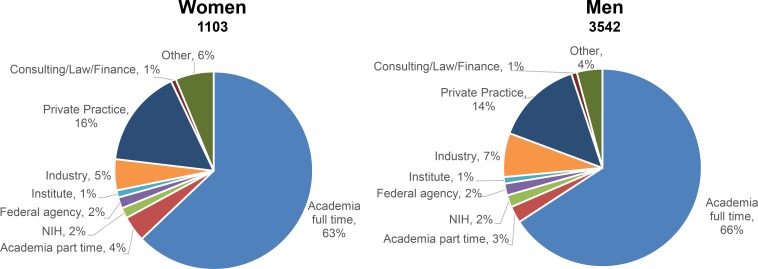
The survey also asked alumni to categorize their current workplace. Figure 4 shows the data for all survey responders who had completed postgraduate training. There were no substantial differences by sex. A slightly higher percentage of men than women who answered the survey were in academia full-time (66% vs. 63%) at the time of the survey, and slightly more women than men were in private practice (16% vs. 14%). Among alumni who had graduated but had not yet completed postgraduate training at the time of the survey, 87% of 1,317 men and 85% of 787 women indicated that they hoped to begin their career in academia, and only 4.5% of men and 4.8% of women indicated that their goal was private practice (3).
Figure 4. Current workplace of survey respondents who have completed postgraduate training as a function of sex.
It is worth emphasizing that the data summarized in Figure 4 are from survey responders. Although nearly two-thirds of alumni completed the survey, program-supplied data in the accompanying paper make it clear that there are differences that distinguish those alumni who responded to the survey from those who did not (4). Since the program-supplied data were not broken down by sex, the AAMC FR database was queried for all MD-PhD program alumni to determine whether they currently have or previously had a full-time appointment in academia. In contrast to the survey results, the FR database showed that a higher proportion of men (60%) than women (52%) either have or had a full-time faculty appointment at a medical school. For survey responders, the results were 71% (men) vs. 66% (women). For nonresponders, the results were 48% (men) vs. 38% (women). Thus, the differences we had noted between survey responders and nonresponders as a whole continue when male and female subgroups are compared.
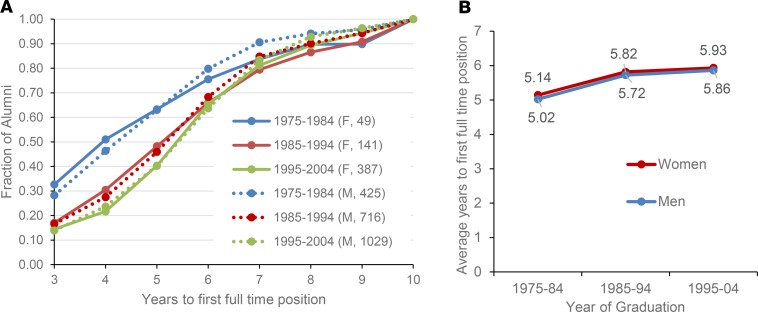
Total training duration for MD-PhD trainees includes both the time to degree and the time from graduation until the first nontrainee appointment. Like time to degree, the time to a first position in academia, NIH or other Federal agency, the pharmaceutical or biotechnology industries, or nongovernmental research institutes has been increasing (3, 4). Figure 5 breaks this down by graduation cohort and sex for survey responders. There were no meaningful differences between men and women.
Figure 5. Time to first job as a function of sex and decade of graduation.
(A) Time to first full-time job after completion of postgraduate training for the survey respondents whose first position was in either academia full-time, NIH or other federal agency, the pharmaceutical or biotech industries, or nongovernmental research institutes expressed as a fraction of the alumni at each time after graduation and decade of graduation. The number of individuals in each cohort is listed in parentheses. Note the rightward shift of the curves as a function of decade of graduation. Women, solid lines; men, dotted lines. (B) The average time to first full-time position for the cohort shown in A as a function of decade of graduation. Data for the cohort who graduated between 2005–2014 was not included in this analysis because most of them were still in postgraduate training.
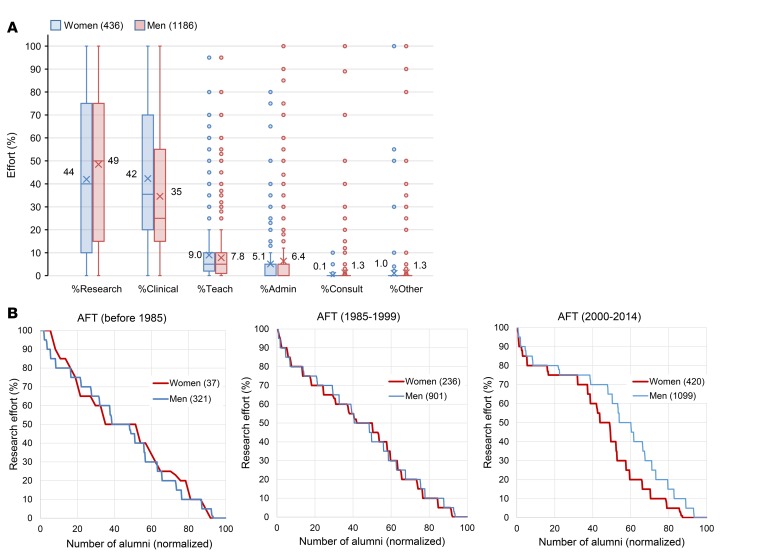
The survey also asked alumni who had completed postgraduate training to indicate how they divided their time between research, clinical care, teaching, and administration. Teaching was defined as including classroom lectures, small group preceptorships, and teaching in the clinical setting. Time spent teaching students and postdocs in their laboratory was included as research time. The results are shown in Figure 6A. Men reported spending a greater percentage of their effort on research than women (men 49% vs. women 44%), while women reported spending more of their time on clinical care (men 42% vs. women 35%). Figure 6B shows the distribution of research effort for men and women survey responders in academia full-time broken into 3 cohorts: before 1985, from 1985–1999, and from 2000–2014. Approximately 40% of individuals in the first 2 cohorts reported devoting 50% or more of their time to research, with no differences between men and women. In the most recent cohort, however, a significant difference emerged, with men reporting more research effort than women.
Figure 6. Research and other effort for alumni who have completed postgraduate training with a current position in academia full-time (AFT) by sex.
(A) Average percent effort for research, clinical, teaching, administration, consulting, and other for women (red bars) and men (blue bars). For each individual, total effort had to sum to 100%. (B) Percent research effort for graduates by sex and graduation cohort. Individuals are rank ordered by reported research effort, and the percentage of individuals reporting a given research effort is plotted for women (red line) and men (blue line). The number of women and men in each cohort is indicated. For AFT (2000–2014), there is a significant difference in the research effort for women and men by unpaired 2-tailed t test (P = 0.0004).
Information about research funding is challenging to obtain since there are no publicly available databases that include awards from sources other than the NIH, and the NIH RePORTER database was not searchable with our list of over 10,000 program graduates. Instead, we relied on the survey, asking program graduates whether they were either currently or previously the principal investigator on a research grant. Potential funding sources included NIH-mentored career development awards (K grants), NIH research project grants (RPG; R, P, and U types), other federal agencies, private foundations, the pharmaceutical industry, other industry, and other funding sources.
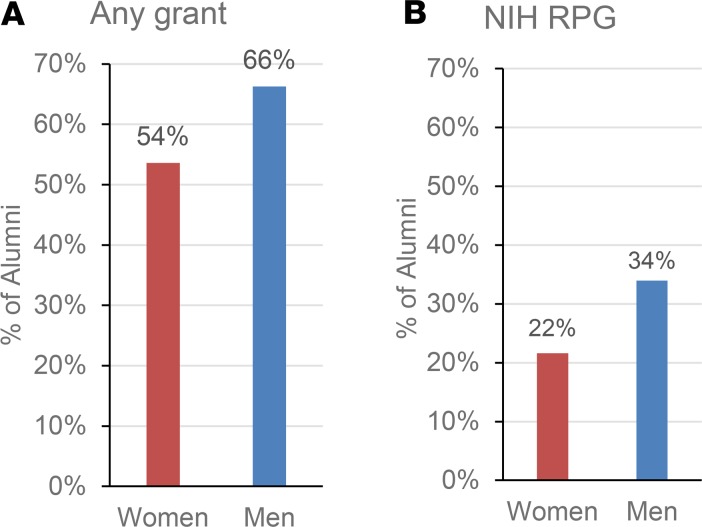
There were 3,081 survey responders whose current position was either in academia (3,030 responders) or a research institute other than the NIH (51 responders). Of these, 1,664 (54%) had applied for NIH RPGs as principal investigator and 1,285 (42%) had received awards, a 77% success rate for those who applied. The success rate for women (73%) was slightly lower than for men (78%). Notably, many alumni reported having research support from sources other than the NIH. Of the 2,331 men and 694 women in academia full-time, 82% of men and 69% of women reported having or having been the principal investigator of a research grant from any source. A total of 45% of the men but only 29% of the women reported being or having been a principal investigator on an NIH RPG. For those in academia, 54% of women and 66% of men reported currently being a principal investigator on a grant from any source (Figure 7A). The percent reporting that they were currently a principal investigator on an NIH RPG was 22% for women and 34% for men (Figure 7B). In keeping with their underrepresentation among MD-PhD program alumni, many fewer women (178 women) than men (679 men) reported having previously (but not currently) held an NIH K award. Of those who did, 75% of the men, but only 61% of the women reported subsequent receipt of an NIH RPG (a 72% K-to-R conversion rate, overall). Both of these numbers compare favorably to recently published conversion rates for K01, K08, K23, and K99 awards, keeping in mind that the data analyzed here are limited to survey responders (1, 10).
Figure 7. Principal investigator (PI) research grant support for alumni with a current position in academia full-time by sex.
(A) Percentage of women and men with current PI grant support from any grant source. (B) Percentage of women and men with current PI NIH research project grant (RPG) support.
Race and ethnicity.
There were 488 survey responders (7.2%) who identified as belonging to a racial or ethnic group defined as UIM by the NIH. For this analysis, all other survey responders were grouped and referred to as non-UIM. Figure 1B displays the numbers of UIM and non-UIM survey responders grouped by graduation cohort. Of the 488 individuals, 49.2% identified as African American/Black, 5.9% identified as Alaska Native/American Indian/Native Hawaiian/Other Pacific Islander, and 47.1% identified as Hispanic/Latino. These percentages add to more than 100% because individuals can identify with multiple race/ethnicity categories. In 2018, individuals who identified as belonging to 1 or more of these UIM groups represented 10.4% of MD-PhD program matriculants (11). Although census data are not necessarily the best comparators for this purpose (12), 10.4% is much smaller than the percentage of individuals who reported belonging to 1 of these groups in the 2010 US census (12.4% Black or African American, 0.9% American Indian and Native Alaskan, 0.2% Native Hawaiian and other Pacific Islander, 2.9% two or more races, and 16.3% Hispanic or Latino). Note that these numbers may be underestimates, since 60 individuals were categorized as “Multiple Race/Ethnicity,” some of whom may be UIM.
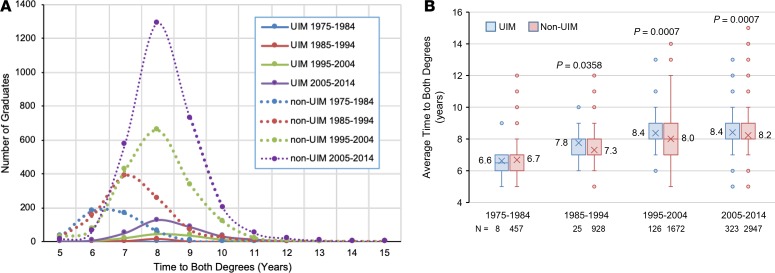
We asked whether or not there are substantial differences between UIM and non-UIM survey responders with respect to key metrics such as training duration, residency field choices, workplace, time to first position, research effort, and research support. Of the 488 UIM survey responders, 267 had completed postgraduate clinical training and 221 were still in postgraduate clinical training. There was only 1 UIM survey responder among the 159 who graduated prior to 1975. Average time to degree for UIM and non-UIM graduates is shown in Figure 8. The data replicate the increase in time to degree seen from the earliest to the most recent graduates. Since 1985, the time to degree was significantly longer for UIM than non-UIM (Figure 8B and Supplemental Figure 2).
Figure 8. Time to graduation with both degrees as a function of underrepresented in medicine (UIM) status and decade of graduation.
(A) Time to degree distribution by UIM status and decade of graduation. UIM, solid lines; non-UIM, dotted lines. Colors indicate graduation decade cohort. Note that all of the UIM curves are below 200 graduates. (B) Box and whisker plots of time to both degrees for UIM (blue bars) and non-UIM (red bars) as a function of decade of graduation. Boxes indicate the second and third quartiles. Whiskers are drawn using Tukey’s criteria of 1.5× the interquartile range. Outliers beyond the whiskers are shown. Boxes indicate the second and third quartiles. Whiskers are drawn using Tukey’s criteria of 1.5× the interquartile range. Outliers beyond the whiskers are shown. X indicates the average, which is indicated to the left or right of the box. Horizontal bar in the box indicates the median. P values indicate significant difference between UIM and non-UIM by unpaired 2-tailed t test. In Supplemental Figure 2, the data are displayed in bar graph format showing the mean ± SEM.
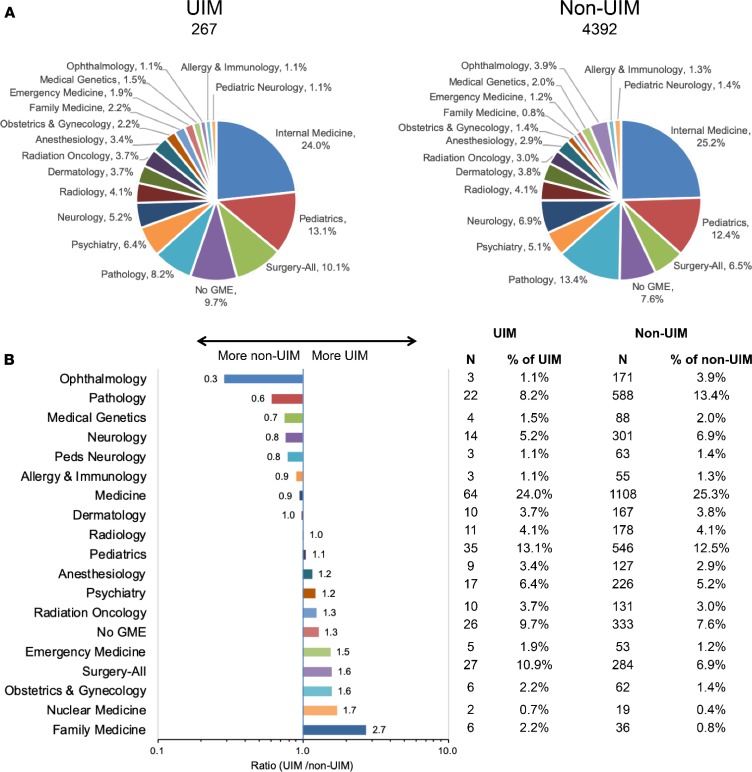
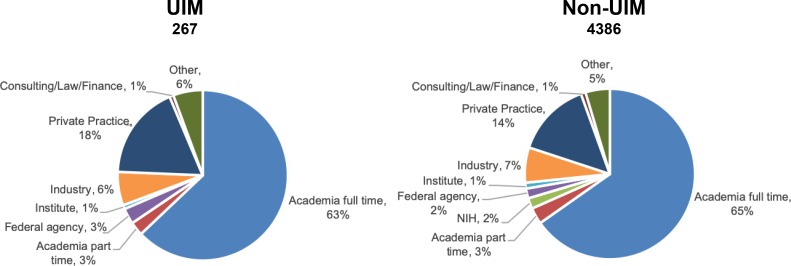
Choices of clinical specialty were similar between UIM and non-UIM alumni (Figure 9A). The largest differences were in ophthalmology and family medicine, neither of which attracted many alumni (Figure 9B). Surgery attracted more UIM alumni than non-UIM alumni. Internal medicine and pediatrics attracted similar proportions of the 2 groups. Among survey responders, workplace choices were also very similar between UIM and non-UIM alumni (Figure 10). Anticipated first workplace choices by those who were in training at the time of the survey were very similar: 84% of UIM and 86% of non-UIM alumni desired a position in academia full-time. Private practice was the indicated career plan for only 7% of UIM and 4% of non-UIM alumni who were currently in training (3).
Figure 9. Choice of graduate medical education (GME) specialty by all survey respondents who have completed postgraduate training subdivided by UIM status.
(A) GME choice by UIM status. (B) Differences in GME choice for alumni who have completed training by UIM status. The x axis scale is the ratio (%UIM/%non-UIM) training in a given specialty. Numbers next to each bar gives the ratio of the percentage of UIM divided by the percentage of non-UIM training in the indicated specialty. Note that the x axis is a log scale. Table shows the numbers of UIM and non-UIM alumni and the percentage training in each specialty.
Figure 10. Current workplace of survey respondents who have completed postgraduate training as a function of UIM status.
The numbers add to more than 100% due to rounding errors.
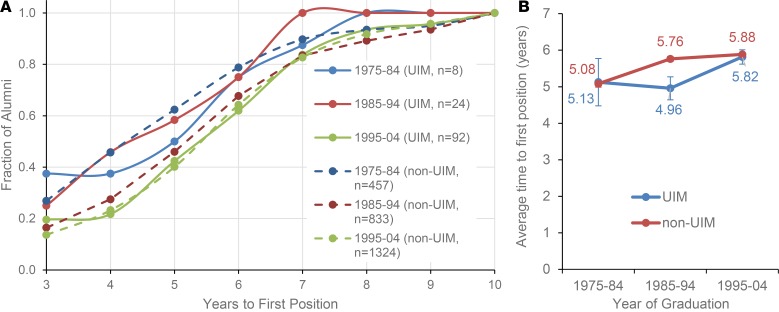
Figure 11 summarizes data provided by survey responders for the time to first nontrainee position either in academia, NIH or other Federal agency, the pharmaceutical or biotechnology industries, or nongovernmental research institutes. The number of UIM individuals is small in the 1975–1984 (n = 8) and 1985–1994 (n = 24) cohorts, so it is difficult to make much of the differences observed. In the 1995–2004 cohort, the difference in time to first nontrainee position is small. Comparison of the data in Figure 8 and Figure 11 suggests that the overall training duration may not be meaningfully different between UIM and non-UIM trainees for the 3 decades from 1985–2014.
Figure 11. Time to first job as a function of UIM status and decade of graduation.
(A) Time to first full-time job after completion of postgraduate training for the survey respondents whose first position was either in academia full-time, NIH or other federal agency, the pharmaceutical or biotech industries, or nongovernmental research institutes expressed as a fraction of the alumni at each time after graduation and decade of graduation. The number of individuals in each cohort is listed in parentheses. Note the rightward shift of the curves as a function of decade of graduation. UIM, solid lines; non-UIM, dotted lines. Colors indicate decade of graduation. (B) The average time to first full-time job for the cohort shown in A as a function of decade of graduation. UIM, blue bars; non-UIM, red bars. Numbers above bars indicate average time to first job. Data for the cohort who graduated between 2005–2014 was not included in this analysis because most of them were still in postgraduate training. Mean ± SEM shown.
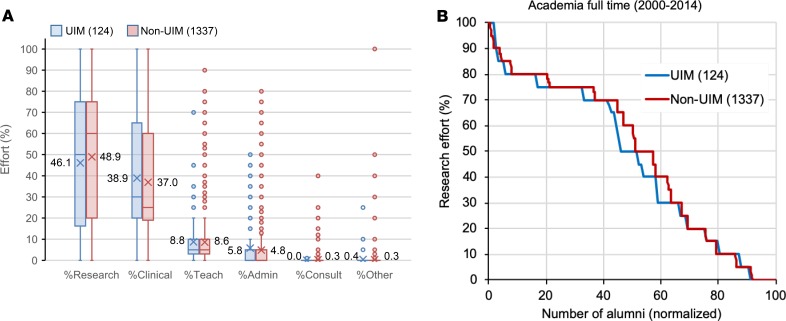
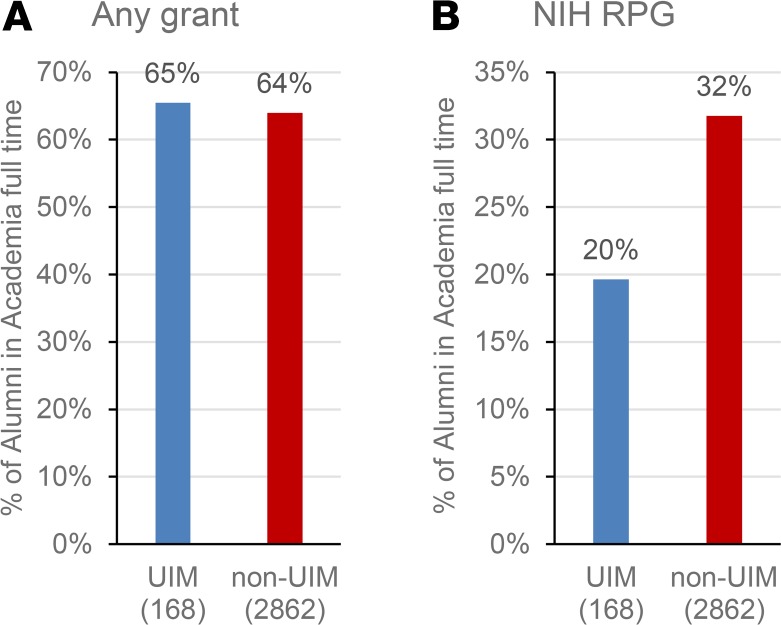
Finally, the distribution of effort among research, clinical care, teaching, and administration was the same, irrespective of UIM status, as was the self-reported research effort for those in academia who graduated from 2000–2014 (Figure 12 and Supplemental Figure 3). The proportion of survey responders in academia who reported having research support from any source was approximately 65% in both groups (Figure 13A). However, NIH support was reported by a higher proportion of non-UIM alumni than UIM alumni (32% vs. 20%) (Figure 13B). The K-to-R conversion rate reported by minorities (68%) was nearly the same as that for nonminorities (72%), but the absolute numbers were very small: 38 for minorities and 816 for nonminorities.
Figure 12. Research and other effort for alumni with a current position in academia full-time by UIM status.
(A) Average percent effort for alumni who graduated between 2000–2014 in academia full-time for research, clinical, teaching, administration, consulting, and other for UIM (blue bars) and non-UIM (red bars). For each individual, total effort had to sum to 100%. Boxes indicate the second and third quartiles. Whiskers are drawn using Tukey’s criterion of 1.5× the interquartile range. Outliers beyond the whiskers are shown. X indicates the average, which is indicated to the left or right of the box. Horizontal bar in the box indicates the median. In Supplemental Figure 3, the data are displayed in bar graph format showing the mean ± SEM. (B) Percent research effort for alumni by UIM status. Individuals are rank ordered by reported research effort and the percentage of individuals reporting a given research effort is plotted for UIM and non-UIM. The number of UIM and non-UIM is indicated in parentheses. UIM, blue line; non-UIM, red line.
Figure 13. Principal investigator (PI) research grant support for alumni with a current position in academia full-time by UIM status.
(A) Percentage of UIM and non-UIM alumni with current PI grant support from any grant source. (B) Percentage of UIM and non-UIM alumni in academia full-time with current PI NIH research project grant (RPG) support.
Discussion
The national MD-PhD program outcomes study provided an unparalleled opportunity to obtain metrics and follow-up data on nearly everyone who has graduated from an integrated MD-PhD program since they were first established in the 1950s. In this and the accompanying manuscript, we have returned to that data set, asking questions about the impact of sex, race, and ethnicity that time and space did not allow us to address previously.
First and foremost, the results show that, although the number of MD-PhD programs and the number of trainees has increased dramatically, MD-PhD programs lag behind medical school in general in achieving diversity (13). The earliest programs, like their contemporary medical schools, were overwhelmingly training white men. This has changed over time, but parity with the American population at large has not been reached. In the most recent decade for which data were obtained as part of this study, only 35% of graduates were women and only 10% met NIH definitions of underrepresented minorities. AAMC application and matriculation data for MD-PhD programs suggests that these proportions will continue to rise, but only up to a point. In 2018, the proportion of women applying to and entering MD-PhD programs was 45% and 46%, respectively (14), and — to make matters worse — a recent study observed an inverse correlation between US News and World Report research rankings for medical centers and the percentage of women in the applicant pool for their MD-PhD program (15). Black or African American, Latino or Hispanic, and multiracial applicants to MD-PhD programs were 7.1%, 5.4%, and 9.9%, respectively. The proportion of matriculants from the same 3 groups was 4.9%, 4.8%, and 8.9%, respectively. It should be noted that, in AAMC category definitions, individuals in the multiracial category do not necessarily belong to UIM groups. In the same year, the proportion of White applicants and matriculants was 45% and 49%, respectively (16). Notably, although the number of students entering medical school has continued to rise (17, 18), the number of applicants and matriculants into MD-PhD programs has been holding steady at approximately 1,800 and 600, respectively (19, 20). Students who enter MD-PhD programs tend to complete them. The overall attrition rate is approximately 10%–15% (8). The present study focused entirely on people who completed MD-PhD programs and doesn’t include information on attrition. Nonetheless, the data suggest that MD-PhD programs are moving toward greater diversity; however, parity with the American population remains over the horizon. Achieving parity will require greater success for efforts to increase and diversify the applicant pool and an increase in the proportion who matriculate.
In addition to demographics, the present work focused on 6 metrics: (a) training duration, (b) residency choices, (c) current and intended workplace, (d) time to first independent position in academia, (e) research effort, and (f) research funding from NIH and non-NIH sources. We found similarities and differences. For example, total training duration was similar among the cohorts examined, although time to degree was about 5% longer for minority trainees. Residency choices were generally similar for men and women, with the greatest differences occurring in fields that have attracted only a small number of MD-PhD graduates. Among the most popular fields, more women have chosen pediatrics and more men have chosen internal medicine, pathology, and neurology, but the differences are not large. Medicine and pediatrics were equally prevalent among minority and nonminority alumni, but ophthalmology was less popular, and surgery, obstetrics/gynecology, and family medicine were more prevalent among minority alumni. It is interesting to compare these results with those recently reported by Lett et al. (21). That study examined demographic data on physicians in academia and also noted the comparative overrepresentation of some minorities in obstetrics/gynecology and family medicine. Most other specialties were found to be underrepresented with respect to census data, which is a different comparator than used here.
Current workplaces, at the time of the survey, and intended first workplaces for those who were still in postgraduate training were similar among the groups examined, with most choosing careers in academia. This similarity echoes the results obtained by Jeffe and Andriole in their study of MD-PhD program graduates using data from the AAMC medical school graduation survey (22). Intended first workplace is an interesting metric because it reflects the thinking of MD-PhD alumni who were still in postgraduate training at the time of the survey in 2015. Their survey responses indicate that about 85% of them hoped for a career in academia, which is much higher than medical school graduates in general (23) and even higher than the approximately two-thirds of MD-PhD program alumni who have completed postgraduate training and are currently employed in academia. Does this forecast a change over the next decade? Or will other options attract MD-PhD alumni, either because they have decided not to work in academia or because they didn’t succeed in obtaining and keeping a faculty position?
Finally, the data in the accompanying paper show that MD-PhD alumni who work in academia vary greatly in the amount of time devoted to research that they reported (4). There is definitely not a bimodal distribution, with some alumni devoting all or nearly all of their professional effort to research, while others devote little or none. In general, this was true when comparisons were made by race, ethnicity, and sex. We found no differences between minority and nonminority alumni with respect to research effort or the fraction of those in academia who reported having research grant funding from any source, and there was only a small difference in K-to-R conversion rates. However, the proportion of underrepresented minorities who reported having NIH grants was distinctly lower than nonminorities.
Women have been and continue to be underrepresented in the ranks of physician-scientists. For the women in academia who answered the survey, we found no differences with men in research effort for the pre-1985 and 1985–1999 cohorts, but women in the 2000–2014 cohort, a group just entering their career, reported having less research effort than their male counterparts. The differences were not large, but a smaller proportion of female MD-PhD alumni in academia reported having NIH grants and fewer made the K-to-R transition, a difference that was also noted by Jagsi et al. in studies of K award recipients (24, 25). All of the funding data in the present study were obtained through surveys, but a 2018 study by Hechtman et al. looked at funding longevity by sex among all NIH-funded principal investigators from 1991–2010 using NIH databases as the source (26). Most of the investigators were PhDs. There were fewer women physician-scientists than men: only 23.4% of the women vs. 34.6% of the men were either MDs or MD-PhDs. The study found that funding rates were the same for men and women, but women held fewer projects on average, had less overall funding per year, had shorter NIH funding spans, and were less likely to renew existing projects. However, again, all of these differences were small.
In evaluating the results, it is worth considering the strengths and weaknesses of the study design. Strengths include the participation of nearly all of the currently active MD-PhD programs in the United States and our ability to obtain deidentified faculty appointment information on all graduates, whether they chose to return the survey or not. Weaknesses include the less-than-perfect rate of survey completion (76% of those with valid email addresses) and the lack of valid email addresses for 16% of program graduates. Evidence presented in the accompanying manuscript shows that survey responders and nonresponders are not the same, at least in terms of the choice to become a faculty member at a medical school (4). A second weakness is the very small number of minority alumni, especially from the early years of MD-PhD training programs. Survey response rates were essentially the same in all groups that were analyzed, but the numbers are small, especially for American Indians, Alaskan Natives, Pacific Islanders, and native Hawaiians — very few of whom have completed MD-PhD programs (the present study) or have become NIH-funded investigators (1). Finally, when this study began in 2014, the plan was to obtain comprehensive information about NIH grant funding awarded to all MD-PhD program alumni by cross-matching the alumni database with the NIH grant database. This proved to be a challenge and was not completed in time for the AAMC report on the outcomes study. Funding data in the present study is, as a result, limited to information provided by survey responders. On the plus side, the results we obtained are consistent with the sex differences with respect to NIH funding noted by others (24–26), and the survey data reveal, for the first time to our knowledge, the large rate at which program alumni have received research funding from sources other than the NIH.
In closing, in this study, we have used data from the National MD-PhD Programs Outcome Study to ask and answer questions about the career paths of program graduates. The results suggest that, overall, programs have been successful in training a cadre of men and women interested in careers as physician-scientists. Many of these men and women have become faculty members or are working at research institutes, the NIH, federal agencies, and biotech and pharmaceutical companies. They are also taking care of patients, hopefully in a manner that is informed by their research training. For the most part, the differences between men, women, and racial and ethnic minorities are more about numbers of trainees rather than career outcomes, although the data on differences in research funding and effort for the more recent graduates bears further investigation.
Supplementary Material
Acknowledgments
We thank Judy Shea, Professor of Medicine, University of Pennsylvania, for helpful discussions about the statistical analysis methods used in this manuscript. We also acknowledge the contributions of Irena Tartakovsky, Herschel Alexander, and Ross McKinney, of the AAMC, in the conduct of the alumni survey that was included in the National MD-PhD Outcomes Study, which provided data for this manuscript, and for their helpful feedback on an earlier version of the manuscript. The conclusions and opinions expressed here are those of the authors and do not reflect policies or opinions of the AAMC. Finally, we thank all MD-PhD program directors and administrators who supported this study by providing data and encouraging their alumni to participate in the survey, along with all of the alumni who chose to do so.
Version 1. 10/03/2019
Electronic publication
Footnotes
Conflict of interest: The authors have declared that no conflict of exists.
Copyright: © 2019, American Society for Clinical Investigation.
Reference information: JCI Insight. 2019;4(19):e133010.https://doi.org/10.1172/jci.insight.133010.
References
- 1. Ginsburg D, et al. NIH Physician-scientist Workforce (PSW) Working Group report 2014. National Institute of Health. https://report.nih.gov/workforce/psw/index.aspx Accessed September 4, 2019.
- 2.Andriole DA, Jeffe DB. Predictors of full-time faculty appointment among MD-PhD program graduates: a national cohort study. Med Educ Online. 2016;21:30941. doi: 10.3402/meo.v21.30941. [DOI] [PMC free article] [PubMed] [Google Scholar]
- 3. Akabas MH, Tartakovsky I, Brass LF. The national MD-PhD program outcomes study. American Association of Medical Colleges Reports. 2018. [Google Scholar]
- 4.Brass LF, Akabas MH. The national MD-PhD program outcomes study: Relationships between medical specialty, training duration, research effort, and career paths. JCI Insight. 2019;4(19):e133009. doi: 10.1172/jci.insight.133009. [DOI] [PMC free article] [PubMed] [Google Scholar]
- 5.Harding CV, Akabas MH, Andersen OS. History and Outcomes of 50 Years of Physician-Scientist Training in Medical Scientist Training Programs. Acad Med. 2017;92(10):1390–1398. doi: 10.1097/ACM.0000000000001779. [DOI] [PMC free article] [PubMed] [Google Scholar]
- 6. [No authors listed]. Medical School M.D.-Ph.D. Applications and Matriculants by School, In-State Status, and Sex, 2018-2019. Association of American Medical Colleges. https://www.aamc.org/download/321544/data/factstableb8.pdf Updated November 14, 2018. Accessed September 4, 2019.
- 7. [No authors listed]. Total MD-PhD Enrollment by U.S. Medical School and Sex, 2014-2015 through 2018-2019. Association of American Medical Colleges. https://www.aamc.org/download/321554/data/factstableb11-2.pdf Updated November 19, 2018. Accessed September 4, 2019.
- 8.Brass LF, Akabas MH, Burnley LD, Engman DM, Wiley CA, Andersen OS. Are MD-PhD programs meeting their goals? An analysis of career choices made by graduates of 24 MD-PhD programs. Acad Med. 2010;85(4):692–701. doi: 10.1097/ACM.0b013e3181d3ca17. [DOI] [PMC free article] [PubMed] [Google Scholar]
- 9.Paik JC, Howard G, Lorenz RG. Postgraduate choices of graduates from medical scientist training programs, 2004-2008. JAMA. 2009;302(12):1271–1273. doi: 10.1001/jama.2009.1355. [DOI] [PMC free article] [PubMed] [Google Scholar]
- 10.Conte ML, Omary MB. NIH Career Development Awards: conversion to research grants and regional distribution. J Clin Invest. 2018;128(12):5187–5190. doi: 10.1172/JCI123875. [DOI] [PMC free article] [PubMed] [Google Scholar]
- 11. [No authors listed]. MD-PhD Matriculants to U.S. Medical Schools by Race/Ethnicity and State of Legal Residence, 2018-2019. Association of American Medical Colleges. https://www.aamc.org/download/321546/data/factstableb9.pdf Updated November 13, 2018. Accessed September 4, 2019.
- 12.Heggeness ML, Evans L, Pohlhaus JR, Mills SL. Measuring Diversity of the National Institutes of Health-Funded Workforce. Acad Med. 2016;91(8):1164–1172. doi: 10.1097/ACM.0000000000001209. [DOI] [PMC free article] [PubMed] [Google Scholar]
- 13.Andriole DA, Whelan AJ, Jeffe DB. Characteristics and career intentions of the emerging MD/PhD workforce. JAMA. 2008;300(10):1165–1173. doi: 10.1001/jama.300.10.1165. [DOI] [PubMed] [Google Scholar]
- 14. [No authors listed]. Medical School MD-PhD Applications and Matriculants by School, In-State Status, and Sex, 2018-2019. Association of American Medical Colleges. https://www.aamc.org/download/321544/data/factstableb8.pdf Updated November 14, 2018. Accessed September 4, 2019.
- 15.Bowen CJ, Kersbergen CJ, Tang O, Cox A, Beach MC. Medical school research ranking is associated with gender inequality in MSTP application rates. BMC Med Educ. 2018;18(1):187. doi: 10.1186/s12909-018-1306-z. [DOI] [PMC free article] [PubMed] [Google Scholar]
- 16. Eliason JE, Gunter B, Roskovensky L. Diversity Resources and Data Snapshots May 2015 edition. American Association of Medical Colleges. https://www.aamc.org/download/431540/data/may2015pp.pdf Accessed September 4, 2019.
- 17. [No authors listed]. Table A-7.1. Applicants, first-time applicants, acceptees, and matriculants to U.S. medical schools by sex, 1999-2000 through 2008-2009. American Association of Medical Colleges. https://www.aamc.org/data/facts/applicantmatriculant/ Accessed September 4, 2019.
- 18. [No authors listed]. Table A-7.2. Applicants, first-time applicants, acceptees, and matriculants to U.S. medical schools by sex, 2009-2010 through 2018-2019. American Association of Medical Colleges. https://www.aamc.org/data/facts/applicantmatriculant/ Accessed September 4, 2019.
- 19. [No authors listed]. Table B-11.1. Total MD-PhD enrollment by U.S. Medical School and Sex, 2009-2010 through 2013-2014. American Association of Medical Colleges. https://www.aamc.org/data/facts/enrollmentgraduate/ Accessed September 4, 2019.
- 20. [No authors listed]. Table B-11.2. Total MD-PhD Enrollment by U.S. Medical School and Sex, 2014-2015 through 2018-2019. American Association of Medical Colleges. https://www.aamc.org/data/facts/enrollmentgraduate/ Accessed September 4, 2019.
- 21.Lett LA, Orji WU, Sebro R. Declining racial and ethnic representation in clinical academic medicine: A longitudinal study of 16 US medical specialties. PLoS One. 2018;13(11):e0207274. doi: 10.1371/journal.pone.0207274. [DOI] [PMC free article] [PubMed] [Google Scholar]
- 22.Jeffe DB, Andriole DA. A national cohort study of MD-PhD graduates of medical schools with and without funding from the National Institute of General Medical Sciences’ Medical Scientist Training Program. Acad Med. 2011;86(8):953–961. doi: 10.1097/ACM.0b013e31822225c5. [DOI] [PMC free article] [PubMed] [Google Scholar]
- 23.Andriole DA, Jeffe DB. The road to an academic medicine career: a national cohort study of male and female U.S. medical graduates. Acad Med. 2012;87(12):1722–1733. doi: 10.1097/ACM.0b013e318271e57b. [DOI] [PMC free article] [PubMed] [Google Scholar]
- 24.Jagsi R, et al. Similarities and differences in the career trajectories of male and female career development award recipients. Acad Med. 2011;86(11):1415–1421. doi: 10.1097/ACM.0b013e3182305aa6. [DOI] [PubMed] [Google Scholar]
- 25.Jagsi R, Motomura AR, Griffith KA, Rangarajan S, Ubel PA. Sex differences in attainment of independent funding by career development awardees. Ann Intern Med. 2009;151(11):804–811. doi: 10.7326/0003-4819-151-11-200912010-00009. [DOI] [PubMed] [Google Scholar]
- 26.Hechtman LA, et al. NIH funding longevity by gender. Proc Natl Acad Sci USA. 2018;115(31):7943–7948. doi: 10.1073/pnas.1800615115. [DOI] [PMC free article] [PubMed] [Google Scholar]
Associated Data
This section collects any data citations, data availability statements, or supplementary materials included in this article.


