

Mouse pluripotent tetraploid cells generate diploid cells during embryogenesis through nonrandom chromosome segregation.
Abstract
Cells with high ploidy content are common in mammalian extraembryonic and adult tissues. Cell-to-cell fusion generates polyploid cells during mammalian development and tissue regeneration. However, whether increased ploidy can be occasionally tolerated in embryonic lineages still remains largely unknown. Here, we show that pluripotent, fusion-derived tetraploid cells, when injected in a recipient mouse blastocyst, can generate diploid cells upon ploidy reduction. The generated diploid cells form part of the adult tissues in mouse chimeras. Parental chromosomes in pluripotent tetraploid cells are segregated through tripolar mitosis both randomly and nonrandomly and without aneuploidy. Tetraploid-derived diploid cells show a differentiated phenotype. Overall, we discovered an unexpected process of controlled genome reduction in pluripotent tetraploid cells. This mechanism can ultimately generate diploid cells during mouse embryo development and should also be considered for cell fusion–mediated tissue regeneration approaches.
INTRODUCTION
The cells of most eukaryotic organisms are diploid (2n). However, some mammalian tissues contain a high number of polyploid cells, which derive from endoreduplication or cell fusion (1–6). Polyploid formation is a well-known developmental process; for example, it occurs during syncytiotrophoblast (1) and myoblast formation (4) and during liver regeneration (3, 7, 8). In addition, after bone marrow (BM) transplantation, cell-cell fusion of mouse BM cells with skeletal muscle cells, cardiomyocytes, hepatocytes, and Purkinje cells has been observed (6, 9, 10). Hematopoietic cells regenerated liver function in Fah−/− mice (fumarylacetoacetate hydrolase knockout mice) after BM transplantation, upon fusion between BM-derived cells and hepatocytes (6). Likewise, after mouse liver hepatectomy, fusion of BM cells with hepatocytes formed proliferating hybrids that induced liver regeneration (7, 8). Notably, tetraploid (4n) hepatocytes can undergo multipolar mitosis and reverse their ploidy in a dynamic mechanism. This “reductive mitosis” capacity was proposed to be an adaptability feature to stress and injury (11). Reduction mitosis was hypothesized to also occur after homotypic cell fusion of BM cells (12). However, up to now, it was shown only in the liver and never in other cellular contexts, neither during development.
Cell fusion has been extensively used as an in vitro model to induce and study cell fate changes (2). Pluripotent 4n cell lines can be generated by heterotypic cell fusion between mouse embryonic stem cells (ESCs) and somatic cells in vitro (13, 14). This leads to epigenetic reprogramming of the somatic nucleus and proliferation of pluripotent cells with a single 4n nucleus. Previous reports showed that mouse pluripotent 4n cells and 2n ESCs have similar differentiation potential in vitro and in vivo (14–16), but studies on the ploidy stability of 4n pluripotent cells are lacking.
During early mammalian development, it is assumed that aneuploid and polyploid cells are excluded from the epiblast derivatives and that only diploid cells can ultimately contribute to embryonic lineages (16–20). Although a persistence of 4n cells in midgestation mouse embryos was observed in chimeras produced by aggregation of morula-stage 4n embryos with ESCs, 4n cells were largely excluded in later developmental stages (16, 20). Unexpectedly, chimeric mice were born after blastocyst injection with pluripotent 4n cells, which contributed to several tissues of these chimeric mice (14, 21). This contribution seems odd considering that high ploidy content has not been demonstrated in cells of these chimeras. Thus, we aimed to investigate the ploidy stability of the contributing 4n cells during mouse embryo development to assess whether ploidy reduction is a developmental process.
RESULTS
Fusion-derived 2n cells contribute to mouse midgestation development
Reprogramming of mouse somatic cells by induced cell fusion with ESCs has been extensively shown before (13, 21, 22). To generate 4n synkaryon hybrids (hybrids with one tetraploid nucleus), we fused mouse ESCs and neural progenitor cells (NPCs) harboring the Oct4-GFP-Puro transgene (green fluorescent protein and puromycin resistance gene driven by the Oct4 promoter) (Fig. 1A). As expected and previously reported (22), after puromycin selection, only reprogrammed (Oct4-GFP–positive) 4n cells survived because of the reprogramming of the NPC genome to pluripotency (fig. S1, A and B). The 4n hybrids were then transfected to constitutively express either tandem infrared fluorescent protein–tagged histone 2B (H2B-tdiRFP) or dsRED protein from a PiggyBac-based vector (PB-dsRED) (Fig. 1A and fig. S1C). These transgenes allow the tracking of the 4n cells after injection in embryos, both at embryonic stages and in adult mice (23). All the injected cells were tetraploid synkaryons as ensured by chromosome painting/fluorescence in situ hybridization (FISH) before injection (fig. S1D) and cell cycle analysis (fig. S1E). Single 4n cells were then injected into two-cell stage embryos 1.5 days post coitum (dpc) and tracked until 5.5 dpc in vitro (Fig. 1A and fig. S1F). These 4n cells could proliferate in preimplantation embryos and integrated in the inner cell mass of the blastocyst (Fig. 1B and movies S1 and S2). The dsRED-derived cells colocalized with the epiblast marker Nanog in 5.5 dpc embryos (Fig. 1C and fig. S1G). This observation prompted us to assess the developmental fate and ploidy stability of the injected 4n cells in later stages of development. For this, we injected 4n cells (fig. S1D) in 3.5 dpc blastocysts. Of a total of 67 injected and transferred embryos, 38 survived and were analyzed by flow cytometry at 12.5 dpc. We confirmed chimerism in 11 of 38 embryos based on the presence of tdiRFP-positive cells (Fig. 1D and fig. S1, H and I). tdiRFP-positive cells were also identified in the placenta and yolk sac of the embryos although in a very low amount, confirming that the injected cells integrated mainly in the epiblast (fig. S1J). tdiRFP-positive cells were fluorescence-activated cell sorting (FACS)–sorted from whole embryos and analyzed for ploidy content. Unexpectedly, we observed the presence of 2n tdiRFP-positive cells in all the embryos from which we succeeded to sort cells (Fig. 1D and fig. S1, H and I). This observation indicates the possibility of 4n-to-2n reduction in the embryos.
Fig. 1. Reprogrammed 4n cells contribute to chimeric mice and undergo ploidy reduction in vivo.
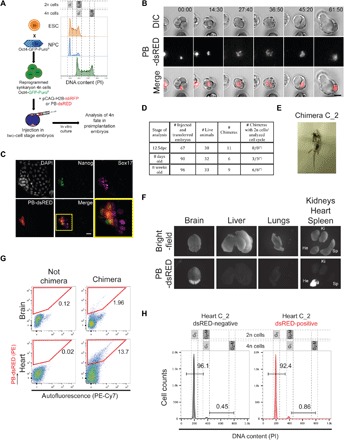
(A) Schematic representation of cell fusion between ESCs and NPCs and subsequent injection of 4n reprogrammed cells (black background) stably expressing pCAG-H2B-tdiRFP or PB-dsRED in 1.5 dpc, two-cell stage embryos (albino background). Representative cell cycle analysis is shown for ESCs, NPCs, and reprogrammed cells. PI, propidium iodide. (B) Representative time-lapse images of an embryo injected with one single PB-dsRED 4n cell. Time is shown in hours:minutes (hh:m). See also movies S1 and S2. Scale bar, 40 μm. DIC, differential interference contrast. (C) Representative immunofluorescence staining of a 5.5 dpc in vitro embryo where a single 4n PB-dsRED cells was injected at 1.5 dpc. Costaining with Nanog (epiblast) and Sox17 (primitive endoderm) markers is shown. Scale bar, 20 μm. DAPI, 4′,6-diamidino-2-phenylindole. (D) Summary table of chimeric animals obtained after 4n cell injection in 2n blastocysts. Chimerism was assessed on the basis of the presence of tdiRFP-expressing cells by FACS in 12.5 dpc and by coat color and PB-dsRED expression in live-born animals. The asterisks (*) indicate that not enough cells were obtained to perform cell cycle analysis in all chimeric animals. (E) Picture of a representative 8-week-old chimera generated by 4n cell injection in a 2n blastocyst. (F) Bright-field and dsRED fluorescence images of the organs analyzed from the chimeric mouse depicted in (E). (G) FACS profiles of PB-dsRED expression in representative nonchimeric (left) and chimeric (right) organs [chimeric organs are from the chimera depicted in (E)]. PE, phycoerythrin. (H) Cell cycle analysis of sorted PB-dsRED–negative and PB-dsRED–positive cells from the heart of a chimeric mouse FACS-sorted as in (G) (Photo credit: João Frade, Center for Genomic Regulation).
4n cells reduce ploidy during mouse development and contribute to adult tissues
We then analyzed live-born chimeras generated from injection of 4n cells. We obtained a total of 15 chimeras of 65 live mice (based on the coat color), of which we analyzed 6 at 8 days after birth and 9 at 8 weeks after birth (Fig. 1D). We first analyzed 8-day-old chimeras and identified 4n-derived cells in several tissues (fig. S1, K to M). In accordance with the analysis of 12.5 dpc midgestation embryos, the 4n-derived cells in 8-day-old mouse tissues resulted to be mostly 2n (fig. S1, M and N). Last, we examined nine chimeras that developed until maturity without signs of tumor formation (Fig. 1, D and E, fig. S1O, and movies S3 to S11). We observed contribution of 4n-derived cells to many organs (heart, brain, liver, lungs, and kidneys), confirming that the injected cells were pluripotent and contributed to different lineage development (Fig. 1, F and G, and fig. S1, P to R). Similar to the previous developmental stages, most of the 4n-derived cells were 2n in these chimeric organs (Fig. 1H and fig. S1, R and S). These data suggest that the injected 4n cells can undergo ploidy reduction and form 2n cells during embryogenesis and, moreover, that they can contribute to organ development.
Pluripotent 4n cells reduce ploidy under self-renewal culturing conditions
We wondered whether pluripotent 4n cells could also reduce ploidy under self-renewal conditions in vitro. When 4n cells used for injection were left for one passage in pluripotent culturing conditions, we observed the presence of few 2n cells (fig. S2A). Thus, to test the ploidy reduction hypothesis in more detail, we set up a simple in vitro system. After fusing ESCs with NPCs, we isolated single cells from puromycin-selected, reprogrammed (Oct4-GFP–positive) cell population (fig. S2B). At the day of single-cell sorting (15 days after puromycin selection), as expected, the cells expressed the Oct4-GFP transgene and were 4n, while nonfused cells did not resist the selection (fig. S2C). Then, we expanded 76 GFP-positive, single-cell–derived clones in the absence of drug selection to allow survival of possible 2n cells with an ESC-like phenotype generated after ploidy reduction. Ploidy analysis after single-cell expansion showed the presence of clones containing a mixed karyotype with 2n and 4n cells (from now on referred as “mixed clones”) and of 2n clones, as well as the expected 4n clones (from now on referred as “stable 4n clones”) (Fig. 2, A and B, and fig. S2D). A similar result was obtained after fusion of mouse embryonic fibroblasts (MEFs) with ESCs in vitro, where we could also observe the presence of mixed clones (fig. S2E). These results show that mixed (2n + 4n) and 2n populations can be generated from fusion-derived 4n cells. The presence of 2n cells derived from single 4n synkaryons strongly indicates the possibility of ploidy reduction after fusion.
Fig. 2. In vitro fusion–derived clones contain 4n and 2n cells and are not aneuploid.
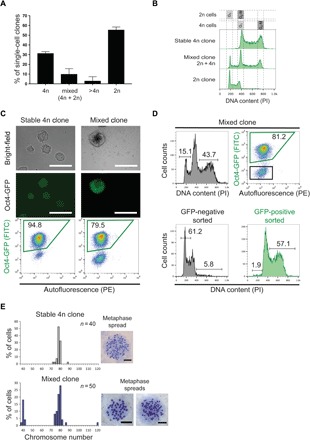
(A) Quantification of single-cell–derived clones with 4n, mixed (4n + 2n), higher than 4n (>4n), and 2n ploidies (N = 76 clones, two independent fusion experiments; mean ± SD). (B) Representative cell cycle profiles of single-cell–derived clones. (C) Bright-field (top) and Oct4-GFP (middle) images of stable 4n and mixed clones; representative FACS analysis of Oct4-GFP expression is shown on the bottom. FITC, fluorescein isothiocyanate. (D) Top: Cell cycle profile (left) and Oct4-GFP FACS plot (right) of a representative mixed clone (sorting gates are shown in black and green for negative and positive cells, respectively). Bottom: Cell cycle profiles of sorted GFP-negative and GFP-positive cells from a mixed clone. (E) Quantification of karyotypes from cells of stable 4n and mixed clones. Graphs are representative of two stable 4n and four mixed clones (n = number of counted metaphase spreads per clone). Representative metaphase spreads are shown on the right. Scale bars, 20 μm.
Since we found 4n-derived 2n cells in adult tissues of the chimeric mice, we analyzed whether a correlation between mixed/stable 4n clones and their pluripotent or differentiated morphology could be derived. We fused NPCs harboring the Oct4-GFP-Puro transgene and constitutively expressing neomycin resistance allele (pCALNL-dsRED transgene) with either wild-type or T-cell factor 3 deleted (Tcf3−/−) ESCs (see Materials and Methods for details) (fig. S2F). Tcf3−/− ESCs can reprogram the somatic genome more efficiently than wild-type ESCs after fusion (24). After 15 days of selection, we observed distinct colony morphologies. We isolated single ESC-like, dome-shaped, Oct4-GFP–positive colonies and also dome-shaped colonies surrounded by alkaline phosphatase–negative and Oct4-GFP–negative morphologically differentiated cells (fig. S2, G to I). We assessed the ploidy of nearly 300 independently expanded clones. Most of the resistant clones (78.8 ± 14.0% for NPCs × ESCs fusion and 82.9 ± 2.9% for NPCs × ESCs Tcf3−/− fusion) expressed Oct4-GFP, suggesting their reprogrammed phenotype (Fig. 2C), and were stable 4n clones in both pluripotent and differentiation culturing conditions (fig. S2J). However, about 15% of the selected clones included 2n and 4n cells (mixed clones), both in fusions with wild-type (14.5 ± 8.9%) and with Tcf3−/− ESCs (14.5 ± 1.0%). The mixed clones included differentiated Oct4-GFP–negative cells as shown by microscopy and FACS analysis (Fig. 2C). These Oct4-GFP–negative cells were mainly 2n, while Oct4-GFP–positive cells were mainly 4n (Fig. 2D and fig. S2K). As expected, both 4n and 2n cells in mixed clones carried the neomycin resistance allele, confirming the efficiency of the selection (fig. S2L). As a further control, we excluded the 2n population in mixed clones to be a result of ESC or NPC drug-resistant cells, as neither cell line survived when cultured under the same drug selection conditions (fig. S2G). Overall, these in vitro results showing that differentiated Oct4-GFP–negative cells were diploid support our in vivo observations where we found 4n-derived 2n cells in adult tissues.
A single 4n-to-2n reduction step leads to viable proliferating 2n cells
We then aimed to investigate the number of chromosomes in cells of stable 4n and mixed clones. Karyotype analysis revealed cells with tetraploid or near-tetraploid chromosomal sets in both clone types (chromosome number between 76 and 80 per cell). In addition, in mixed clones, we found 2n cells with a comparable chromosome number than that of the fusion partners, ESCs, and NPCs (Fig. 2E and fig. S2M). This shows that 4n-derived 2n cells did not undergo major chromosome loss. We did not observe cells with intermediate chromosome number between 4n and 2n cells in mixed clones (that is, between 80 and 40 chromosomes). Thus, we hypothesized that 4n hybrids could undergo 4n-to-2n ploidy reduction by a single-step mechanism and not by progressive chromosome loss.
To address this hypothesis, we analyzed the mitotic features of single-nucleus (synkaryon) 4n cells in stable 4n and mixed clones. While 4n cells in stable 4n clones formed bipolar spindles with a similar frequency as control ESCs, 4n cells in mixed clones formed not only bipolar but also tripolar metaphase spindles (Fig. 3, A and B). The latter were 23% of the total metaphases analyzed in mixed clones (Fig. 3B). A similar percentage of tripolar mitosis was observed in cell pools soon after fusion (fig. S3A). Multipolar spindles have been associated with aberrant mitosis, aneuploidy generation, or cell death in 4n cancer cells (25, 26). Time-lapse videos showed synkaryon hybrid 4n cells progressing through bipolar and tripolar mitosis (Fig. 3C and movies S12 and S13). Tripolar mitosis was also observed in 4.5 dpc tetraploid embryos that were not injected with cells, suggesting that multipolar spindle formation can occur during preimplantation mouse development (fig. S3B). Quantification of the histone H2B content in the three daughter cells suggests that tripolar mitosis can generate one 4n and two reduced-ploidy 2n cells, in accordance with a one-step ploidy reduction mechanism (fig. S3C). Notably, the daughter cells of a tripolar mitosis could undergo subsequent cell divisions, suggesting that the generated 2n cells can correctly proliferate and do not undergo mitotic catastrophe (fig. S3D and movie S14) (27). Furthermore, the number of lagging chromosomes in bipolar and tripolar anaphases observed in culture was comparable (fig. S3E), further suggesting that tripolar mitosis does not induce aneuploidy in this cellular context.
Fig. 3. 4n hybrids undergo bipolar and tripolar mitosis.
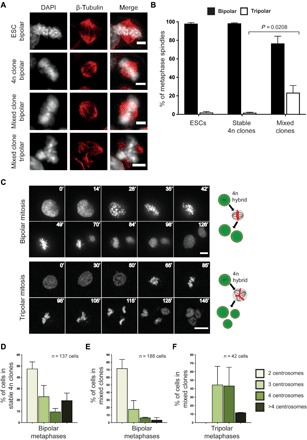
(A) Immunofluorescence images of control ESCs and 4n hybrids in metaphase (DNA, white; β-tubulin, red). Scale bars, 5 μm. (B) Quantification of bipolar and tripolar metaphase spindles in control ESCs, stable 4n, and mixed clones. (ESC: N = 121 cells, two replicates; stable 4n clones: N = 358 cells, two different clones; mixed clones: N = 377 cells, four different clones; mean ± SD). Exact P value is also indicated. (C) Representative time-lapse images of tetraploid cells from mixed clones undergoing bipolar (top) and tripolar (bottom) mitosis (time progression in minutes is shown on each frame). Scale bars, 10 μm. See also movies S12 and S13 (including bright-field images). Schematic representations of the mitotic outcomes are shown on the right side of each panel. (D to F) Quantification of the centrosome number in bipolar metaphases of stable (D) and mixed clones (E) and of tripolar metaphases in mixed clones (F) (mean ± SD). The number of quantified metaphases (n) is indicated in each graph.
We did not identify acentrosomal spindle formation in any case, contrary to what was reported in other 4n cells undergoing division (28). Moreover, all centrosomes contained two centrioles, as seen by staining of centrin, a core centriole protein (fig. S3, F to H). Most bipolar spindle poles contained two centrosomes, both in stable 4n (Fig. 3D and fig. S3F) and in mixed clones (Fig. 3E and fig. S3G), while tripolar spindle poles mostly contained three or four centrosomes (Fig. 3F and fig. S3H). This indicates not only that centrosome loss and/or centrosome clustering can account for bipolar mitosis (11) but also that 4n cells with high centrosome number tend to undergo tripolar mitosis. Overall, we can conclude that ploidy reduction results in the generation of 2n cells with proliferation capacity.
Parental chromosomes can segregate nonrandomly in heterokaryon 4n cells
During tripolar mitosis, multiple combinations of parental chromosome segregation are possible and there is a high probability that parental subsets of chromosomes are randomly distributed to the three daughter cells. Since we observed that the daughter cells generated after tripolar mitosis can proliferate without major mitotic defects (fig. S3D and movie S14) and can generate 2n clonal lines (Fig. 2A), we hypothesized that parental chromosome segregation is tightly controlled during tripolar mitosis. We thus addressed the question of how the two parental chromosome subsets are inherited by the daughter cells during tripolar mitosis. For this, we used H2B-labeled cell fusion partners and imaged the hybrids during their first cell division in heterokaryons, which are hybrids with two separated nuclei in one cytoplasm. This strategy allowed us to follow the parental chromosome segregation. To differentially tag one of the genomes after division, we pulsed ESCs with 5-ethynyl-2′-deoxyuridine (EdU) before fusion (fig. S4A). The EdU-marked ESC chromosomes were revealed after the hybrids’ first division by click chemistry (29). ESC and NPC lines, expressing H2B-eGFP (enhanced GFP) and H2B-mRFP (monomeric red fluorescent protein), respectively, were fused, and hybrids were FACS-sorted on the basis of the eGFP/mRFP expression (fig. S4, B and C). Only hybrids resulting from a 1:1 fusion ratio were further analyzed by time-lapse microscopy. Of these, 40% went through apoptosis before cell division. The remaining hybrids divided in a bipolar (40%) or tripolar (5%) manner [which is comparable with what was observed before (Fig. 3B) since only about half of the hybrids progressed through mitosis] or did not divide (10%) (Fig. 4A). The cells were fixed after cell division, and EdU-labeled ESC chromosomes were visualized after click chemistry.
Fig. 4. Parental chromosome segregation can be nonrandom during tripolar mitosis and generates 2n cells with only one parental genome.
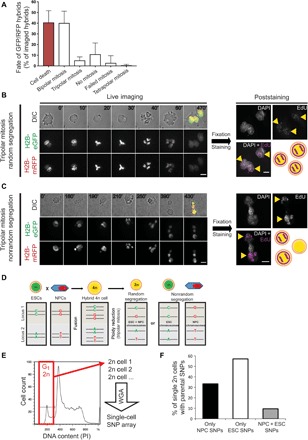
(A) Quantification of the hybrids’ fate after cell fusion (N = 201 cells, six independent fusion experiments; mean ± SD). (B and C) Representative time-lapse (left) and poststaining images (right) of tripolar mitosis with random (B) or nonrandom (C) chromosome segregation. Merged images correspond to the last frame of the respective time-lapse (time progression in minutes is shown on each frame). Yellow arrowheads indicate EdU-positive cells (pseudocolored magenta) after staining. Scale bars, 10 μm. (D) Schematic representation of two genomic loci carrying different single-nucleotide polymorphisms (SNPs) in ESC (green) and NPC (red). After ploidy reduction, 2n cells can carry one allele from each parental cell or both alleles from only one parental cell. 2n cells derived from nonrandom chromosome segregation during tripolar mitosis include informative SNPs identical to the ones carried by the parental cells. (E) Cell cycle profile of a representative mixed clone from which G1-2n cells (red box) were individually sorted for single-cell SNP genotyping. WGA, whole genome amplification. (F) Percentage of single G1-2n cells that exclusively contain NPC SNPs, ESC SNPs, or mixed SNPs (black, white, and gray bars, respectively) (N = 21 single cells sorted from four different mixed clones; see fig. S4K for SNP percentages of individual cells).
The hybrids that did not undergo mitosis maintained the two nuclei separated (heterokaryon hybrids), with the ESC nucleus containing EdU-positive chromosomes, as expected (fig. S4D and movie S15). All the hybrids that went through bipolar mitosis generated two synkaryon daughter cells containing EdU-positive chromosomes (fig. S4E and movie S16). Tripolar mitosis led to two different outcomes. On one hand, in 10 of 16 events analyzed, all three daughter cells were positive for EdU. This indicates a random segregation of the parental chromatids to all daughter cells during mitosis (Fig. 4B and movie S17). On the other hand, in the remaining six events, only two of the three daughter cells were positive for EdU (Fig. 4C and movie S18). That is, ESC chromosomes segregated nonrandomly to only two of the daughter cells during tripolar mitosis. The latter observation suggests that parental chromatids can segregate in a biased manner during tripolar mitosis. The observed frequency of nonrandom segregation is higher than what would be expected by chance (fig. S4F) (P < 1 × 10⁻¹⁶; see Materials and Methods for details). We also observed that eGFP- and mRFP-tagged parental chromosomes often show different spatial occupancy during and after bipolar (fig. S4G and movie S19) and tripolar (fig. S4H and movie S20) mitosis of the hybrid cells, which might explain nonrandom segregation of chromosomes. In addition, in this case, the daughter cells formed after a tripolar mitosis could undergo a subsequent cell division, again excluding mitotic catastrophe (fig. S4I and movie S21) (27).
Parental chromosomes can segregate nonrandomly in synkaryon 4n cells
To further investigate whether 4n synkaryons can also undergo nonrandom parental chromosome segregation after undergoing multiple bipolar cell divisions, we genotyped 2n cells isolated from mixed clones, which contain 4n cells undergoing tripolar mitosis (Fig. 3, A to C). We identified 59 single-nucleotide polymorphisms (SNPs) that were used to distinguish 16 of 20 chromosome pairs between mouse ESCs and NPCs (table S1). We only relied on homozygous SNPs for which there were differences between ESCs and NPCs (hereafter referred to as “informative SNPs”) (Fig. 4D). As expected, 4n cells from stable 4n clones contained nearly all the informative SNPs from both fusion partners (%heterozygous markers, 96%). In the case of 2n cells from mixed clones, most SNPs were heterozygous in all of the three diploid cell pools analyzed (fig. S4J and table S1). However, analysis of pool populations does not assess which chromosomes are present in individual 2n cells after ploidy reduction. Thus, we FACS-sorted single 2n cells from mixed clones and analyzed the presence of informative SNPs (Fig. 4E). Most of the single 2n cells contained homozygous SNPs from only one of the fusion partners. Specifically, 57% of the genotyped 2n cells only contained ESC SNPs, while 33% only contained NPC SNPs. The remaining 10% had ESC and NPC SNP markers (Fig. 4F, fig. S4K, and table S1). In addition, to reveal whether parental SNP markers were maintained after proliferation, we genotyped pure 2n cell lines derived from single-sorted 4n cells that can proliferate in ESC medium (shown in Fig. 2A). This analysis showed that most cells in these clones contain only ESC chromosomes, although one of these lines (2n line B) contained more than 10% of NPC SNPs even after several rounds of cell division, which confirms its fusion origin (fig. S4L). Notably, FACS-sorted 2n cells could proliferate under ESC and NPC culture conditions and showed ESC and NPC phenotype, respectively (fig. S5), confirming their parental origin. These results indicate that nonrandom chromosome segregation is possible during ploidy reduction by tripolar mitosis of 4n cells, even after the 4n synkaryon cells have passed through several rounds of cell division.
DISCUSSION
Polyploidy is very common in plants and fungi. In mammals, polyploidy is a feature of extraembryonic tissue formation during early development, and it also occurs in terminal differentiated cells (30). Although polyploidy can influence a number of fitness-related traits in a variety of cell types, it is still a poorly studied phenomenon. Here, we showed that during early mouse embryo development, some 4n cells can contribute to the developing embryo after ploidy reduction.
The incidence of blastomere fusion in human embryos ranges from 1.5 to 4.6% during cryopreservation procedures of 2- to 10-cell embryos. In a few cases, the human embryos containing fused blastomeres were transferred and resulted in early spontaneous abortions; however, one pregnancy resulted in the birth of a healthy baby (31). Thus, correction of ploidy abnormalities during embryo development might be a possible event, and it has recently been the subject of intense investigation. It was shown that healthy babies were also born from implanted mosaic (euploid + aneuploid) human embryos after in vitro fertilization (19). Similarly, it was shown that, up to a threshold number, aneuploid cells can be depleted in early mouse embryonic stages (18). This leads to hypothesize that aneuploid or tetraploid cells need to be eliminated or genetically corrected for normal embryo development to occur. Our data here suggest that polyploid cells can be corrected in the early embryo by a controlled chromosome reduction mechanism. We observed the presence of 4n-derived 2n cells at 12.5 dpc. However, the earliest developmental time when ploidy reduction can occur needs further investigation. Moreover, since we did not find the presence of tumors in adult chimeras, possible aneuploid cells generated from the process of reduction mitosis are likely eliminated during embryogenesis.
The generation of 2n cells from 4n hybrids can also be a mechanism of regeneration after cell fusion–mediated reprogramming in vivo. We previously demonstrated that cell fusion–derived hybrids can regenerate retinal neurons and hepatocytes and protect dopaminergic neurons from degeneration in mice (8, 32, 33). The in vivo–formed hybrids can act as a reservoir of differentiated cells and potentially undergo reduction mitosis. Moreover, we reason that previous studies carried out on pluripotent fusion-derived 4n cells in cell culture may have neglected ploidy reduction events due to the following reasons: low number of fusion-derived pluripotent clones analyzed; maintenance of a strong selective pressure toward pluripotent gene expression, resulting into selection against ploidy-reduced cells; and lack of thoughtful analysis of multiple chimeric mice obtained after 4n cell injection in preimplantation embryos.
Our results also suggest that, after fusion, if centrosomes cluster in two poles, then bipolar mitosis progresses and synkaryon 4n cells are then formed. After a number of bipolar divisions, 4n cells can undergo tripolar mitosis with loss of centrosome clustering, resulting in nonrandom or random segregation during ploidy reduction (Fig. 5, A and B). In the case of nonrandom segregation, the two parental chromosomal sets are differentially recognized by the mitotic machinery in synkaryon 4n cells and are then segregated in a cell-of-origin–dependent manner during tripolar mitosis. This results in 2n cells that are genotypically equal to the original fusion partners.
Fig. 5. Model of random and nonrandom chromosome segregation during tripolar mitosis of the hybrid cells.
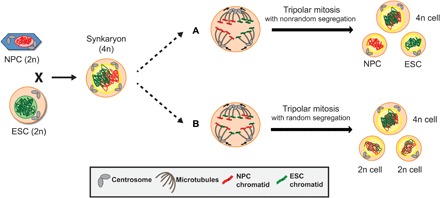
NPC (red nucleus) and ESC (green nucleus), each carrying a diploid (2n) DNA content, fuse and, after bipolar divisions with centrosome clustering, form tetraploid (4n) synkaryon cells. The generated 4n cells contain four centrosomes and two chromosome sets before mitosis. In the case of tripolar spindle formation, centrosomes do not cluster. If the two parental chromosome sets are spatially separated after nuclear envelope breakdown and are differentially connected to the poles during mitosis, then the parental chromosome segregation will be nonrandom. This results in one 4n cell and two 2n cells that have the same genome as the parental NPC and ESC. Both 2n cells are not aneuploid (a). Alternatively, if parental chromosomes connect randomly to the poles, then the segregation to the three daughter cells is random, resulting in daughter cells with chromosomes from both fusion partners (b).
The mechanism fully explaining tripolar mitosis needs to be further investigated. However, our data show that loss of centrosome clustering and spatial segregation of parental chromosome sets might be key steps in this process. H2B-eGFP– and H2B-mRFP–labeled parental chromosomes appear spatially separated during and after mitosis according to their respective nuclear origin (fig. S4, G and H) (34). Spatial separation of paternal/maternal chromosomes has been reported in mouse zygotes, and dual-spindle assembly around the two pronuclei was postulated to be a possible mechanism (35). The parental asymmetry of epigenetic markers such as H3K9me3 might account for this separation (36). Furthermore, mouse embryos showed parental genome spatial segregation from the zygote to the eight-cell stage (35). Another hypothesis is that centromeres preferentially connect to centrosomes of their respective parental origin (37–39).
Overall, we identified controlled ploidy reduction in the mouse embryo that can generate diploid cells capable of contributing to adult tissues. This mechanism might lead to the identification of novel developmental processes. In contrast to what was observed in cancerous context (26), the ploidy reduction is tightly regulated since the diploid cells maintain the correct number of chromosomes. Diploidization and tight control of chromosome number seem to result in higher fitness for the cells since it has also been described in cultured haploid mouse ESCs (40). In conclusion, ploidy reduction should be taken into account as a possible event during embryo development and after BM cell fusion–mediated regeneration of somatic tissues (2, 6).
MATERIALS AND METHODS
Cell culture
Mouse NPC-Oct4-GFP-PuroR (isolated from HP165 mice) containing a puromycin resistance cassette (PuroR) and GFP tag driven by the Oct4 promoter were a gift from A. Smith and were cultured as previously described (13) in RHB-A medium (Stem Cell Sciences) supplemented with recombinant human basic fibroblast growth factor and epidermal growth factor (10 ng/ml). Accutase (Sigma) was regularly used for cell detachment when passaging cells. Wild-type and Tcf3−/− ESCs (a gift from B. Merrill) were cultured on 0.1% gelatin-coated dishes (Millipore) and W4 ESCs (a gift from S. Forrow) on inactivated MEF feeders in the presence of Dulbecco’s modified Eagle medium (DMEM) supplemented with 15% fetal bovine serum (FBS) (Sigma), 1× nonessential amino acid, 1× penicillin-streptomycin, 1× l-glutamine, 1× sodium pyruvate, 1× β-mercaptoethanol, and mouse leukemia inhibitory factor (mLIF) (1000 U/ml) (Millipore). W4 ESCs were used to generate fusion hybrids for in vivo experiments (explained later). Cells were replated every other day following dissociation with trypsin (Sigma). MEFs were prepared and cultured as previously described; inactivation was performed either with mitomycin C (10 μg/ml) (Sigma) for 3 to 4 hours or by gamma irradiation (45-Gγ dose). Multiple-Drug resistant MEFs (DR4 i MEF) feeders with resistance to four antibiotics—including puromycin, neomycin, and hygromycin—were used for clone selection and expansion before blastocyst injection.
Embryoid body assay
To induce embryoid body (EB) formation, cells were harvested by trypsinization and were resuspended in ESC media without mLIF to allow differentiation to occur. Single 30-μl drops were plated on a lid of a 150-mm culture dish (~400 single ESCs per drop) to hang at 37°C and 5% CO2 for 2 days. Drops were then collected and transferred to 100-mm bacterial-grade dishes (Thermo Fisher Scientific) in 10 ml of ESC media without mLIF for three more days. EBs were transferred to 100-mm pregelatinized tissue culture plates and were kept for 4 days more for further differentiation. Dishes were replenished with fresh media every other day. Cells were collected for cell cycle analysis at day 9 and processed as described below.
Virus generation
To generate pHIV-H2B-eGFP, the eGFP coding region of the H2B-eGFP plasmid (Addgene plasmid no. 11680) was cloned in place of the H2B-mRFP region of the pHIV-H2B-mRFP plasmid (Addgene plasmid no. 18982). Virus particles were produced using human embryonic kidney 293T cells as a packing cell line. pHIV-H2B-mRFP and pHIV-H2B-eGFP were mixed with viral packing vectors (pCMV-ΔR8.9 dvpr and pCMV-VSV-G) before transfection following the CalPhos mammalian transfection kit protocol (Clontech). At 24 hours after transfection, cells were replenished with fresh media, and the supernatant was collected 24 and 48 hours after; the viral particles were then concentrated by centrifugation. For the generation of the pHIV-H2B-eGFP and pHIV-H2B-mRFP stable cell lines, 3 × 10⁵ cells (ESCs or NPCs) were infected with the produced virus. Cells were replenished with fresh media before three rounds of FACS.
Plasmid nucleofection
NPCs were nucleofected with the pCALNL-dsRED plasmid (Addgene plasmid no. 13769) following the Amaxa mouse nucleofector kit recommendations (Lonza). Neomycin was added to select the nucleofected cells 48 hours after and was constantly kept in the NPC media. Transfection efficiency in these NPCs was checked by dsRED expression upon pCAG-CRE plasmid (Addgene plasmid no. 13775) nucleofection.
To tag cells with a constitutively expressed fluorescent protein before embryo injection, cells were either transfected with pCAG-H2B-tdiRFP-IP (Addgene plasmid no. 47884), containing puromycin resistance), or with PiggyBac vectors to express dsRED. A PiggyBac transposase-encoding plasmid and pCAG-dsRED-hygroR (PB-dsRED, hygromycin resistance) were cotransfected to randomly insert dsRED-hygroR in the genome. All transfections were performed using a Lipofectamine 3000 kit (Invitrogen). Cells were FACS-sorted to generate stable lines and kept under the respective drug selection.
Cell fusion
For monolayer cell fusion experiments, 1 × 10⁶ NPCs were seeded into T25 flasks (BD Biosciences). After 24 hours, 1 × 10⁶ ESCs were plated onto the seeded NPCs and were allowed to attach. After 2 to 3 hours, 1 ml of prewarmed 50% (w/v) polyethylene glycol (PEG) 1500 (Roche) was added, and cells were incubated for 2 min at room temperature. Cells were washed three times with serum-free DMEM; then, they were cultured in ESC complete media for further 2 to 3 hours. Last, cells were seeded in a 1:5 ratio into pregelatinized 100-mm dishes (Corning). To select cell fusion reprogrammed clones, puromycin (10 mg/ml) was added 3 days after fusion. When NPC-LNL-dsRED cells were used for fusion, puromycin and neomycin (50 mg/ml) were added 3 and 5 days after fusion, respectively. At day 5, the removal of puromycin allowed the growth of all hybrid-derived cells. This selection strategy was used to create an additional selective pressure toward the NPC genome, which contains the NEOR cassette. To increase reprogramming efficiency, wild-type ESCs were pretreated with 1 μM 6-bromoindirubin-3′-oxime (a GSK3β inhibitor) for 24 hours before fusion, as previously described (13). At day 15 after fusion, individual ESC clones were picked and expanded under selective conditions.
For single-cell sorting of resistant cells, cells were selected with puromycin until day 15 after fusion, and GFP-positive single cells were independently sorted in 96-well plates (Corning). Cells were further expanded without selection for further five passages, and their ploidy was assessed by flow cytometry (described below).
To sort initial fusion-derived hybrid cells, a modified version of a previously described fusion protocol was followed (41). H2B-eGFP Tcf3−/− ESCs and H2B-mRFP NPCs were collected and counted; a total of ~15 × 106 cells of each cell line were washed in phosphate-buffered saline (PBS) and mixed together in 10 ml of PBS. Samples were centrifuged for 5 min at 1200 rpm and then incubated at 37°C for 2 min. Then, 1 ml of prewarmed 50% (w/v) PEG 1500 (Sigma) was added dropwise, and cells were incubated at 37°C for 90 s. After, 10 ml of serum-free DMEM was added slowly for 5 min, and the sample was slowly mixed four to six times. Cells were centrifuged for 5 min at 1300 rpm and then resuspended in ESC complete media before sorting. Hybrid cells (expressing both eGFP and mRFP) were sorted on a BD Influx cell sorter. Only heterokaryon hybrids containing one eGFP and one mRFP nuclei (1:1 fusion ratio) were analyzed.
Alkaline phosphatase and crystal violet staining
Colonies were stained for alkaline phosphatase activity ~15 days after fusion. Cells were washed once with PBS and fixed with 10% neutral formalin buffer (37% formaldehyde, 46 mM Na2HPO4, and 29 mM Na2HPO4.H2O, in H2O) for 15 min at 4°C. Then, cells were washed with water followed by 15-min incubation with freshly prepared substrate: 0.005 g of naphthol AS MX-PO4 (Sigma), 0.03 g of Red Violet LB Salt (Sigma), 200 μl of N,N-dimethylformamide (Thermo Fisher Scientific), 25 ml of 0.2 M tris-HCL (pH 8.3), and 25 ml of distilled water. For crystal violet staining, samples were washed with PBS and fixed with 4% paraformaldehyde (PFA) for 20 min before incubation with a 0.5% crystal violet solution (Sigma) for 15 min.
Cell cycle analysis by flow cytometry
Propidium iodide (PI) staining was used for cell cycle analysis in fixed cells. Cells were trypsinized and washed twice with PBS before fixation with 70% ice-cold ethanol. After 24 hours, samples were washed with PBS and incubated overnight with ribonuclease (0.3 mg/ml) (Sigma) and PI (15 μg/ml) (Sigma). Samples were analyzed using a BD FACSCalibur with a 488-nm laser and an FL2 detector. For cell cycle analysis of live cells, Hoechst 33342 (Thermo Fisher Scientific) staining was used. A total of 1 × 10⁶ cells were incubated in 1 ml of complete ESC media with Hoechst 33342 (10 μg/ml) at 37°C for 15 min. PI (1 μg/ml) was added to stain dead cells. Cell cycle analysis and sorting were performed with a BD Influx cytometer using an ultraviolet 350-nm laser for the Hoechst staining. All flow cytometry data were analyzed using FlowJo.
Karyotyping
Colcemid (0.15 μg/ml) was added to seeded cells for 3 to 4 hours at 37°C. Cells were collected and washed with media. Cells were then incubated at 37°C for 1 to 2 min in prewarmed hypotonic lysis solution [0.56% (w/v) potassium chloride (KCl) in water]. After centrifugation, cells were resuspended and washed in 3:1 (v/v) methanol:acetic acid solution. Chromosomal spreads were prepared and were incubated for 10 min in 4% Giemsa KH2PO4 solution (3.4 g of KH2PO4 in 1000 ml of water) for chromosome staining.
Immunofluorescence staining
For tubulin and centrin staining, cells were plated on sterile Nunc Lab-Tek eight-well slides (Thermo Fisher Scientific). Cells were treated with 10 μM cyclin-dependent kinase 1 inhibitor IV (RO-3306; Millipore no. 217699) for 6 hours to arrest cell cycle at the G2-M transition. After, cells were replenished with fresh media and were incubated for 40 min to allow entry into mitosis. For fixation and permeabilization, cells were left with 100% methanol for 1 min at −20°C and 0.2% Triton X-100 for 15 min, respectively. Blocking was performed for 1 hour in 0.1% Triton X-100 + 5% bovine serum albumin (BSA). Then, cells were incubated for 2 hours at room temperature with the primary antibodies against β-tubulin (1:1000; Millipore, clone YL1/2 MAB1864) and centrin (1:2000; Millipore, clone 20H5 MAB04-1624). The slides were subsequently washed three times in PBS + 0.1% Triton X-100 and were incubated for 1 hour at room temperature with Alexa fluorophore–conjugated secondary antibodies (1:1000 dilution). After, cells were washed three times with PBS and incubated for 10 min with 4′,6-diamidino-2-phenylindole before mounting in Vectashield solution (Vector Labs).
For preimplantation embryo staining, 4.5 or 5.5 dpc embryos were fixed in 2% PFA for 10 min at room temperature, permeabilized in 0.2% Triton X-100 for 10 min, and blocked in 3% BSA for at least 1 hour. For Nanog and Sox17 staining, embryos were kept overnight at 4°C in 1:50 rabbit Nanog antibody (Cosmo Bio, RCAB002P), incubated with 1:500 anti-rabbit Alexa Fluor 488 antibody for 1 hour at 37°C, and subsequently incubated with 1:50 goat Sox17 antibody (R&D Systems, AF1924) for 1 hour at 37°C and lastly with 1:500 anti-goat Alexa Fluor 647 antibody for 1 hour at 37°C. For actin staining, embryos were incubated with Alexa Fluor 568 phalloidin (Invitrogen, A12380). All antibodies were diluted in 1% BSA in PBS, and embryos were washed in 1% BSA in PBS between incubations. Embryos were incubated for 10 min with Hoechst 33342 (1 μg/ml) right before imaging. Images were taken with a Leica TCS SP5 AOBS, SPE, or SP8 (inverted microscopes) and were analyzed with Fiji (ImageJ).
Chromosome painting/FISH
Cells were cytospinned at 1000 rpm for 10 min in glass slides (about 50,000 cells for each reaction) and let dry. Slides were kept in ice-cold PBS for 10 min and then passed in ice-cold cytoskeletal (CSK) buffer (30 s), CSK + 0.5% Triton X-100 (1 min), and again in CSK buffer (1 min) before fixing in 4% PFA for 10 min at room temperature. Samples were washed and stored in 70% ethanol. For Y chromosome painting and DNA FISH of Sx9 region of chromosome X, samples were dehydrated in sequential 80%-90%-100% ethanol solutions, and the DNA was denatured in 50% formamide/2× SSC buffer for 38 min at 80°C. Incubation with labeled probes was performed at 42°C overnight in the presence of Cot-1 (0.2 mg/ml). A Sx9 Cy3-labeled probe was generated as previously described (42) from a Sx9-3 plasmid (gift from Bernhard Payer lab). Y painting was performed using a XMP Y green probe (MetaSystems Probes, D-1421-050-FI).
Time-lapse microscopy
For time-lapse live imaging, 30,000 cells were plated on a pregelatinized 35-mm glass-bottom dish (MatTek Corporation) and were left to attach for at least 4 hours before imaging. Cells were imaged on an Andor Revolution XD confocal microscope featuring a spinning disk unit (CSU-X1 Yokogawa) and an Andor iXon 897E Dual-Mode electron multiplying charge-coupled device camera with a 40× or 60× oil-immersed objective. Imaging was performed at 37°C and 5% CO2. Differential interference contrast (DIC) images were taken with an exposure time of 80 ms. Cells were excited with 488-nm and 561-nm lasers with the acousto-optical tunable filter (AOTF) set at 15% and with a maximum exposure time of 120 ms. Nine to 15 z-stacks were obtained for each cell, except for cells used for H2B-mRFP quantification. All time-lapse images were analyzed using Fiji (ImageJ). Z-stacks were merged using the “Z project SUM” function; the background of fluorescence images was subtracted (taking into consideration the mean background intensity), and a Gaussian blur filtering (σ = 0.5) was applied. Cell tracking in movies S14 and S21 was done using the TrackMate plugin (ImageJ).
EdU labeling and chromosome targeting
For labeling with EdU, H2B-eGFP Tcf3−/− ESCs were pulsed with EdU (0.5 μM; Invitrogen) for two consecutive periods of 12 hours [according to Elabd et al. (43)] before cell fusion with H2B-mRFP NPCs. Cell hybrids were sorted immediately after fusion and were directly plated into an uncoated μ-slide eight-well grid-500 coverslip (Ibidi). After attachment, cells were imaged for 15 to 16 hours using the Andor Revolution XD confocal microscope. After the time-lapse, cells were washed with PBS and were fixed and permeabilized at room temperature with 4% PFA for 10 min and 0.3% Triton X-100 for 15 min. Cu(I)-catalyzed [3 + 2] cycloaddition reaction (“click chemistry”) for EdU labeling was performed using Alexa Fluor 647 Azide, Triethylammonium Salt (Thermo Fisher Scientific, A10277). The grid on the wells was used to localize the imaged cells after fixation. Images were taken with a Leica TCS SP5 AOBS (inverted microscope) and were analyzed and processed using Fiji (ImageJ).
To calculate the probability that a 4n cell (containing 40 ESC and 40 NPC chromosomes) segregates the parental chromosomes in a nonrandom fashion in tripolar mitosis, we considered (i) that each chromosome segregates independently of the others and of its parental origin and (ii) that the two chromatids of the same chromosome cannot segregate to the same daughter cell. The probability of a nonrandom segregation under these conditions is 1/1.84 × 1023.
SNP assay
For the SNP assays, cells were stained with PI (as previously described) to analyze the cell cycle by flow cytometry. After sorting, DNA of pools of cells was isolated using standard protocols and purified using the Qiagen polymerase chain reaction (PCR) purification kit. For single-cell SNP array, individual single cells were sorted from PI-stained samples. To amplify the genome, individually sorted cells were immediately processed using the MALBAC Single Cell Whole Genome Amplification (WGA) Kit (Yikon Genomics) following the manufacturer’s suggestions. After WGA, each single-cell–isolated DNA was purified using the Qiagen PCR purification kit. The 384 SNP complete mouse background array was performed in Charles River Genetic Testing Services, USA.
Two-cell stage embryo fusion
Embryos from a cross between BDF1 mice (the Jackson Laboratory) were collected at 1.5 dpc in M2 medium with BSA, washed in M2 medium and in increasing concentrations of mannitol:M2, and pulsed in mannitol solution with a 150 V/cm electric pulse (60 μs). Then, embryos were washed in M2 and cultured in Advanced KSOM (Millipore). Only embryos with only one clear cell 2 hours after fusion were classified as fused.
Mouse embryo injections and chimera analysis
Cells that constitutively expressed the fluorescent protein dsRED were used for injection in wild-type embryos and were generated as described above. Cells grown on iMEF feeders were treated with 1 mM mitogen-activated protein kinase inhibitor (PD0325901) 24 hours before injection in two-cell stage or blastocyst embryos. For two-cell stage injection, BDF1 × BDF1 embryos were collected at 1.5 dpc in M2 medium with BSA, the zona pellucida was pierced using a sharp needle, and 4n dsRED-positive cells were microinjected using a blunt-end injecting pipette and an IX71 micromanipulation station (Olympus) equipped with a microinjector (CellTram, Eppendorf). Embryos were then maintained at 37°C, 5% CO2, and 5% O2 incubator in drops of Advanced KSOM for in vitro development. Embryos used for time-lapse imaging were placed in a 35-mm glass-bottom dish (MatTek Corporation) and cultured in KSOM without BSA to reduce movement during imaging. Embryos were imaged on an Andor Revolution XD confocal microscope equipped with the features mentioned above using a 20× objective. Imaging was performed at 37°C and 5% CO2. DIC images were taken with an exposure time of 80 ms. A 561-nm laser was used with the AOTF set at 4.8% (approximately 0.1-mW laser power) and with a maximum exposure time of 80 ms. Twenty to 40 z-stacks (taken each 4 to 5 μm) were obtained for each embryo. All time-lapse images were analyzed using Fiji (ImageJ).
For blastocyst injections, 3.5 dpc CD1 embryos (albino background) were obtained from pregnant females and cultured in KSOM medium at 37°C for 2 hours. Cells used for injection were shortly trypsinized and separated from iMEFs. The supernatant (containing nonattached cells) was then collected, centrifuged, and resuspended in cold M2 medium. Eight to 12 cells (black background) were microinjected into the cavity of 3.5 dpc blastocysts using a ground injection pipette and the same micromanipulation setup as for the two-cell stage embryos. Injected embryos were then kept at 37°C in KSOM medium until uterine transfer 2 to 3 hours later. Ten to 15 blastocysts were transferred into each CD1 pseudo-pregnant female (2.5 days after copulation with vasectomized males).
Chimerism at 12.5 dpc of gestation was determined by analyzing whole embryos by flow cytometry. For this, embryos were individually collected and trypsinized for 1 hour at 37°C. Then, samples were washed with DMEM + 10% FBS, centrifuged for 10 min at 1200 rpm (4°C), and filtered through a 40-μm filter. After an erythrocyte lysis protocol, cells were resuspended in Opti-MEM before analysis by flow cytometry. Placenta and yolk sac samples were processed in the same way. To assess chimerism after birth, animals were euthanized at 8 days or 8 weeks after birth. Chimerism was assessed by coat color and by checking the dsRED fluorescence of individual organs under a stereomicroscope. Organs were physically dissociated in DMEM + 10% FBS, filtered through a 40-μm filter, and centrifuged twice for 10 min at 1200 rpm (4°C). After an erythrocyte lysis protocol, cells were resuspended in Opti-MEM and analyzed by flow cytometry. tdiRFP/dsRED-positive and tdiRFP/dsRED-negative cells were FACS-sorted and processed for cell cycle analysis, as previously explained.
Computed tomography (CT) images of chimeric mice were acquired in four different sections (head, thorax, abdomen, and perineum) across the whole body of the mice, in a total of 2048 images. Images of different sections were processed using ImageJ and aligned using Imaris stitching software.
All animal experiments were approved and performed in accordance with institutional guidelines [Parc de Recerca Biomèdica de Barcelona (PRBB), Barcelona] and in accordance with the CEEA (Ethical Committee for Animal Experimentation) number PC-17-0019-PI, approved by La Comissió d’Experimentació Animal of Departament de Territori i Sostenibilitat Direcció General de Polítiques Ambientals i Medi Natural, Generalitat de Catalunya.
Statistical analysis
The data are represented as means ± SD of independent experiments, and significance was calculated using unpaired Student’s t test.
Supplementary Material
Acknowledgments
We thank G. Filion, J. Lüders, M. Mendoza, I. Vernos, and A. Zwijsen for suggestions on the manuscript. We thank F. Sottile (CRG, Barcelona) for the pHIV-H2B-eGFP construct. We thank B. Welm and Z. Werb for pHIV-H2BmRFP (Addgene plasmid no.18982), G. Wahl for H2B-GFP (Addgene plasmid no. 11680), C. Cepko for pCALNL-dsRED (Addgene plasmid no. 13769), M. E. Torres-Padilla for pCAG-H2B-tdiRFP-IP (Addgene plasmid no. 47884), M. Leeb for the PiggyBac plasmids, S. Forrow for W4 ESCs, and B. Merrill for Tcf3−/− ESCs lines. We thank the laboratories of J. Sharpe and B. Payer (CRG, Barcelona) for suggestions and technical help, J. A. Camara Serrano (Vall d’Hebron Institut de Recerca, Barcelona) for mouse CT studies, and T. Lendl for CT image processing (IMP/IMBA, Vienna, Austria). We thank the UPF/CRG Flow Cytometry Unit and the CRG Advanced Light Microscopy and Tissue Engineering Units and the PRBB animal facility (PRBB, Barcelona) for animal cares. Funding: This work was supported by the Ministerio de Ciencia, Innovación y Universidades, (BFU2017-86760-P to M.P.C.) (AEI/FEDER, UE) and the AGAUR grant from Secretaria d’Universitats i Recerca del Departament d’Empresa i Coneixement de la Generalitat de Catalunya, (2017 SGR 689 to M.P.C.). Work in M.P.C. lab was supported by funding from the European Union’s Horizon 2020 research and innovation programme under grant agreement no. 686637 (CellViewer). We acknowledge support of the Spanish Ministry of Economy, Industry and Competitiveness (MEIC) to the EMBL partnership, the Centro de Excelencia Severo Ochoa and the CERCA Programme / Generalitat de Catalunya. KU Leuven C1 funds (C14/16/078 to F.L.), FWO national grants (G097618N to F.L.), Instituto de Salud Carlos III (CP10/00445 to F.L.), a “CRG-Severo Ochoa” predoctoral fellowship (to P.C.), and a grant from the Fundação para a Ciência e a Tecnologia (FCT) (SFRH/BD/76068/2011 to J.F.). Author contributions: J.F., F.L., and M.P.C. designed experiments. J.F., P.C., and N.R. performed experiments, and J.F. analyzed data. S.N. performed embryo injections, and U.d.V. performed embryo transfers. J.F. and M.P.C. wrote the manuscript with revision from F.L. M.P.C. supervised the project. Competing interests: The authors declare that they have no competing interests. Data and materials availability: All data needed to evaluate the conclusions in the paper are present in the paper and/or the Supplementary Materials. Additional data related to this paper may be requested from the authors.
SUPPLEMENTARY MATERIALS
Supplementary material for this article is available at http://advances.sciencemag.org/cgi/content/full/5/10/eaax4199/DC1
Fig. S1. Tetraploid Oct4-GFP–positive cells reduce ploidy during embryo development.
Fig. S2. Fusion-derived cells proliferate in self-renewal conditions and originate Oct4-GFP–positive 4n and Oct4-GFP–negative 2n cells.
Fig. S3. Tetraploid cells undergo tripolar mitosis and form viable daughter cells.
Fig. S4. Parental chromosome segregation during hybrids’ division can be nonrandom.
Fig. S5. 4n-derived 2n cells show NPC and ESC phenotype if cultured in the respective culture medium.
Movie S1. Time-lapse imaging of an embryo injected with one single PB-dsRED 4n cell. Example 1.
Movie S2. Time-lapse imaging of an embryo injected with one single PB-dsRED 4n cell. Example 2.
Movie S3. Fly-through images of CT studies performed in 8-week-old chimeric mouse. Mouse 1.
Movie S4. Fly-through images of CT studies performed in 8-week-old chimeric mouse. Mouse 2.
Movie S5. Fly-through images of CT studies performed in 8-week-old chimeric mouse. Mouse 3.
Movie S6. Fly-through images of CT studies performed in 8-week-old chimeric mouse. Mouse 4.
Movie S7. Fly-through images of CT studies performed in 8-week-old chimeric mouse. Mouse 5.
Movie S8. Fly-through images of CT studies performed in 8-week-old chimeric mouse. Mouse 6.
Movie S9. Fly-through images of CT studies performed in 8-week-old chimeric mouse. Mouse 7.
Movie S10. Fly-through images of CT studies performed in 8-week-old chimeric mouse. Mouse 8.
Movie S11. Fly-through images of CT studies performed in 8-week-old chimeric mouse. Mouse 9.
Movie S12. Time-lapse images of a synkaryon 4n cell carrying mRFP-tagged histone H2B (H2B-RFP) undergoing bipolar division.
Movie S13. Time-lapse images of a synkaryon 4n cell carrying H2B-RFP undergoing tripolar division.
Movie S14. Time-lapse images of a synkaryon 4n cell carrying H2B-RFP undergoing tripolar division without mitotic catastrophe.
Movie S15. Time-lapse images of a sorted hybrid cell generated after fusion between ESC-H2B-eGFP and NPC-H2B-mRFP that does not undergo mitosis.
Movie S16. Time-lapse images of a sorted hybrid cell generated after fusion between ESC-H2B-eGFP and NPC-H2B-mRFP that undergoes bipolar mitosis.
Movie S17. Time-lapse images of a sorted hybrid cell generated after fusion between ESC-H2B-eGFP and NPC-H2B-mRFP that undergoes tripolar mitosis with random segregation.
Movie S18. Time-lapse images of a sorted hybrid cell generated after fusion between ESC-H2B-eGFP and NPC-H2B-mRFP that undergoes tripolar mitosis with non-random segregation.
Movie S19. Time-lapse images of a sorted hybrid cell generated after fusion between ESC-H2B-eGFP and NPC-H2B-mRFP with parental chromosomes showing different spatial occupancy after bipolar mitosis.
Movie S20. Time-lapse images of a sorted hybrid cell generated after fusion between ESC-H2B-eGFP and NPC-H2B-mRFP with parental chromosomes showing different spatial occupancy after tripolar mitosis.
Movie S21. Time-lapse images of a long-time tracking a sorted hybrid cell generated after fusion between ESC-H2B-eGFP and NPC-H2B-mRFP.
Table S1. SNP genotyping raw data.
REFERENCES AND NOTES
- 1.Huppertz B., Gauster M., Trophoblast fusion. Adv. Exp. Med. Biol. 713, 81–95 (2011). [DOI] [PubMed] [Google Scholar]
- 2.Lluis F., Cosma M. P., Cell-fusion-mediated somatic-cell reprogramming: A mechanism for tissue regeneration. J. Cell. Physiol. 223, 6–13 (2010). [DOI] [PubMed] [Google Scholar]
- 3.Margall-Ducos G., Celton-Morizur S., Couton D., Brégerie O., Desdouets C., Liver tetraploidization is controlled by a new process of incomplete cytokinesis. J. Cell Sci. 120, 3633–3639 (2007). [DOI] [PubMed] [Google Scholar]
- 4.Rochlin K., Yu S., Roy S., Baylies M. K., Myoblast fusion: When it takes more to make one. Dev. Biol. 341, 66–83 (2010). [DOI] [PMC free article] [PubMed] [Google Scholar]
- 5.Sanges D., Simonte G., Di Vicino U., Romo N., Pinilla I., Nicolás M., Cosma M. P., Reprogramming Müller glia via in vivo cell fusion regenerates murine photoreceptors. J. Clin. Invest. 126, 3104–3116 (2016). [DOI] [PMC free article] [PubMed] [Google Scholar]
- 6.Wang X., Willenbring H., Akkari Y., Torimaru Y., Foster M., Al-Dhalimy M., Lagasse E., Finegold M., Olson S., Grompe M., Cell fusion is the principal source of bone-marrow-derived hepatocytes. Nature 422, 897–901 (2003). [DOI] [PubMed] [Google Scholar]
- 7.Duncan A. W., Hickey R. D., Paulk N. K., Culberson A. J., Olson S. B., Finegold M. J., Grompe M., Ploidy reductions in murine fusion-derived hepatocytes. PLOS Genet. 5, e1000385 (2009). [DOI] [PMC free article] [PubMed] [Google Scholar]
- 8.Pedone E., Olteanu V.-A., Marucci L., Munoz-Martin M. I., Youssef S. A., de Bruin A., Cosma M. P., Modeling dynamics and function of bone marrow cells in mouse liver regeneration. Cell Rep. 18, 107–121 (2017). [DOI] [PMC free article] [PubMed] [Google Scholar]
- 9.Alvarez-Dolado M., Pardal R., Garcia-Verdugo J. M., Fike J. R., Lee H. O., Pfeffer K., Lois C., Morrison S. J., Alvarez-Buylla A., Fusion of bone-marrow-derived cells with Purkinje neurons, cardiomyocytes and hepatocytes. Nature 425, 968–973 (2003). [DOI] [PubMed] [Google Scholar]
- 10.Weimann J. M., Johansson C. B., Trejo A., Blau H. M., Stable reprogrammed heterokaryons form spontaneously in Purkinje neurons after bone marrow transplant. Nat. Cell Biol. 5, 959–966 (2003). [DOI] [PubMed] [Google Scholar]
- 11.Duncan A. W., Taylor M. H., Hickey R. D., Hanlon Newell A. E., Lenzi M. L., Olson S. B., Finegold M. J., Grompe M., The ploidy conveyor of mature hepatocytes as a source of genetic variation. Nature 467, 707–710 (2010). [DOI] [PMC free article] [PubMed] [Google Scholar]
- 12.Skinner A. M., Grompe M., Kurre P., Intra-hematopoietic cell fusion as a source of somatic variation in the hematopoietic system. J. Cell Sci. 125, 2837–2843 (2012). [DOI] [PMC free article] [PubMed] [Google Scholar]
- 13.Lluis F., Pedone E., Pepe S., Cosma M. P., Periodic activation of Wnt/β-catenin signaling enhances somatic cell reprogramming mediated by cell fusion. Cell Stem Cell 3, 493–507 (2008). [DOI] [PubMed] [Google Scholar]
- 14.Ying Q. L., Nichols J., Evans E. P., Smith A. G., Changing potency by spontaneous fusion. Nature 416, 545–548 (2002). [DOI] [PubMed] [Google Scholar]
- 15.Do J. T., Schöler H. R., Nuclei of embryonic stem cells reprogram somatic cells. Stem Cells 22, 941–949 (2004). [DOI] [PubMed] [Google Scholar]
- 16.Eakin G. S., Hadjantonakis A. K., Papaioannou V. E., Behringer R. R., Developmental potential and behavior of tetraploid cells in the mouse embryo. Dev. Biol. 288, 150–159 (2005). [DOI] [PubMed] [Google Scholar]
- 17.Angell R. R., Sumner A. T., West J. D., Thatcher S. S., Glasier A. F., Baird D. T., Post-fertilization polyploidy in human preimplantation embryos fertilized in-vitro. Hum. Reprod. 2, 721–727 (1987). [DOI] [PubMed] [Google Scholar]
- 18.Bolton H., Graham S. J., Van der Aa N., Kumar P., Theunis K., Fernandez Gallardo E., Voet T., Zernicka-Goetz M., Mouse model of chromosome mosaicism reveals lineage-specific depletion of aneuploid cells and normal developmental potential. Nat. Commun. 7, 11165 (2016). [DOI] [PMC free article] [PubMed] [Google Scholar]
- 19.Greco E., Minasi M. G., Fiorentino F., Healthy babies after intrauterine transfer of mosaic aneuploid blastocysts. N. Engl. J. Med. 373, 2089–2090 (2015). [DOI] [PubMed] [Google Scholar]
- 20.Mackay G. E., West J. D., Fate of tetraploid cells in 4n↔2n chimeric mouse blastocysts. Mech. Dev. 122, 1266–1281 (2005). [DOI] [PubMed] [Google Scholar]
- 21.Tada M., Takahama Y., Abe K., Nakatsuji N., Tada T., Nuclear reprogramming of somatic cells by in vitro hybridization with ES cells. Curr. Biol. 11, 1553–1558 (2001). [DOI] [PubMed] [Google Scholar]
- 22.Silva J., Chambers I., Pollard S., Smith A., Nanog promotes transfer of pluripotency after cell fusion. Nature 441, 997–1001 (2006). [DOI] [PubMed] [Google Scholar]
- 23.Leeb M., Walker R., Mansfield B., Nichols J., Smith A., Wutz A., Germline potential of parthenogenetic haploid mouse embryonic stem cells. Development 139, 3301–3305 (2012). [DOI] [PMC free article] [PubMed] [Google Scholar]
- 24.Lluis F., Ombrato L., Pedone E., Pepe S., Merrill B. J., Cosma M. P., T-cell factor 3 (Tcf3) deletion increases somatic cell reprogramming by inducing epigenome modifications. Proc. Natl. Acad. Sci. U.S.A. 108, 11912–11917 (2011). [DOI] [PMC free article] [PubMed] [Google Scholar]
- 25.Ganem N. J., Godinho S. A., Pellman D., A mechanism linking extra centrosomes to chromosomal instability. Nature 460, 278–282 (2009). [DOI] [PMC free article] [PubMed] [Google Scholar]
- 26.Storchova Z., Kuffer C., The consequences of tetraploidy and aneuploidy. J. Cell Sci. 121, 3859–3866 (2008). [DOI] [PubMed] [Google Scholar]
- 27.Vitale I., Galluzzi L., Castedo M., Kroemer G., Mitotic catastrophe: A mechanism for avoiding genomic instability. Nat. Rev. Mol. Cell Biol. 12, 385–392 (2011). [DOI] [PubMed] [Google Scholar]
- 28.Maiato H., Logarinho E., Mitotic spindle multipolarity without centrosome amplification. Nat. Cell Biol. 16, 386–394 (2014). [DOI] [PubMed] [Google Scholar]
- 29.Zessin P. J., Finan K., Heilemann M., Super-resolution fluorescence imaging of chromosomal DNA. J. Struct. Biol. 177, 344–348 (2012). [DOI] [PubMed] [Google Scholar]
- 30.Sullivan S., Eggan K., The potential of cell fusion for human therapy. Stem Cell Rev. 2, 341–349 (2006). [DOI] [PubMed] [Google Scholar]
- 31.Balakier H., Cabaca O., Bouman D., Shewchuk A. B., Laskin C., Squire J. A., Spontaneous blastomere fusion after freezing and thawing of early human embryos leads to polyploidy and chromosomal mosaicism. Hum. Reprod. 15, 2404–2410 (2000). [DOI] [PubMed] [Google Scholar]
- 32.Altarche-Xifro W., di Vicino U., Muñoz-Martin M. I., Bortolozzi A., Bové J., Vila M., Cosma M. P., Functional rescue of dopaminergic neuron loss in Parkinson’s disease mice after transplantation of hematopoietic stem and progenitor cells. EBioMedicine 8, 83–95 (2016). [DOI] [PMC free article] [PubMed] [Google Scholar]
- 33.Sanges D., Romo N., Simonte G., Di Vicino U., Tahoces A. D., Fernandez E., Cosma M. P., Wnt/β-catenin signaling triggers neuron reprogramming and regeneration in the mouse retina. Cell Rep. 4, 271–286 (2013). [DOI] [PubMed] [Google Scholar]
- 34.Sottile F., Aulicino F., Theka I., Cosma M. P., Mesenchymal stem cells generate distinct functional hybrids in vitro via cell fusion or entosis. Sci. Rep. 6, 36863 (2016). [DOI] [PMC free article] [PubMed] [Google Scholar]
- 35.Reichmann J., Nijmeijer B., Hossain M. J., Eguren M., Schneider I., Politi A. Z., Roberti M. J., Hufnagel L., Hiiragi T., Ellenberg J., Dual-spindle formation in zygotes keeps parental genomes apart in early mammalian embryos. Science 361, 189–193 (2018). [DOI] [PubMed] [Google Scholar]
- 36.van de Werken C., van der Heijden G. W., Eleveld C., Teeuwssen M., Albert M., Baarends W. M., Laven J. S., Peters A. H., Baart E. B., Paternal heterochromatin formation in human embryos is H3K9/HP1 directed and primed by sperm-derived histone modifications. Nat. Commun. 5, 5868 (2014). [DOI] [PMC free article] [PubMed] [Google Scholar]
- 37.Destouni A., Vermeesch J. R., How can zygotes segregate entire parental genomes into distinct blastomeres? The zygote metaphase revisited. Bioessays 39, 1600226 (2017). [DOI] [PubMed] [Google Scholar]
- 38.Tajbakhsh S., Gonzalez C., Biased segregation of DNA and centrosomes: Moving together or drifting apart? Nat. Rev. Mol. Cell Biol. 10, 804–810 (2009). [DOI] [PubMed] [Google Scholar]
- 39.Yadlapalli S., Yamashita Y. M., Chromosome-specific nonrandom sister chromatid segregation during stem-cell division. Nature 498, 251–254 (2013). [DOI] [PMC free article] [PubMed] [Google Scholar]
- 40.Elling U., Taubenschmid J., Wirnsberger G., O’Malley R., Demers S. P., Vanhaelen Q., Shukalyuk A. I., Schmauss G., Schramek D., Schnuetgen F., von Melchner H., Ecker J. R., Stanford W. L., Zuber J., Stark A., Penninger J. M., Forward and reverse genetics through derivation of haploid mouse embryonic stem cells. Cell Stem Cell 9, 563–574 (2011). [DOI] [PMC free article] [PubMed] [Google Scholar]
- 41.Pereira C. F., Fisher A. G., Heterokaryon-based reprogramming for pluripotency. Curr. Protoc. Stem Cell Biol. 9, 4B.1.1–4B.1.14 (2009). [DOI] [PubMed] [Google Scholar]
- 42.Bolland D. J., King M. R., Reik W., Corcoran A. E., Krueger C., Robust 3D DNA FISH using directly labeled probes. J. Vis. Exp. 78, e50587 (2013). [DOI] [PMC free article] [PubMed] [Google Scholar]
- 43.Elabd C., Cousin W., Chen R. Y., Chooljian M. S., Pham J. T., Conboy I. M., Conboy M. J., DNA methyltransferase-3–dependent nonrandom template segregation in differentiating embryonic stem cells. J. Cell Biol. 203, 73–85 (2013). [DOI] [PMC free article] [PubMed] [Google Scholar]
Associated Data
This section collects any data citations, data availability statements, or supplementary materials included in this article.
Supplementary Materials
Supplementary material for this article is available at http://advances.sciencemag.org/cgi/content/full/5/10/eaax4199/DC1
Fig. S1. Tetraploid Oct4-GFP–positive cells reduce ploidy during embryo development.
Fig. S2. Fusion-derived cells proliferate in self-renewal conditions and originate Oct4-GFP–positive 4n and Oct4-GFP–negative 2n cells.
Fig. S3. Tetraploid cells undergo tripolar mitosis and form viable daughter cells.
Fig. S4. Parental chromosome segregation during hybrids’ division can be nonrandom.
Fig. S5. 4n-derived 2n cells show NPC and ESC phenotype if cultured in the respective culture medium.
Movie S1. Time-lapse imaging of an embryo injected with one single PB-dsRED 4n cell. Example 1.
Movie S2. Time-lapse imaging of an embryo injected with one single PB-dsRED 4n cell. Example 2.
Movie S3. Fly-through images of CT studies performed in 8-week-old chimeric mouse. Mouse 1.
Movie S4. Fly-through images of CT studies performed in 8-week-old chimeric mouse. Mouse 2.
Movie S5. Fly-through images of CT studies performed in 8-week-old chimeric mouse. Mouse 3.
Movie S6. Fly-through images of CT studies performed in 8-week-old chimeric mouse. Mouse 4.
Movie S7. Fly-through images of CT studies performed in 8-week-old chimeric mouse. Mouse 5.
Movie S8. Fly-through images of CT studies performed in 8-week-old chimeric mouse. Mouse 6.
Movie S9. Fly-through images of CT studies performed in 8-week-old chimeric mouse. Mouse 7.
Movie S10. Fly-through images of CT studies performed in 8-week-old chimeric mouse. Mouse 8.
Movie S11. Fly-through images of CT studies performed in 8-week-old chimeric mouse. Mouse 9.
Movie S12. Time-lapse images of a synkaryon 4n cell carrying mRFP-tagged histone H2B (H2B-RFP) undergoing bipolar division.
Movie S13. Time-lapse images of a synkaryon 4n cell carrying H2B-RFP undergoing tripolar division.
Movie S14. Time-lapse images of a synkaryon 4n cell carrying H2B-RFP undergoing tripolar division without mitotic catastrophe.
Movie S15. Time-lapse images of a sorted hybrid cell generated after fusion between ESC-H2B-eGFP and NPC-H2B-mRFP that does not undergo mitosis.
Movie S16. Time-lapse images of a sorted hybrid cell generated after fusion between ESC-H2B-eGFP and NPC-H2B-mRFP that undergoes bipolar mitosis.
Movie S17. Time-lapse images of a sorted hybrid cell generated after fusion between ESC-H2B-eGFP and NPC-H2B-mRFP that undergoes tripolar mitosis with random segregation.
Movie S18. Time-lapse images of a sorted hybrid cell generated after fusion between ESC-H2B-eGFP and NPC-H2B-mRFP that undergoes tripolar mitosis with non-random segregation.
Movie S19. Time-lapse images of a sorted hybrid cell generated after fusion between ESC-H2B-eGFP and NPC-H2B-mRFP with parental chromosomes showing different spatial occupancy after bipolar mitosis.
Movie S20. Time-lapse images of a sorted hybrid cell generated after fusion between ESC-H2B-eGFP and NPC-H2B-mRFP with parental chromosomes showing different spatial occupancy after tripolar mitosis.
Movie S21. Time-lapse images of a long-time tracking a sorted hybrid cell generated after fusion between ESC-H2B-eGFP and NPC-H2B-mRFP.
Table S1. SNP genotyping raw data.