Introductory Paragraph
B cells are important in the pathogenesis of many, and perhaps all, immune-mediated diseases (IMDs). Each B cell expresses a single B cell receptor (BCR)1, with the diverse range of BCRs expressed by an individual’s total B cell population being termed the “BCR repertoire”. Our understanding of the BCR repertoire in the context of IMDs is incomplete, and defining this could reveal new insights into pathogenesis and therapy. We therefore compared the BCR repertoire in systemic lupus erythematosus (SLE), ANCA-associated vasculitis (AAV), Crohn’s disease (CD), Behçet’s disease (BD), eosinophilic granulomatosis with polyangiitis (EGPA) and IgA vasculitis (IgAV), analysing BCR clonality, and immunoglobulin heavy chain gene (IGHV) and, in particular, isotype usage. An IgA-dominated increased clonality in SLE and CD, together with skewed IGHV gene usage in these and other diseases, suggested a microbial contribution to pathogenesis. Different immunosuppressive treatment had specific and distinct impacts on the repertoire; B cells persisting after rituximab were predominately isotype-switched and clonally expanded, the inverse of those persisting after mycophenolate mofetil. A comparative analysis of the BCR repertoire in immune-mediated disease reveals a complex B cell architecture, providing a platform for understanding pathological mechanisms and designing treatment strategies.
Immunoglobulin gene recombination during B cell development in the bone marrow (or fetal liver)2 forms the “naïve” repertoire, which is modified by the removal/suppression of self-reactive B cells to reduce the chance of autoimmune disease3 (although 20-40% of B cells remain autoreactive4). Further repertoire diversification occurs after B cells respond to antigen. Many undergo “isotype switching” where stepwise DNA deletion and recombination from IgM generates “downstream” isotypes (IgG1/2/3/4, IgA1/2, IgD and IgE) which confer distinct functional characteristics and roles in disease5,6. Isotype delineation is thus vital for a full analysis of the BCR repertoire. Further BCR diversification occurs in specialized germinal centers (GCs) – where V gene somatic hypermutation (SHM) may enhance BCR affinity and specificity7. This post-antigenic diversification of B cell clones is tempered by tolerance “checkpoints” to reduce the risk of autoimmunity8. The peripheral BCR repertoire is thus a composite of both the naïve repertoire and that generated by antigenic encounter.
BCR repertoire features have been correlated with both microbial interactions and IMDs, with specific IGHV regions recognizing commensal and/or pathogenic microbes or being associated with IMDs (Table S1). We analysed the BCR repertoire in 209 individuals across six IMDs (Tables S2,Extended Data Figure 1a), comparing (i) IMDs characterized by autoantibody responses against either single dominant (AAV) or multiple (SLE) autoantigens, (ii) those not thought to be autoimmune (CD, BD), and (iii) those with incomplete evidence of B cell involvement or autoimmunity: EGPA (formerly Churg-Strauss syndrome) and IgAV (formerly Henoch-Schönlein purpura) (disease descriptions, Supplementary discussion file 1).
We developed a method to barcode, amplify, and sequence BCR repertoires from RNA encoding the antigen-binding (IgH (VDJ)) and constant regions of the BCR heavy chain, facilitating isotype class/subclass analysis while allowing quantitation of clone frequency and correction of PCR/sequencing error (Extended Data Figure 1b)9. We then analyzed the BCR repertoire in sorted B cells from 19 healthy controls (Supplementary discussion file 2, Extended Data Figure 1-2) to develop methods to control for the impact of age and differential cellular RNA content (Methods, Extended Data Figure 2-3a-c, Table S4). We define the “normalized” isotype usages representing the percentage of unique VDJ sequences per isotype, thus counting each B cell’s contribution to the repertoire only once.
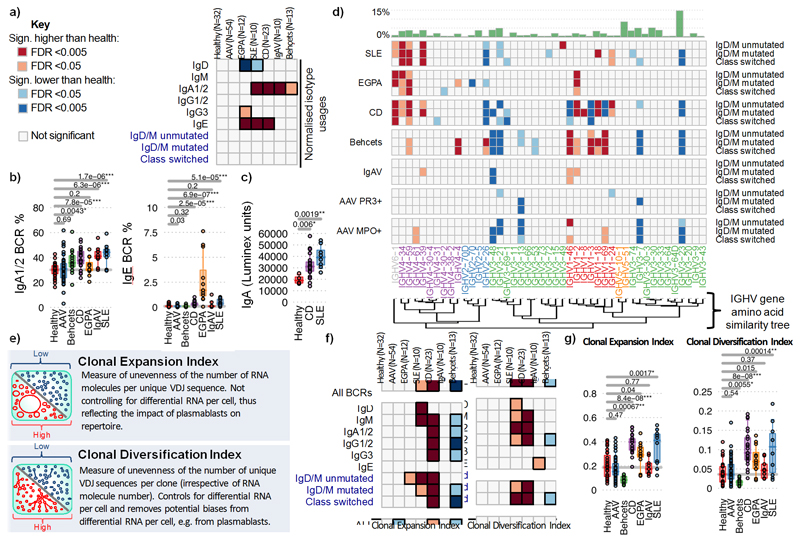
Comparative studies in IMDs have often been confounded by differences in disease duration, activity and treatment. We therefore specifically recruited patients with objective evidence of active disease and had not yet commenced treatment (although stable doses of low-level therapy known not to affect repertoire were permitted; methods, Supplementary discussion file 1). The majority were newly diagnosed. In all patients the number of B cells sampled was less that the number of unique BCR sequences detected (Table S3). We compared isotype use in repertoires from unseparated peripheral blood mononuclear cells (PBMC) in healthy controls and IMD patients (Figure 1a-b,Extended Data Figure 3d). Compared to health, IgA was over-represented in all diseases except AAV and EGPA, particularly so in SLE and CD. This corresponded with increased serum IgA most pronounced in SLE (Figure 1c). IgE was raised in SLE, CD and, in particular, EGPA (Figure 1b,Extended Data Figure 3d,e), which also exhibited elevated IgG3. Isotype usage in AAV was similar to healthy controls. There is therefore marked variation in isotype use in IMD, with IgA the unexpected dominant isotype in diseases such as SLE and BD.
Figure 1. Differences in isotype, IGHV gene usages and clonality between IMDs.
a) Heatmap of the normalized isotype usages per disease. b) The percentages of normalized IgA1/2 and IgE BCR percentage usages per disease. c) IgA titre in healthy individuals (n=4) and CD (n=20) and SLE (n=8) patients. d) Heatmap of IGHV gene frequency and BCR subtypes in health and disease: IgM+D+SHM- BCR sequences, (>78% derived from naive B cells); IgM+D+SHM+ BCR sequences - SHM is evidence of antigenic stimulation; and IgM-D- BCR sequences, all isotype-switched and therefore post-antigenic. Light and dark orange squares indicate significantly higher, and light and dark blue squares lower, gene frequency in disease than health. Only genes >0.1% in frequency are shown. Relative mean gene frequencies in healthy individuals are indicated at the top (full heatmap in Supplemental data file 3). IGHV genes are ordered according to amino acid similarity, indicated by the IGHV gene amino acid similarity tree (see methods). e) Explanations of clonality measures and network representations of BCR repertoires. f) Heatmap showing the (left) Clonal Expansion Index and (right) Clonal Diversification Index of each isotype per disease from total PBMC B cells. g) The (left) Clonal Expansion Index and (right) Clonal Diversification Index for PBMC BCR repertoires per disease. For (a),(b),(d),(f),(g): n=32, 18, 32, 12, 10, 23, 10 and 13 for healthy, AAV MP0+, AAV PR3+, EGPA, SLE, CD IgAV and Behçet’s patients respectively. P-values calculated by two-sided ANOVA for (a)-(c) and * denotes false discovery rate (FDR) <0.05, ** <0.005, *** <0.0005, where FDR determined by Šidák method. For (d),(f): Light and dark orange squares indicate significantly higher, and light and dark blue squares significantly lower, isotype use in disease compared to health. Boxplots show the 25th, 50th and 75th percentiles; whiskers show upper and lower quartiles.
BCR repertoire diversity is driven in part by differential use of IGHV genes, as well as non-template additions/deletions. Some individual genes, and IGHV subgroups (defined by structural similarity10), preferentially bind microbial antigens and/or have been associated with autoimmunity (Table S1). We examined IGHV gene frequency in naïve and antigen-experienced B cells across IMDs (Figure 1d, Extended Data Figure 4a, Supplemental data files 2-3). IGHV4 family genes were increased in CD, SLE and EGPA, as was IGHV6-1. Interestingly, IGHV4-34 binds both autoantigens11 and commensal bacteria12, and has been associated with SLE13. Our data extends the SLE association of IGHV4-34 (and its 9G4 idiotype) to EGPA and CD (Extended Data Figure 4b). Both IGHV6-1 and IGHV4-59 have been associated with autoreactivity (Table S4). IGHV gene associations were seen in both the predominantly “naïve” and “post-antigenic” compartments, and in both non-expanded and expanded clones (Extended Data Figure 4a), raising the possibility they are not purely a consequence of selected expansion after disease development (except in CD where IGHV differences were predominantly “pre-antigenic”). V1 family genes were over-represented in IMDs, particularly CD and BD. The most striking association was of BD with IGHV1-46, -3 and -69, all previously associated with infection, in both the naive and post-antigenic repertoires. Reduced representation of IGHV genes is also seen in some diseases, reflecting either a proportional reduction due to increased frequency of other IGHV genes or real disease associations. Levels of SHM did not vary between diseases (Extended Data Figure 4c).
Increased length of complementary determining region 3 (CDR3) of the BCR is associated with antibody polyreactivity and autoimmunity14. Building on previous work9, we found an association between CDR3 length and IGHV gene use in healthy individuals (Extended Data Figure 2, Extended Data Figure 4d). In disease, increased CDR3 length was found in SLE (IgG and IgA) and CD (unswitched B cells) (Extended Data Figure 4c).
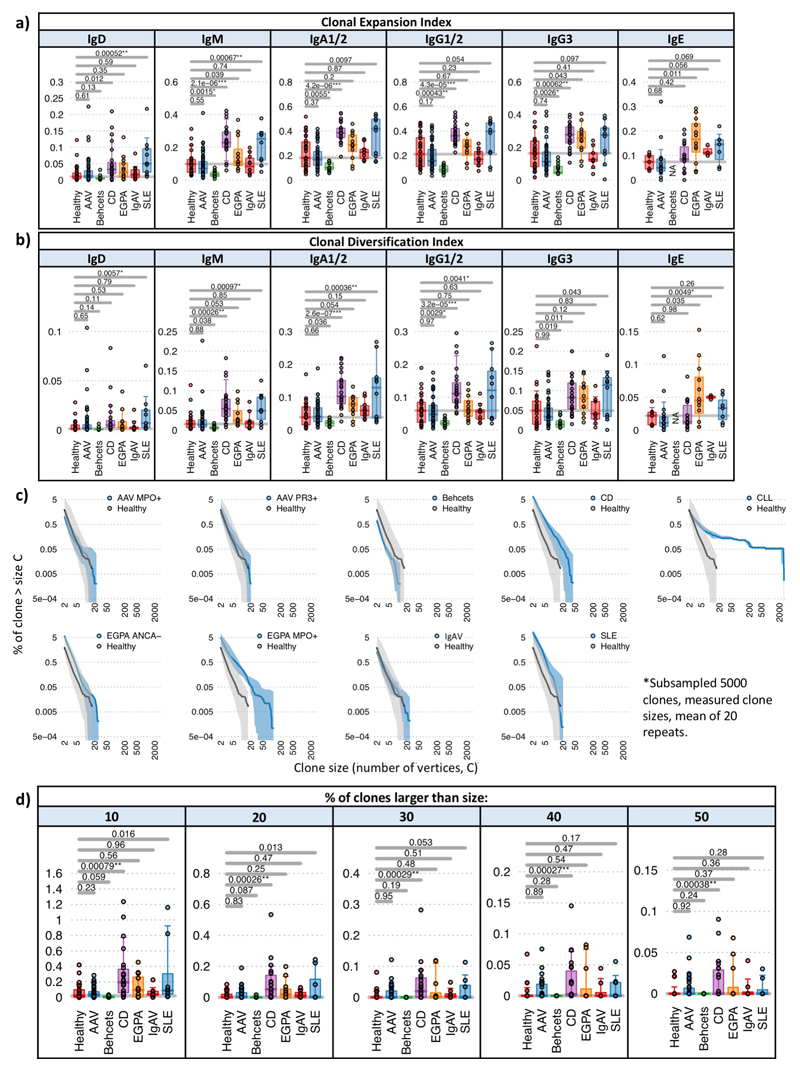
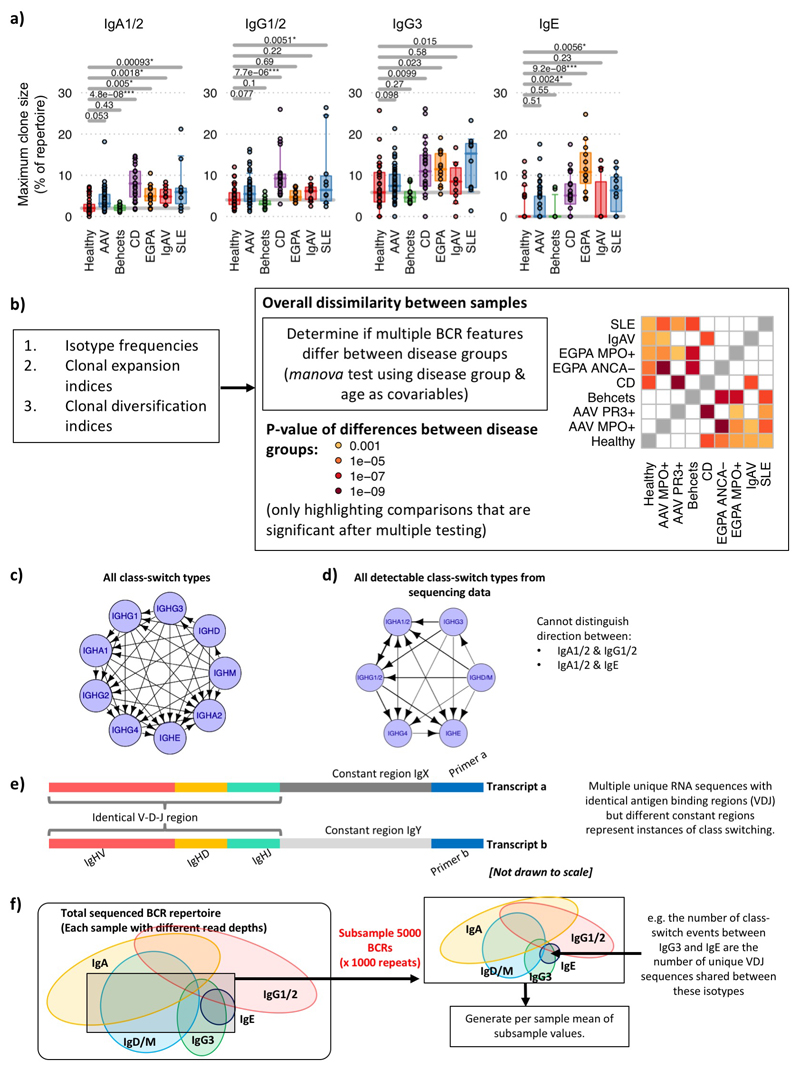
B cell clones are defined by sharing a unique VDJ rearrangement, and can be characterised by size (clonal expansion) and diversification (due to SHM and isotype switching). Using a “clone sampling” repertoire visualization method (Supplementary discussion file 4, Extended Data Figure 5), we found no differences between healthy controls and AAV or IgAV, reduced clonality in BD, but increased clonal expansion and complexity in CD, EGPA and SLE (Supplementary data file 5,6). We extended this analysis by determining the Clonal Expansion Index (a measure of “unevenness” of the number of RNA molecules per unique VDJ region sequence via the Gini index15) and Clonal Diversification Index (measuring the unevenness of unique VDJ region sequences per clone) (see Methods, Figures 1e-g,Extended Data Figure 6). CD patients had increased clonal expansion and diversification across many isotypes, particularly IgA, IgG and IgM. SLE showed a similar pattern, though with increased clonality primarily in unswitched cells and with greater variation between patients, as did EGPA, but with IgE predominant. Differences in maximum clone size were consistent with these data (Extended Data Figure 6c,d,7a). In contrast, patients with active AAV or IgAV showed no gross difference in clonal expansion or diversification, and in BD both were reduced compared to controls. We then used a multivariate comparison to assess “clonal normality” (see Methods), and found significant dissimilarity between the repertoires of CD, EGPA and SLE patients, compared to healthy, AAV, and BD patients (Extended Data Figure 7b), reinforcing the concept that while some diseases are associated with broad abnormalities of the BCR repertoire, others are comparatively normal.
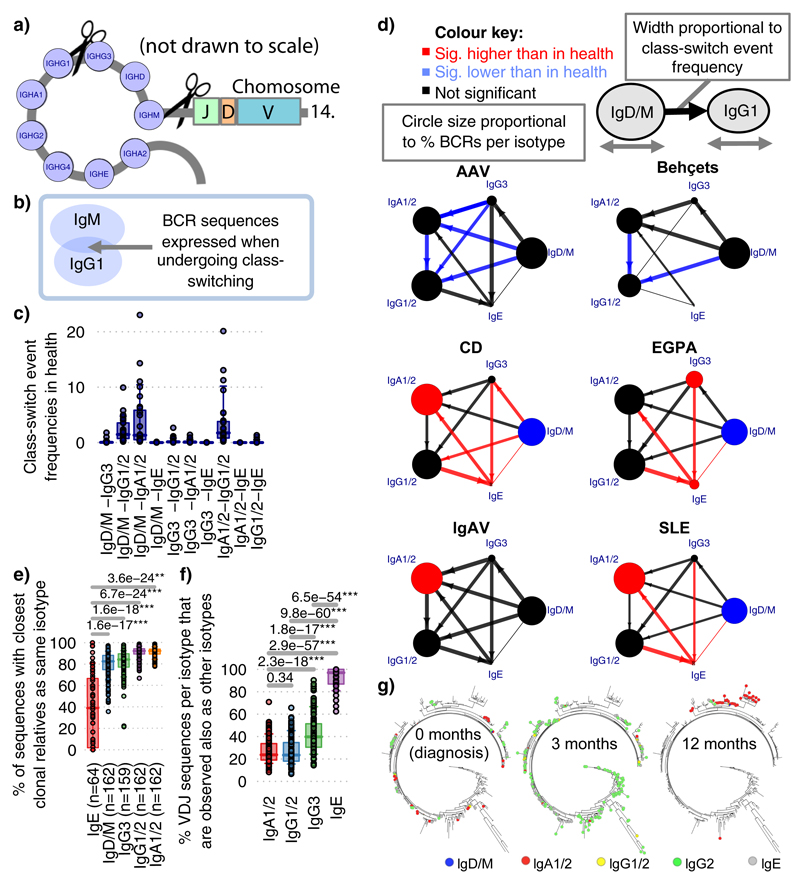
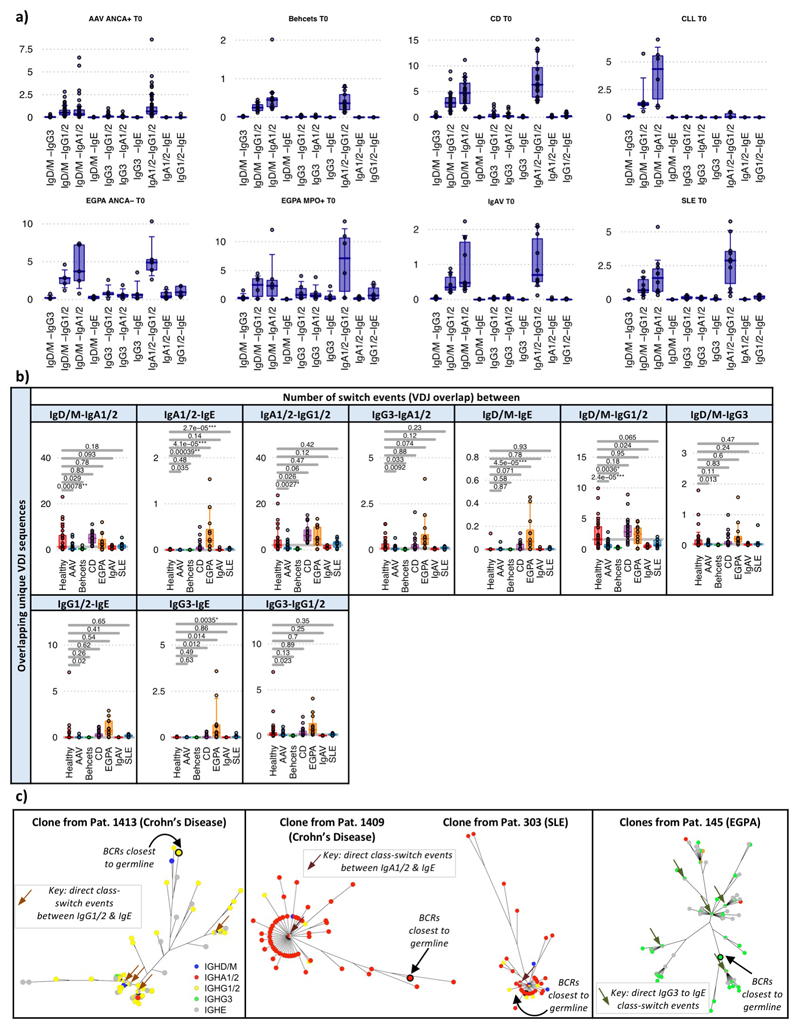
Class-switch recombination (CSR) is a deletional DNA recombination process, so the order of constant regions on the chromosome defines the possible isotypes to which any given B cell can switch (Figure 2a,Extended Data Figure 7c-d). Progression of CSR between each possible constant region (‘switch events’) may be assessed by quantifying the frequency of unique VDJ regions sharing two isotypes (suggesting their common clonal origin; Figure 2b) after normalising for read depth (Extended Data Figure 7e,f). The class-switch types detectable in this analysis are reduced by the isotype ambiguity between IgA1/2 and IgG1/2 in the isotype-specific sequencing, and by alternative splicing of IgD from IgM-containing transcripts (Extended Data Figure 8a-b). We confirmed reported switch event frequencies in healthy individuals16 (Figure 2c). Switching differences between isotypes in IMDs usually corresponded with differences in isotype usage (Figure 2d). All switching was reduced in AAV and BD, and that between IgM and IgG in IgAV. In SLE and CD, increased IgA representation and IgA and IgE switching was seen. The elevated isotype switching in CD appeared independent of isotype frequency. In EGPA increased switching to IgE from all isotypes was striking (Figure 2d), particularly IgG3 - perhaps secondary to increased IgG3 frequency (Extended Data Figure 9a,b). This first systematic analysis of isotype switching in IMD reveals disease-specific increases that contribute to isotype profiles. Some of these, such as the prominence of IgG3/IgE in EGPA, and reduced switching in AAV and BD, were unexpected and may be relevant to disease pathogenesis.
Figure 2. Class-switching in IMDs.
a) Schematic diagram of class-switch recombination (CSR). b) Relative frequencies of CSR between different constant regions may be determined through the frequency of unique VDJ regions expressed as two isotypes normalized for read depth. c) Relative class-switch recombination event frequencies across healthy individuals (n=32). d) CSR frequencies across autoimmune diseases. Each circle represents an isotype class per disease, where the size is proportional to percentage of unique BCRs corresponding to that isotype, coloured according to whether it is significantly higher (red), lower (blue) or not different (black) to healthy individuals. Arrows indicate class-switching between isotypes, where the thickness is proportional to the relative class-switch recombination event frequencies for each disease, colored according to whether these are significantly higher (red), lower (blue) or not different (black) to healthy individuals. P-values calculated by two-sided ANOVA, FDR determined by Šidák method and threshold of significance is FDR<0.05. e) The proportion of VDJ sequences per isotype that are also observed as other isotypes (across health and diseases, n=149). f) The proportion of VDJ sequences where closest clonal relatives are also present as same isotype (across health and diseases, n=149). g) A representative phylogenetic tree of an IgE-associated clone maintained over the course of therapy from an EGPA ANCA-patient (patient 145). Colors indicate isotype usage and time-point for each BCR. All nodes scaled to unitary size. For (c),(e)-(g): Boxplots show the 25th, 50th and 75th percentiles; whiskers show upper and lower quartiles. For (e)-(g): P-values calculated by two-sided Wilcoxon tests for (a)-(c); * denotes FDR <0.05, ** <0.005, *** <0.0005, and FDR determined by Šidák method.
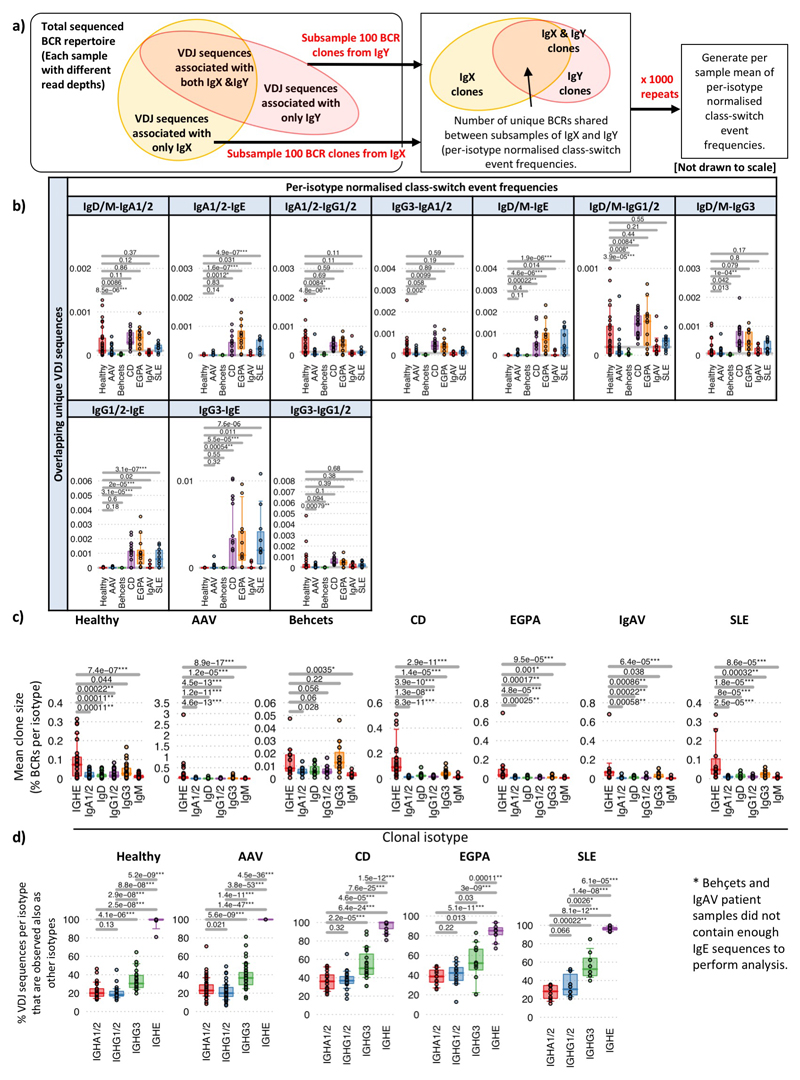
This BCR repertoire analysis supports suggestions in the literature17,18 that, like the mouse19, human IgE clones might usually arise from clonally diversified memory cells of precursor isotypes. Consistent with this IgE+ peripheral blood B cells are commonly plasmablasts (Extended Data Figure 2), are unusually likely to share a clonal origin with non-IgE cells, and have fewer IgE closest clonal relatives (Figure 2e-f,Extended Data Figure 9c,d, Supplementary discussion file 2). IgE also commonly arises from multiple independent switch events in large clones (Figure 2g).
Different immunosuppressive regimens have different impacts on the B cell compartment, and these can correlate with clinical efficacy20. We investigated the effect of treatment on the BCR repertoire in SLE and AAV, taking repeat samples at 3 or 12 months after diagnosis. Most patients were treated with rituximab (RTX, B cell-depleting anti-CD20 monoclonal antibody), or mycophenolate mofetil (MMF, inosine 5’-monophosphate dehydrogenase inhibitor precursor predominantly impacting proliferating cells21). These regimens were standardized but not formally protocolized, reflecting real-world practice based on international guidelines, and were accompanied by similar steroid and subsequent maintenance therapy (Supplementary discussion file 1, Methods), allowing their effect on BCR repertoire to be compared.
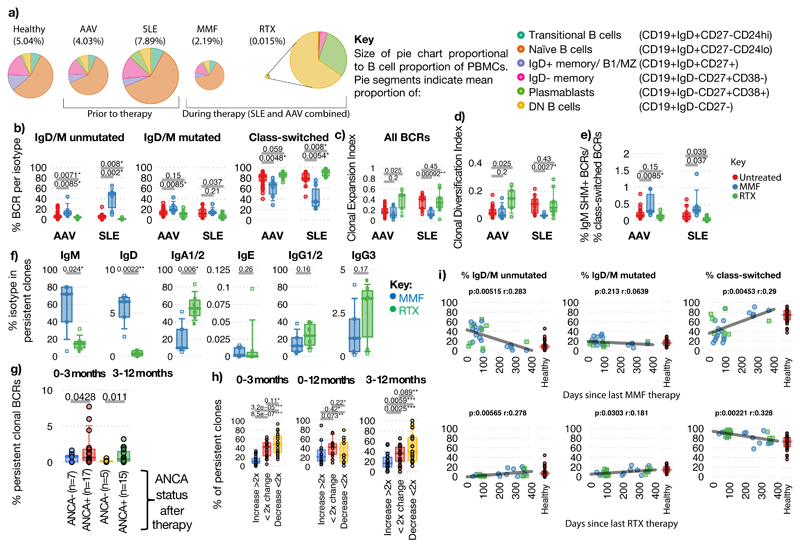
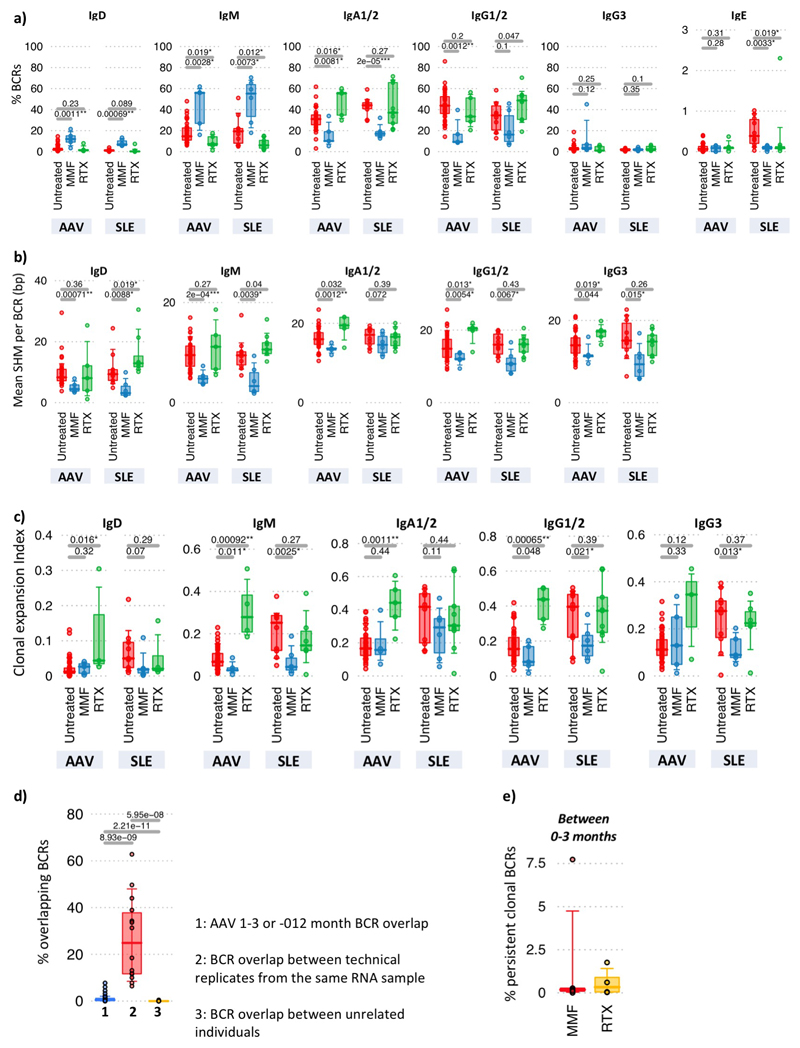
MMF and RTX had markedly different impacts on repertoire (Figure 3a-e, Extended Data Figure 10a-c). MMF therapy resulted in an increased proportion of IgM+/D+ B cells and concomitantly reduced isotype-switched B cell number and clonality, with relative preservation of both SHM+ and SHM- IgM clones compared to switched clones. This could be consistent with a short half-life for switched but not IgM memory B cells in humans (as seen in the mouse22), adding to the ongoing debate on this topic23–24. Conversely, after RTX, circulating B cell numbers were low25 but persisting cells were largely isotype-switched and clonally expanded, predominantly IgA in AAV and IgG1/2 in SLE. Larger studies are required to determine if these repertoire changes associate with disease subsets, pathogenic clonal persistence, and/or treatment efficacy. Nonetheless, this suggests that B cell receptor repertoire impact might inform the design of therapeutic strategies (e.g. the ability of MMF to reduce class-switched clones might suggest efficacy in preventing relapse following RTX therapy).
Figure 3. The impact of therapy on the B cell receptor repertoire.
a) Mean proportion and phenotype distribution of B cells within PBMCs in healthy controls and in AAV and SLE patients before and after therapy (B cell percentage of PBMC in brackets). Data from AAV and SLE patients is combined post-therapy. b-d) Percentages of b) unmutated IgD/IgM, mutated IgD/IgM and antigen-experienced switched BCRs (IgA1/2/IgG1/2/IgG3/IgE), c) Clonal expansion, d) Clonal Diversification Indices, and e) ratio of the percentage of IgM+SHM+ BCRs over class-switched BCRs of AAV and SLE patient samples at diagnosis (red, untreated), and patients 3-months post-treatment with MMF (blue) or RTX (green). For AAV: Untreated (n=42), MMF (n=5), RTX (n=5), and for SLE: Untreated (n=11), MMF (n=6), RTX (n=9). f) Isotype percentages of persistent clones between diagnosis and post-induction therapy in AAV patients: MMF (n=5) and RTX (n=6). g) Percentages of persistent BCRs shared between diagnosis and 3-months, or between 3- and 12-months post-induction therapy respectively, split between patients who became serum ANCA-negative after induction versus those who remain serum ANCA positive. h) Percentages of persistent clones expanded by >2 fold, changed <2-fold or decreased by >2-fold between diagnosis and post-induction therapy in AAV patients (n=12, 20 and 19 for 0-3-months, 0-12-months and 3-12-months respectively. i) Correlation between proportions of BCR types with time since last treatment of (top) MMF (n=27), and (bottom) RTX (n=26). Pearson's correlation p-values indicated. Healthy individual BCR frequencies in red. For (b)-(h): P-values calculated by two-sided ANOVA, * denotes FDR <0.05, **<0.005, ***<0.0005, FDR determined by Šidák method. Boxplots show the 25th, 50th and 75th percentiles; whiskers show extent of outliers.
Clonal persistence 3 months after therapy was observed in >90% patients, with the isotype of persistent clones differing between therapies (Figures 3f, Extended Data Figure 10d-e, Methods). In AAV, reduced persistence of isotype-switched clones was associated with reduced ANCA titre (Figure 3g). Persistent clones could expand, undergo SHM and isotype switch despite continuing therapy (Figure 3h). By considering the time between the last MMF or RTX dose and sample collection, we could analyse repertoire “recovery”. After MMF, the isotype-switched population reached healthy levels after approximately one year (Figure 3i). In contrast, the slow reconstitution of IgD+/M+ unmutated cells after RTX is consistent with the known kinetics of B cell recovery after such depletion26.
This study reveals profound variation in many aspects of the BCR repertoire across IMDs, both at diagnosis and after therapy. Many of the disease-associated changes in isotype use, in particular, have not been previously described. The B cell receptor repertoire changes in these diseases illustrate deficiencies in our understanding of disease pathogenesis (Supplementary discussion file 2). SLE, CD and EGPA exhibited abnormal isotype-specific clonal expansion/diversity and IGHV gene use, such broad repertoire dysregulation being consistent with their associations with multiple antibodies. Increased IgA was expected in an intestinal disease like CD, but not in SLE where IgG is implicated in pathogenesis and intestinal inflammation is not prominent27. These observations suggests unanticipated commonality in pathogenesis of SLE, CD and EGPA, suggesting they might share unknown drivers, perhaps within the mucosal microbiome given known IGHV affinities for microbial antigens11–13,28. EGPA also displayed IgG3 expansion and disproportionate switching to IgE. The IgE association was expected29, but whether expanded IgG3 is important to EGPA pathogenesis remains uncertain. IgAV associated with increased IgA and mucosal involvement, but showed no evidence of IgA clonal expansion or abnormal IGHV gene usage, consistent with distinct pathogenesis from CD. It is also possible to have severe active autoimmune disease, such as AAV, without detectable B cell receptor repertoire changes – the pathogenic anti-MPO or anti-PR3 clones presumably being too infrequent to skew PBMC-level repertoire analysis. Finally BD shows a marked increase in IGHV1-46, IGHV1-69 and IGHV1-3, all of which bind to both microbial antigens and autoantigens (Table S4), enhancing speculation that infection might drive disease30. Future expanded repertoire studies with, for example, comparison to the microbiome or determination of the antigenic specificity of expanded clones, would be illuminating. Altogether, this comprehensive analysis of the B cell receptor repertoire across diseases reveals a complex architecture, which may provide a platform for better understanding pathological mechanisms and designing treatment strategies.
Materials and methods
Ethical approval
Ethical approval for this study was obtained from the Cambridge Local Research Ethics Committee (reference numbers 04/023, 08/H0306/21, 08/H0308/176) and Eastern NHS Multi Research Ethics Committee (07/MRE05/44), with informed consent obtained from all subjects enrolled.
Samples
Healthy participants
Inclusion criteria for healthy individuals were people aged between 20-77 years, with no serious co-morbidities, no direct family history of autoimmune disease, no use of immunosuppressants or steroids, and no hospitalization within the last 12 months. The healthy individual samples used for B cell sorting were recruited through the NIHR Cambridge BioResource.
Patients with AAV
AAV patients attending or referred to the specialist vasculitis unit at Addenbrooke’s Hospital, Cambridge, UK, between July 2004 and June 2016 were enrolled. Active disease at presentation was defined by at least 1 major or 3 minor Birmingham Vasculitis Activity Score (BVAS) criteria31 and the clinical impression that induction immunosuppression would be required. Prospective disease monitoring was undertaken monthly with serial BVAS assessment31 and serum ANCA status (Supplementary discussion file 1). 41/54 patients were sampled at diagnosis and 13/54 patients at disease flare as defined above. A minority of patients (11/54) had received prior treatment with oral prednisolone, and 3 patients had received Azathioprine within 6 months prior to sampling. Patients on low dose steroids and azathioprine have been analysed separately, and their inclusion does not impact upon any of the findings described in this study.
Patients with SLE
The SLE cohort comprised patients attending or referred to the Addenbrooke’s Hospital specialist vasculitis unit between July 2004 and June 2016 who met at least four American College of Rheumatology SLE criteria32, presenting with active disease. Active disease was defined as meeting all three of the following prospectively defined criteria: new British Isles Lupus Assessment Group (BILAG) score A or B in any system, clinical assessment of active disease by the reviewing physician and increase in immunosuppressive therapy as a result. After treatment with an immunosuppressant, patients were followed up monthly. Disease monitoring was undertaken with serial BILAG assessment and serum ANA status. Patients’ treatment was at the physician’s discretion, not dictated by study participation and includes therapy used for induction of remission at enrolment (‘induction’). 8/10 patients were sampled at diagnosis and 2/10 patients at disease flare. A minority of patients (3/10) had received prior treatment with oral prednisolone and/or hydroxychloroquine.
Patients with CD
Patients with active Crohn’s disease were recruited from a specialist IBD clinic at Addenbrooke’s Hospital, before starting treatment. 22/23 patients were recruited at the time of diagnosis. Diagnosis was made using standard endoscopic, histological and radiological criteria33. All patients had at least moderately active Crohn’s disease at enrolment as evidenced by clinical symptoms in conjunction with some or all of elevated C-reactive protein, elevated fecal calprotectin, radiologically active disease or endoscopically active disease. All patients were treatment naïve, with none receiving immunomodulators, corticosteroids or biological therapy.
Patients with CLL
Patients with CLL were recruited from the specialist leukemia/lymphoma unit at Addenbrooke’s Hospital unit between January 2011 and July 2014. CLL patient inclusion required the presence of at least 5×10⁹ B cells/L circulating clonal B cells persisting for 3 months and a characteristic phenotype (typically CD5, CD19, CD20, and CD23).
Patients with EGPA
EGPA patients attending or referred to the specialist vasculitis unit at Addenbrooke’s Hospital, Cambridge, UK, between July 2004 and June 2016 were enrolled into the present study. EGPA diagnosis was based on the history or presence of both asthma and eosinophilia (>1.0 x 10⁹/L and/or > 10% of leukocytes) plus at least two additional features of EGPA, criteria used in the recent Phase III clinical trial “Study to Investigate Mepolizumab in the Treatment of Eosinophilic Granulomatosis with Polyangiitis”. 7/11 patients were sampled at diagnosis and 4/11 patients at disease flare. A minority of patients (4/11) had received prior treatment with oral steroids (methylprednisolone or prednisolone), 2/11 patients treated with azathioprine and 1/11 patients treated with cyclophosphamide within 6 months of sampling.
Patients with IgAV and Behçet’s Disease
IgAV patients and Behçet’s disease patients were recruited from the specialist vasculitis clinic at Addenbrooke’s Hospital were enrolled into the present study between 2005 and 2015. Clinical data recorded for Behçets disease patients comprised: (i) Basis for diagnosis i.e. orogenital mucosal ulceration, prior ocular inflammation, and characteristic skin rash (erythema nodosum or pseudofolliculitis); (ii) Major complications such as venous or arterial thrombosis, central nervous system involvement or involvement of the pulmonary vascular system; and (iii) disease activity (expert physician global assessment). 5/11 of patients had received prior treatment with oral steroids (prednisolone) and 3/11 patients had been treated with azathioprine within 6 months prior to sampling.
The diagnosis of IgAV was based on the American College of Rheumatology 1990 criteria for the classification of Henoch-Schönlein purpura34 and the 2012 Revised International Chapel Hill Consensus Conference Nomenclature of Vasculitides35. All patients had to have a biopsy-proven diagnosis of IgAV. Patient inclusion was based on if they had i) severe involvement of at least 1 organ (including biopsy-proven IgAV-related nephritis class 3–4; gastrointestinal involvement with haemorrhage, ischemia, perforation, and/or abdominal pain unresponsive to common analgesics and lasting for >24 hours; pulmonary haemorrhage, episcleritis, cardiac and central nervous system involvement); and ii) other systemic autoimmune or neoplastic diseases were excluded. 8/10 IgAV patients were sampled at diagnosis and 2/10 patients at disease flare. 4/10 of patients had received prior treatment with oral prednisolone, 1/10 patients treated with azathioprine and 1/10 patients treated with cyclophosphamide within 6 months of sampling.
Cell separation, RNA extraction and antibody titres
For PBMCs and CD19+ B cells: PBMCs were isolated from 110 ml of whole blood by centrifugation over Ficoll. CD19+ B cells were isolated by positive selection using magnetic beads as previously described36. Total RNA was extracted from each sample using an RNeasy mini kit (Qiagen) with quality assessed using an Agilent BioAnalyser 2100 and RNA quantification performed using a NanoDrop ND-1000 spectrophotometer.
For flow-sorted B cell samples from Espéli et al.37: Flow sorting was performed using CD19-BV785, CD38-BV711, CD3-NC650, CD14-605NC, CD24-PerCP-Cy5.5, IgD-FITC. CD27-PE-Cy7 and Aqua (Invitrogen) (flow protocol outlined in Extended Data Figure 1), into sorting buffer (10mM Tris pH 8.0 and RiboLock RNase Inhibitor (1U/μL)) and frozen immediately.
Total IgA and IgE levels in patient serum were measured using a ProcartaPlex immunoassay kit (ThermoFisher) using 25ul of serum from each individual and run on a Luminex xMAP analyser. Raw data (MFI) were normalised to a concurrently measured 7 point standard curve according to the manufacturer’s instructions to return an absolute quantification (pg/ml). All measured values were encompassed by the standard distribution.
Reverse transcription and amplification with barcoded primers
Reverse transcription (RT) was performed in a 23uL reaction: 14ul of RT mix 1 (containing RNA template, 10uM reverse primer mix, 1 μL dNTP (10mM), and nuclease-free water) was incubated for 5 min at 70°C. This mixture was immediately transferred to ice for 1 min, and the RT mix 2 (4 μL 5x FS buffer, 1 μL DTT (0.1M), 1 μL SuperScript®III (Thermo Fisher)) was added and incubated at 50°C for 60 min followed by 15 min inactivation at 70°C. cDNA was cleaned with Agencourt AMPure XP beads and PCR amplified with V-gene multiplex primer mix (10μM each forward primer) and 3’ universal reverse primer (10μM) using KAPA protocol and the thermal cycling conditions: 1 cycle (95°C - 5 min); 5 cycles (98°C - 5 sec; 72°C - 2 min); 5 cycles (65°C - 10 sec, 72°C - 2 min); 25 cycles (98°C - 20sec, 60°C - 1 min, 72°C - 2 min); 1 step (72°C - 10 min). Primers are provided in STAR Methods.
Sequencing and barcode filtering
Sequencing libraries were prepared using Illumina protocols and sequenced using 300bp paired-ended sequencing on a MiSeq (Illumina). Raw reads were filtered for base quality (median Phred score >32) using QUASR (http://sourceforge.net/projects/quasr/)38. Forward and reverse reads were merged if they contained identical overlapping region of >50bp, or otherwise discarded. Universal barcoded regions were identified in reads and orientated to read from V-primer to constant region primer. The barcoded region within each primer was identified and checked for conserved bases. Primers and constant regions were trimmed from each sequence, and sequences were retained only if there was >80% per base sequence similarity between all sequences obtained with the same barcode, otherwise discarded. The constant region allele with highest sequence similarity was identified by 10-mer matching to the reference constant region genes from the IMGT database39, and sequences were trimmed to give only the region of the sequence corresponding to the variable (VDJ) regions. Isotype usage information for each BCR was retained throughout the analysis hereafter. Sequences without complete reading frames and non-immunoglobulin sequences were removed and only reads with significant similarity to reference IGHV and J genes from the IMGT database using BLAST40 were retained. Ig gene usages and sequence annotation were performed in IMGT V-QUEST, where repertoire differences were performed by custom scripts in Python.
Accounting for age in BCR analysis
Age-related BCR repertoire differences have been previously described, and this could be important as immune-mediated diseases often have different ages of onset. We confirmed this in both healthy controls and disease by incorporating age as a covariate in repertoire analyses, as in previous studies41–43.
As expected correction for age usually made little difference (Extended Data Figure 4a). Where statistical discordance between uncorrected and corrected data did occur, the latter became not significant, indicating this correction is appropriately conservative (i.e. correction does not create spurious statistically significant positive associations). In these and most other cases, predominantly in diseases of later onset (AAV, EGPA), age correction made p values less significant, indicating some observed repertoire differences are driven in part by age, and underlining the importance of correcting for it (Extended Data Figure 3a-d). In some cases, already significant results became more so after correction – as expected many of these were in SLE or CD, diseases with a younger age of onset (Extended Data Figure 3c).
Isotype frequencies, somatic hypermutation, CDR3 lengths and IGHV gene usages
To account for the greater numbers of BCR RNA molecules per plasmablast compared to other B cell subsets, we calculated two measures of isotype usage: (1) the percentage of reads per isotype which does not control for differential RNA per cell, thus reflecting the impact of plasmablasts/plasma cells on repertoire, and (2) the normalized isotype usages, defined as the percentage unique VDJ sequences per isotype, thus controlling for differential RNA per cell and reducing potential biases from differential RNA per cell. We did not control for ethnicity as the majority of patients (95%) in all disease groups were of northern European ancestry, with the exception of SLE in which 4 patients were Asian and 5 were Caucasian. We observed only two IGHV genes with differential frequencies between ethnicities with FDR <0.05 (Table S6), and neither of these were differentially expressed between SLE and health.
Similarly, mean somatic hypermutation levels and CDR3 lengths were calculated per unique VDJ region sequence to reduce potential biases from differential RNA per cell. IGHV gene usages were determined using IMGT44, and proportions were calculated per unique VDJ region sequence. The representation of IGHV genes in the BCR repertoire reflects their presence in the germline, the naïve repertoire and their expansion after antigenic exposure. We therefore compared the frequency of IGHV gene use in PBMC-derived BCRs identified by sequence as being enriched for naive (IgM+D+SHM-: >78% naïve B cells by flow cytometry) and antigen-experienced B cells (including both unswitched (IgM+D+SHM+) and class-switched memory (IgA+/G+/E+) subsets).
BCR repertoire generation and network analysis
The network generation algorithm and network properties were calculated as in Bashford-Rogers et al.15: each vertex represents a unique sequence, where relative vertex size is proportional to the number of identical reads. Edges join vertices that differ by single nucleotide non-indel differences and clusters are collections of related, connected vertices. A clone (cluster) refers to a group of clonally related B cells, each containing BCRs with identical CDR3 regions and IGHV gene usage, or differing by single point mutations, such as through SHM. Each cluster is assumed to arise from the same pre-B cell.
Repertoire parameters that were dependent on sequencing depth were generated by subsampling each sequencing sample to a specified depth:
-
1)
The Clonal Expansion index is a measure of “unevenness” of the number of RNA molecules per unique VDJ region sequence by vertex Gini Index as defined in Bashford-Rogers et al.15. This is calculated from the distribution of the number of unique RNA molecules per vertex within subsampled BCR repertoires at specified depth defined below. The mean of 100 repeats of resulting Clonal Expansion indices was determined.
-
2)
The Clonal Diversification index is a measure of the unevenness of unique VDJ region sequences per clone by cluster Renyi Index as defined in Bashford-Rogers et al.15. This is calculated from the distribution of the number of unique VDJ region sequences per clone within subsampled BCR repertoires at specified depth defined below. The mean of 100 repeats of resulting Clonal Diversification indices was determined. Clone size distributions were also calculated from the same subsamples and a mean of 100 repeats was determined.
The number of sampled unique RNA molecules (for the Clonal Expansion index) and clones (for the Clonal Diversification index) per sample was: all isotypes: 3500, Ig/M mutated: 600, Ig/M unmutated: 500, Class-switched: 1000, IgA1/2: 1000, IgD: 75, IgE: 50, IgG1/2: 500, IgG3: 100, IgM: 750. These thresholds were chosen as a balance between including as many samples as possible per analysis whilst remaining as representative of the total BCR repertoire in each sample.
BCR network sampling to preserve the overall clonal structure of visual representation
We developed network sampling methods to obtain a graphical representation of a network that preserves the overall clonal architecture. The rationale for this development, and for the selection of the Clone Sampling method, is discussed in detail in Supplementary discussion file 4. Briefly, a fixed number of clones were subsampled, and a network generated from all BCRs from these clones from a given sample. Subsampling was performed 1000 times, and the sample that contained a maximum clone size closest to the median of all subsamples was chosen to generate a visual representation of the BCR repertoire.
Global measure of BCR repertoire
To define a global measure of the “normality” or otherwise of the BCR repertoire, we combined three main BCR features (isotype frequency, clonal expansion index, clonal diversification index) using a multivariate MANOVA comparison between disease groups using age as a covariate.
Class-switching event analyses
Relative class-switch event frequency was the frequency of unique VDJ regions expressed as two isotypes (i.e. from more than one B cell, where one has undergone class-switch recombination). This was determined as proportion of unique BCRs present as both isotypes IgX and IgY within a random subsample of 8000 BCRs, where the mean of 1000 repeats was generated (Extended Data Figure 7e). This provides information on the frequency of BCRs observed associated with any two isotypes (class-switching events) while accounting for total read depth, but not accounting for differences in the relative frequencies of BCRs per isotype.
The per-isotype normalized class-switch event frequencies determines frequency of unique VDJ regions expressed as two isotypes whilst normalizing for differences in isotype frequencies. To account for differences in isotype proportions, BCRs from each isotype were randomly subsampled to a fixed depth of 100 BCRs, and the proportion of unique VDJ sequences present between each pair of isotypes was counted (Extended Data Figure 9a). The mean of 1000 repeats was generated.
Clonal overlap between time points during therapy
The identification of perisistent clones was performed using MRDARCY45. Clonal overlap frequencies between samples, including the quantification of persistent clones, was determined through subsampling each repertoire to a fixed depth of 2000 unique BCRs and determining the proportion of overlapping clones. The mean of 1000 repeats was generated.
Although quantitative conclusions are difficult as a blood draw samples such a small proportion of peripheral B cells, the clonal overlap estimate between timepoints is, as expected, significantly lower than that from technical BCR sequencing repeats from the same RNA samples and higher than the overlap between unrelated patient samples (Extended Data Figure 10d).
Phylogenetic analysis
Phylogenetic trees from AAV and EGPA patients were derived from all clusters containing at least one BCR sequence across multiple time points using the MRDARCY pipeline46. Alignments were performed using Mafft47 and maximum parsimony trees fitted using Paup*48. The IGHV gene amino acid similarity tree was generated using an alignment of reference IGHV genes from IMGT using Mafft47 and a maximum parsimony tree was fitted using Paup*48.
Statistical methods
Statistical differences between disease groups were performed using ANOVA or MANOVA with patient age as a covariate and correcting for multiple testing by Bonferroni correction. Where patients were age-matched, Wilcoxon tests were performed.
Extended Data
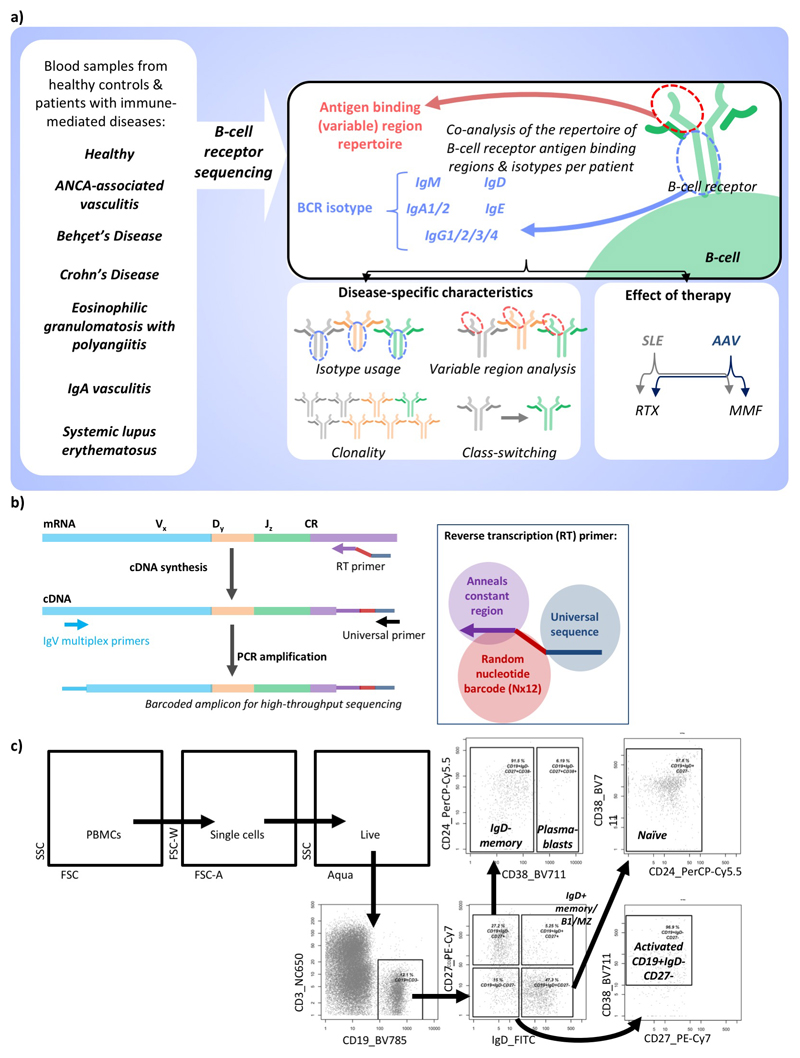
Extended Data Figure 1. Overview of BCR repertoire strategy.
a) Schematic diagram of the B cell receptor repertoire analysis strategy. b) Schematic diagram of the B cell receptor sequencing strategy. In the reverse transcription (RT) step, the primer anneals to the constant region of the B cell receptor mRNA to generate cDNA with a random 12 nucleotide barcode. This barcode can be computationally used to reduce PCR amplification biases after sequencing. The product is cleaned and PCR amplified using multiple primers binding to the FR1 region of the IgH genes along with a universal sequence complementary to the end of the RT primer. c) Gating strategy to flow sort B cell subsets from healthy donor PBMCs.
Extended Data Figure 2. Impact of B cell subset and age on repertoire.
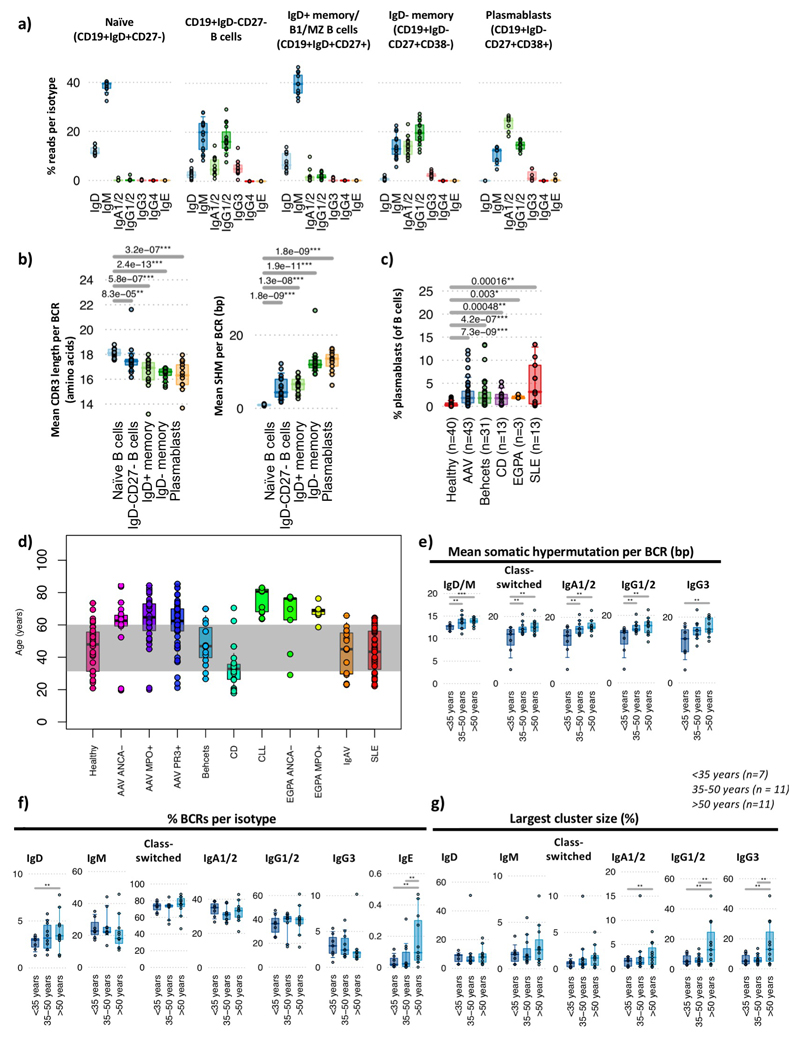
a) The isotype usage frequencies from BCR sequencing data from sorted naïve B cells (CD19+IgD+CD27-), CD19+CD27-IgD- B cells, IgD+ memory/B1/MZ B cells (CD19+CD27+IgD+) and IgD- memory B cells (CD19+CD27+IgD-CD38-) and plasmablasts (CD19+CD27+IgD-CD38+) from 19 healthy individuals. b) (left) The mean CDR3 lengths and (right) mean SHM per BCR from healthy individual cell-sorted B cell populations (n=19). c) The plasmablast frequency per patient in peripheral blood at enrolment as a percentage of CD19+ B cells. d) Distribution of patient ages within this study, grouped by disease. e-g) PBMC BCR repertoire correlations with age in healthy individuals for g) the mean number of somatic hypermutation per BCR per bp, f) the percentages of BCRs per isotype; g) percentage sizes of the largest cluster per sample. For b-c: P-values calculated by two-sided by ANOVA and * denotes FDR <0.05, ** <0.005, *** <0.0005, where FDR determined by Šidák method. For e-g: P-values calculated by two-sided by Wilcoxon test. * denotes p-values <0.05, ** <0.005, *** <0.0005, NS otherwise, with raw p-values provided in Table S4. Boxplots show the 25th, 50th and 75th percentiles; whiskers show upper and lower quartiles.
Extended Data Figure 3. Repertoire changes with age and isotpe usages with disease.
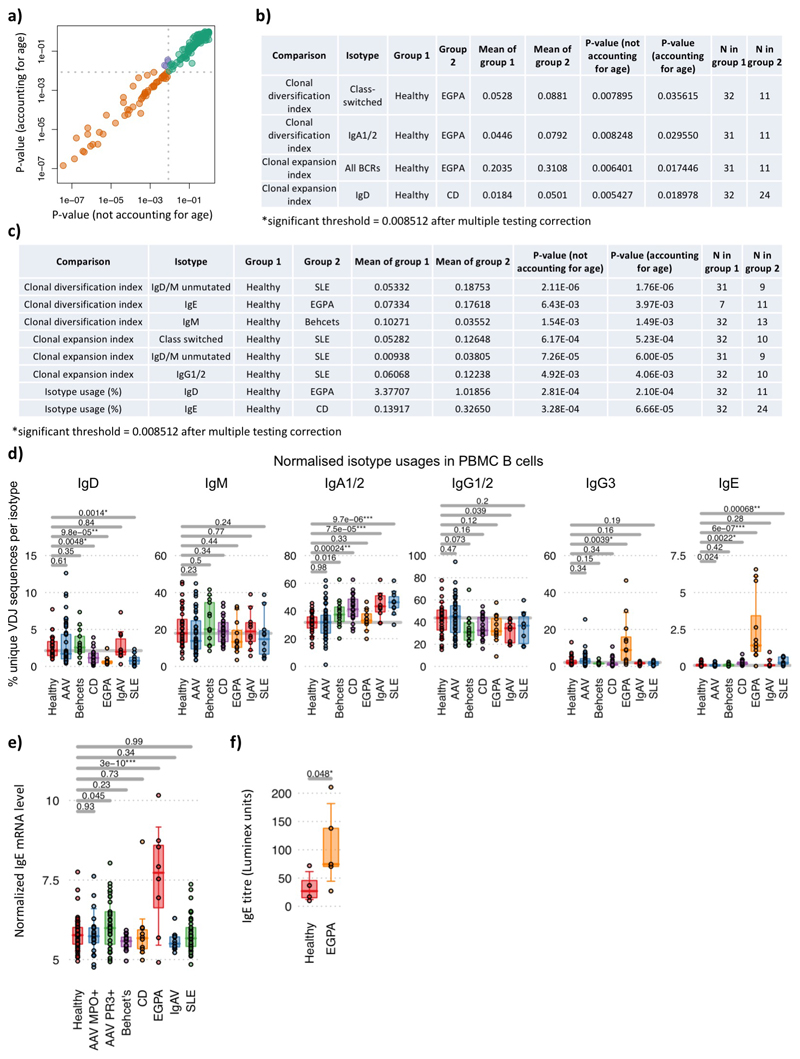
a) Correlation of p-values obtained using age as a covariate versus excluding age in the analysis across 178 BCR features (calculated by two-sided by ANOVA), and b) analyses where statistical significance was discordant (i.e. below significance threshold without accounting for age and above significance threshold while using age as a covariate, or vice versa, purple points from (a)). c) Analyses where statistically significant p-values were decreased by >1.5 fold after using age as a covariate. Grey dotted lines in (a) indicate the threshold of significance after account for multiple testing (FDR<0.05, determined by Šidák method). d) The percentages of normalized isotype usages (unique VDJ sequences per isotype) for PBMC BCR repertoires per disease. e) Normalized IgE immunoglobulin constant region transcript levels between disease groups from transcriptomic data. n=58, 23, 33, 13, 10, 8, 11 and 37 for healthy, AAV MP0+, AAV PR3+, Behçhet’s, CD, EGPA, IgAV and SLE patients respectively. f) IgE titre between healthy individuals (n=4) and EGPA patients (n=5). P-values calculated by two-sided by ANOVA for (d)-(e) and * denotes FDR <0.05, ** <0.005, *** <0.0005, where FDR determined by Šidák method. Boxplots show the 25th, 50th and 75th percentiles; whiskers show upper and lower quartiles.
Extended Data Figure 4. Changes in IGHV gene usage with disease.
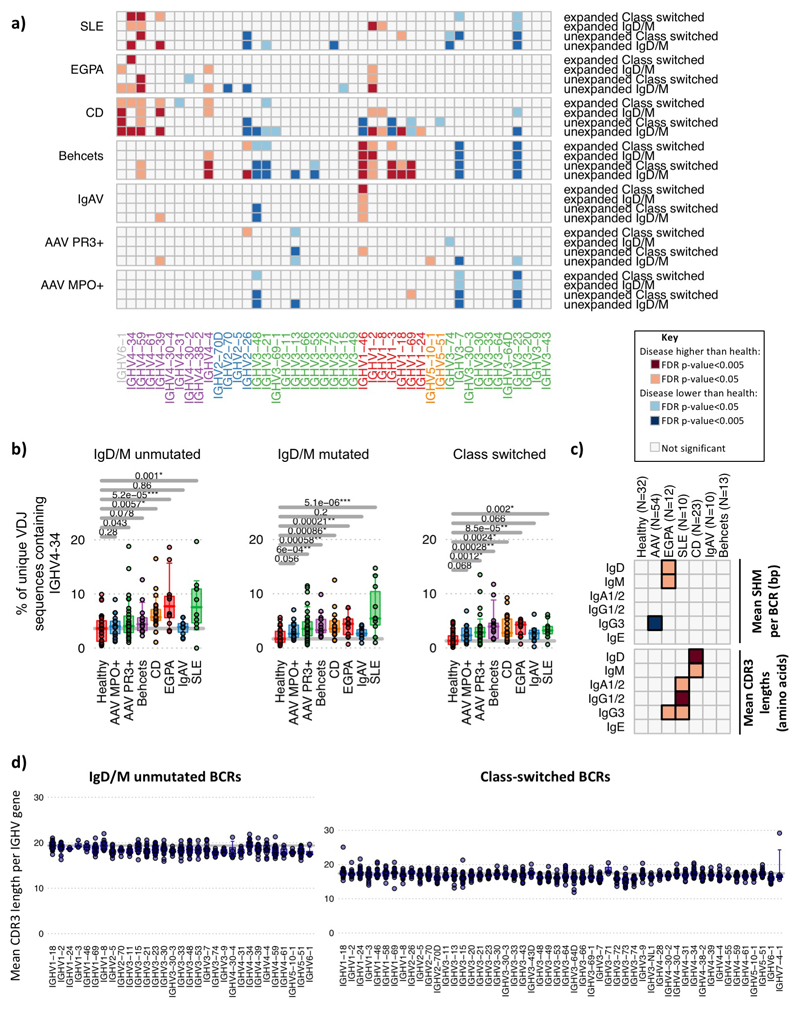
Changes in IGHV gene usage between unexpanded and expanded clones. a) Heatmap of each IGHV gene frequency difference between healthy individuals and each autoimmune disease patient group within BCRs from IgM+D+ or isotype-switched (IgA/IgG/E) BCR from unexpanded clones (clontaining <3 unique BCRs) or expanded clones (3 or more unique BCRs per clone). Only genes >0.1% in frequency are shown. IGHV genes are ordered according to amino acid similarity as in Figure 2. b) IGHV4-34 BCR frequencies with autoreactive AVY & NHS motifs compared between healthy individuals and disease groups, separated by BCR type: IgM+D+SHM- BCR sequences, IgM+D+SHM+ BCR sequences and IgM-D- BCR sequences (defined in (a)). c) Heatmaps showing the (top) mean SHM per BCR and (bottom) relative mean CDR3 lengths mean SHM per BCR per isotype per disease from total PBMC B cells. d) The distribution of the mean CDR3 lengths per IGHV gene in healthy individuals (n=32). Each point represents a mean CDR3 length for an individual for (left) unmutated IgD/M BCRs and (right) class-switched BCRs. Instances where IGHV genes represented by fewer than 10 BCRs in an individual are excluded. For (a)-(d): n=32, 18, 32, 12, 10, 23, 10 and 13 for healthy, AAV MP0+, AAV PR3+, EGPA, SLE, CD IgAV and Behçet’s patients respectively. P-values calculated by two-sided ANOVA. Orange squares indicate significantly higher, and blue squares significantly lower, corresponding gene frequency between healthy individuals and disease. FDR determined by Šidák method.
Extended Data Figure 5. Network subsampling methods for preserving repertoire structure.
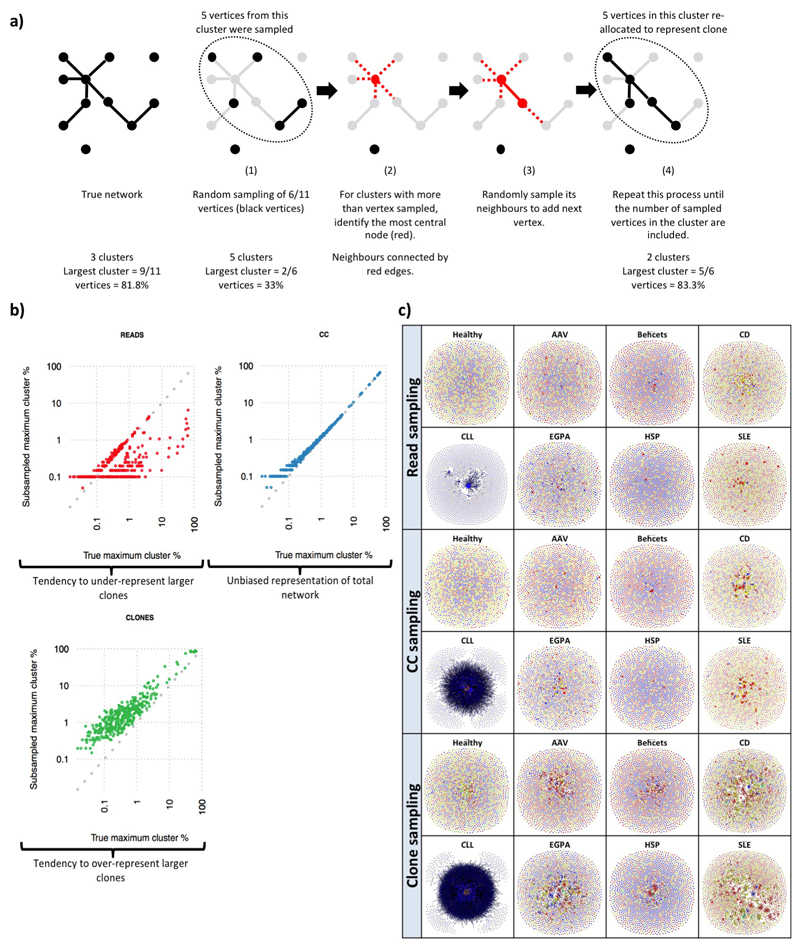
a) Schematic diagram of the cluster-vertex migration in the CC algorithm. b) Maximum cluster sizes between true (unsampled) networks and sub-sampled networks of 2000 clones by the tree subsampling methods. c) Comparison of representative networks from each patient group at diagnosis. The sample patient samples are represented across the three sampling methods. Each vertex represents a unique sequence, where relative vertex size is proportional to the number of identical reads. Edges join vertices that differ by single nucleotide non-indel differences and clusters are collections of related, connected vertices. Networks are comprised of a subsample of 2000 clones using the corresponding subsampling method. Each vertex is represented by a pie chart indicating the percentage of each isotype, where blue = IgD/M, red = IgA1/2, yellow = IgG1/2, green = IgG3, and grey = IgE.
Extended Data Figure 6. BCR repertoire clonality between diseases.
a) Boxplots of the Clonal Expansion Index and b) the Clonal Diversification Index for PBMC BCR repertoires per disease. c) Plots of the percentage of clones per sample per disease greater than clone size, C. Clone size is defined as the number of unique VDJ sequences that are clonally related. For each disease, the mean percentage is indicated by the dark blue line, and the upper and lower interquartile ranges indicated by the light blue areas. Overlaid in grey is the equivalent for healthy individuals. Differences in read depth were accounted for by subsampling 5000 clones from each repertoire and determining a mean of 20 repeats. As a disease comparison, we show the distribution for CLL. d) Boxplots of the percentage of clones larger than 10, 20, 30, 40, or 50 unique VDJs per disease. Differences in reads depth were accounted for by performing subsamples 5000 clones and determining a mean of 20 repeats. For (a),(b),(d): P-values calculated by two-sided by ANOVA for (a),(b),(d). * denotes FDR <0.05, ** <0.005, *** <0.0005, and FDR determined by Šidák method. n=32, 18, 32, 12, 10, 23, 10 and 13 for healthy, AAV MP0+, AAV PR3+, EGPA, SLE, CD IgAV and Behçet’s patients respectively. Boxplots show the 25th, 50th and 75th percentiles; whiskers show upper and lower quartiles.
Extended Data Figure 7. BCR repertoire similarity between diseases and class-switch recombination estimation.
a) The maximum clone sizes (as a percentage of unique VDJ sequences of a given isotype in largest clone divided by the total of unique BCRs of that isotype) for PBMC BCR repertoires per disease across isotypes. b) Global repertoire dissimilarity measures between disease groups. Heatmap showing the global repertoire dissimilarity measures between disease groups based on the combination of three main BCR features (isotype frequency, clonal expansion index, clonal diversification index) and determining joint differences between groups (MANOVA test using disease group and age as covariables). The light and dark orange squares indicate significant differences between corresponding disease groups (false discovery rate (FDR) < 0.05 and 0.005 respectively, where FDR determined by Šidák method. n=32, 18, 32, 12, 10, 23, 10 and 13 for healthy, AAV MP0+, AAV PR3+, EGPA, SLE, CD IgAV and Behçet’s patients respectively. c) The sequence of B cell isotype expression is defined by the order of constant regions on the chromosome, where the possible class-switching is depicted by the arrows between constant regions. d) Schematic diagram of class-switch types detectable from the sequencing data due to the ambiguity of isotype between IgA1/2 and IgG1/2 in the isotype-specific sequencing and splicing of IgD from IgM-containing transcripts. Possible class-switching events are represented by the arrows between constant regions. e) Multiple unique RNA sequences with identical antigen binding regions (V-D-J) but different constant regions represent instances of class switching. f) Schematic diagram of sub-sampling of BCR repertoires to generate the relative class-switch event frequency. This is the frequency of unique VDJ regions expressed as two isotypes (i.e. from more than one B cell, where one has undergone CSR), and determined as proportion of unique BCRs present as both isotypes IgX and IgY within a random subsample of 8000 BCRs, where the mean of 1000 repeats was generated. This provides information on the frequency of BCRs observed associated with any two isotypes (class-switching events) while accounting for total read depth, but not accounting for differences in the relative frequencies of BCRs per isotype. For (a): n=32, 18, 32, 12, 10, 23, 10 and 13 for healthy, AAV MP0+, AAV PR3+, EGPA, SLE, CD IgAV and Behçet’s patients respectively. P-values calculated by two-sided ANOVA, * denotes FDR <0.05, ** <0.005, *** <0.0005, and FDR determined by Šidák method. Boxplots show the 25th, 50th and 75th percentiles; whiskers show upper and lower quartiles.
Extended Data Figure 8. Class-switch recombination estimation differences between diseases.
a) Boxplots of the proportion of class-switch events between isotypes for each autoimmune disease. Boxplots show the 25th, 50th and 75th percentiles; whiskers show upper and lower quartiles. b) Boxplots of the proportion of class-switch events between autoimmune diseases across isotypes for PBMC BCR repertoires via subsampling total repertoire. P-values calculated by two-sided ANOVA and * denotes FDR <0.05, ** <0.005, *** <0.0005, where FDR was determined by the Šidák method. n=32, 18, 32, 12, 10, 23, 10 and 13 for healthy, AAV MP0+, AAV PR3+, EGPA, SLE, CD IgAV and Behçet’s patients respectively. Boxplots show the 25th, 50th and 75th percentiles; whiskers show upper and lower quartiles. c) Phylogenetic trees of representative clonal expansions from patients demonstrating class-switch recombination events. Each vertex is a unique BCR sequence and is represented by a pie chart indicating the percentage of each isotype, where blue = IgD/M, red = IgA1/2, yellow = IgG1/2, green = IgG3, and grey = IgE. Branch lengths are estimated by maximum parsimony, and the BCRs with the lowest number of somatic hypermutations are indicated (denoted “BCRs closest to germline”).
Extended Data Figure 9. Normalised class-switch recombination estimation differences between diseases and IgE clonal features.
a) Schematic diagram of sub-sampling of BCR repertoires to generate the per-isotype normalized class-switch event frequencies, defined as the frequency of unique VDJ regions expressed as two isotypes whilst normalizing for differences in isotype frequencies. To account for differences in isotype proportions, BCRs from each isotype were randomly subsampled to a fixed depth of 200 reads, and the proportion of unique VDJ sequences present between each pair of isotypes was counted. The mean of 1000 repeats was generated. b) Boxplots of the proportion of the per-isotype normalized class-switch event frequencies between isotypes for each autoimmune disease. P-values calculated by two-sided by ANOVA and * denotes FDR <0.05, ** <0.005, *** <0.0005, where FDR determined by Šidák method. n=32, 18, 32, 12, 10, 23, 10 and 13 for healthy, AAV MP0+, AAV PR3+, EGPA, SLE, CD IgAV and Behçet’s patients respectively. Boxplots show the 25th, 50th and 75th percentiles; whiskers show upper and lower quartiles. c) Boxplots of the mean cluster sizes per patient per isotype as a percentage of BCRs per isotype, comparing IgE-associated clones with non-IgE-associated clones for each disease. d) The proportion of VDJ sequences per isotype that are observed also as other isotypes for each disease. P-values calculated by two-sided Wilcoxon tests and * denotes FDR <0.05, ** <0.005, *** <0.0005, where FDR determined by Šidák method. n=32, 18, 32, 12, 10, 23, 10 and 13 for healthy, AAV MP0+, AAV PR3+, EGPA, SLE, CD IgAV and Behçet’s patients respectively. Boxplots show the 25th, 50th and 75th percentiles; whiskers show upper and lower quartiles.
Extended Data Figure 10. Impact of therapy on BCR repertoire.
The a) percentages of BCRs per isotype, b) mean SHM pre BCR per isotype, and c) clonal expansion indices of AAV and SLE patient samples taken at diagnosis (red, untreated), and patients post 3-months induction therapies with MMF (blue) or RTX (green). For AAV, the patients per group were: Untreated (n=42), MMF (n=5), RTX (n=5), and for SLE, the patients per group were: Untreated (n=11), MMF (n=6), RTX (n=9). d) The percentage of BCRs shared between diagnosis and 3 or 12 months post-induction therapy AAV samples (blue), BCRs shared between repertoires from the same RNA tube (red), and BCRs shared between samples from unrelated patient samples. Zero overlap was found between unrelated samples, whereas significantly higher overlap between BCRs shared between repertoires from the same RNA tube compared to BCRs shared between diagnosis and 3 or 12 months post-induction therapy AAV samples. This suggests that the overlap measurements yield realistic and normalized values at this sampling depth. e) The percentages of persistent BCRs shared between diagnosis and 3 months post induction therapy, split between patients receiving different therapies. P-values calculated by two-sided Wilcoxon tests. Boxplots show the 25th, 50th and 75th percentiles; whiskers show upper and lower quartiles.
Supplementary Material
Supplementary information is available in the online version of the paper.
Acknowledgements
This work was supported by the Wellcome Trust (grant WT106068AIA and 083650/Z/07/Z), the EU H2020 project SYSCID (grant no. 733100), the UK Medical Research Council (program grant MR/L019027) and the UK National Institute of Health Research (NIHR) Cambridge Biomedical Research Centre. We gratefully acknowledge the patients who participated in this study, and Valerie Morrison, Angela Reynolds, all NIHR Cambridge BioResource staff and volunteers, and the Cambridge NIHR BRC Cell Phenotyping Hub (particularly Anna Petrunkina Harrison, Natalia Savinykh Yarkoni, Esther Perez, Simon McCallum, and Chris Bowman). We thank Federico Alberici, Nuru Noor and other members of the Addenbrooke’s Vasculitis and Gastroenterology services, Norberto Escudero Urquijo for discussions about network subsampling, Plamena Naydenova and Giulia Manferrari. We are grateful to John Todd and David Tarlinton for reviewing the manuscript.
Footnotes
Data access
Sequencing data available from the EGA (accession numbers in Table S3).
Author controbutions R.B.R. and K.G.C.S. planned the study. R.B.R performed BCR amplification, and analysed sequencing data. F.M. analysed clinical data and L.B., D.C.P. and S.M.F. performed immunophenotyping. E.F.N., J.C.L., D.C.T., S.M.F., D.R.W.J, and P.A.L. contributed to sample collection and clinical data generation, and P.K. contributed to sample processing. R.B.R., P.A.L., E.F.N., J.C.L., D.C.T. and K.G.C.S. provided intellectual contributions to analyses. R.B.R. and K.G.C.S. wrote the manuscript. All authors edited manuscript.
Author information Reprints and permissions information is avialable at www.nature.com/reprints. Correspondance and requests for materials should be addressed to RBR (rbr1@well.ox.ac.uk) or KS (kgcs2@medschl.cam.ac.uk). Competing financial interests: Rachael Bashford-Rogers, Paul Kellam and Ken Smith are all named on a patent associated with the methodologies in this paper. Shaun Flint is a current employee of GlaxoSmithKline, and holds shares in GlaxoSmithKline. Rachael Bashford-Rogers is a consultant for Imperial College London and VHSquared. Paul Kellam is an employee and holder of shares in Kymab Ltd. David Jayne is a recipient of a research grant from Roche/Genetech.
References
- 1.Nossal GJV, Lederberg J. Antibody production by single cells. Nature. 1958;181:1419–1420. doi: 10.1038/1811419a0. [DOI] [PubMed] [Google Scholar]
- 2.Lydyard PM, Whelan A, Fanger MW. Instant Notes Series; Instant Notes in Immunology. 2000;i-x:1–318. [Google Scholar]
- 3.Nemazee D. Mechanisms of central tolerance for B cells. Nat Rev Immunol. 2017;17:281–294. doi: 10.1038/nri.2017.19. [DOI] [PMC free article] [PubMed] [Google Scholar]
- 4.Wardemann H, et al. Predominant autoantibody production by early human B cell precursors. Science. 2003;301:1374–1377. doi: 10.1126/science.1086907. [DOI] [PubMed] [Google Scholar]
- 5.Stavnezer J, Schrader CE. IgH chain class switch recombination: mechanism and regulation. J Immunol. 2014;193:5370–5378. doi: 10.4049/jimmunol.1401849. [DOI] [PMC free article] [PubMed] [Google Scholar]
- 6.Stavnezer J, Guikema JE, Schrader CE. Mechanism and regulation of class switch recombination. Annu Rev Immunol. 2008;26:261–292. doi: 10.1146/annurev.immunol.26.021607.090248. [DOI] [PMC free article] [PubMed] [Google Scholar]
- 7.De Silva NS, Klein U. Dynamics of B cells in germinal centres. Nat Rev Immunol. 2015;15:137–148. doi: 10.1038/nri3804. [DOI] [PMC free article] [PubMed] [Google Scholar]
- 8.Giltiay NV, Chappell CP, Clark EA. B-cell selection and the development of autoantibodies. Arthritis Res Ther. 2012;14(Suppl 4):S1. doi: 10.1186/ar3918. [DOI] [PMC free article] [PubMed] [Google Scholar]
- 9.Petrova VN, et al. Combined Influence of B-Cell Receptor Rearrangement and Somatic Hypermutation on B-Cell Class-Switch Fate in Health and in Chronic Lymphocytic Leukemia. Frontiers in Immunology. 2018;9 doi: 10.3389/fimmu.2018.01784. [DOI] [PMC free article] [PubMed] [Google Scholar]
- 10.Matsuda F, et al. The complete nucleotide sequence of the human immunoglobulin heavy chain variable region locus. J Exp Med. 1998;188:2151–2162. doi: 10.1084/jem.188.11.2151. [DOI] [PMC free article] [PubMed] [Google Scholar]
- 11.Pascual V, et al. Nucleotide sequence analysis of the V regions of two IgM cold agglutinins. Evidence that the VH4-21 gene segment is responsible for the major cross-reactive idiotype. J Immunol. 1991;146:4385–4391. [PubMed] [Google Scholar]
- 12.Schickel JN, et al. Self-reactive VH4-34-expressing IgG B cells recognize commensal bacteria. J Exp Med. 2017;214:1991–2003. doi: 10.1084/jem.20160201. [DOI] [PMC free article] [PubMed] [Google Scholar]
- 13.Tipton CM, et al. Diversity, cellular origin and autoreactivity of antibody-secreting cell population expansions in acute systemic lupus erythematosus. Nat Immunol. 2015;16:755–765. doi: 10.1038/ni.3175. [DOI] [PMC free article] [PubMed] [Google Scholar]
- 14.Meffre E, et al. Immunoglobulin heavy chain expression shapes the B cell receptor repertoire in human B cell development. J Clin Invest. 2001;108:879–886. doi: 10.1172/JCI13051. [DOI] [PMC free article] [PubMed] [Google Scholar]
- 15.Bashford-Rogers RJM, et al. Network properties derived from deep sequencing of human B-cell receptor repertoires delineate B-cell populations. Genome Res. 2013;23:1874–1884. doi: 10.1101/gr.154815.113. [DOI] [PMC free article] [PubMed] [Google Scholar]
- 16.Horns F, et al. Lineage tracing of human B cells reveals the in vivo landscape of human antibody class switching. Elife. 2016;5 doi: 10.7554/eLife.16578. [DOI] [PMC free article] [PubMed] [Google Scholar]
- 17.Saunders SP, Ma EGM, Aranda CJ, Curotto de Lafaille MA. Non-classical B Cell Memory of Allergic IgE Responses. Front Immunol. 2019;10:715. doi: 10.3389/fimmu.2019.00715. [DOI] [PMC free article] [PubMed] [Google Scholar]
- 18.Croote D, Darmanis S, Nadeau KC, Quake SR. High-affinity allergen-specific human antibodies cloned from single IgE B cell transcriptomes. Science. 2018;362:1306–1309. doi: 10.1126/science.aau2599. [DOI] [PubMed] [Google Scholar]
- 19.He JS, et al. IgG1 memory B cells keep the memory of IgE responses. Nat Commun. 2017;8:641. doi: 10.1038/s41467-017-00723-0. [DOI] [PMC free article] [PubMed] [Google Scholar]
- 20.Jayne DR, Gaskin G, Pusey CD, Lockwood CM. ANCA and predicting relapse in systemic vasculitis. QJM. 1995;88:127–133. [PubMed] [Google Scholar]
- 21.Karnell JL, et al. Mycophenolic acid differentially impacts B cell function depending on the stage of differentiation. J Immunol. 2011;187:3603–3612. doi: 10.4049/jimmunol.1003319. [DOI] [PMC free article] [PubMed] [Google Scholar]
- 22.Tarlinton D, Good-Jacobson K. Diversity among memory B cells: origin, consequences, and utility. Science. 2013;341:1205–1211. doi: 10.1126/science.1241146. [DOI] [PubMed] [Google Scholar]
- 23.Seifert M, Kuppers R. Human memory B cells. Leukemia. 2016;30:2283–2292. doi: 10.1038/leu.2016.226. [DOI] [PubMed] [Google Scholar]
- 24.Macallan DC, et al. B-cell kinetics in humans: rapid turnover of peripheral blood memory cells. Blood. 2005;105:3633–3640. doi: 10.1182/blood-2004-09-3740. [DOI] [PubMed] [Google Scholar]
- 25.Mei HE, et al. Steady-state generation of mucosal IgA+ plasmablasts is not abrogated by B-cell depletion therapy with rituximab. Blood. 2010;116:5181–5190. doi: 10.1182/blood-2010-01-266536. [DOI] [PubMed] [Google Scholar]
- 26.Anolik JH, et al. Delayed memory B cell recovery in peripheral blood and lymphoid tissue in systemic lupus erythematosus after B cell depletion therapy. Arthritis Rheum. 2007;56:3044–3056. doi: 10.1002/art.22810. [DOI] [PubMed] [Google Scholar]
- 27.Villalta D, et al. Anti-dsDNA antibody isotypes in systemic lupus erythematosus: IgA in addition to IgG anti-dsDNA help to identify glomerulonephritis and active disease. PLoS One. 2013;8:e71458. doi: 10.1371/journal.pone.0071458. [DOI] [PMC free article] [PubMed] [Google Scholar]
- 28.Bende RJ, et al. Identification of a novel stereotypic IGHV4->59/IGHJ5-encoded B-cell receptor subset expressed by various B-cell lymphomas with high affinity rheumatoid factor activity. Haematologica. 2016;101:e200–203. doi: 10.3324/haematol.2015.139626. [DOI] [PMC free article] [PubMed] [Google Scholar]
- 29.Manger BJ, et al. IgE-containing circulating immune complexes in Churg-Strauss vasculitis. Scand J Immunol. 1985;21:369–373. doi: 10.1111/j.1365-3083.1985.tb01443.x. [DOI] [PubMed] [Google Scholar]
- 30.Galeone M, Colucci R, D'Erme AM, Moretti S, Lotti T. Potential Infectious Etiology of Behcet's Disease. Patholog Res Int. 2012;2012 doi: 10.1155/2012/595380. 595380. [DOI] [PMC free article] [PubMed] [Google Scholar]
- 31.Stone JH, et al. A disease-specific activity index for Wegener's granulomatosis: modification of the Birmingham Vasculitis Activity Score. International Network for the Study of the Systemic Vasculitides (INSSYS) Arthritis Rheum. 2001;44:912–920. doi: 10.1002/1529-0131(200104)44:4<912::AID-ANR148>3.0.CO;2-5. [DOI] [PubMed] [Google Scholar]
- 32.Tan EM, et al. The 1982 revised criteria for the classification of systemic lupus erythematosus. Arthritis Rheum. 1982;25:1271–1277. doi: 10.1002/art.1780251101. [DOI] [PubMed] [Google Scholar]
- 33.Silverberg MS, et al. Toward an integrated clinical, molecular and serological classification of inflammatory bowel disease: report of a Working Party of the 2005 Montreal World Congress of Gastroenterology. Can J Gastroenterol. 2005;19(Suppl A):5A–36A. doi: 10.1155/2005/269076. [DOI] [PubMed] [Google Scholar]
- 34.Mills J, et al. The American College of Rheumatology 1990 criteria for the classification of Henoch-Schonlein purpura. Arthritis Rheum. 1990;33:1114–1121. doi: 10.1002/art.1780330809. [DOI] [PubMed] [Google Scholar]
- 35.Jennette JC, et al. 2012 revised International Chapel Hill Consensus Conference Nomenclature of Vasculitides. Arthritis Rheum. 2013;65:1–11. doi: 10.1002/art.37715. [DOI] [PubMed] [Google Scholar]
- 36.Lyons PA, et al. Microarray analysis of human leucocyte subsets: the advantages of positive selection and rapid purification. BMC Genomics. 2007;8:64. doi: 10.1186/1471-2164-8-64. [DOI] [PMC free article] [PubMed] [Google Scholar]
- 37.Espeli M, et al. FcgammaRIIb differentially regulates pre-immune and germinal center B cell tolerance in mouse and human. Nat Commun. 2019;10 doi: 10.1038/s41467-019-09434-0. 1970. [DOI] [PMC free article] [PubMed] [Google Scholar]
- 38.Watson SJ, et al. Viral population analysis and minority-variant detection using short read next-generation sequencing. Philos Trans R Soc Lond B Biol Sci. 2013;368 doi: 10.1098/rstb.2012.0205. 20120205. [DOI] [PMC free article] [PubMed] [Google Scholar]
- 39.Lefranc MP. IMGT unique numbering for the variable (V), constant (C), and groove (G) domains of IG, TR, MH, IgSF, and MhSF. Cold Spring Harb Protoc. 2011;2011:633–642. doi: 10.1101/pdb.ip85. [DOI] [PubMed] [Google Scholar]
- 40.Altschul SF, Gish W, Miller W, Myers EW, Lipman DJ. Basic local alignment search tool. J Mol Biol. 1990;215:403–410. doi: 10.1016/S0022-2836(05)80360-2. [DOI] [PubMed] [Google Scholar]
- 41.Davydov AN, et al. Comparative Analysis of B-Cell Receptor Repertoires Induced by Live Yellow Fever Vaccine in Young and Middle-Age Donors. Front Immunol. 2018;9:2309. doi: 10.3389/fimmu.2018.02309. [DOI] [PMC free article] [PubMed] [Google Scholar]
- 42.Marioni RE, et al. Genetic Stratification to Identify Risk Groups for Alzheimer's Disease. J Alzheimers Dis. 2017;57:275–283. doi: 10.3233/JAD-161070. [DOI] [PMC free article] [PubMed] [Google Scholar]
- 43.Ellis JA, Panagiotopoulos S, Akdeniz A, Jerums G, Harrap SB. Androgenic correlates of genetic variation in the gene encoding 5alpha-reductase type 1. J Hum Genet. 2005;50:534–537. doi: 10.1007/s10038-005-0289-x. [DOI] [PubMed] [Google Scholar]
- 44.Giudicelli V, Chaume D, Lefranc MP. IMGT/V-QUEST, an integrated software program for immunoglobulin and T cell receptor V-J and V-D-J rearrangement analysis. Nucleic Acids Res. 2004;32:W435–440. doi: 10.1093/nar/gkh412. [DOI] [PMC free article] [PubMed] [Google Scholar]
- 45.Bashford-Rogers RJ, et al. Eye on the B-ALL: B-cell receptor repertoires reveal persistence of numerous B-lymphoblastic leukemia subclones from diagnosis to relapse. Leukemia. 2016;30:2312–2321. doi: 10.1038/leu.2016.142. [DOI] [PMC free article] [PubMed] [Google Scholar]
- 46.Bashford-Rogers RJM, et al. Eye on the B-ALL: B-cell receptor repertoires reveal persistence of numerous B-lymphoblastic leukemia subclones from diagnosis to relapse. Leukemia. 2016 doi: 10.1038/leu.2016.142. [DOI] [PMC free article] [PubMed] [Google Scholar]
- 47.Katoh K, Standley DM. MAFFT multiple sequence alignment software version 7: improvements in performance and usability. Molecular biology and evolution. 2013;30:772–780. doi: 10.1093/molbev/mst010. [DOI] [PMC free article] [PubMed] [Google Scholar]
- 48.Wilgenbusch JC, Swofford D. Inferring evolutionary trees with PAUP*. Current protocols in bioinformatics / editoral board, Andreas D. Baxevanis … [et al.] 2003;Chapter 6 doi: 10.1002/0471250953.bi0604s00. Unit 6 4. [DOI] [PubMed] [Google Scholar]
Associated Data
This section collects any data citations, data availability statements, or supplementary materials included in this article.


