
Figure 2.
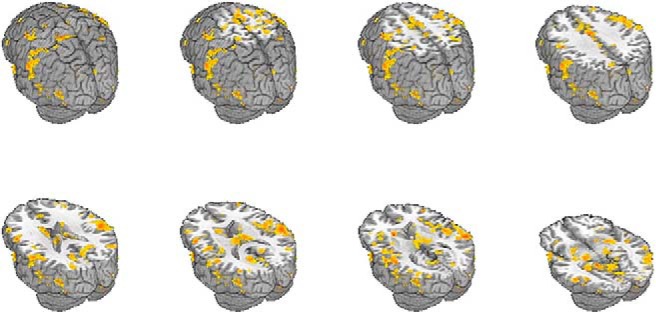
Regions showing significant change in hippocampal FC following PPC rTMS from the current study (FDR corrected, q = 0.05).
Official websites use .gov
A
.gov website belongs to an official
government organization in the United States.
Secure .gov websites use HTTPS
A lock (
) or https:// means you've safely
connected to the .gov website. Share sensitive
information only on official, secure websites.
Regions showing significant change in hippocampal FC following PPC rTMS from the current study (FDR corrected, q = 0.05).